Article

Charge Ordering Transitions of the New Organic Conductors δm- and δo-(BEDT-TTF)2TaF6

1
Department of Materials Science and Engineering, Tokyo Institute of Technology, Tokyo 152-8552, Japan
2
Department of Organic and Polymeric Materials, Tokyo Institute of Technology, Tokyo 152-8552, Japan
3
ACT-C JST, Honcho, Kawaguchi, Saitama 332-0012, Japan
4
Condensed Matter Research Center and Photon Factory, Institute of Materials Structure Science, High Energy Accelerator Research Organization (KEK), Tsukuba, Ibaraki 305-0801, Japan
*
Author to whom correspondence should be addressed.
Magnetochemistry 2017, 3(1), 14; https://doi.org/10.3390/magnetochemistry3010014
Submission received: 13 January 2017 / Revised: 20 February 2017 / Accepted: 22 February 2017 / Published: 1 March 2017
(This article belongs to the Special Issue Magnetism of Molecular Conductors)

Abstract

:
Structural, transport, and magnetic properties of new organic conductors composed of (BEDT-TTF) 2 TaF 6 , where BEDT-TTF is bis(ethylenedithio)tetrathiafulvalene, have been investigated. Two δ -type polymorphs, monoclinic and orthorhombic phases are obtained by the electrocrystallization. Both phases show a semiconductor-insulator phase transition at 276 K and 300 K for the monoclinic and orthorhombic phases, respectively; the ground state of both salts is a nonmagnetic insulating state. The low-temperature X-ray diffraction measurements show two-fold superlattice reflections in the intercolumnar direction. The low-temperature crystal structures show a clear charge ordered state, which is demonstrated by the molecular shape and intramolecular bond lengths. The observed checkerboard charge ordered state is in agreement with the charge ordering in a dimer Mott insulator. If we distinguish between the monoclinic and orthorhombic phases, the transition temperature of the δ -type (BEDT-TTF) 2 M F 6 conductors ( M = P, As, Sb, and Ta) increases continuously with increasing the anion volume.

1. Introduction

Among molecular conductors, bis(ethylenedithio)tetrathiafulvalene (BEDT-TTF) salts with octahedral anions, so-called β -(BEDT-TTF) 2 PF 6 type salts, have a unique arrangement of the donor molecules with a twisted stacking structure (Figure 1) [1,2,3]. This molecular arrangement is categorized into the δ type; the donor column consists of alternate stacking of two interaction modes: the twisted stacking mode ( a 1 in Figure 1c) and the parallel stacking mode ( a 2 ) slipped along the molecular short axis (ring-over-atom mode) [3]. The highly conducting direction is not the donor stacking direction but the intercolumnar direction [1]. After the discovery of the PF 6 salt, several δ -type BEDT-TTF salts with octahedral anions have been developed. The crystal system, however, differs between the PF 6 (orthorhombic) and SbF 6 (monoclinic) salts despite the same anion shape [4]. The AsF 6 salt has been known as a monoclinic compound, but later the orthorhombic crystal has been found [4,5,6,7].
The PF 6 salt has been investigated using X-ray diffraction and Raman spectra; the phase transition at around room temperature is not a 2 k F charge-density-wave but a charge order [8,9]. The charge ordering transition is due to the nearest neighbor Coulomb repulsion V [10,11,12]. The orthorhombic AsF 6 salt also shows a similar charge order to that of the PF 6 salt [8]. The charge order has been observed in both the monoclinic AsF 6 and SbF 6 salts using Raman spectra [13]. Although many investigations of the δ -type BEDT-TTF salts with octahedral anions have been carried out, the charge ordering transition temperature does not seem to change in the sequence of the anion volume.
In order to clarify the relationship between the transition temperature and the anion volume, the TaF 6 salt is prepared; TaF 6 is the largest anion among MF 6 anions ( M = P, As, Sb, and Ta) [14]. In the present paper, we report two δ -type polymorphs of the TaF 6 salts, monoclinic ( δ m ) and orthorhombic ( δ o ) phases. Although both salts show a charge ordering transition, the transition temperature of the orthorhombic phase is higher than that of the monoclinic phase. If we distinguish between the monoclinic and orthorhombic phases in the δ -type (BEDT-TTF) 2 M F 6 conductors, the transition temperature increases with increasing the anion volume; this indicates that the chemical pressure affects the charge ordering transition temperature.

2. Results

The crystallographic data of both δ m - and δ o -(BEDT-TTF) 2 TaF 6 at 298 K are shown in Table 1. For the monoclinic δ m phase, we choose the space group C 2 / c . Although unusual space group I 2 / c has been used in the SbF 6 salt [4], the unit cell transformation a = a c gives the monoclinic angle β = 93.99 ( 4 ) and the reported lattice. In the AsF 6 salt, another unit cell transformation gives the reported A 2 / a lattice [5]. The orthorhombic δ o -TaF 6 salt and the PF 6 salt are isostructural, and the space group is P n n a . The unit cell volume of the monoclinic phase is slightly larger than that of the orthorhombic phase.
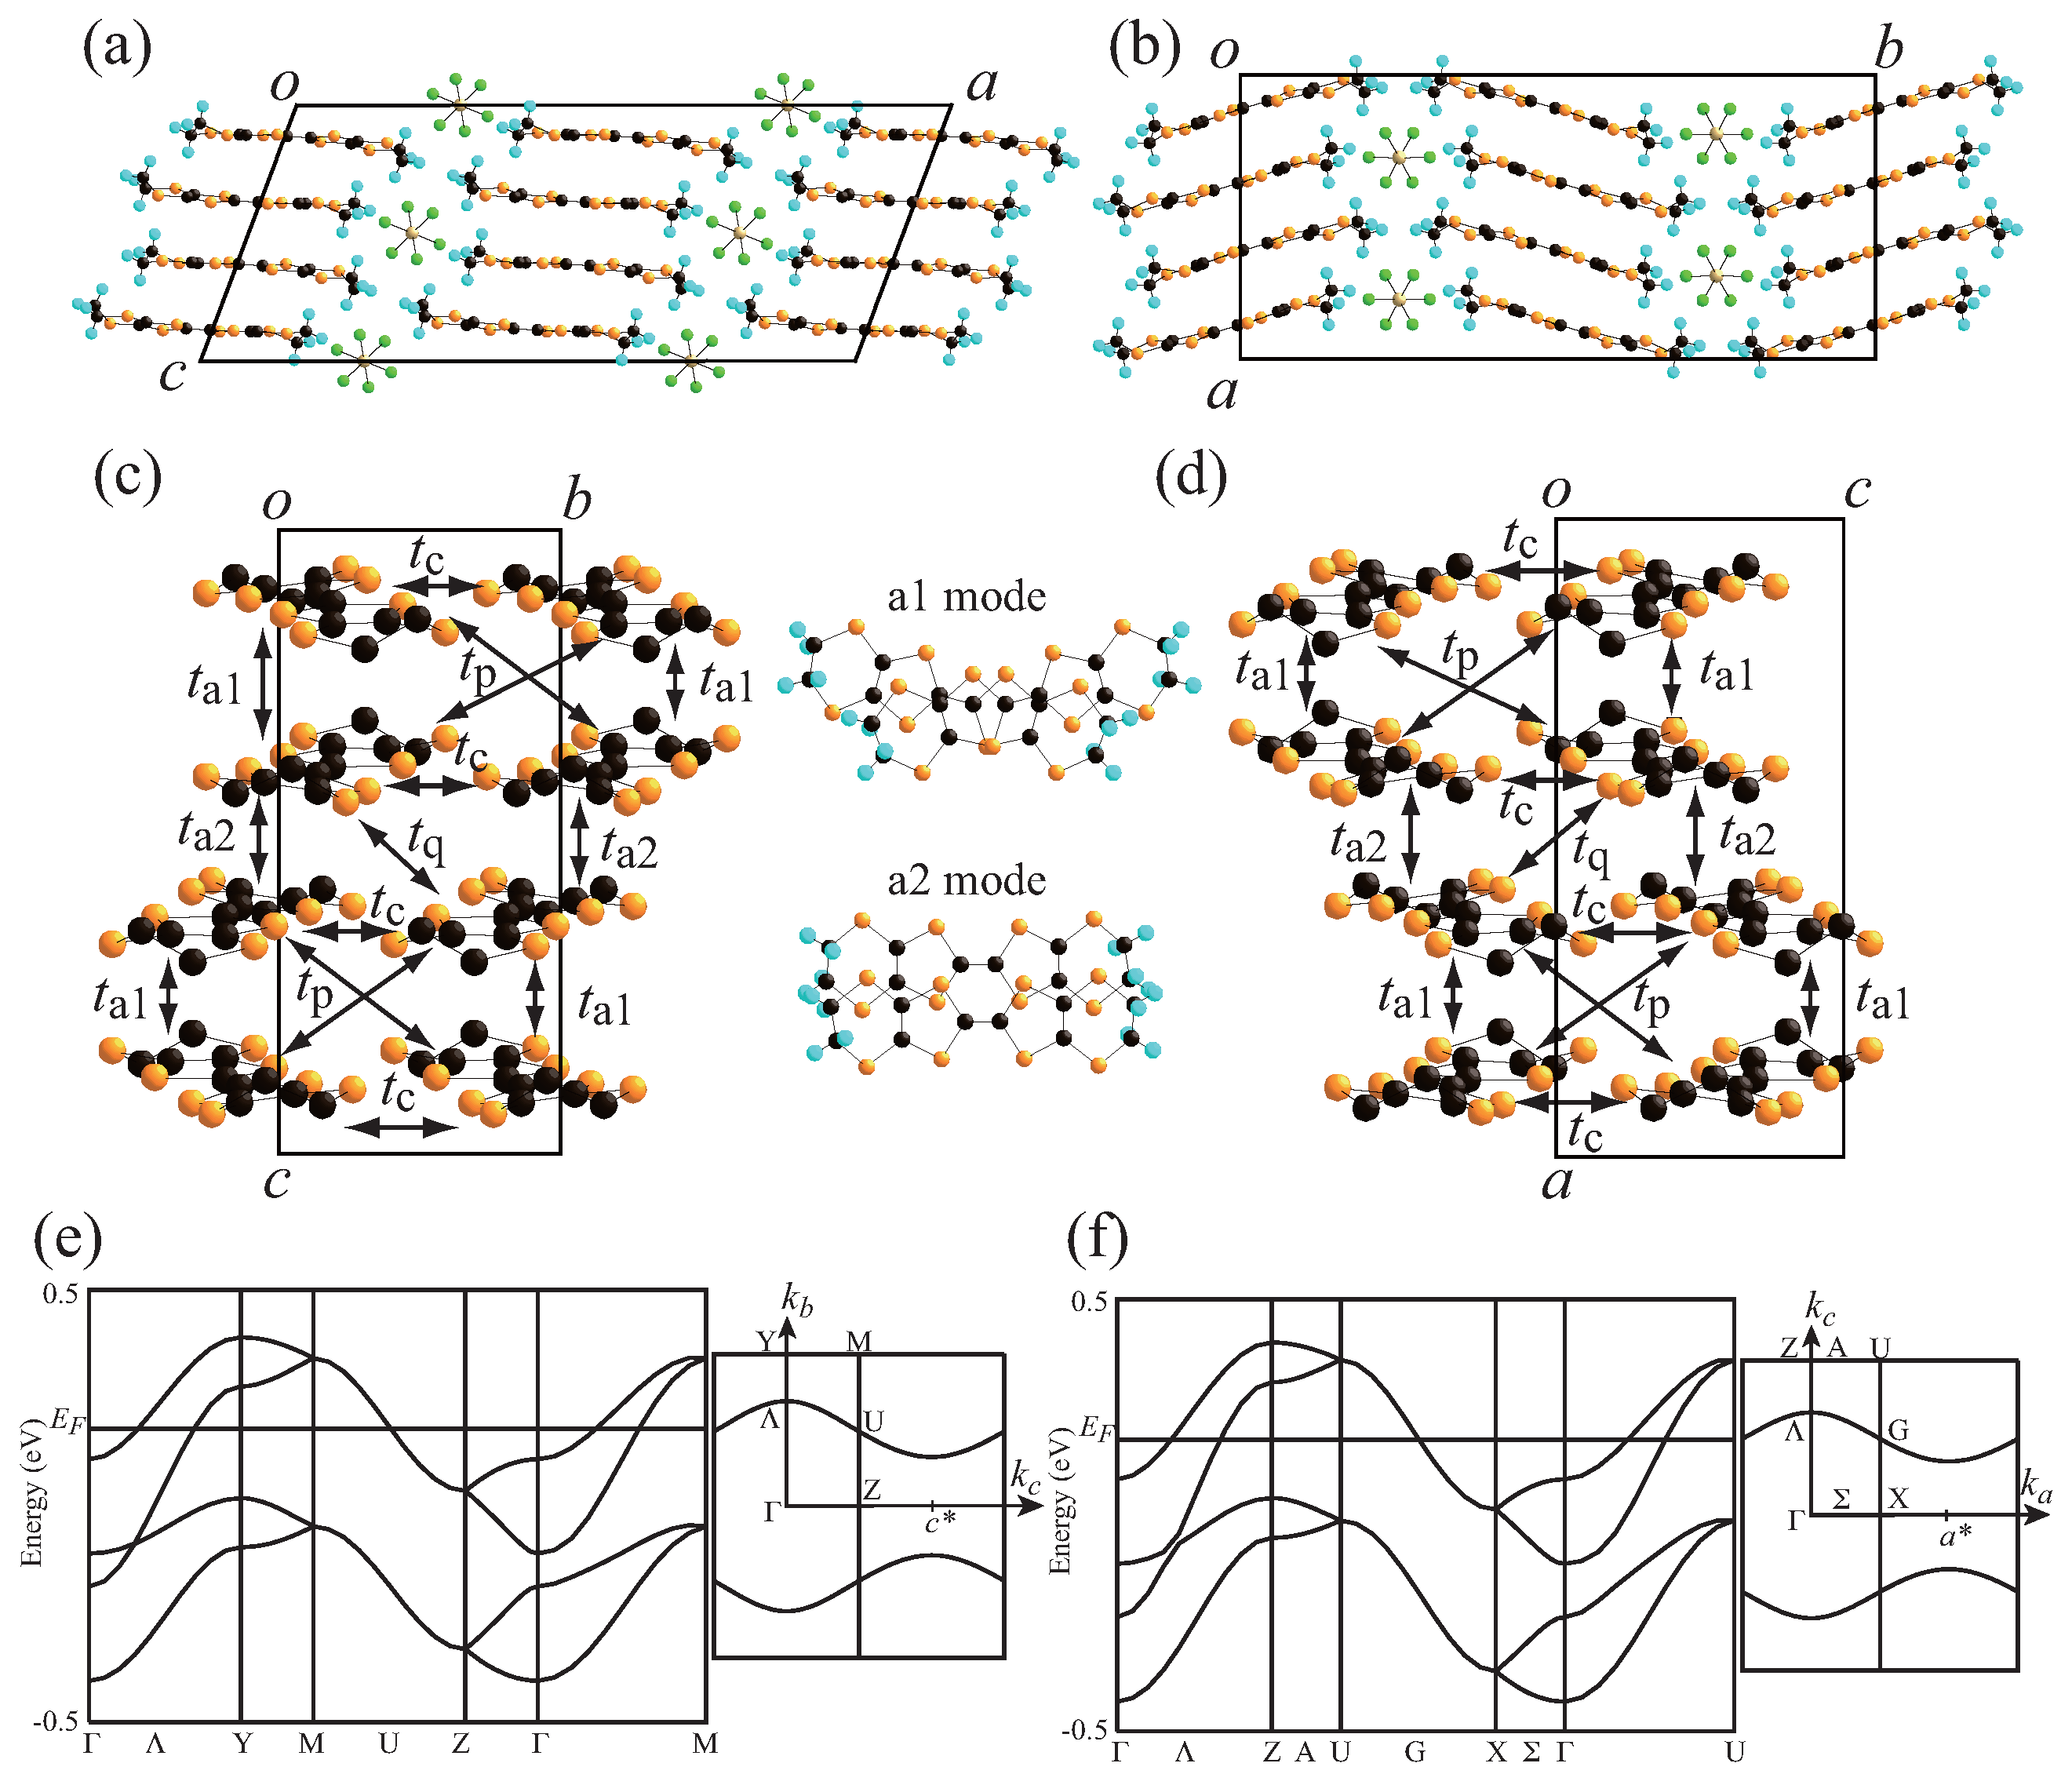
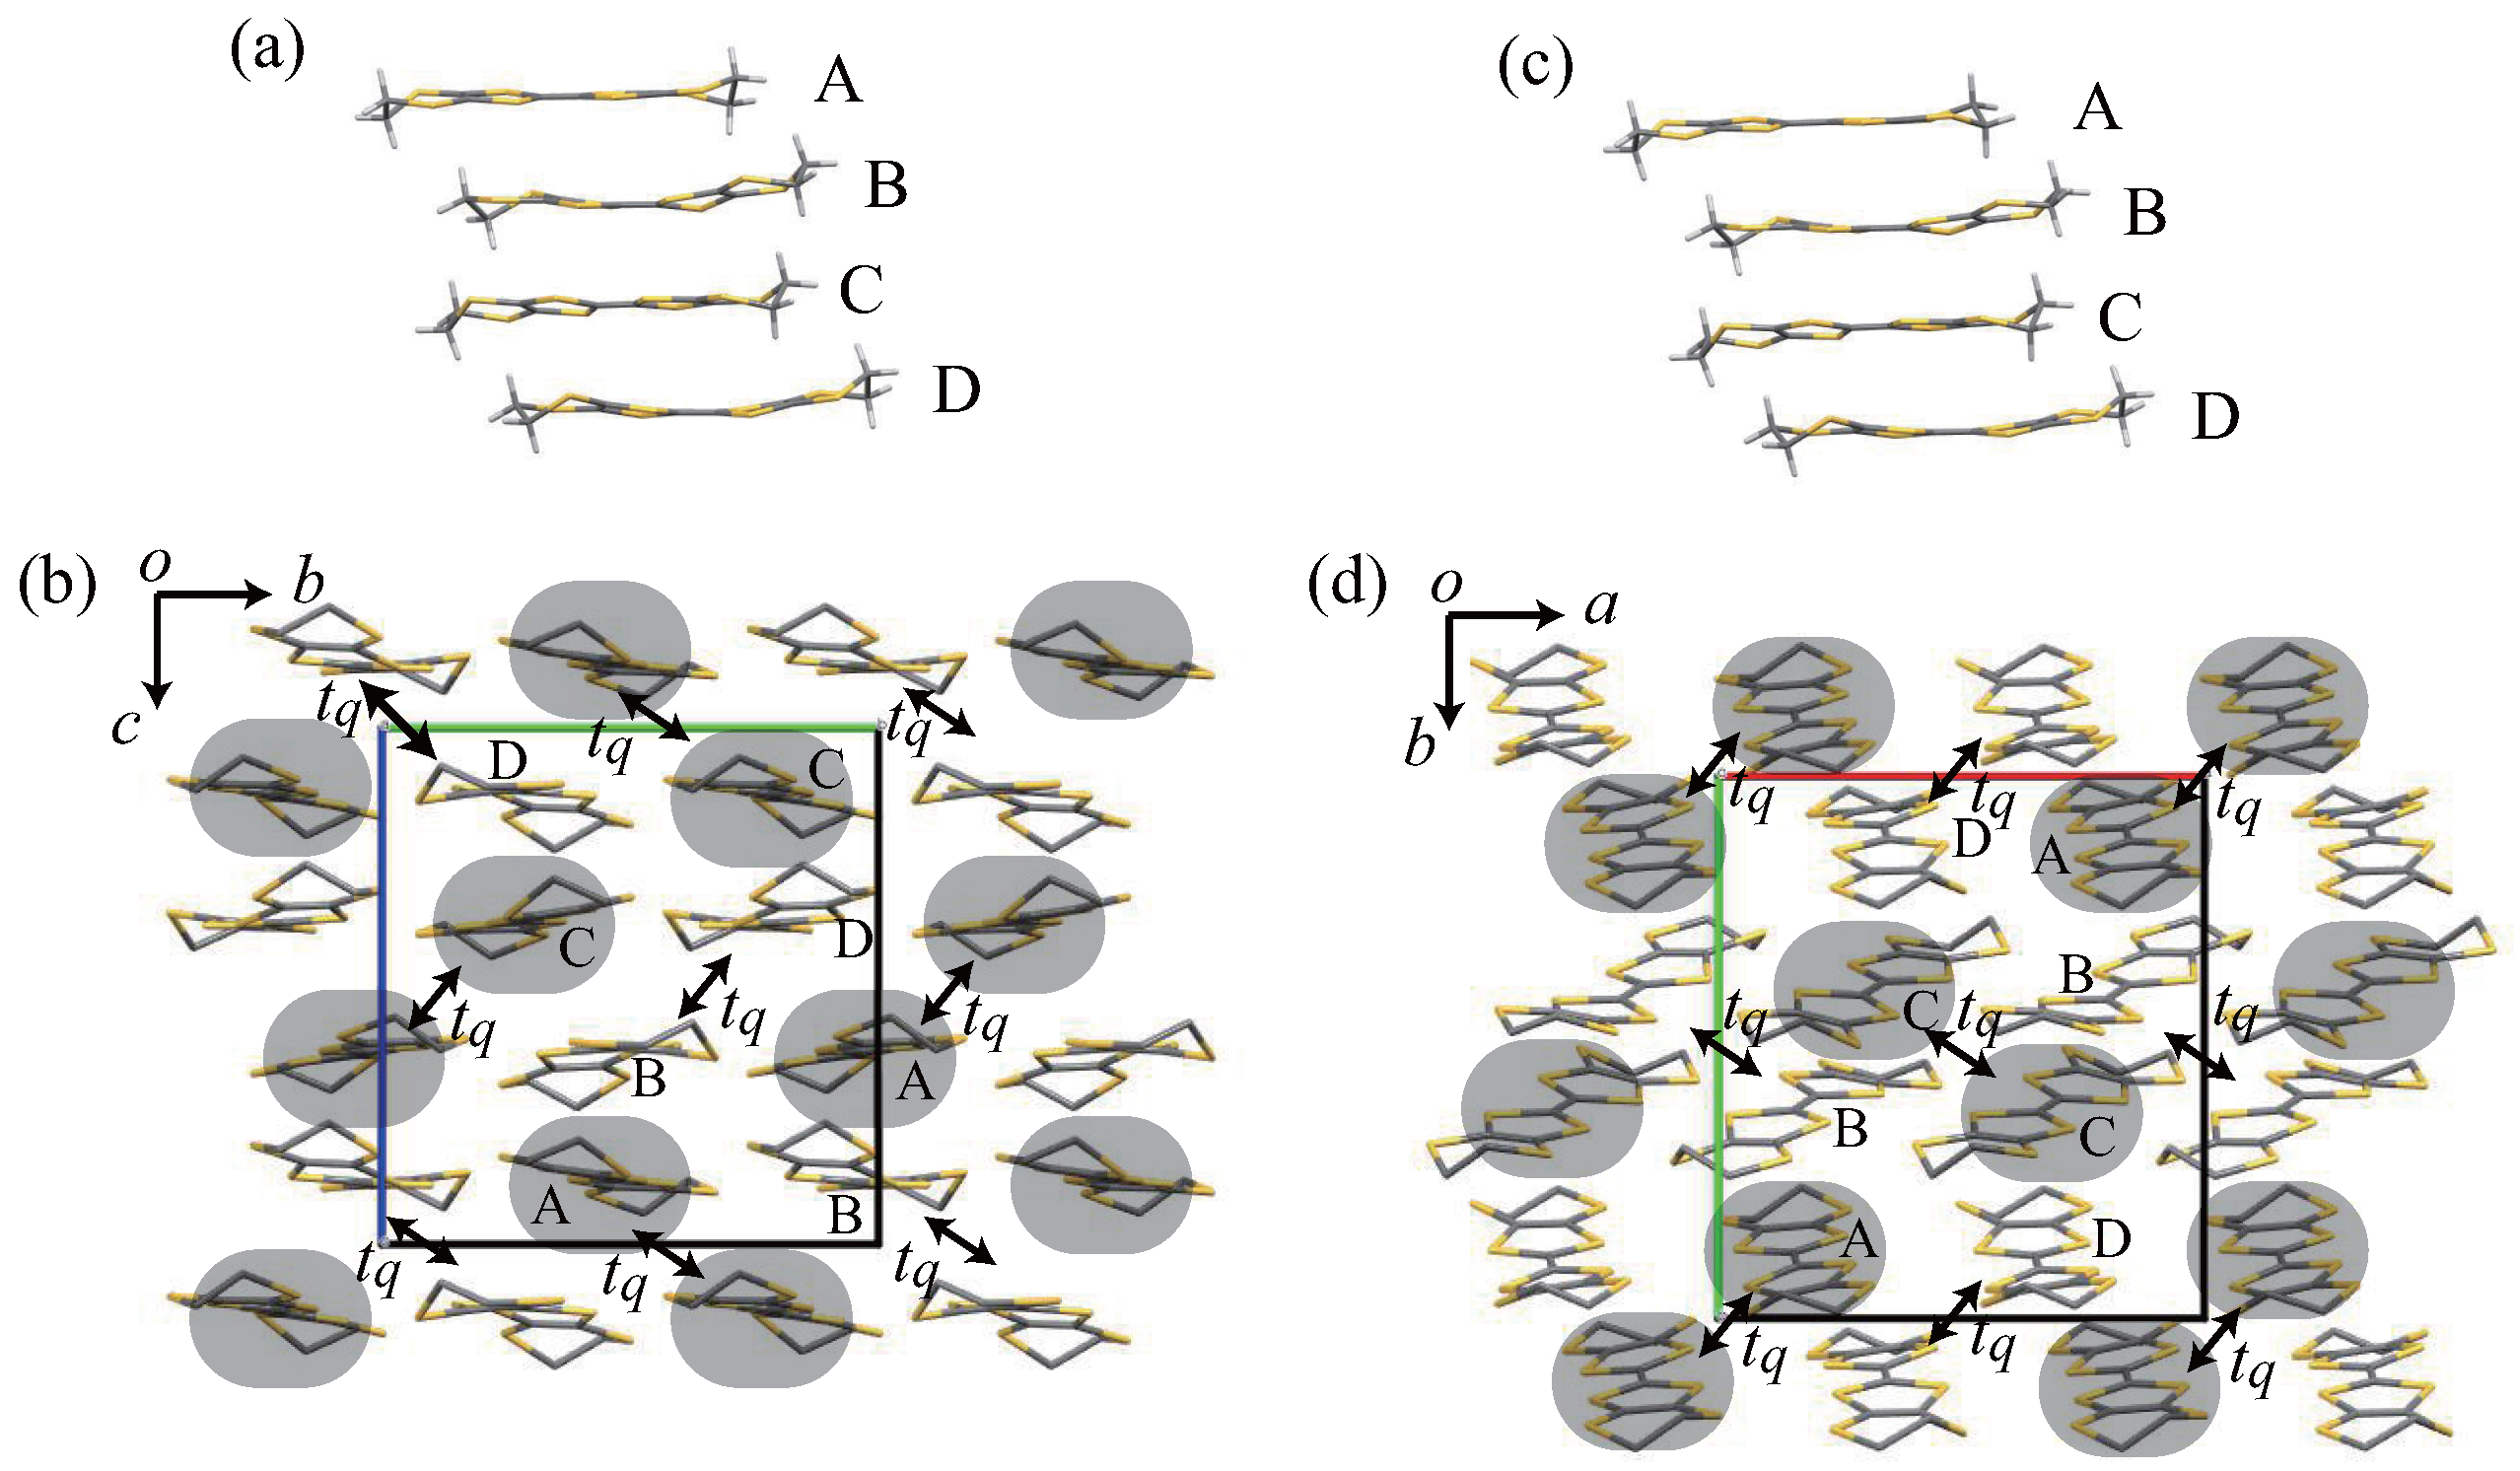
Figure 1a–d show the crystal structure of the TaF 6 salts. These two phases take similar δ -type structures. For the monoclinic phase, the BEDT-TTF molecular planes of the adjacent conducting layers along the a-axis are almost parallel to each other (Figure 1a). In the orthorhombic phase, however, donor planes are inclined alternately along the interlayer direction (Figure 1b). There is one crystallographically independent donor and a half anion, and a unit cell contains eight donors and four anions, affording the donor to anion ratio 2:1. The terminal donor ethylene-groups are disordered. The donors form a stack along the c-axis for the δ m phase (a-axis for the δ o phase) with the twisted mode a 1 and the ring-over-atom mode a 2 . For the a 1 mode, the interplanar distance is d = 3.58 Å and the twist angle is ω = 29.9 in the δ m phase, and d = 3.57 Å and ω = 29.9 in the δ o phase. For the a 2 mode, the slip distance along the molecular short axis is d s = 2.00 Å, and d = 3.67 Å in the δ m phase. These values are d s = 2.02 Å and d = 3.67 Å in the δ o phase.
An anion is located on an inversion center for the δ m phase. In the δ o phase, an anion is on a two-fold rotation axis parallel to the a-axis, and fluorine atoms are on general positions. The arrangement of anions is an isosceles triangle on an anion layer parallel to the b c -plane ( a c -plane) in the δ m ( δ o ) phase. An interaction between the donor hydrogen and anion fluorine atoms shorter than the sum of the van der Waals radii ( 2.67 Å) [15], a so-called hydrogen bond, is found. Although both terminal ethylene groups of the donor have hydrogen bonds in the δ o phase, one side terminal of the donor has a hydrogen bond in the δ m phase. This is due to the difference of the unit cell volumes because the unit cell of the δ o phase is smaller than that of the δ m phase.
The calculated transfer integrals, the distance between the molecular centers R, and the twist angles ω are shown in Table 2. All interaction modes (c, a 1 , a 2 , p, and q) are the same as those of β -(BEDT-TTF) 2 PF 6 [2,3]. The transfer integral of the twisted interaction mode t a 1 is larger than that of the ring-over-atom mode t a 2 ; this twisted dimer structure is characteristic of this structure. The transverse interactions are large, and t q is larger than t a 1 . The energy band structure and Fermi surface are shown in Figure 1e,f. The quasi-one-dimensional Fermi surface is shown in an extended zone scheme because the energy bands degenerate at the zone boundary owing to the crystallographic symmetries.
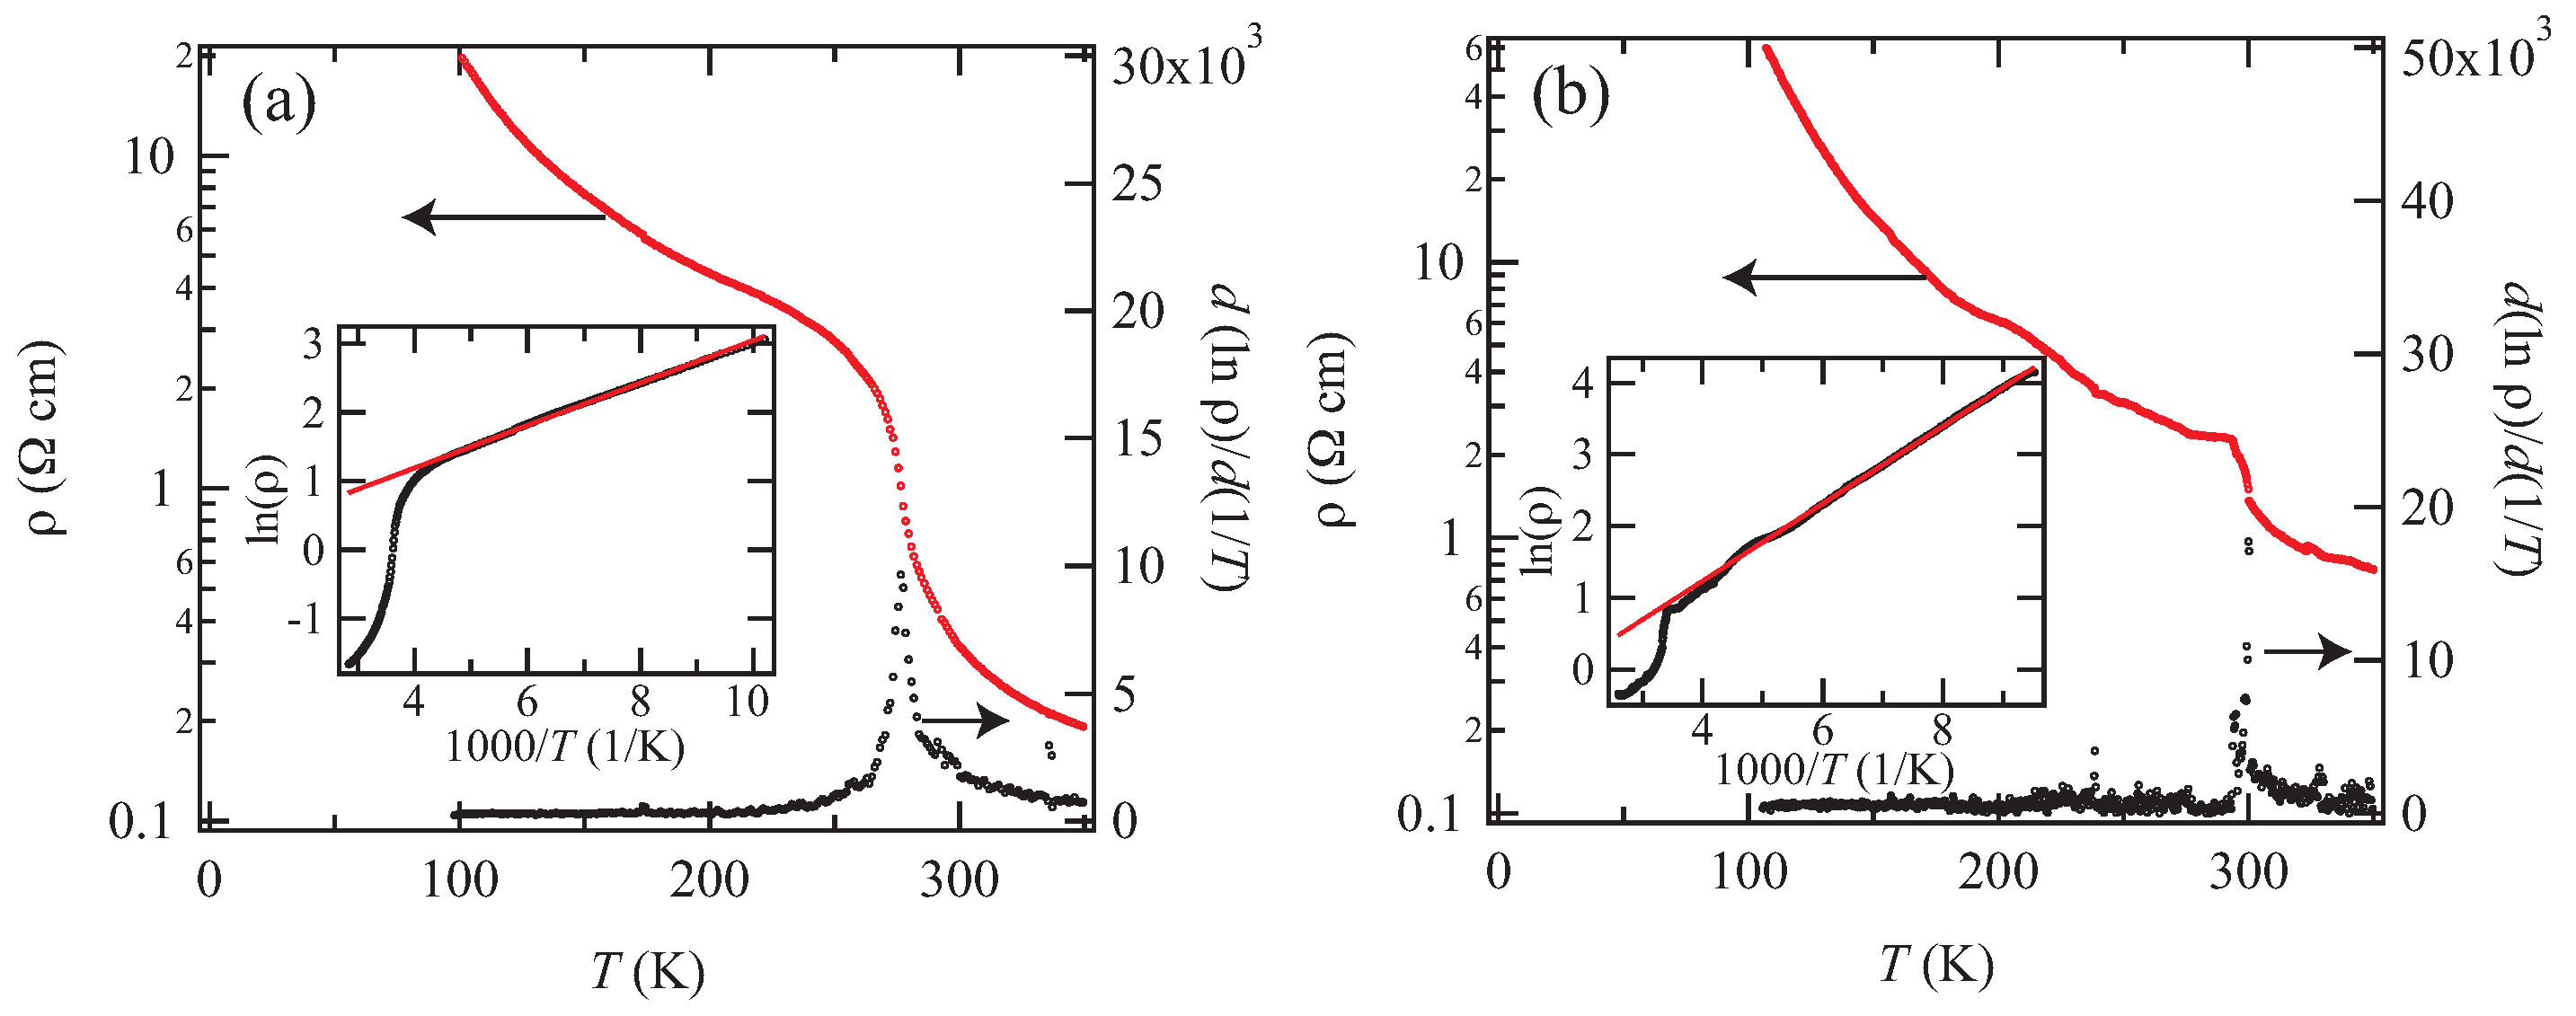
Figure 2 shows the temperature dependence of the electrical resistivity. Both salts exhibit semiconducting behavior in the measurement temperature region, and show anomaly at approximately 300 K. The phase transition temperature T c is determined from the peak of d ( ln ρ ) / d ( 1 / T ) at T c = 276 K and T c = 300 K for the δ m and δ o phases, respectively. As shown in the inset of Figure 2, the charge activation energy Δ charge is estimated as 27 and 46 meV for the δ m and δ o phases, respectively.
The Seebeck coefficient of the δ m phase shows metallic behavior around 300 K, and has anomaly at approximately 280 K (Figure 3). For the δ o phase, the thermopower shows semiconducting behavior even in the high temperature region and has no anomaly at 300 K where the resistivity has an anomaly. The value of the thermopowers around 300 K is approximately 52 μ V/K. This large value is not in agreement with the energy band structure, indicating a strongly correlated electronic system [1,2,16,17].
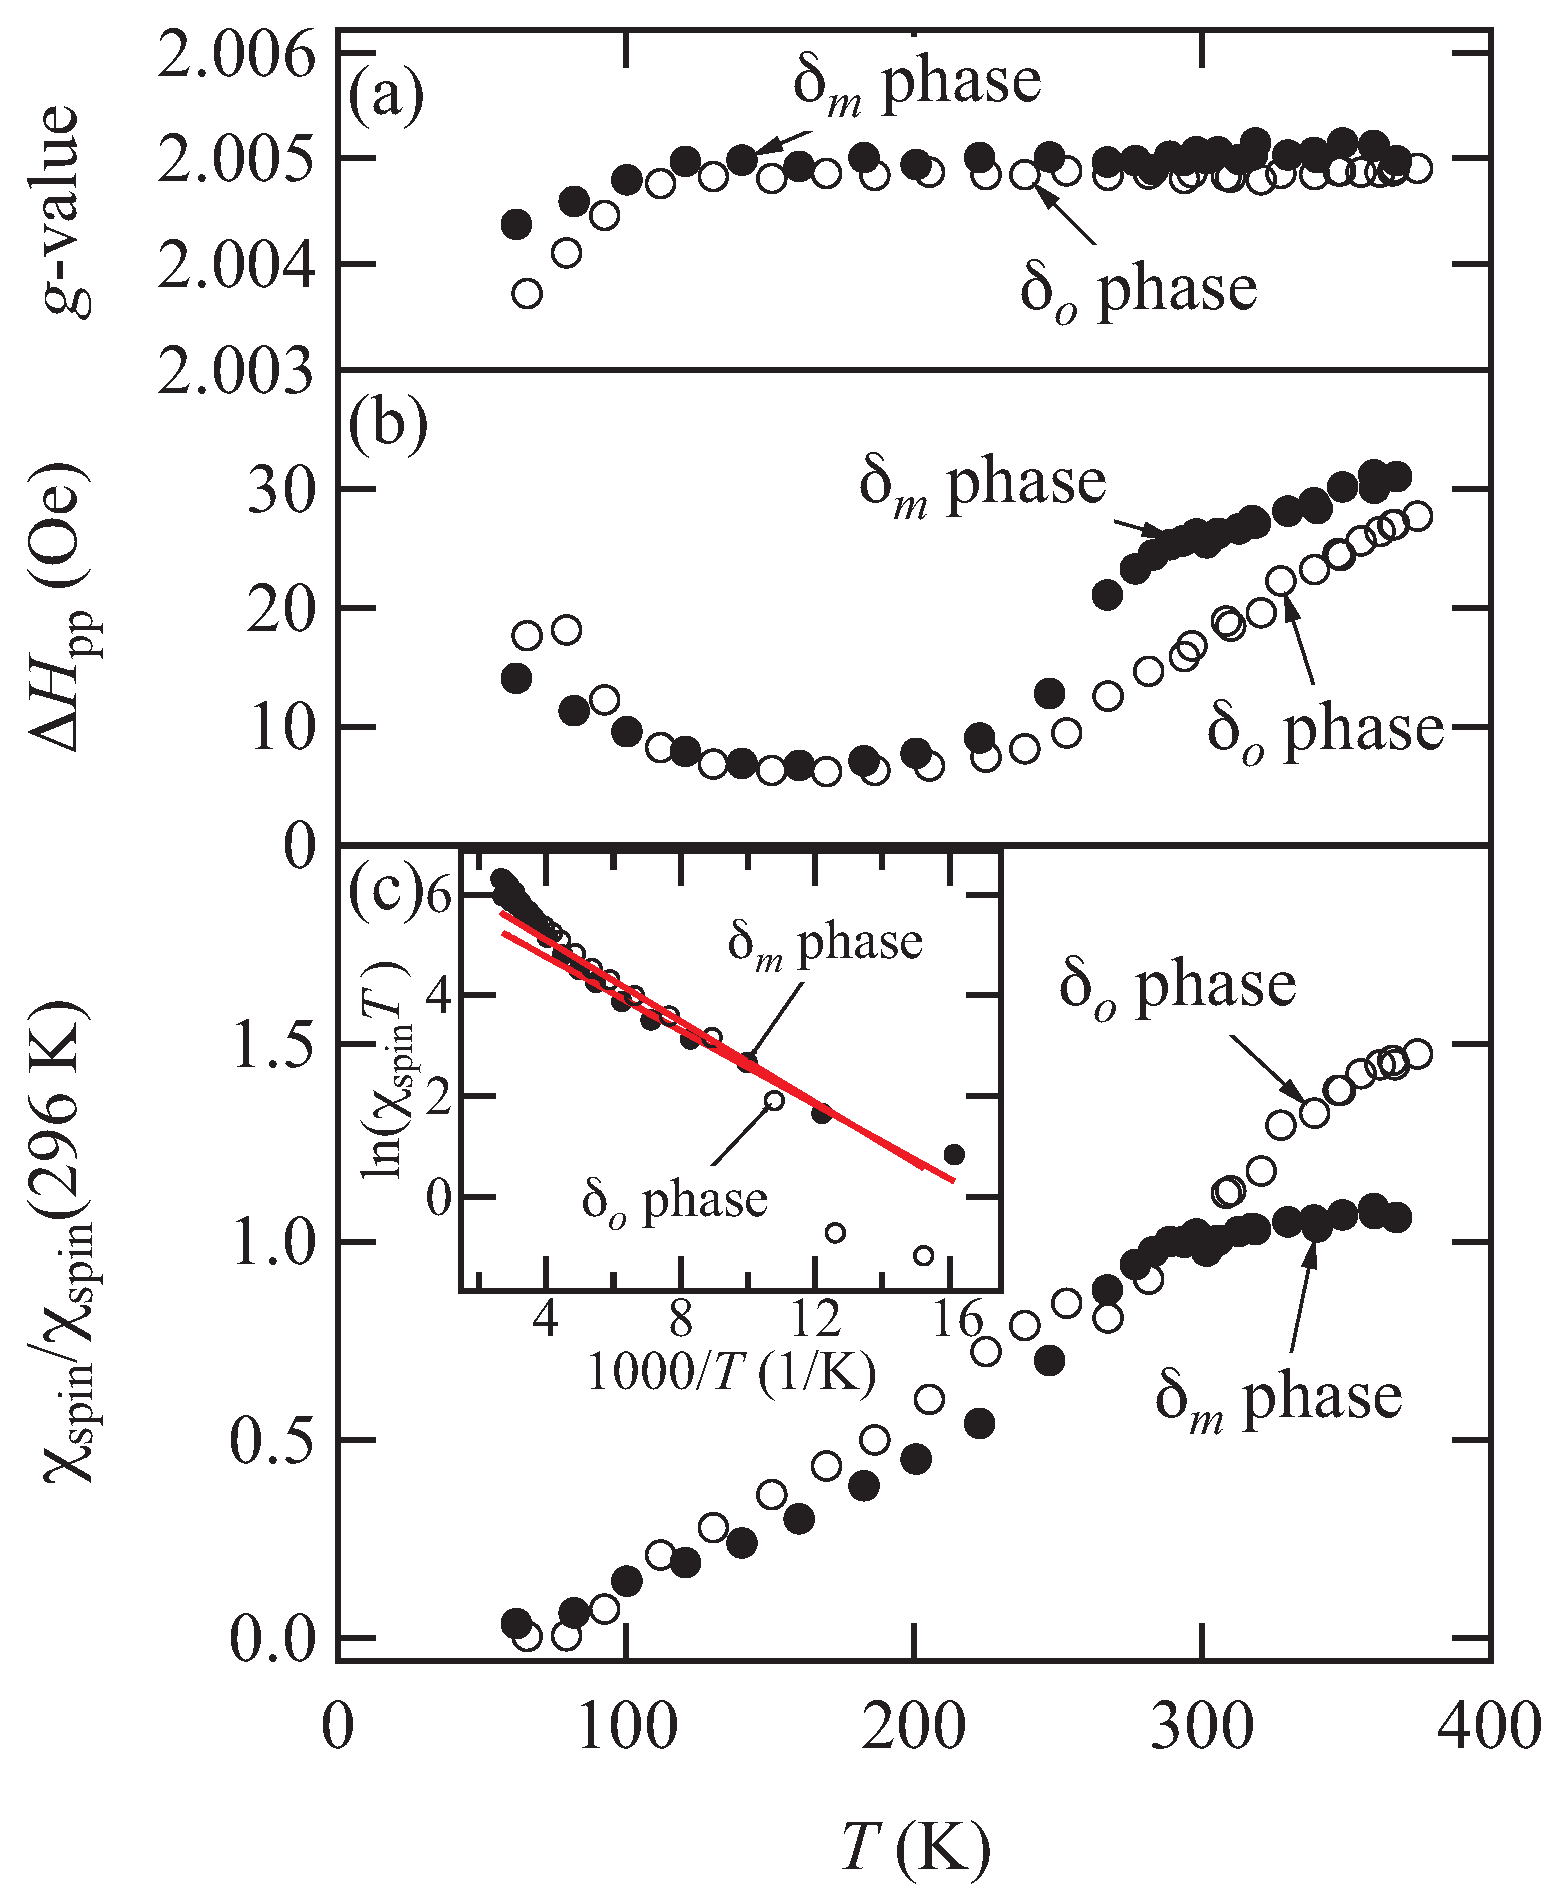
Figure 4 shows the temperature dependence of the electron spin resonance (ESR) g-values, peak-to-peak linewidths, and the normalized spin susceptibilities measured under the magnetic field perpendicular to the conducting layers. A single Lorentzian lineshape is observed for both phases. The spin susceptibility of the δ m phase clearly decreases below 280 K without a divergent increase of the linewidth, leading to a spin singlet state. The spin susceptibility of the δ o phase gradually decreases with decreasing temperature, and the spin singlet state appears at low temperatures. However, the phase transition temperature is not clear. The g-values are almost independent of the temperature around the phase transition temperature. The spin activation energy Δ spin is estimated from the simple singlet–triplet model given by χ spin ( 1 / T ) exp ( Δ spin / T ) in the 100–200 K range. The spin activation energy Δ spin is about 30 meV. Δ spin is in rough agreement with Δ charge estimated from the electrical resistivity.
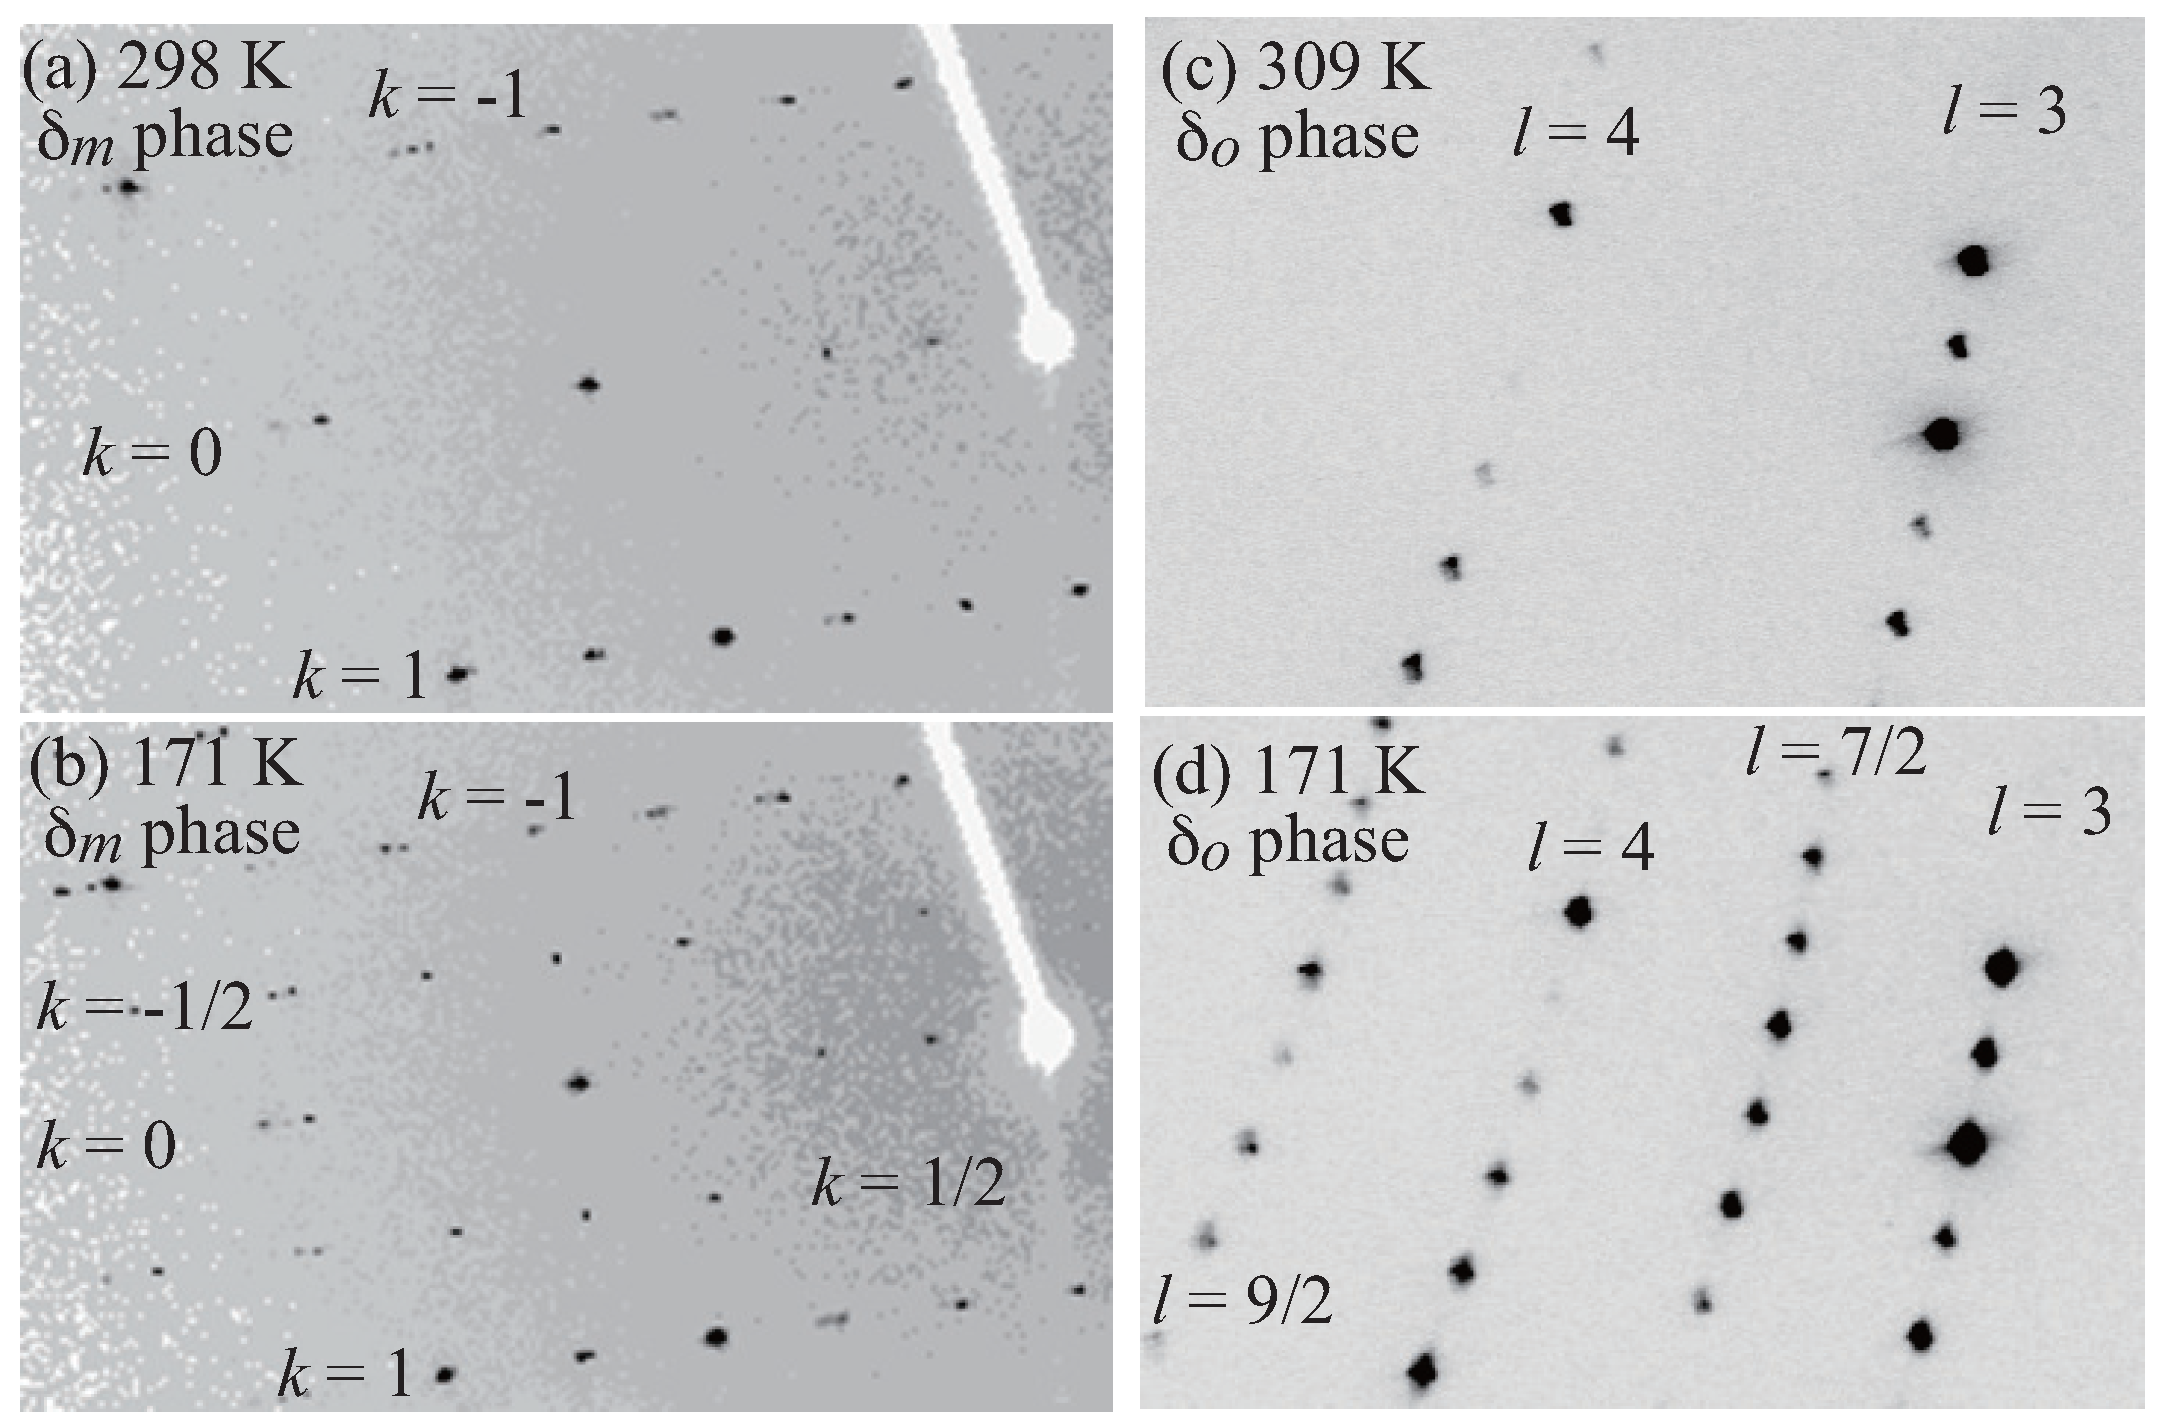
In order to clarify the origin of the phase transition, the low-temperature X-ray diffraction measurements were performed. Figure 5 shows the X-ray oscillation photographs of both δ m and δ o phases. At 171 K, superlattice reflections with the wave vector q m = ( 0 , 1 / 2 , 0 ) are observed for the δ m phase (Figure 5a,b). Although the superlattice reflections are observed at 171 K for the δ o phase, the wave vector is q o = ( 0 , 1 / 2 , 1 / 2 ) (Figure 5c,d). 
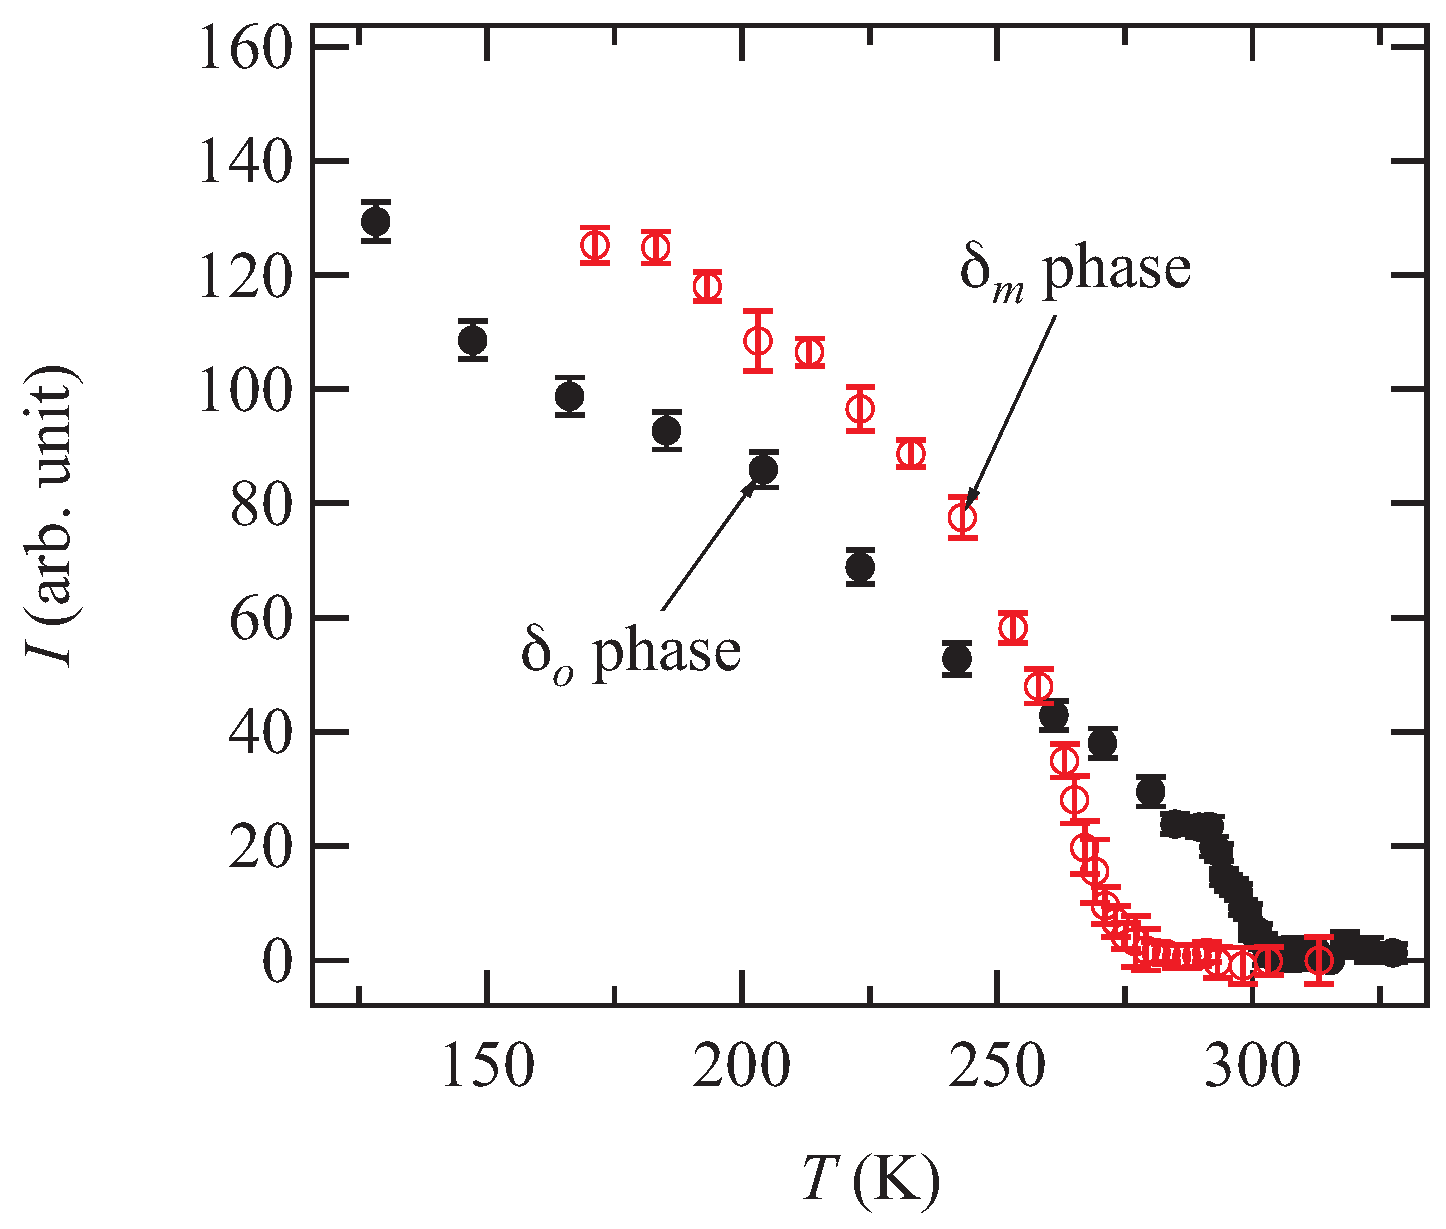
Figure 6 shows the temperature dependence of the integrated intensity of the superlattice reflections. The superlattice reflection disappears at 277 K and 302 K for the δ m and δ o phases, respectively. These results indicate that the temperatures at which the resistivity shows anomaly are the phase transition temperatures.
Figure 7a,b show the crystal structure of the δ m phase at 171 K. The C-centered unit cell changes to a primitive cell with the space group P 2 1 / n as shown in Table 1, which is a sub-group of C 2 / c ; the superlattice unit cell is a = a , b = 2 b , and c = c because superlattice reflections with h + k 2 n appear for h k l , where n is an integer. Some reflections with h + l 2 n are observed in h 0 l reflections. However, in order to analyze the low-temperature average structure, we have chosen P 2 1 / n , because a centrosymmetric space group has been suggested by SHELXT; the program SHELXT proposes possible space groups on the basis of phases in the space group P 1 without using systematic absences [18]. In the present space group, there are four crystallographic independent molecules along the stacking direction (Figure 7a). The molecules in the nearest neighbor columns in the conducting sheet is connected by a two-fold screw axis; this indicates that the charge ordering pattern is not related by the glide symmetry. Moreover, in the case of P 2 1 , the maximum shift/error for the parameter refinement does not converge, and the atomic coordinates of four additional independent molecules are connected by the inversion symmetry operation. Although the existence of the inversion center is important for electronic polarity, we do not treat this problem further in the present work.
Figure 7c,d show the crystal structure of the δ o phase at 39 K. Some reflections with l 2 n for h 0 l are observed. However, we have chosen P 2 / c as suggested by SHELXT owing to the same reason as the δ m phase (Table 1). This space group is a sub-group of P n n a , where the superlattice is given by a = 2 c , b = a , and c = c b on the basis of the superlattice wave vector q o = ( 0 , 1 / 2 , 1 / 2 ) . The n-glide in the original cell corresponds to the c-glide in the new unit cell. In the δ o phase, molecules in the nearest neighbor column in the conducting sheet are related by the inversion symmetry. If the space group has no inversion center ( P 2 ), the nearest neighbor column is composed of four other independent molecules. However, in the case of P 2 , the analysis does not converge similarly to P 2 1 in the δ m phase.
A terminal ethylene group at one side is disordered except for the D molecule in the δ m phase. The A and C molecules are disordered in the δ o phase. The completely ordered structure has been observed in the PF 6 and δ o -AsF 6 salts. However, this conformational ordering depends on the cooling speed [8]. The cooling speed approximately 1–3 K/min is too fast to attain a completely ordered structure. Although A and C molecules are flat, B and D molecules are bent for both δ m and δ o phases (Figure 7a,c); the bent TTF skeleton is characteristic of the neutral BEDT-TTF molecule [19]. The BEDT-TTF molecules have a boat-like structure. The dihedral angles between the central and outer tetrathio-substituted ethylene moieties are approximately 2.4 3.0 in the A and C molecules. These are approximately 8.5 13.7 in the B and D molecules in the δ m phase, and 7.0 10.9 in the δ o phase. This clearly shows that the low-temperature phase is a charge ordered state. The charges of the BEDT-TTF molecules are estimated empirically from the bond lengths [20]: Q A = + 0.8 ( 1 ) , Q B = + 0.1 ( 1 ) , Q C = + 0.6 ( 1 ) , and Q D = 0.1 ( 1 ) in the δ m phase. In the δ o phase, the charges are Q A = + 0.8 ( 2 ) , Q B = + 0.5 ( 2 ) , Q C = + 0.7 ( 2 ) , and Q D = + 0.2 ( 2 ) . The estimated Q values are in agreement with the molecular shape; the flat A and C molecules are hole rich, whereas the bent B and C molecules are nearly neutral. The calculated energy levels of the highest occupied molecular orbital (HOMO) of these molecules show that the averaged HOMO level of the bent molecules is lower than that of the flat molecules by ∼0.1 eV. This is in agreement with the charge disproportionation between the flat and bent molecules. The hole-rich donor molecules are connected by the transfer integral t q with the largest absolute value in the high temperature structure (Figure 7b,d); then, a spin-singlet state is realized. Although A and C molecules are connected in the δ m phase ( R q A C = 5.71 Å), A and A or C and C molecules are connected in the δ o phase ( R q A A R q C C = 5.70 Å). The absolute value of the transfer integral between A and C molecules | t q A C | increases ( 174.7 meV), but | t q B D | decreases ( 114.1 meV) despite R q B D < R q A C in the δ m phase. This is due to the molecular shape; B and D molecules are bent. The side-by-side molecular center distance is slightly modulated; the averaged difference is approximately 0.10 Å. These tendencies are the same as those in the δ o phase. The anion arrangement is also changed; the isosceles triangle pattern is deformed. There are many hydrogen bonds between the donors and anions in the low-temperature structure. The short hydrogen bonds (≤2.50 Å) are observed in the B and D molecules for both phases.

3. Discussion

The difference between the δ m and δ o phases is the inclination of the donor plane in a conducting layer. In the δ o phase, the plane inclination changes alternately along the normal direction to the conducting layer. The same difference is found in the AsF 6 salts, which indicates that the monoclinic phase of the AsF 6 salt differs from the orthorhombic phase discovered by Senadeera et al. [4,5,6,7]. Nogami et al. have confirmed the lattice constants of the orthorhombic phase of the AsF 6 salt and solved the structure at 110 K including the superlattice reflections; the superlattice unit cells of both δ o -PF 6 and δ o -AsF 6 salts are also orthorhombic [8]. Leung et al. have found two-fold superlattice reflections in the monoclinic AsF 6 salt above 125 K, where the wave vector b * / 2 is the same as that of the δ m -TaF 6 salt. The Raman spectra of the monoclinic AsF 6 salt show the charge ordering at approximately 260 K [13]. Therefore, we have to distinguish between the monoclinic and orthorhombic phases in the AsF 6 salts; the charge ordering transition temperatures are T c = 264 
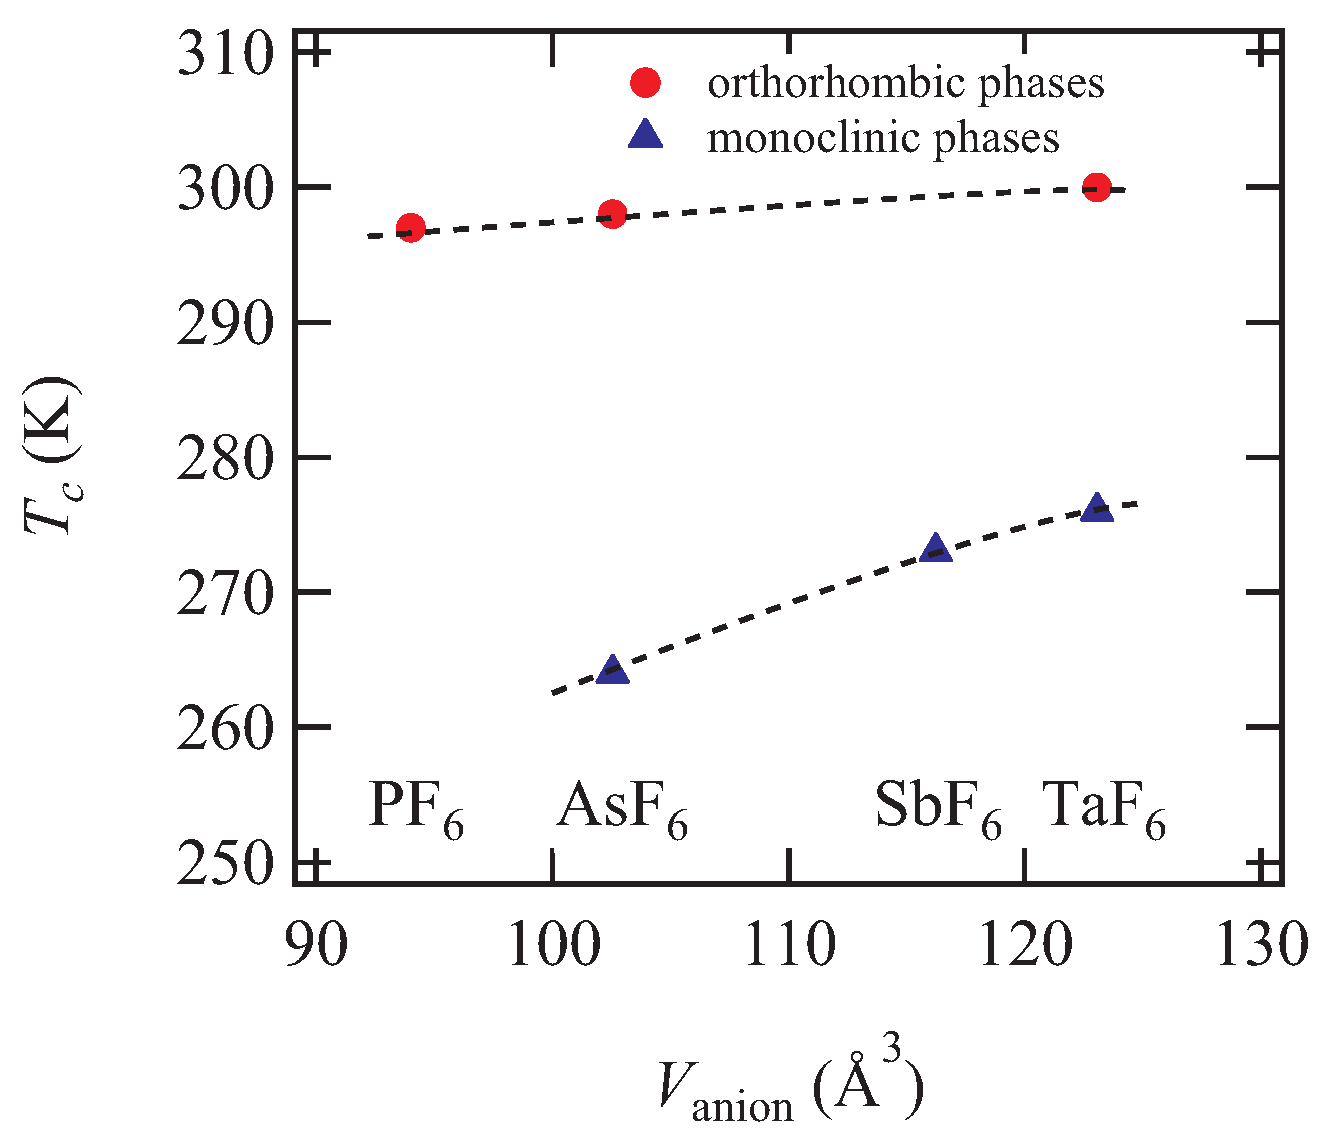
K and 298 K for the monoclinic and orthorhombic phases, respectively. The transition temperature T c of the orthorhombic phases is generally higher than that of the monoclinic phases in the other δ -type (BEDT-TTF) 2 M F 6 salts as shown in Table 3. If we distinguish the crystal system, the transition temperature increases independently with increasing the anion size (Figure 8). This is in agreement with the concept of chemical pressure; the smaller the anion volume, the higher the pressure region. Actually, the transition temperature decreases with increasing the external pressure in the PF 6 salt [6].
The relationship between the charge order and anion has been investigated in α -(BEDT-TTF) 2 I 3 [21]. The hydrogen bonds of the hole-rich donors are shorter than those of the hole-poor donors in α -(BEDT-TTF) 2 I 3 ; the hydrogen bonds between the donors and anions affect the charge ordering transition. In the present compounds, however, the donors with short hydrogen bonds are hole poor molecules, i.e., bent neutral molecules. This indicates that the anion shift does not affect the present phase transition. Moreover, the shift of the donors is also small; this molecular displacement is known as a bond order wave [22,23]. The slight displacement is not dominant in the phase transition that leads to the charge ordered state. The above results show that the origin of the phase transition is due to the electronic correlation between the donor molecules.
The experimentally obtained charge ordered pattern is estimated from the high temperature crystal structure. In the θ -type BEDT-TTF compounds, theoretical investigation has revealed several charge ordering patterns depending on t / V , which have been verified by different kinds of experiments [10,11,12]. However, a simple method to expect the charge ordering pattern has been proposed, since the point charge approximation is appropriate; V is proportional to 1 / R for R 4 Å, where R is the distance between the molecular centers [24]. Table 4 shows the transfer integrals and intermolecular distances in the high temperature structure. This shows a trend for the molecular center distances ( R a 2 < R a 1 < R q < R c < R p ), and 1 / R a 1 1 / R a 2 . Therefore, we use V a as the stacking direction V and others ( V q , V c , and V p ) to calculate the potential energy for several charge ordering patterns by the point charge approximation (Figure 9).
The extended Hubbard model is written as follows [10,12]:
H = i j σ ( t i j c i σ c j σ + h . c . ) + i U n i n i + i j V i j n i n j ,
where i j denotes pairs of the lattice sites i and j, c i σ ( c i σ ) is the creation (annihilation) operator for a hole with spin σ ( = , ) at the i site, and n i σ = c i σ c i σ is the number operator with n i = n i + n i . U is the onsite Coulomb repulsion, and t i j and V i j are the transfer integral and the nearest neighbor Coulomb repulsion between sites i and j. We neglect t i j and assume the static limit in order to investigate complicated charge-order patterns [24,25,26]. The static-limit potential energies are listed in Table 5. The ratios V p / V a = R a / R p 0.54, V c / V a 0.65, and V q / V a 0.76 give the energies on the right side ( V a energy) in Table 5. Since V a is much larger than other Vs, the vertical pattern is unlikely. However, because of V c V q , the horizontal pattern is more stable than the checkerboard in disagreement with the experiments. The checkerboard pattern is most stable when V a and V c make a square lattice [27]. Although V a is obviously large, the relative importance of V c and V q is less clear. These stripe patterns have very close static energies, and the point charge approximation is insufficient to distinguish the stability of different stripe patterns. This is also in the case of β -(meso-DMBEDT-TTF) 2 PF 6 with the checkerboard charge ordering, where DMBEDT-TTF stands for 2-(5,6-dihydro-1,3-dithiolo[4,5-b][1,4]dithiin-2-ylidene)- 5,6-dihydro-5,6-dimethyl-1,3-dithiolo[4,5-b][1,4]dithiin [26,28].
We propose another explanation of the present results. The donor molecules have uniform side-by-side arrangement along the b direction in the δ m -TaF 6 salt. This direction is the highest conducting direction, and the Fermi surface is perpendicular to the b * direction (Figure 1c,e). The value of | t a 1 | is smaller than | t q | , and much smaller than the dimerization in the κ -type BEDT-TTF salts, where the dimer Mott insulating picture is realized ( t dimer 250 meV). The molecular center distance R a 1 4.5 Å is almost the same as that in the dimer of κ -type salts ( 4.0 Å). Then, t / V of the a 1 mode is half of the κ -type salt and comparatively small. However, t / V for q is 90% of that of the κ -type, and the dimerization due to q is important. The energy band in Figure 1 splits into two by taking the oblique dimerization due to q into account. The band splitting has been observed as the inter-band transition in the polarized reflectance spectra of the δ o -PF 6 salt [29]. The present compounds show semiconducting behaviors even at 350 K sufficiently higher than the phase transition temperature. This indicates that the high temperature phase is a paramagnetic dimer Mott insulator. In the present compounds, a dimer is surrounded by eight neighboring dimers, i.e., a quasi-square lattice, where all dimers have one hole; the dimers are connected by the horizontal interaction composed of two c modes and one a 2 mode, the vertical a 1 mode, and the diagonal p mode. The interdimer Coulomb repulsion leads to the checkerboard type charge order ( 2 , 0 , 2 , 0 ) because of the relationship V p < V c < V a , and the spin singlet state in the dimer is realized. The spin singlet charge ordering has been observed in the dimer Mott insulator κ -(BEDT-TTF) 4 [Co(CN) 6 ][N(C 2 H 5 ) 4 ]·2H 2 O; the charged dimer composed of hole-rich flat donors and the neutral dimer of bent donors exist in the checkerboard charge ordered state [30].
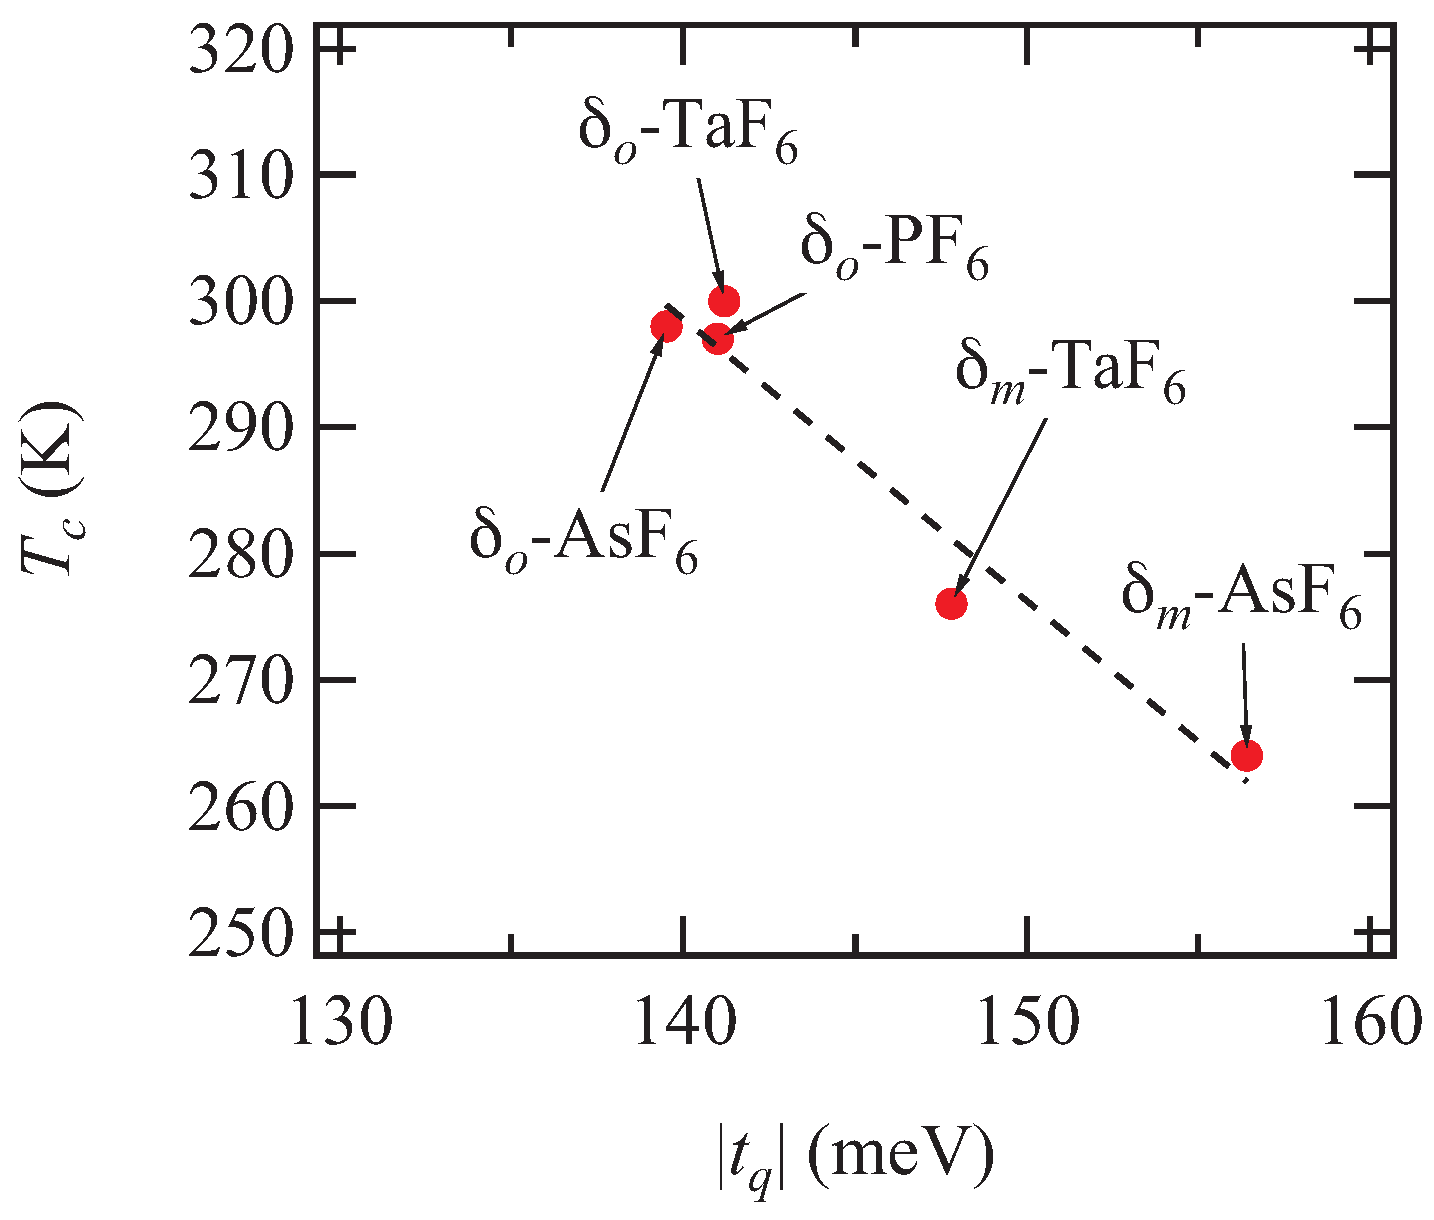
The wave vector of the superlattice reflection of the δ o -TaF 6 salt differs from those of other MF 6 salts, but this is only due to the alignment along the interlayer b-axis. The charge ordering transition temperature increases systematically as the transfer integral | t q | decreases, following a single line both for the monoclinic and orthorhombic phases (Figure 10). R q is almost the same, and the ratio | t q | / V q increases as | t q | increases. This suggests the importance of the dimerization q [3].

4. Materials and Methods

Single crystals of (BEDT-TTF) 2 TaF 6 were grown by electrocrystallization. The crystal structures were determined by the X-ray single crystal structure analyses. The X-ray diffraction measurements were made on a Rigaku AFC7R four-circle diffractometer (Rigaku Corporation, Tokyo, Japan) with graphite monochromated Mo- K α radiation and a rotating anode generator ( λ = 0.71069 Å). The X-ray oscillation photographs above 170 K were taken using a Rigaku R-AXIS RAPID II imaging plate with Cu- K α radiation from a rotating anode source with a confocal multilayer X-ray mirror (RIGAKU VM-Spider, λ = 1.54187 Å). For the low-temperature X-ray measurements, the samples were cooled by a nitrogen gas-stream cooling method. Low-temperature X-ray oscillation photographs at 39 K were taken using an imaging plate with Si monochromated synchrotron radiation ( λ = 0.99884 ( 2 ) Å) at BL-8B of the Photon Factory, KEK, Tsukuba, Japan; the wavelength was calibrated using CeO 2 . The sample was cooled by a helium gas-stream cooling method. The structures were solved by direct methods (SIR2008 and SHELXT) and refined by the full-matrix least-squares procedure (SHELXL) [18,31,32]. Crystallographic data have been deposited with Cambridge Crystallographic Data Center: deposition numbers CCDC 1526712 and 1526713. The energy band structures were calculated on the basis of the molecular orbital calculation and tight-binding approximation [33].
The electrical resistivities were measured by the four-probe method with low-frequency AC current ( 1.0 μ A). Lock-in amplifiers were used for high-sensitivity detection. Thermoelectric power measurements were carried out by the two terminal method [34]. Electron spin resonance (ESR) spectra were measured using a conventional X-band spectrometer (JEOL JES-TE100, Tokyo, Japan). The sweep width of the magnetic field and the g-values were calibrated by the spectra of Mn 2 + /MgO with a hyperfine structure constant of 86.77 Oe and g 0 of 2.00094 . All measurements were performed after examining the lattice parameters using X-ray oscillation photographs.

5. Conclusions

Two polymorphs of (BEDT-TTF) 2 TaF 6 have the same type of δ -type structure, and only the crystal system differs. The present compounds are categorized into a dimer Mott insulator because of the semiconducting behavior even at 350 K. The charge ordering transition is observed at 276 K and 300 K for the monoclinic ( δ m ) and the orthorhombic ( δ o ) phases, respectively. The bent and flat BEDT-TTF molecules exist in the low-temperature insulting phase, indicating the checkerboard charge ordering. The checkerboard pattern results in a spin singlet state due to the oblique dimerization q mode and the interdimer Coulomb repulsion. If we distinguish the crystal system, the charge ordering transition temperature increases systematically with increasing of the anion size.

Supplementary Files

Supplementary File 1

Acknowledgments

This work was partially performed under the approval of the Photon Factory Program Advisory Committee (Proposal No. 2014G089) and supported by Japan Society for the Promotion of Science (JSPS) KAKENHI Grant Numbers 24540364 and 16K05436.

Author Contributions

T.K. and T.M. conceived and designed the experiments; K.K. and T.K. performed the experiments; K.K. and T.K. analyzed the data; R.K. contributed experiment and analysis tools for diffraction measurements using synchrotron radiation; and T.K. and T.M. wrote the paper.

Conflicts of Interest

The authors declare no conflict of interest.

References

  1. Kobayashi, H.; Mori, T.; Kato, R.; Kobayashi, A.; Sasaki, Y.; Saito, G.; Inokuchi, H. Transverse conduction and metal-insulator transition in β-(BEDT-TTF)2PF6. Chem. Lett. 1983, 12, 581–584. [Google Scholar] [CrossRef]
  2. Mori, T.; Kobayashi, A.; Sasaki, Y.; Kato, R.; Kobayashi, H. Band structure of β-(BEDT-TTF)2PF6. One-dimensional metal along the side-by-side molecular array. Solid State Commun. 1985, 53, 627–631. [Google Scholar] [CrossRef]
  3. Mori, T. Structural genealogy of BEDT-TTF-based organic conductors III. twisted molecules: δ and α′ phases. Bull. Chem. Soc. Jpn. 1999, 72, 2011–2027. [Google Scholar] [CrossRef]
  4. Laversanne, R.; Amiell, J.; Delhaes, P.; Chasseau, D.; Hauw, C. A metal-insulator phase transition close to room temperature: (BEDT-TTF)2SbF6 and (BEDT-TTF)2AsF6. Solid State Commun. 1984, 52, 177–181. [Google Scholar] [CrossRef]
  5. Leung, P.C.; Beno, M.A.; Blackman, G.S.; Coughlin, B.R.; Miderski, C.A.; Joss, W.; Crabtree, G.W.; Williams, J.M. Structure of semiconducting 3,4;3′,4′-bis(ethylenedithio)-2,2′,5,5′-tetrathiafulvalene-hexafluoroarsenate (2:1), (BEDT-TTF)2AsF6, (C10H8S8)2AsF6. Acta Crystallogr. Sect. C 1984, 40, 1331–1334. [Google Scholar] [CrossRef]
  6. Senadeera, G.K.R.; Kawamoto, T.; Mori, T.; Yamaura, J.; Enoki, T. 2kF CDW transition in β-(BEDT-TTF)2PF6 family salts. J. Phys. Soc. Jpn. 1998, 67, 4193–4197. [Google Scholar] [CrossRef]
  7. Senadeera, G.K.R. Report for “33rd International Course for Advanced Research Chemistry and Chemical Engineering”; Tokyo Tech./United Nations Educational, Scientific and Cultural Organization (UNESCO): Tokyo, Japan, 1998. [Google Scholar]
  8. Nogami, Y.; Mori, T. Unusual 2kF CDW state with enhanced charge ordering in β-(BEDT-TTF)2AsF6 and PF6. J. Phys. IV Fr. 2002, 12, 233–234. [Google Scholar]
  9. Ding, Y.; Tajima, H. Optical study on the charge ordering in the organic conductor β-(BEDT-TTF)2PF6. Phys. Rev. B 2004, 69, 115121. [Google Scholar] [CrossRef]
  10. Seo, H. Charge ordering in organic ET compounds. J. Phys. Soc. Jpn. 2000, 69, 805–820. [Google Scholar] [CrossRef]
  11. Takahashi, T.; Nogami, Y.; Yakushi, K. Charge ordering in organic conductors. J. Phys. Soc. Jpn. 2006, 75, 051008. [Google Scholar] [CrossRef]
  12. Seo, H.; Merino, J.; Yoshioka, H.; Ogata, M. Theoretical aspects of charge ordering in molecular conductors. J. Phys. Soc. Jpn. 2006, 75, 051009. [Google Scholar] [CrossRef]
  13. Kowalska, A.; Wojciechowski, R.; Ulanski, J. Phase transitions in β-(BEDT-TTF)2XF6 (X = P, Sb or As) salts as seen by Raman spectroscopy. Mater. Sci. Pol. 2004, 22, 353–358. [Google Scholar]
  14. Williams, J.M.; Beno, M.A.; Sullivan, J.C.; Banovetz, L.M.; Braam, J.M.; Blackman, G.S.; Carlson, C.D.; Greer, D.L.; Loesing, D.M.; Carneiro, K. Role of monovalent anions in organic superconductors. Phys. Rev. B 1983, 28, 2873–2876. [Google Scholar] [CrossRef]
  15. Bondi, A. van der Waals Volumes and Radii. J. Phys. Chem. 1964, 68, 441–451. [Google Scholar] [CrossRef]
  16. Chaikin, P.M.; Beni, G. Thermopower in the correlated hopping regime. Phys. Rev. B 1976, 13, 647–651. [Google Scholar] [CrossRef]
  17. Kwak, J.F.; Beni, G. Thermoelectric power of a Hubbard chain with arbitrary electron density: Strong-coupling limit. Phys. Rev. B 1976, 13, 652–657. [Google Scholar] [CrossRef]
  18. Sheldrick, G.M. SHELXT—Integrated space-group and crystal structure determination. Acta Crystallogr. Sect. A 2015, 71, 3–8. [Google Scholar] [CrossRef] [PubMed]
  19. Kobayashi, H.; Kobayashi, A.; Sasaki, Y.; Saito, G.; Inokuchi, H. The crystal and molecular structures of bis(ethylenedithio)tetrathiafulvalene. Bull. Chem. Soc. Jpn. 1986, 59, 301–302. [Google Scholar] [CrossRef]
  20. Guionneau, P.; Kepert, C.J.; Bravic, G.; Chasseau, D.; Truter, M.R.; Kurmoo, M.; Day, P. Determining the charge distribution in BEDT-TTF salts. Synth. Met. 1997, 86, 1973–1974. [Google Scholar] [CrossRef]
  21. Alemany, P.; Pouget, J.P.; Canadell, E. Essential role of anions in the charge ordering transition of α-(BEDT-TTF)2I3. Phys. Rev. B 2012, 85, 195118. [Google Scholar] [CrossRef]
  22. Pouget, J.P. Bond and charge ordering in low-dimensional organic conductors. Physica B 2012, 407, 1762–1770. [Google Scholar] [CrossRef]
  23. Pouget, J.P. Interplay between electronic and structural degrees of freedom in quarter-filled low dimensional conductors. Physica B 2015, 460, 45–52. [Google Scholar] [CrossRef]
  24. Mori, T. Estimation of off-site Coulomb integrals and phase diagrams of charge ordered states in the θ-phase organic conductors. Bull. Chem. Soc. Jpn. 2000, 73, 2243–2253. [Google Scholar] [CrossRef]
  25. Mori, T. Non-stripe charge order in the θ-phase organic conductors. J. Phys. Soc. Jpn. 2003, 72, 1469–1475. [Google Scholar] [CrossRef]
  26. Mori, T. Non-stripe charge order in dimerized organic conductors. Phys. Rev. B 2016, 93, 245104. [Google Scholar] [CrossRef]
  27. Ohta, Y.; Tsutsui, K.; Koshibae, W.; Maekawa, S. Exact-diagonalization study of the Hubbard model with nearest-neighbor repulsion. Phys. Rev. B 1994, 50, 13594–13602. [Google Scholar] [CrossRef]
  28. Kimura, S.; Suzuki, H.; Maejima, T.; Mori, H.; Yamaura, J.; Kakiuchi, T.; Sawa, H.; Moriyama, H. Checkerboard-type charge-ordered state of a pressure-induced superconductor, β-(meso-DMBEDT-TTF)2PF6. J. Am. Chem. Soc. 2006, 128, 1456–1457. [Google Scholar] [CrossRef] [PubMed]
  29. Tajima, H.; Yakushi, K.; Kuroda, H.; Saito, G. Polarized reflectance spectrum of β-(BEDT-TTF)2PF6. Solid State Commun. 1985, 56, 251–254. [Google Scholar] [CrossRef]
  30. Ota, A.; Ouahab, L.; Golhen, S.; Yoshida, Y.; Maesato, M.; Saito, G.; Świetlik, R. Phase transition from Mott insulating phase into the charge ordering phase with molecular deformation in charge-transfer salts κ-(ET)4[M(CN)6][N(C2H5)4]·2H2O (M = CoIII and FeIII). Chem. Mater. 2007, 19, 2455–2462. [Google Scholar] [CrossRef]
  31. Burla, M.C.; Caliandro, R.; Camalli, M.; Carrozzini, B.; Cascarano, G.L.; Caro, L.D.; Giacovazzo, C.; Polidori, G.; Siliqi, D.; Spagna, R. IL MILIONE: A suite of computer programs for crystal structure solution of proteins. J. Appl. Crystallogr. 2007, 40, 609–613. [Google Scholar] [CrossRef]
  32. Sheldrick, G.M. Crystal structure refinement with SHELXL. Acta Crystallogr. Sect. C 2015, 71, 3–8. [Google Scholar] [CrossRef] [PubMed]
  33. Mori, T.; Kobayashi, A.; Sasaki, Y.; Kobayashi, H.; Saito, G.; Inokuchi, H. The intermolecular interaction of tetrathiafulvalene and bis(ethylenedithio)tetrathiafulvalene in organic metals. Calculation of orbital overlaps and models of energy-band structures. Bull. Chem. Soc. Jpn. 1984, 57, 627–633. [Google Scholar] [CrossRef]
  34. Chaikin, P.M.; Kwak, J.F. Apparatus for thermopower measurements on organic conductors. Rev. Sci. Instrum. 1975, 46, 218–220. [Google Scholar] [CrossRef]
Figure 1. Crystal structure of δ m -(BEDT-TTF) 2 TaF 6 (a) and the δ o phase (b) projected approximately along the molecular short axis. The donor layer of the δ m phase (c) and the δ o phase (d) projected approximately along the molecular long axis. The energy band structure and the Fermi surface of the δ m phase (e) and the δ o phase (f).
Magnetochemistry 03 00014 g001
Figure 2. Temperature dependence of the resistivity of the δ m phase (a) and the δ o phase (b). The insets show the Arrhenius plots, and solid lines in the insets are fits to the data.
Magnetochemistry 03 00014 g002
Figure 3. Temperature dependence of Seebeck coefficients of the δ m and δ o phases.
Magnetochemistry 03 00014 g003
Figure 4. Temperature dependence of ESR g-values (a), linewidths (b), and the relative spin susceptibilities (c) of the δ m and δ o phases. The applied magnetic field is perpendicular to the conducting layer for both compounds. The inset shows the Arrhenius plots, and solid lines in the inset are fits to the data.
Magnetochemistry 03 00014 g004
Figure 5. X-ray oscillation photographs of the δ m phase at 298 K (a) and 171 K (b), and of the δ o phase at 309 K (c) and 171 K (d).
Magnetochemistry 03 00014 g005
Figure 6. Temperature dependence of the integrated intensity of superlattice reflections. The background intensities are subtracted. Although integrated intensity is measured using a four circle diffractometer for the δ o phase, this is measured using an imaging plate for the δ m phase. The indices of the used reflections are 4 , 1 / 2 , 3 for the δ m phase, and 8 , 3 / 2 , 1 / 2 for the δ o phase.
Magnetochemistry 03 00014 g006
Figure 7. Crystal structure of the δ m phase at 171 K (a,b) and of the δ o phase at 39 K (c,d). Four crystallographically independent molecules (A, B, C, and D) exist for both phases (a,c). A and C (B and D) molecules are flat (bent). Black rounded rectangles denote hole-rich molecules, and t q is the interaction mode q in the high temperature structure (b,d).
Magnetochemistry 03 00014 g007
Figure 8. Anion volume dependence of the charge ordering temperature of δ -type (BEDT-TTF) 2 M F 6 ( M = P, As, Sb, and Ta). Anion volumes are estimated using Figure 2 in Ref. [14]. Dashed lines are guides to the eye.
Magnetochemistry 03 00014 g008
Figure 9. Charge order patterns of the δ -type salts. (a) uniform; (b) horizontal stripe; (c) vertical stripe; and (d) checkerboard. The dashed line shows a unit cell.
Magnetochemistry 03 00014 g009
Figure 10. Charge ordering temperatures as a function of | t q | . The dashed line shows linear dependence.
Magnetochemistry 03 00014 g010
Table 1. Crystallographic data of the (BEDT-TTF) 2 TaF 6 salts.
δ m Phase δ o Phase
FormulaC 20 H 16 S 16 TaF 6
Formula weight 1064.24
Temperature (K)29817129839
Crystal systemMonoclinicMonoclinicOrthorhombicMonoclinic
Space group C 2 / c P 2 1 / n P n n a P 2 / c
a (Å) 35.825 ( 12 ) 35.6108 ( 6 ) 14.924 ( 9 ) 13.2594 ( 5 )
b (Å) 6.679 ( 4 ) 13.2887 ( 2 ) 33.366 ( 14 ) 14.5036 ( 4 )
c (Å) 14.953 ( 8 ) 14.7148 ( 3 ) 6.656 ( 2 ) 33.8724 ( 7 )
β (deg) 110.62 ( 3 ) 110.1387 ( 8 ) 101.206 ( 2 )
V 3 ) 3349 ( 3 ) 6537.7 ( 2 ) 3315 ( 3 ) 6389.8 ( 3 )
Z4848
Total reflections487711899292127208
Reflections [ F 2 > 2 σ ( F 2 ) ]35717889155820909
R 1 [ F 2 > 2 σ ( F 2 ) ] 0.0327 0.0818 0.0748 0.1387
w R 2 (all reflections) 0.0944 0.2172 0.2498 0.3242
GOF 1.028 1.128 1.026 1.231
Table 2. Transfer integrals and geometrical parameters of the δ -type (BEDT-TTF) 2 TaF 6 salts.
Interaction Modet (meV)R (Å) ω (deg)
δ m phase
c 75.6 6.68
a 1 103.3 4.49 29.9
a 2 38.4 4.18
p 23.8 8.05
q 147.8 5.72
δ o phase
c 79.4 6.66
a 1 95.9 4.51 29.9
a 2 37.1 4.19
p 24.5 8.04
q 141.2 5.72
Table 3. Summary of the δ -type (BEDT-TTF) 2 M F 6 salts.
δ m -PF 6 δ o -PF 6 δ m -AsF 6 δ o -AsF 6 δ m -SbF 6 δ o -SbF 6 δ m -TaF 6 δ o -TaF 6
existence b yesyesyesyes b yesyes
spin singletyesyesyesyesyesyes
superlattice a c * / 2 b * / 2 c * / 2 b b * / 2 b * / 2 + c * / 2
charge orderingyesyesyesyesyesyes
T c (K)297264 298 c 273276300
Ref.[1,6,8,9][4,5,13][6,8][4,13] d d
a For the δ m -AsF 6 salt, the unit cell is transformed to that of the TaF 6 salt, C 2 / c ; b unknown; c T c is estimated from the temperature dependence of the superlattice reflection in Ref. [6]; d present work.
Table 4. Transfer integrals and geometrical parameters of the δ -type (BEDT-TTF) 2 AsF 6 and (BEDT-TTF) 2 PF 6 salts.
Interaction Modet (meV)R (Å) ω (deg)
δ m -AsF 6 a
c 77.7 6.67
a 1 109.5 4.45 29.9
a 2 33.2 4.14
p 23.4 8.01
q 156.4 5.71
δ o -AsF 6 b
c 74.8 6.69
a 1 98.4 4.50 30.1
a 2 32.3 4.20
p 22.4 8.07
q 139.5 5.76
δ o -PF 6 (From Ref. [2])
c 84
a 1 104
a 2 32
p 28
q 141
a The atomic coordinates are in Ref. [5]; b The atomic coordinates are in Ref. [7].
Table 5. Potential energies of the charge-ordered patterns per unit cell in the δ -type.
PatternV Energy V a Energy
Uniform E u = U 4 + V a + V c + V p + V q 2 U 4 + 2.57 V a
Horizontal E h = U 2 + 2 V c U 2 + 1.3 V a
Vertical E v = U 2 + 2 V a U 2 + 2 V a
Checkerboard E c = U 2 + 2 V p + V q U 2 + 1.84 V a

