
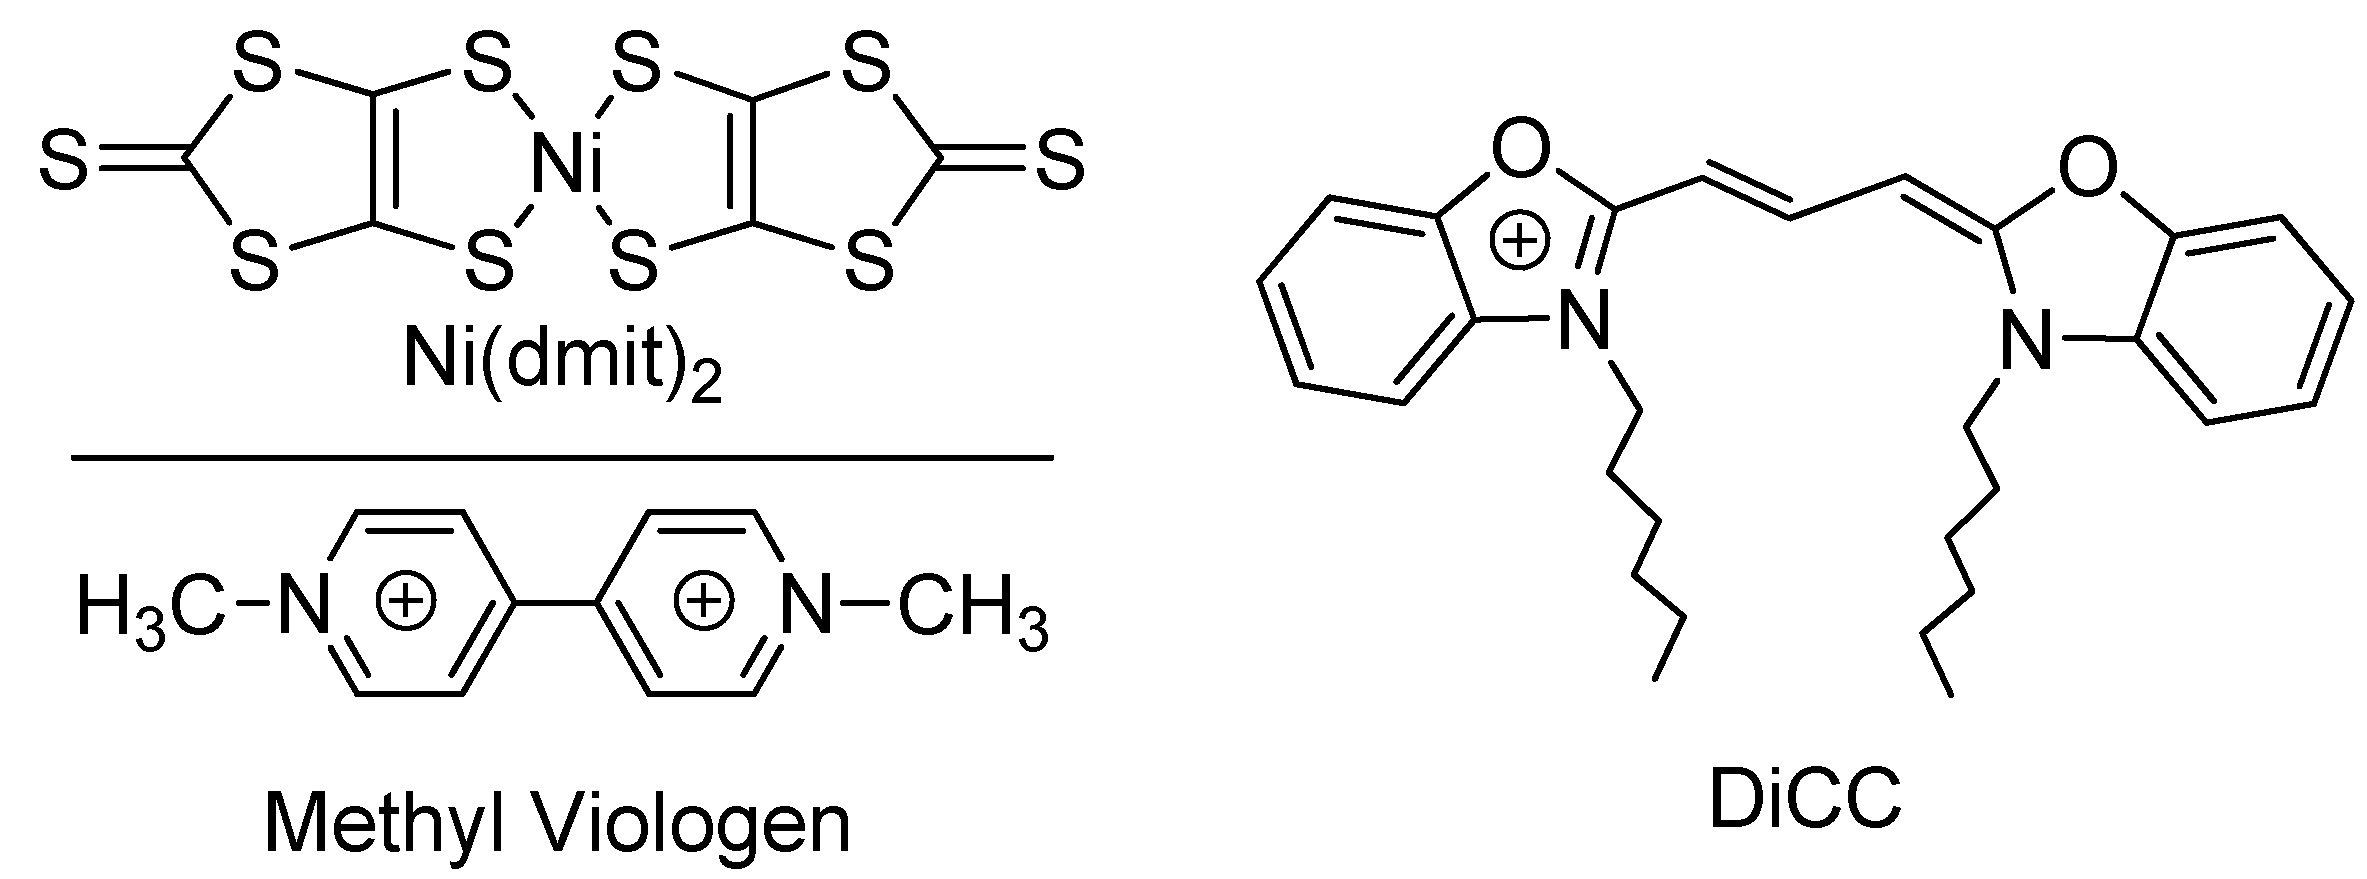
Dye-Sensitized Molecular Charge Transfer Complexes: Magnetic and Conduction Properties in the Photoexcited States of Ni(dmit)2 Salts Containing Photosensitive Dyes


Abstract
:1. Introduction
2. Results
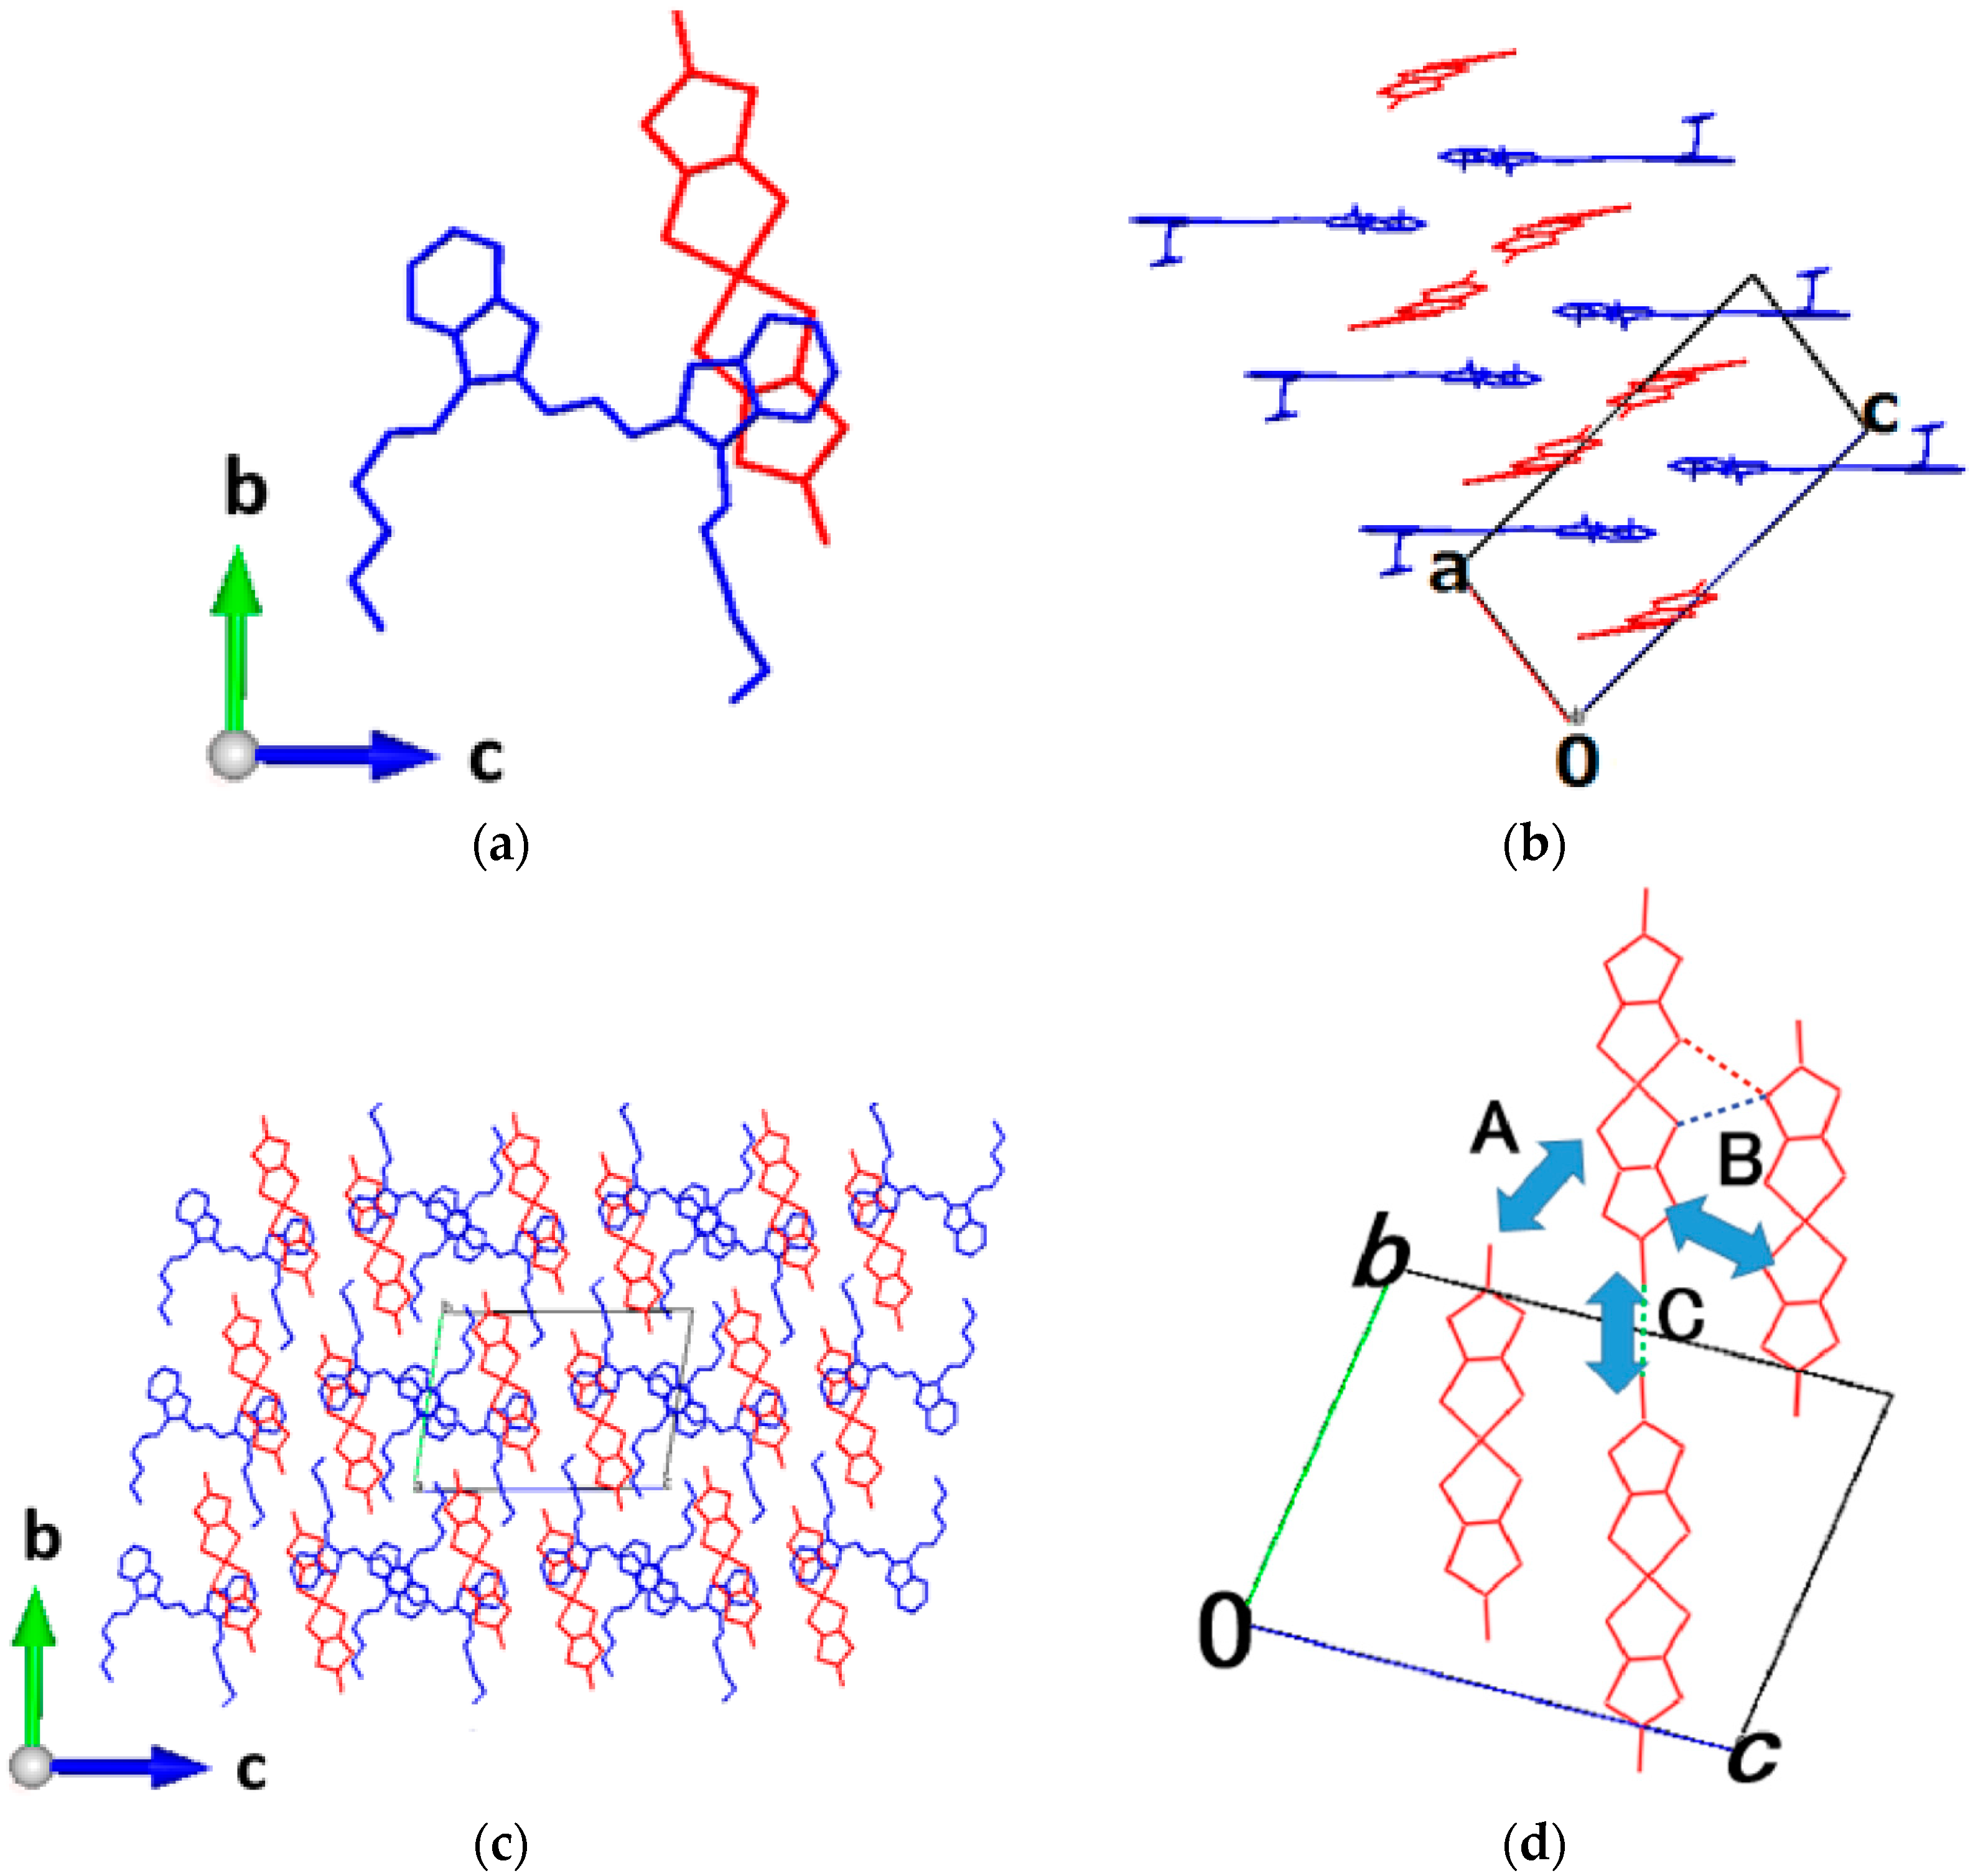
2.1. Crystal Structures, Similarities and Differences among the DiCC Salts
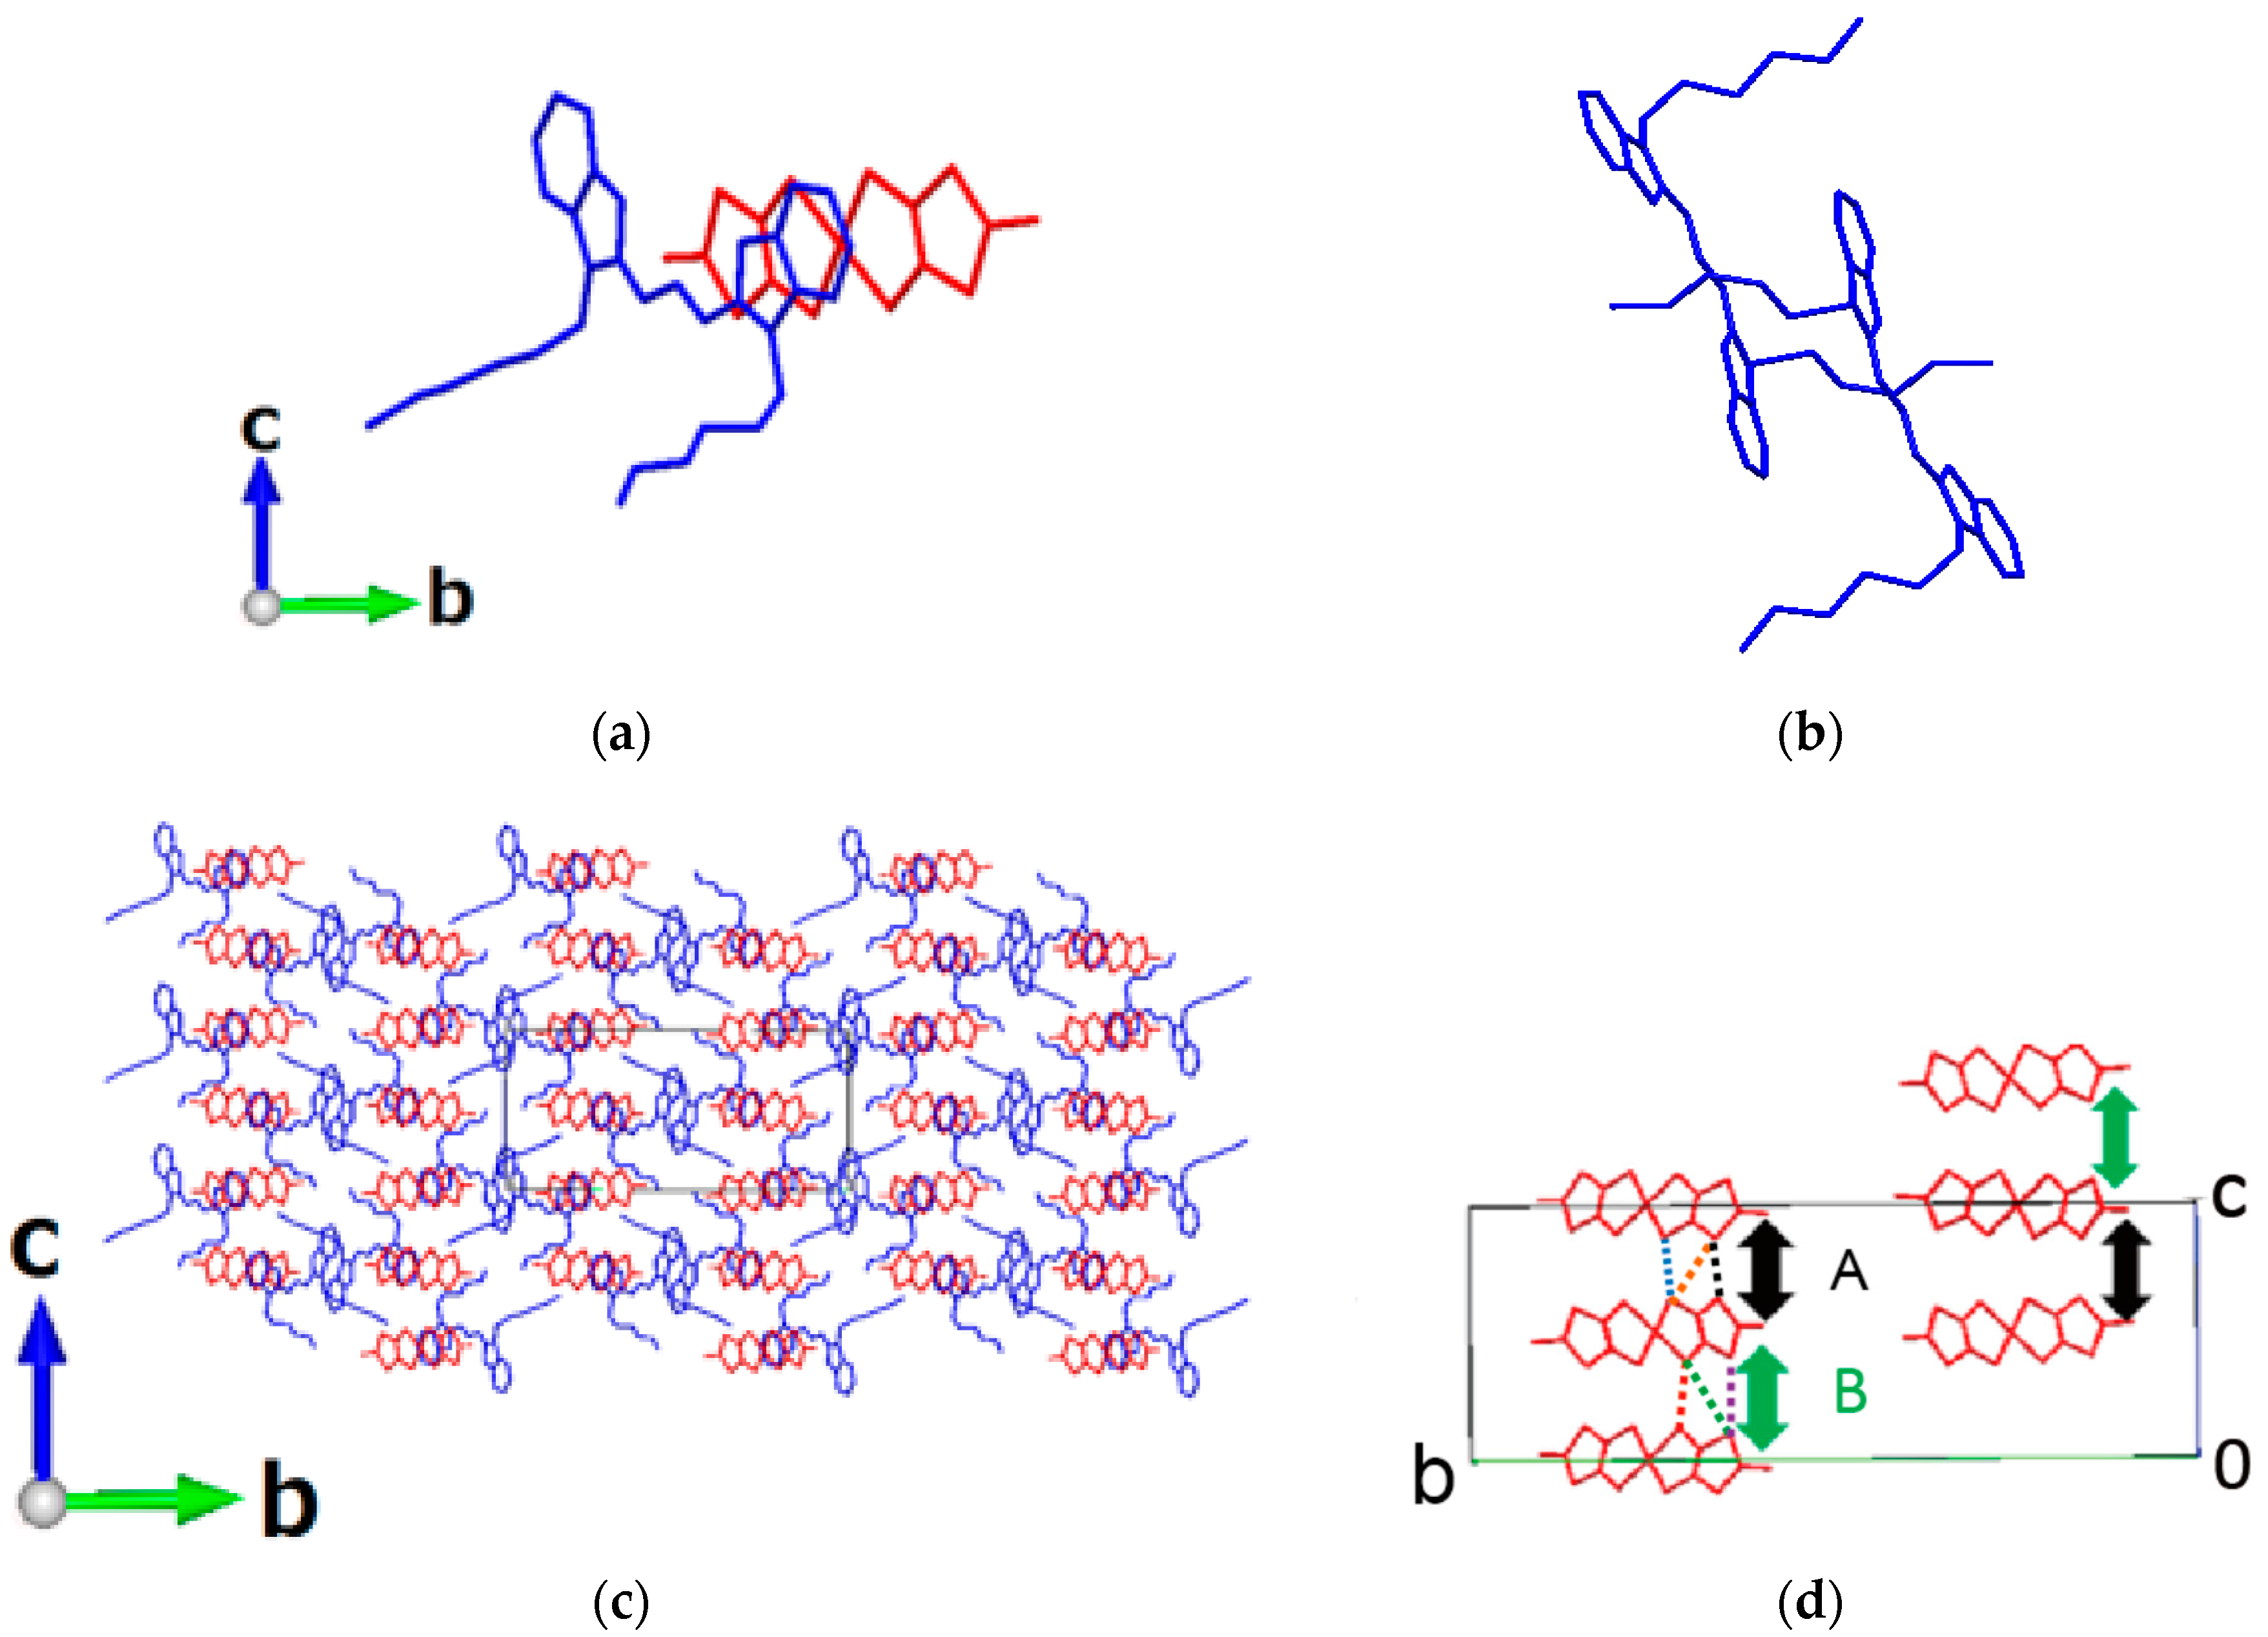
2.1.1. γ-Salt
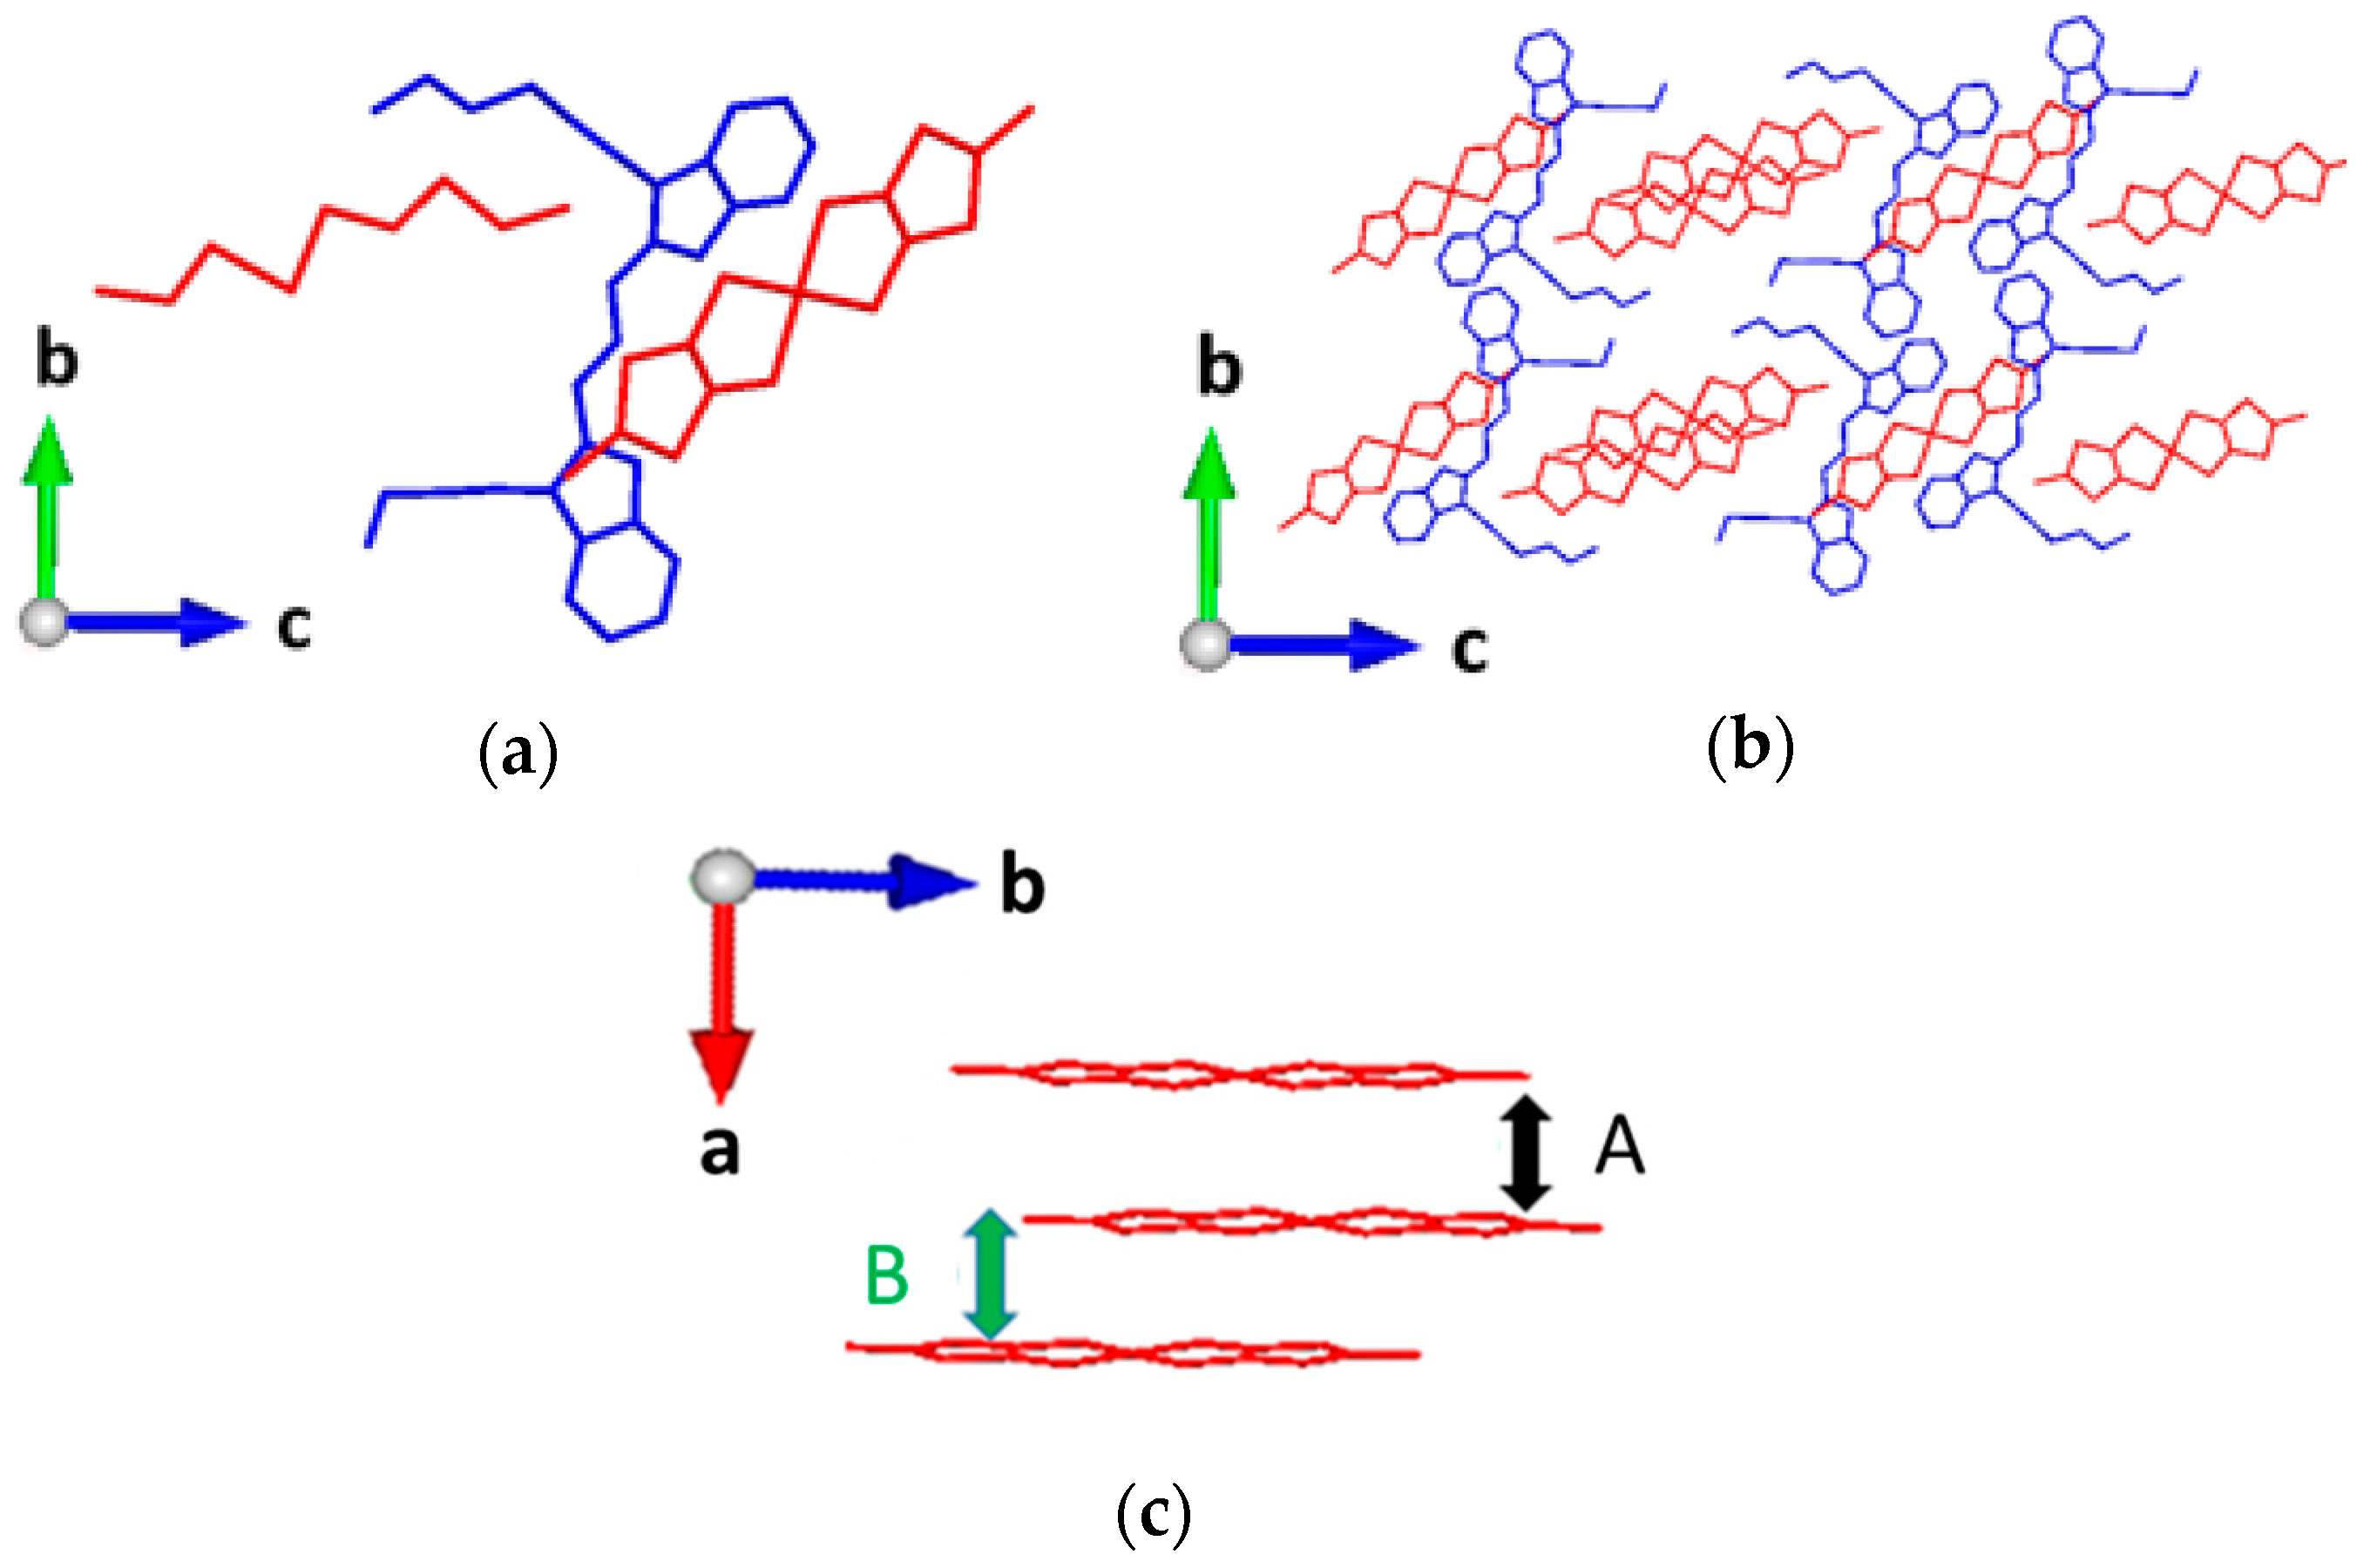
2.1.2. δ-Salt
2.1.3. 2:3-Salt
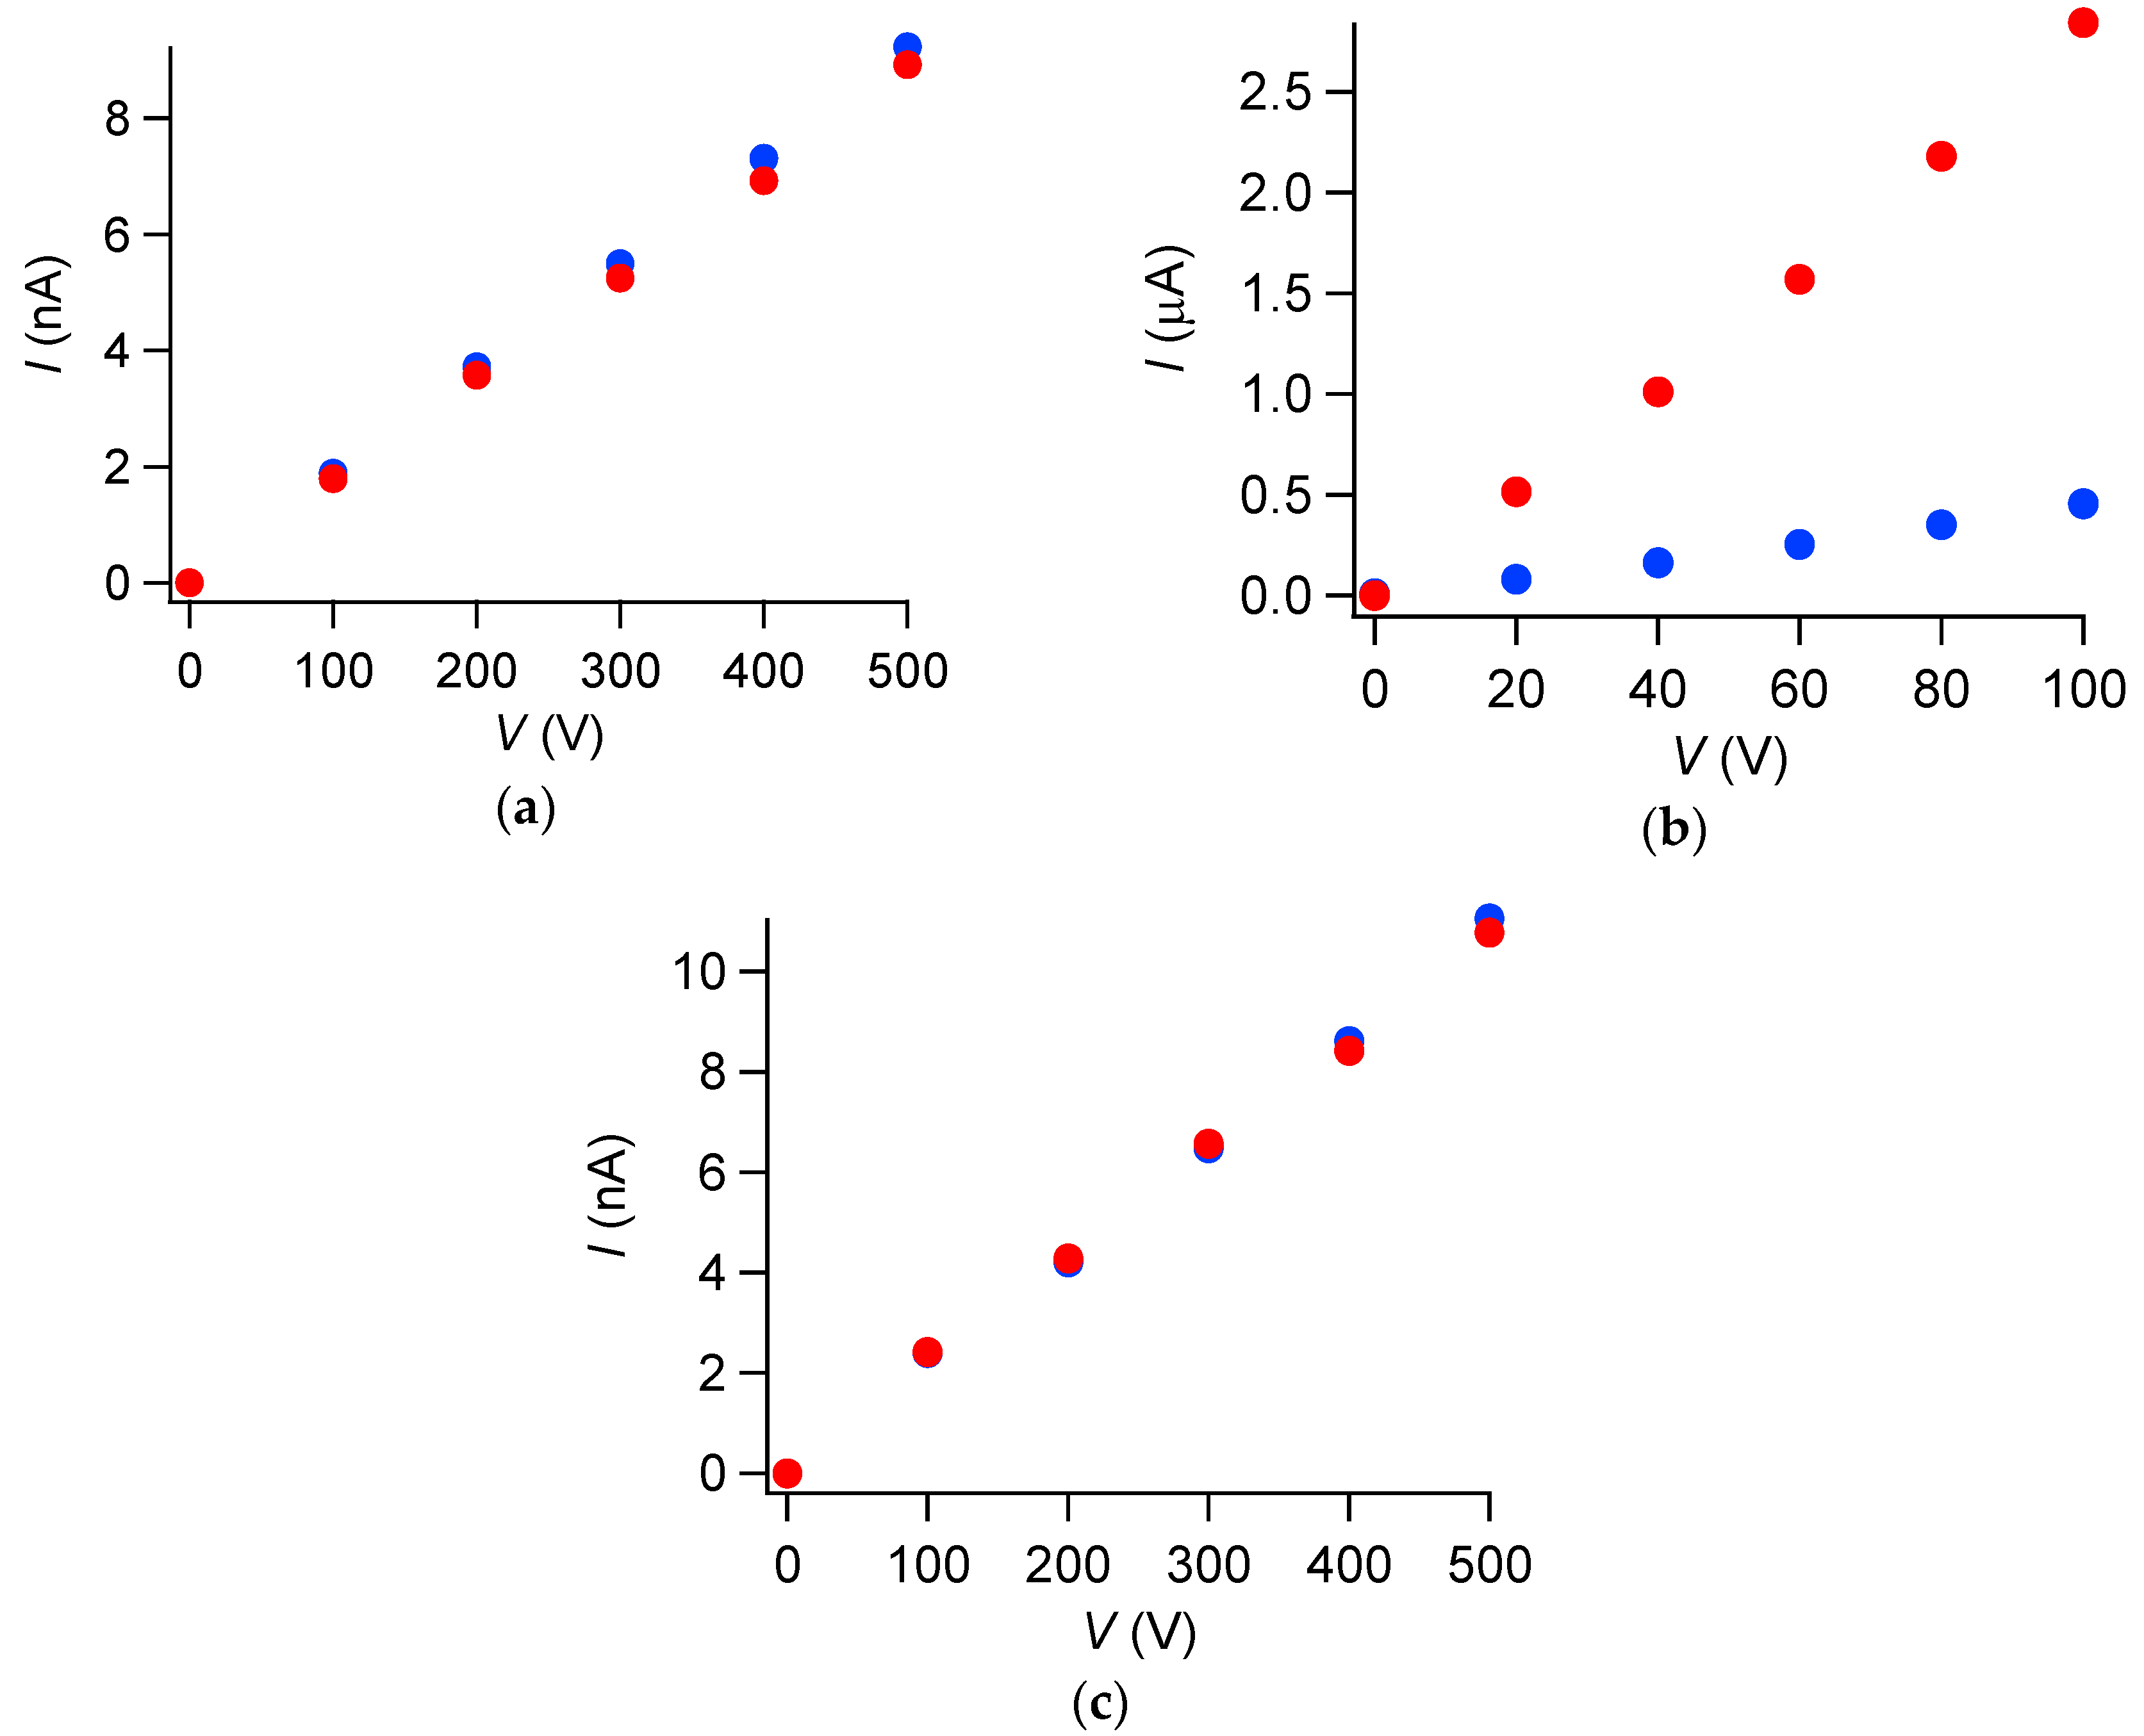
2.2. Electrical Behavior
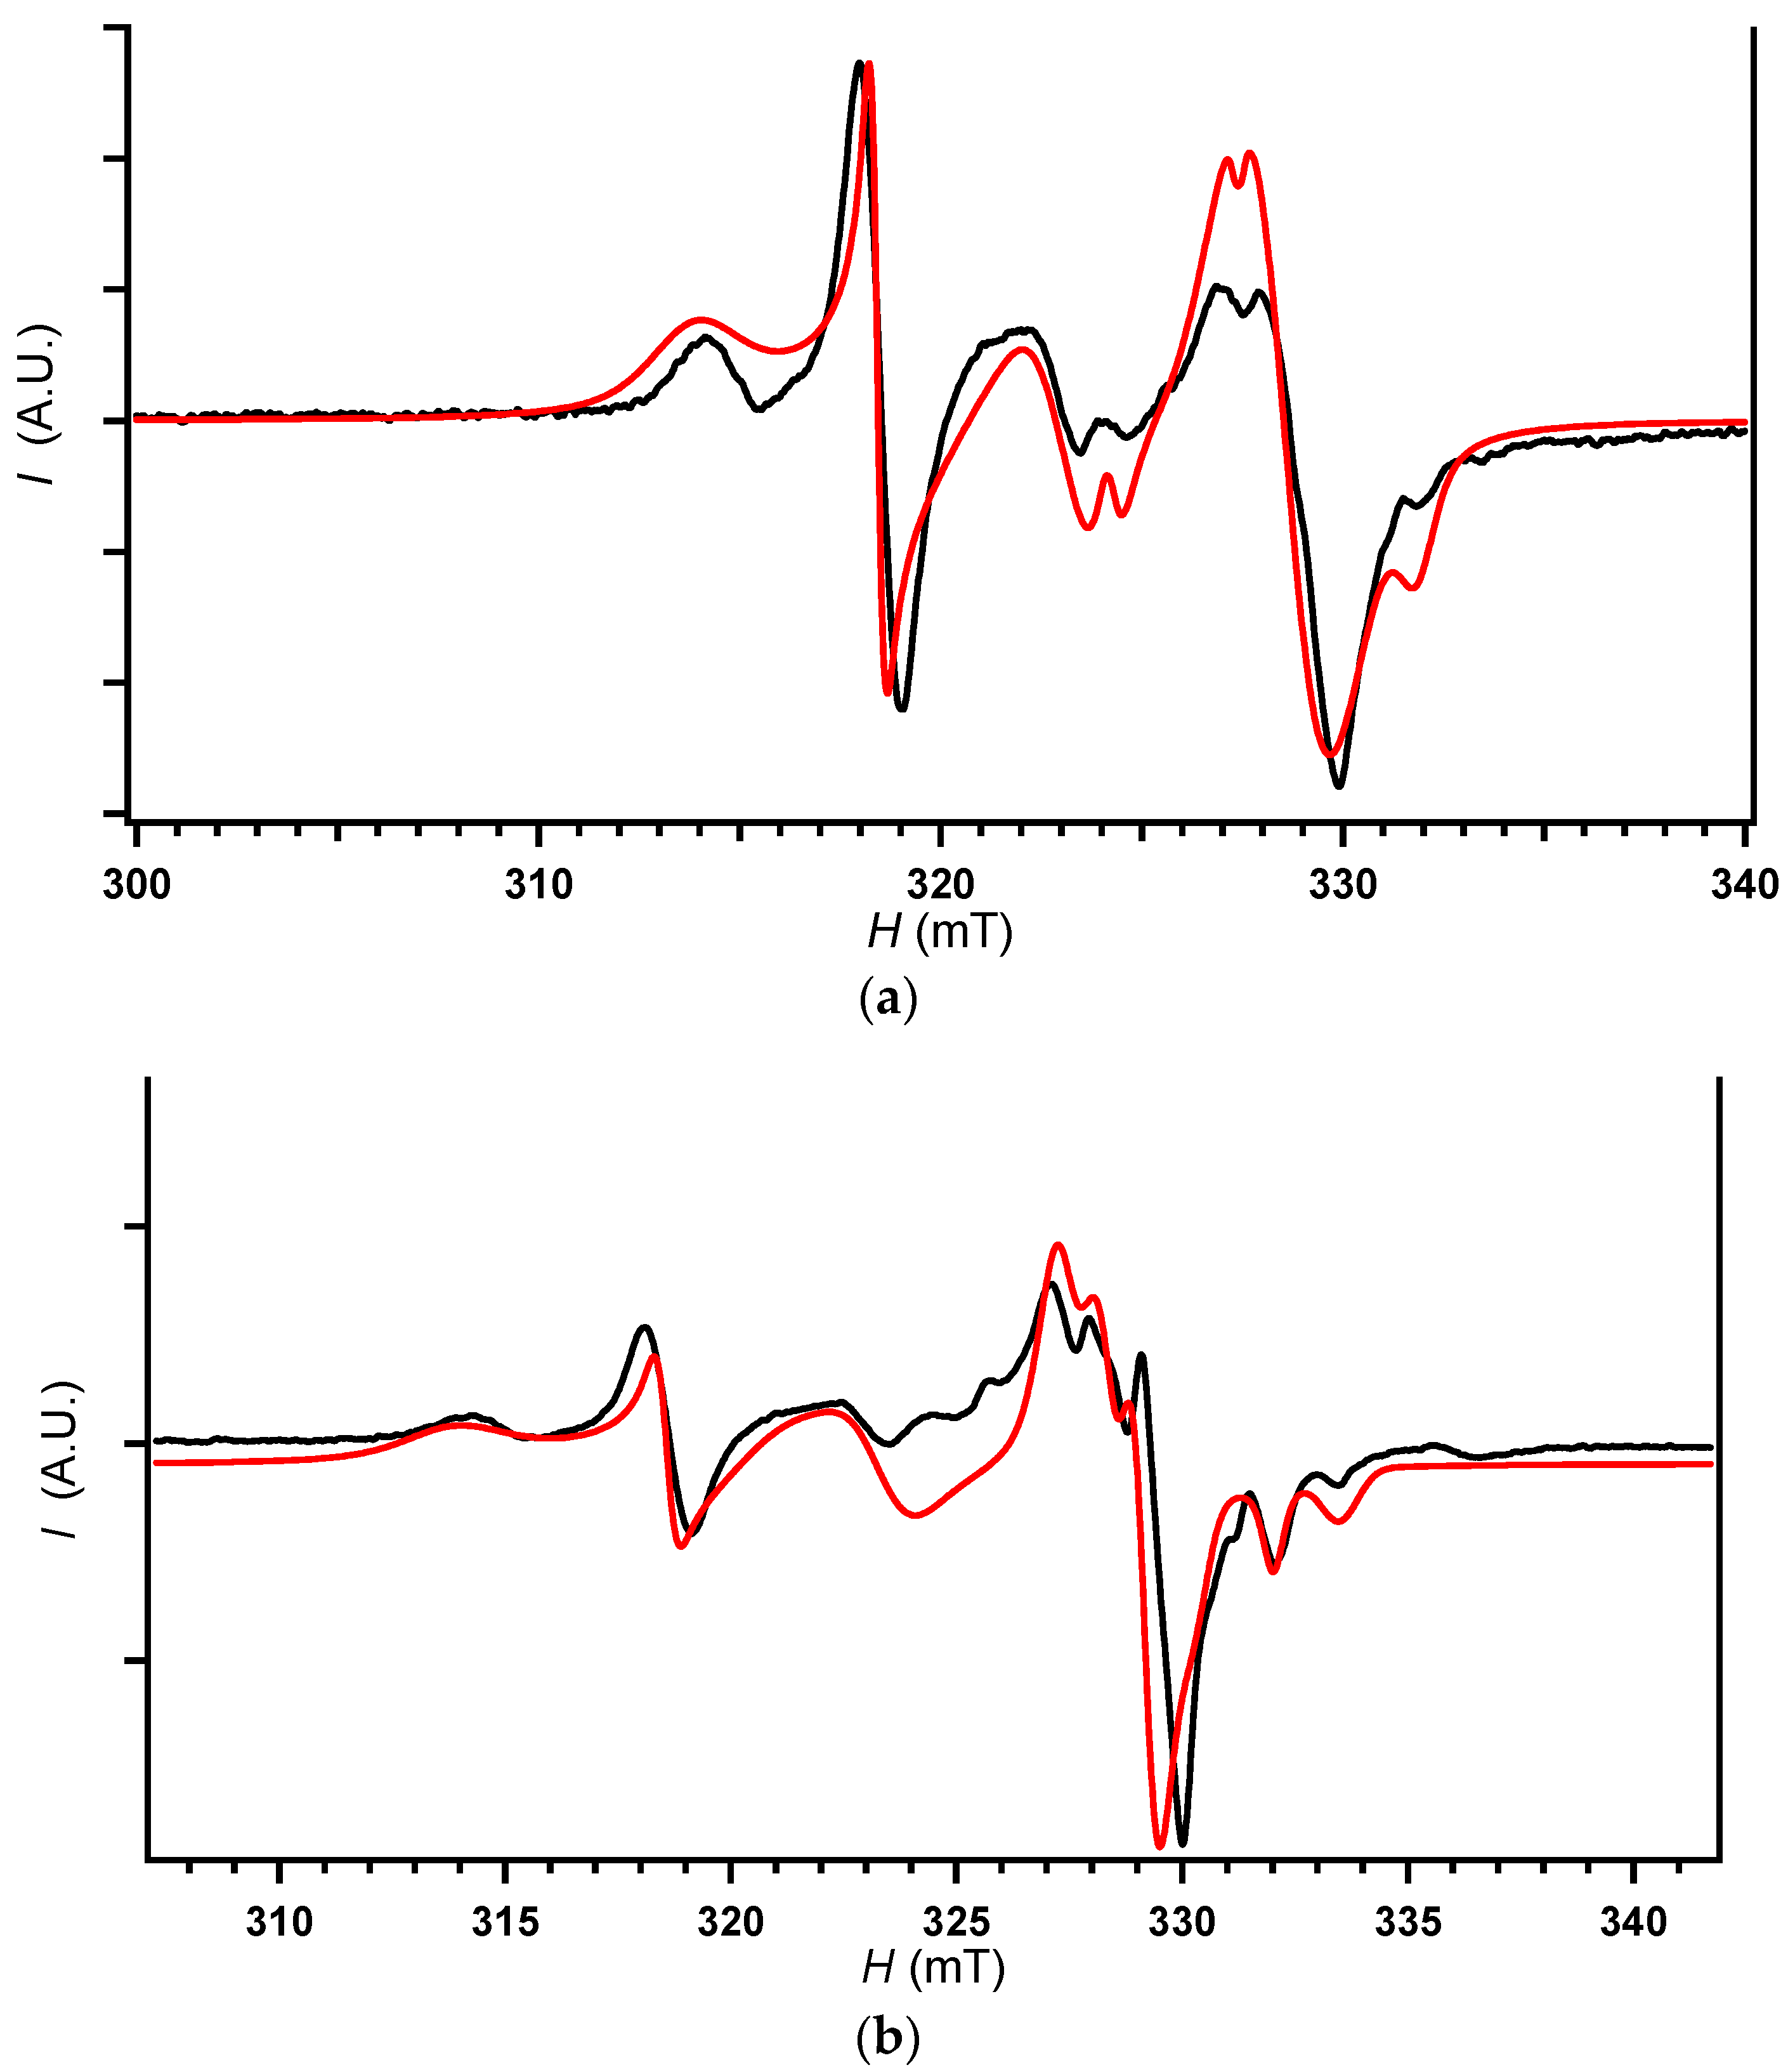
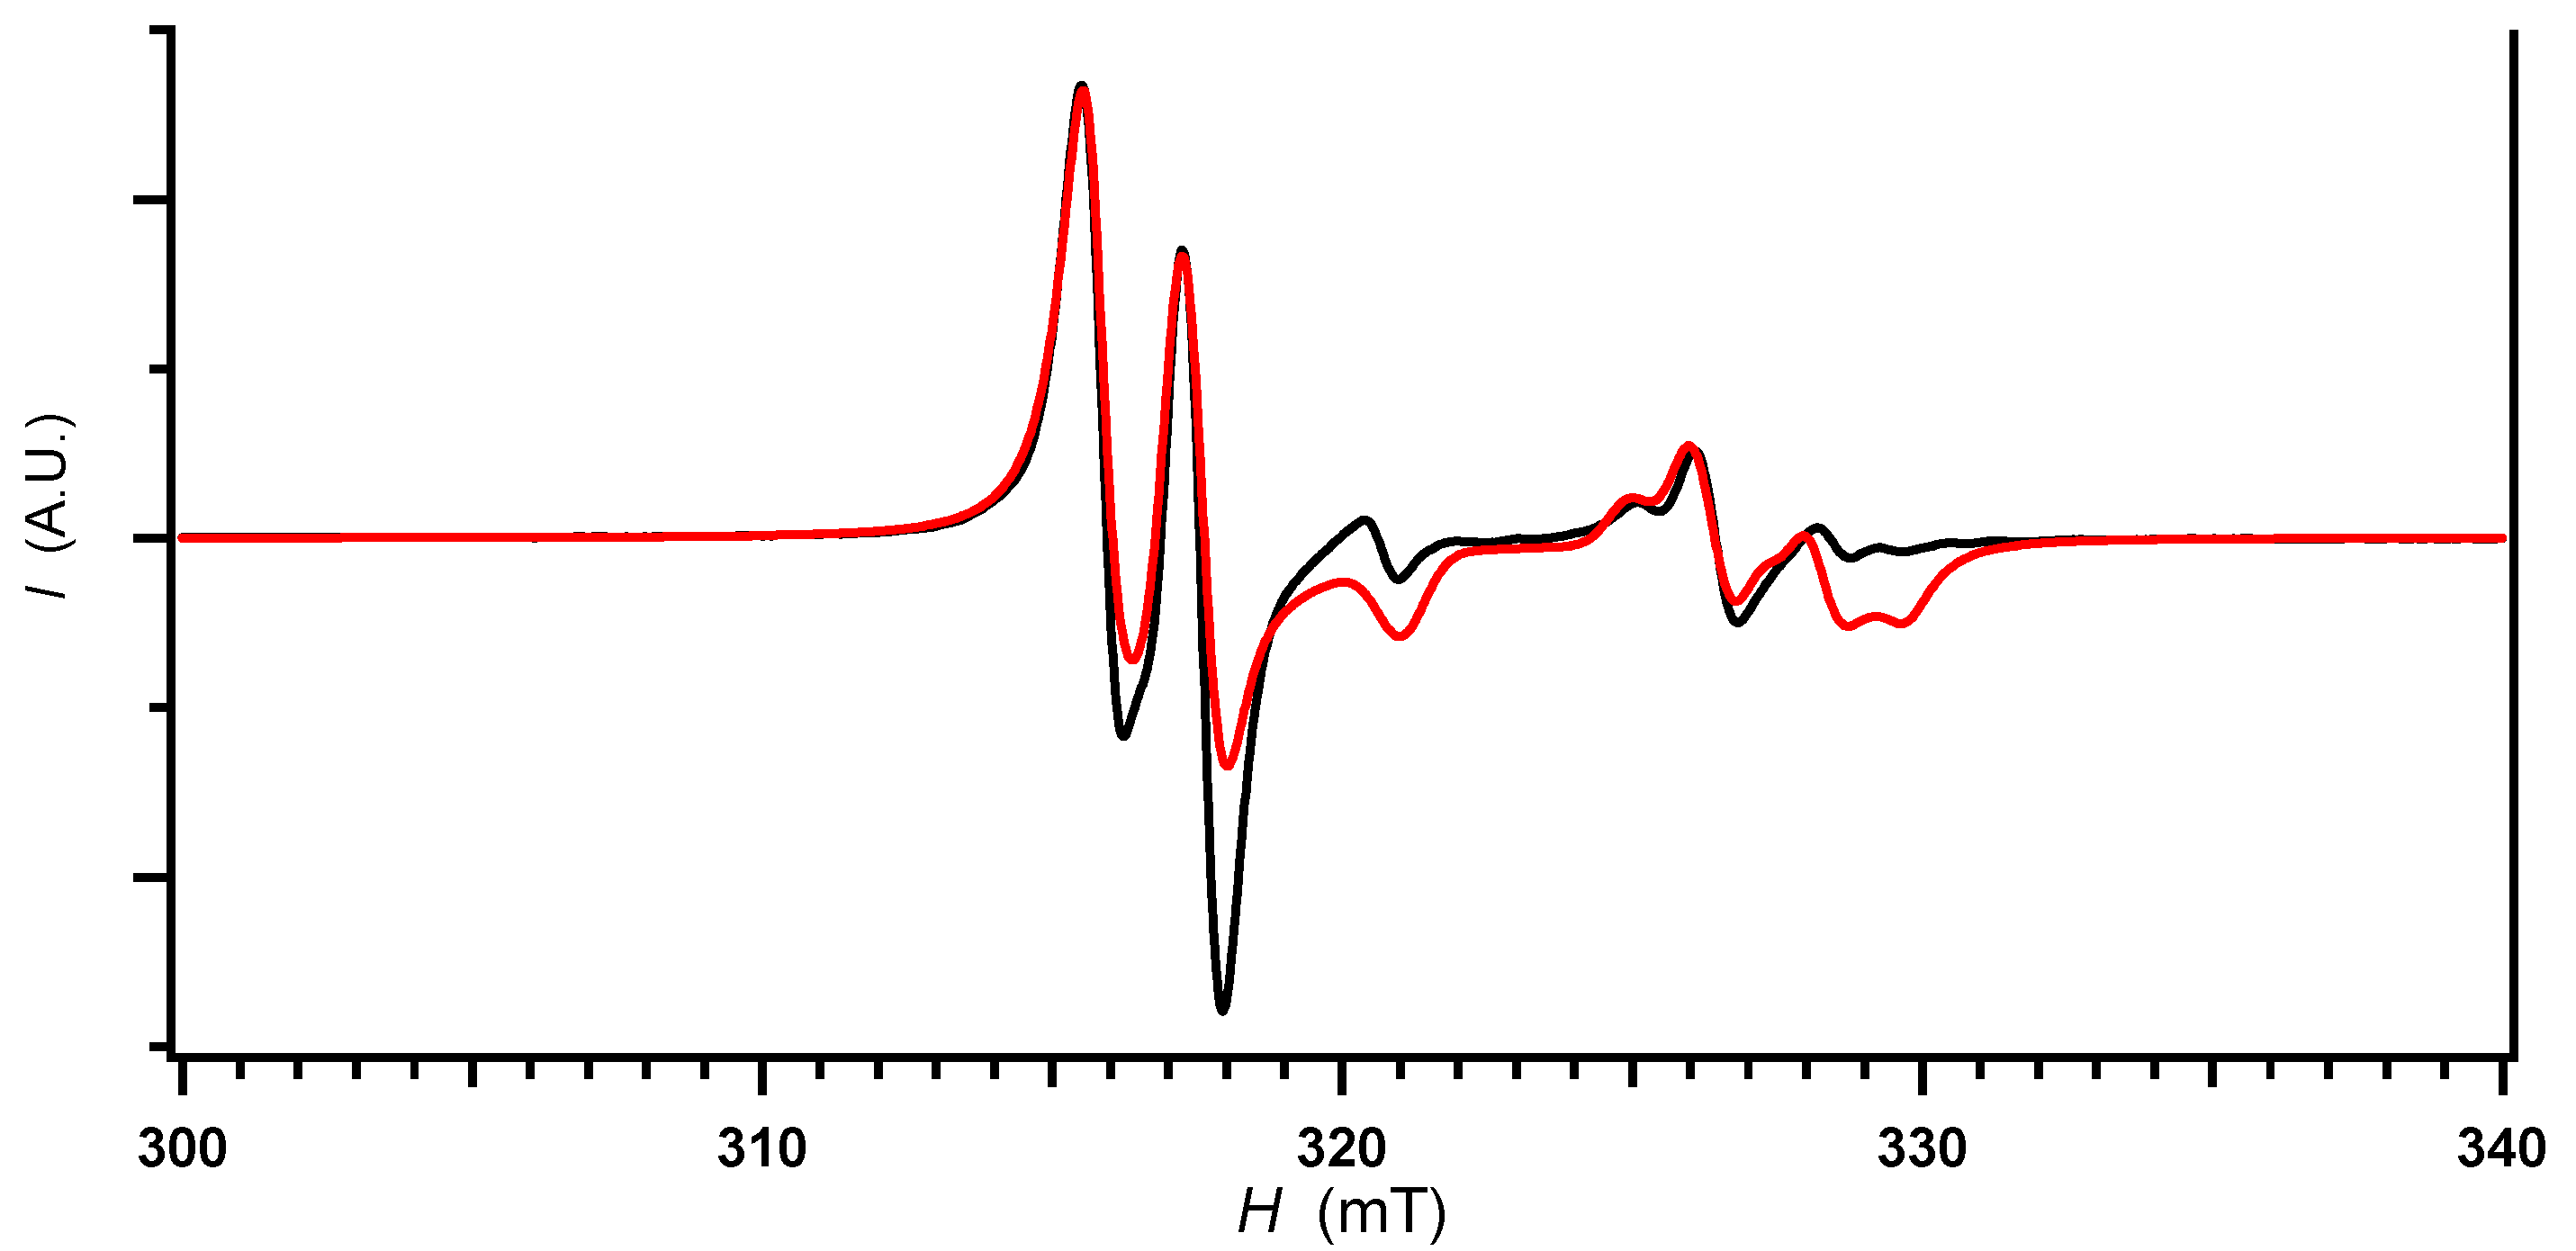
2.3. Electron Spin Resonance (ESR)
3. Discussion
3.1. Structure–Property Relations
3.2. Material Design for and beyond Photoconductors
4. Materials and Methods
4.1. Sample Preparation
4.2. X-ray Structural Analysis
4.3. Physical Measurements
4.3.1. Electrical Resistivity Measurements
4.3.2. Electron Spin Resonance (ESR)
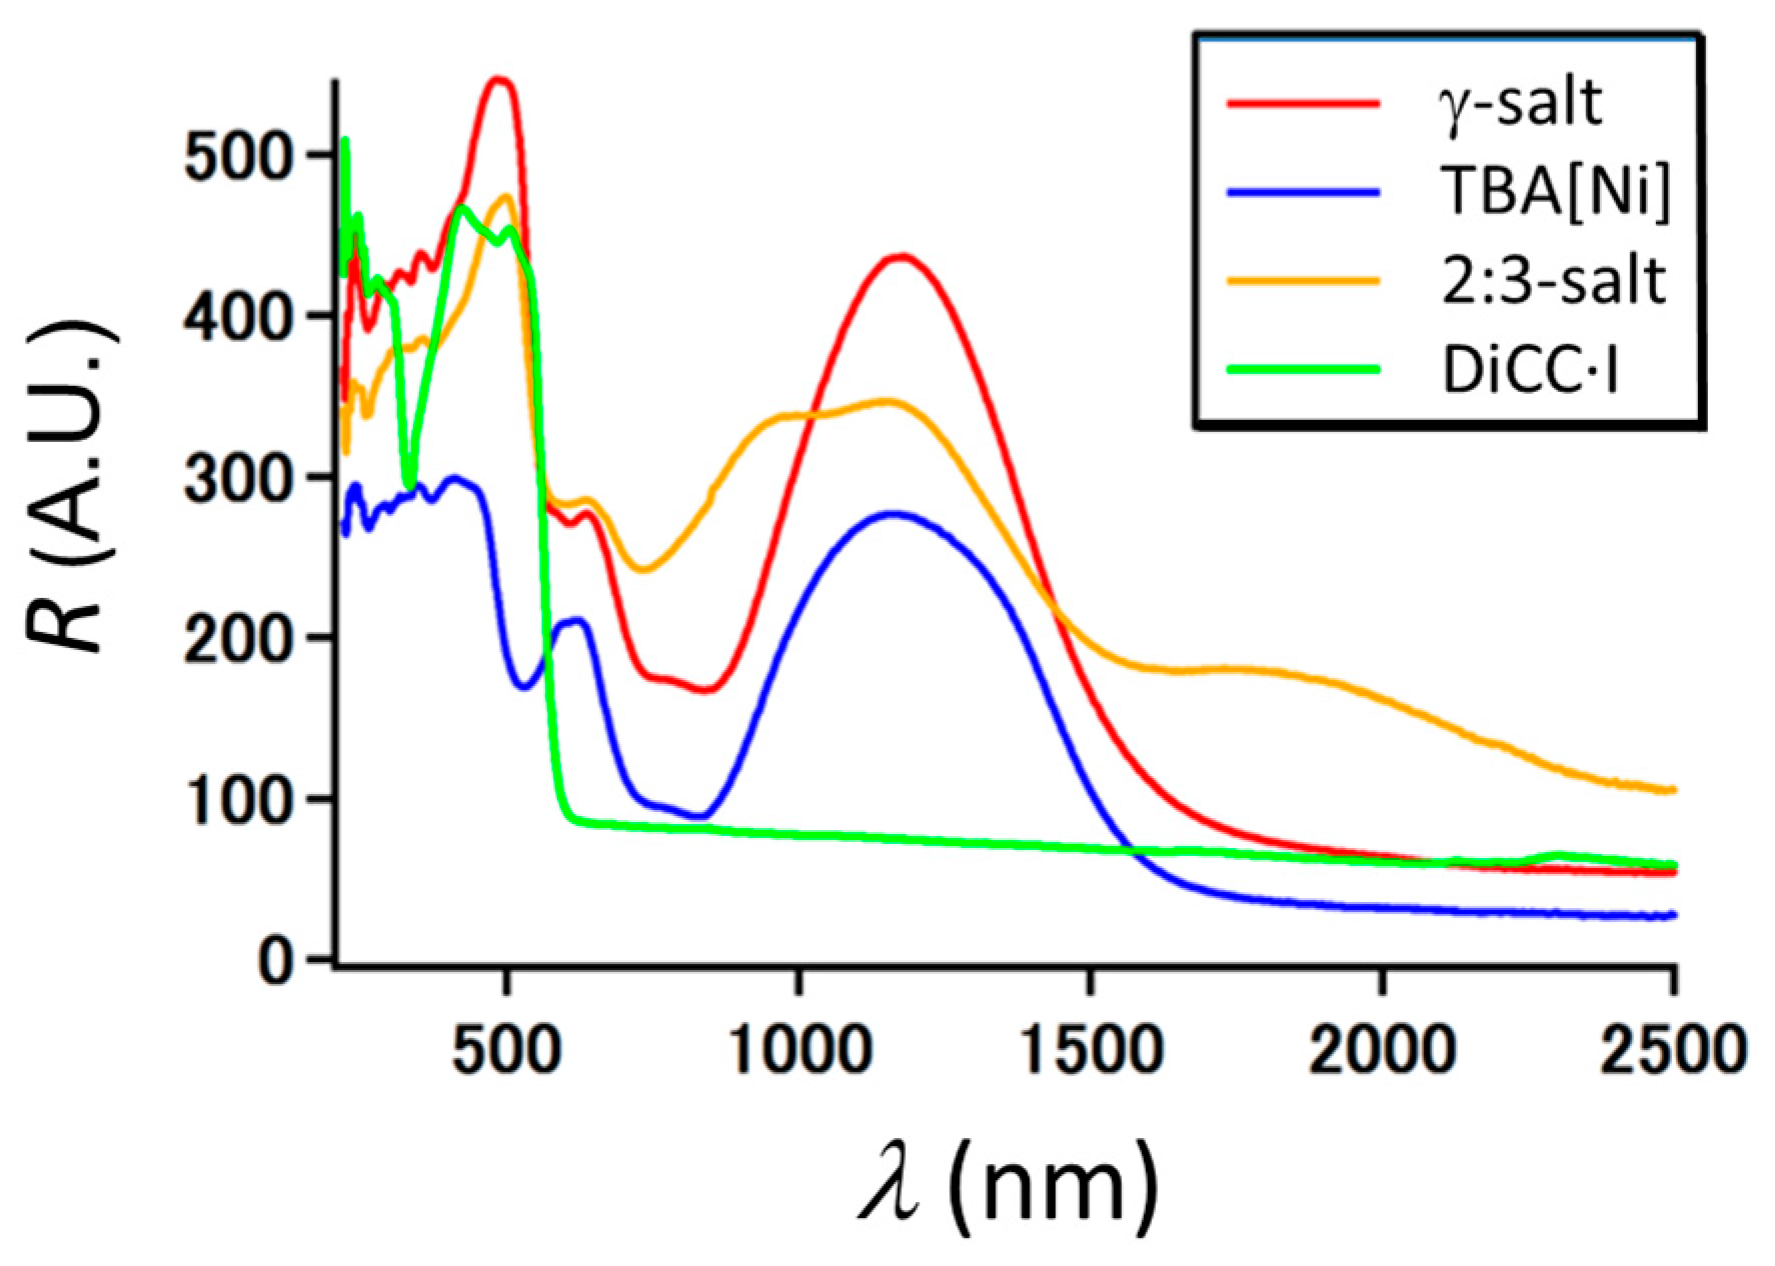
4.3.3. Diffuse Reflectance Spectra
Supplementary Materials
Acknowledgments
Author Contributions
Conflicts of Interest
Appendix A. Diffuse Reflectance Spectra
Appendix B. Electron Spin Resonance (ESR) Spectra

| Spin # c | #1 | #2 | #3 | #4 |
|---|---|---|---|---|
| Irel (%) | 82.8 | 13.9 | 1.65 | 1.65 |
| I | 0 (32S) | 0 (32S) | 1 (14N) | 1 (14N) |
| gx | 2.0855 | 2.0743 | 2.0060 | 2.0180 |
| gy | 2.0855 | 2.0743 | 2.0060 | 2.0175 |
| gz | 1.9970 | 2.0510 | 2.0058 | 2.0160 |
| Ax (mT) | NA | NA | 0.100 | 1.300 |
| Ay (mT) | NA | NA | 0.100 | 0.100 |
| Az (mT) | NA | NA | 0.100 | 0.100 |
| Γx (mT) | 0.660 | 0.700 | 0.800 | 0.700 |
| Γy (mT) | 0.660 | 0.700 | 0.800 | 0.800 |
| Γz (mT) | 0.650 | 0.800 | 1.000 | 1.000 |
| Lorentzian/Gaussian | 100/0 | 0/100 | 100/0 | 100/0 |
| Spin # b | #1 | #2 | #3 | #4 |
|---|---|---|---|---|
| Irel (%) | 82.5 | 6.19 | 1.03 | 10.3 |
| I | 0 (32S) | 0 (32S) | 1 (14N) | 1 (14N) |
| gx | 2.0980 | 2.0500 | 2.0310 | 2.0040 |
| gy | 2.0680 | 2.0400 | 2.0308 | 2.0040 |
| gz | 1.9843 | 2.0328 | 2.0112 | 2.0040 |
| Ax (mT) | NA | NA | 0.100 | 0.100 |
| Ay (mT) | NA | NA | 0.100 | 0.100 |
| Az (mT) | NA | NA | 0.100 | 0.100 |
| Γx (mT) | 2.000 | 2.000 | 0.800 | 2.200 |
| Γy (mT) | 0.300 | 1.300 | 0.300 | 2.200 |
| Γz (mT) | 0.800 | 1.000 | 0.150 | 2.200 |
| Lorentzian/Gaussian | 80/20 | 100/0 | 100/0 | 50/50 |
| Spin # b | #1 | #2 | #3 | #4 |
|---|---|---|---|---|
| Irel (%) | 63.8 | 26.6 | 7.98 | 1.60 |
| I | 0 (32S) | 0 (32S) | 1 (14N) | 1 (14N) |
| gx | 2.0980 | 2.0500 | 2.0048 | 2.0008 |
| gy | 2.0670 | 2.0370 | 2.0048 | 2.0006 |
| gz | 1.9832 | 1.9745 | 2.0043 | 2.0004 |
| Ax (mT) | NA | NA | 1.000 | 1.200 |
| Ay (mT) | NA | NA | 1.000 | 0.100 |
| Az (mT) | NA | NA | 0.100 | 0.100 |
| Γx (mT) | 2.000 | 2.000 | 0.800 | 0.600 |
| Γy (mT) | 0.400 | 1.300 | 0.800 | 0.600 |
| Γz (mT) | 0.400 | 0.800 | 0.800 | 0.600 |
| Lorentzian/Gaussian | 80/20 | 100/0 | 80/20 | 100/0 |
References
- Watanabe, T.; Honda, K. Measurement of the excitation coefficient of the methyl viologen cation radical and the efficiency of its formation by semiconductor photocatalysis. J. Phys. Chem. 1982, 86, 2617–2619. [Google Scholar] [CrossRef]
- Mohammad, M. Methyl viologen neutral MV: 1. Preparation and some properties. J. Org. Chem. 1987, 52, 2779–2782. [Google Scholar] [CrossRef]
- Yoon, K.B.; Kochi, J.K. Direct observation of superoxide electron transfer with viologens by immobilization in zeolite. J. Am. Chem. Soc. 1988, 110, 6586–6588. [Google Scholar] [CrossRef]
- Yoon, K.B.; Kochi, J.K. Shape-selective access to zeolite supercages. Arene charge-transfer complexes with viologens as visible probes. J. Am. Chem. Soc. 1989, 111, 1128–1130. [Google Scholar] [CrossRef]
- Bockman, T.M.; Kochi, J.K. Isolation and oxidation-reduction of methylviologen cation radicals. Novel disproportionation in charge-transfer salts by X-ray crystallography. J. Org. Chem. 1990, 55, 4127–4135. [Google Scholar] [CrossRef]
- Akins, D.L.; Guo, C. Photoinduced electron transfer in synthetic model systems. Adv. Mater. 1994, 6, 512–516. [Google Scholar] [CrossRef]
- Guo, J.; Nie, J.; Lv, Z. Synthesis and properties of bipyridyl-based dye-sensitizers. Res. Chem. Intermed. 2013, 39, 4247–4257. [Google Scholar] [CrossRef]
- Coe, B.J.; Sanchez, S. Synthesis and properties of new mononuclear Ru(II)-based photocatalysts containing 4,4’-diphenyl-2,2’-bipyridyl ligands. Dalton Trans. 2016, 45, 5210–5222. [Google Scholar] [CrossRef] [PubMed]
- Naito, T.; Inabe, T. Molecular conductors containing photoreactive species. J. Phys. IV 2004, 114, 553–555. [Google Scholar] [CrossRef]
- Naito, T.; Karasudani, T.; Mori, S.; Ohara, K.; Konishi, K.; Takano, T.; Takahashi, Y.; Inabe, T.; Nishihara, S.; Inoue, K. Molecular photoconductor with simultaneously photocontrollable localized spins. J. Am. Chem. Soc. 2012, 134, 18656–18666. [Google Scholar] [CrossRef] [PubMed]
- Naito, T.; Karasudani, T.; Ohara, K.; Takano, T.; Takahashi, Y.; Inabe, T.; Furukawa, K.; Nakamura, T. Simultaneous control of carriers and localized spins with light in organic materials. Adv. Mater. 2012, 24, 6153–6157. [Google Scholar] [CrossRef] [PubMed]
- Naito, T.; Karasudani, T.; Nagayama, N.; Ohara, K.; Konishi, K.; Mori, S.; Takano, T.; Takahashi, Y.; Inabe, T.; Kinose, S.; et al. Giant photoconductivity in NMQ[Ni(dmit)2]. Eur. J. Inorg. Chem. 2014, 2014, 4000–4009. [Google Scholar] [CrossRef]
- Saiki, T.; Mori, S.; Ohara, K.; Naito, T. Capacitor-like behavior of molecular crystal β-DiCC[Ni(dmit)2]. Chem. Lett. 2014, 43, 1119–1121. [Google Scholar] [CrossRef]
- Noma, H.; Ohara, K.; Naito, T. [Cu(dmit)2]2− Building block for molecular conductors and magnets with photocontrollable spin distribution. Chem. Lett. 2014, 43, 1230–1232. [Google Scholar] [CrossRef]
- Noma, H.; Ohara, K.; Naito, T. Direct control of spin distribution and anisotropy in Cu-dithiolene complex anions by light. Inorganics 2016, 4. [Google Scholar] [CrossRef]
- Naito, T. Development of control method of conduction and magnetism in molecular crystals. Bull. Chem. Soc. Jpn. 2017, 90, 89–136. [Google Scholar] [CrossRef]
- Kisch, H.; Fernández, A.; Wakatsuki, Y.; Yamazaki, H. Charge transfer complexes of nickel dithiolenes with methyl viologen. Z. Naturforsch. 1985, 40B, 292–297. [Google Scholar] [CrossRef]
- Fernández, A.; Görner, H.; Kisch, H. Photoinduzierte elektronenübertragung mit metalldithiolenen. Chem. Berichte 1985, 118, 1936–1948. [Google Scholar] [CrossRef]
- Lahner, S.; Wakatsuki, Y.; Kisch, H. Charge-transfer-komplexe von metalldithiolenen mit viologenen. Chem. Berichte 1987, 120, 1011–1016. [Google Scholar] [CrossRef]
- Nüßlein, F.; Peter, R.; Kisch, H. Viologene als redoxaktive akzeptoren–synthese und electrische leifähigkeit. Chem. Berichte 1989, 122, 1023–1030. [Google Scholar] [CrossRef]
- Kisch, H.; Nüsslein, F.; Zenn, I. Molekulare steuerung von festkörpereigenschaften: Die elecktrische leitfähigkeit von metal-organischen charge-transfer komplexen. Z. Anorg. Allg. Chem. 1991, 600, 67–71. [Google Scholar] [CrossRef]
- Kisch, H.; Dümler, W.; Nüßlein, F.; Zenn, I.; Chiorboli, C.; Scandola, F.; Albrecht, W.; Meier, H. Consequences of thermal and photochemical electron transfer on solution and solid state properties of metal organic ion pairs. Z. Phys. Chem. 1991, 170, 117–127. [Google Scholar]
- Meier, H.; Albrecht, W.; Kisch, H.; Nunn, I.; Nüsslein, F. Photoconductivity of metal dithiolate ion-pair complexes. Synth. Met. 1992, 48, 111–127. [Google Scholar] [CrossRef]
- Kisch, H. Charge-transfer in ion pairs: Design of photoconductivity in solution and electrical dark-and photoconductivity in the solid. Coord. Chem. Rev. 1993, 125, 155–172. [Google Scholar] [CrossRef]
- Lemke, M.; Knoch, F.; Kisch, H. Structure of the ion-pair charge-transfer complex (methylviologen)2+[Pd(mnt)2]2−. Acta Cryst. 1993, C49, 1630–1632. [Google Scholar] [CrossRef]
- Nunn, I.; Eisen, B.; Benedix, R.; Kisch, H. Control of electrical conductivity by supramolecular charge-transfer interactions in (dithiolene)metalate-viologen ion pairs. Inorg. Chem. 1994, 33, 5079–5085. [Google Scholar] [CrossRef]
- Kisch, H. Electron transfer modelling of electrical dark- and photoconductivity of redoxactive ion pairs. Comments Inorg. Chem. 1994, 16, 113–132. [Google Scholar] [CrossRef]
- Knoch, F.; Ammon, U.; Kisch, H. Crystal structure of N,N’-dimethyl-2,2′-bipyridinium bis(cis-1,2-dicyanoethane-1,2-dithiolato)palatinate(II), ((CH3)C5NH4C5NH4(CH3))(Pt(S2C2(CN)2)2). Z. Kristallographie 1995, 210, 77–78. [Google Scholar]
- Hofbauer, M.; Möbius, M.; Knoch, F.; Benedix, R. Ion-pair charge-transfer complexes of a dithiooxalate zinc donor component with viologens. Synthesis, structural and electronic characterization. Inorg. Chim. Acta 1996, 247, 147–154. [Google Scholar] [CrossRef]
- Götz, B.; Knoch, F.; Kisch, H. Bis(maleonitriledithiolato)oxomolybdate(IV)-bipyridinium ion pairs. Chem. Berichte 1996, 129, 33–37. [Google Scholar] [CrossRef]
- Kisch, H. Tailoring of solid state electrical conductivity and optical electron transfer activation of dioxygen in solution through supramolecular charge-transfer interaction in ion pairs. Coord. Chem. Rev. 1997, 159, 385–396. [Google Scholar] [CrossRef]
- Handrosch, C.; Dinnebier, R.; Bondarenko, G.; Bothe, E.; Heinemann, F.; Kisch, H. Charge-transfer complexes of metal dithiolenes XXVI Azobipyridinium dications and radical monocations as acceptors. Eur. J. Inorg. Chem. 1999, 1999, 1259–1269. [Google Scholar] [CrossRef]
- Kisch, H.; Eisen, B.; Dinnebier, R.; Shankland, K.; David, W.I.F.; Knoch, F. Chiral metal-dithiolene/viologen ion pairs: Synthesis and electrical conductivity. Chem. Eur. J. 2001, 7, 738–748. [Google Scholar] [CrossRef]
- Steimecke, G.; Sieler, H.-J.; Kirmse, R.; Hoyer, E. 1,3-dithiol-2-thion-4,5-dithiolat aus schwefelkohlenstoff und alkalimetall. Phosphorus Sulfur 1979, 7, 49–55. [Google Scholar] [CrossRef]
- Yordanov, N.D. Quantitative EPR spectrometry—“State of the art”. Appl. Magn. Reson. 1994, 6, 241–257. [Google Scholar] [CrossRef]
- Kai, A.; Miki, T. Electron spin resonance of sulfite radicals in irradiated calcite and aragonite. Radiat. Phys. Chem. 1992, 40, 469–476. [Google Scholar] [CrossRef]
- Inokuchi, H.; Kinoshita, M. The oxygen effect on electronic properties of α,α′-diphenyl-β-picrylhydrazyl. Bull. Chem. Soc. Jpn. 1960, 33, 1627–1629. [Google Scholar] [CrossRef]


| Salt | γ | δ | 2:3 |
|---|---|---|---|
| Cation:Anion | 1:1 | 1:1 | 2:3 |
| Formula | C35H37N2NiO2S10 | C35H37N2NiO2S10 | C76H74N4Ni3O4S30 |
| M (g mol−1) | 896.99 | 896.99 | 2245.26 |
| Temperature (K) | 296 | 296 | 296 |
| Crystal system | Triclinic | Monoclinic | Triclinic |
| Space Group | P(#2) | P21/n (#14) | P(#2) |
| a (Å) | 8.36861(17) | 10.8163(5) | 7.7933(4) |
| b (Å) | 13.7285(3) | 30.5876(12) | 12.7677(6) |
| c (Å) | 18.2519(4) | 12.4468(5) | 25.2676(10) |
| α (°) | 79.6321(11) | − | 76.977(2) |
| β (°) | 80.7564(11) | 95.6803(17) | 88.978(3) |
| γ (°) | 83.0074(11) | − | 76.505(3) |
| V (Å3) | 2026.57(7) | 4097.7(3) | 2380.29(19) |
| Z | 2 | 4 | 1 |
| Dcalc (g cm−3) | 1.470 | 1.454 | 1.566 |
| μ (Cu Kα) (cm−1) | 57.784 | 57.155 | 72.288 |
| CCDC deposit # | 1526722 | 1526720 | 1526726 |
| Reflection/Parameter | 15.82 | 16.49 | 15.87 |
| Max peak (e−/Å3) | 0.66 | 0.63 | 0.89 |
| Min peak (e−/Å3) | −0.48 | −0.71 | −0.60 |
| R1, wR2 | 0.0563 1, 0.1950 2 | 0.0731 1, 0.2486 2 | 0.0733 1, 0.2194 2 |
| GOF | 1.124 | 1.038 | 0.929 |
| Max Shift/Error | 0.007 | 0.000 | 0.066 |
| Salts | Dark Conductivity σdark (Scm−1) | Photoconductivity 1 σphoto (Scm−1) | σphoto/σdark | Anion–Anion Interaction 2 | Cation–Anion Interaction 2 |
|---|---|---|---|---|---|
| γ | 7.9 × 10⁻⁹ | 7.9 × 10⁻⁹ | 1 | Uneven | Weak |
| δ | 8.6 × 10⁻⁷ | 5.2 × 10⁻⁶ | 6 | Very weak | Moderate |
| 2:3 | 8.3 × 10⁻⁹ | 8.3 × 10⁻⁹ | 1 | Strongly dimerized columns | Strong |
| Salt | Direction | Start (V) | End (V) | Interval (V) |
|---|---|---|---|---|
| γ | // a-axis | 100 | 500 | 100 |
| δ | // a-axis | 20 | 100 | 20 |
| 2:3 | ~// a-axis 2 | 100 | 500 | 100 |
| Salt | Wavelength Range (1) (nm) | Intensity (1) (Wcm−2) | Wavelength Range (2) (nm) | Intensity (2) (Wcm−2) |
|---|---|---|---|---|
| γ | 254–450 | 6.7 | 254–1100 | 12.3 |
| δ | 254–450 | 6.7 | NA | NA |
| 2:3 | 254–450 | 6.7 | 254–1100 | 12.3 |
© 2017 by the authors. Licensee MDPI, Basel, Switzerland. This article is an open access article distributed under the terms and conditions of the Creative Commons Attribution (CC BY) license (http://creativecommons.org/licenses/by/4.0/).
Share and Cite
Yamamoto, R.; Yamamoto, T.; Ohara, K.; Naito, T. Dye-Sensitized Molecular Charge Transfer Complexes: Magnetic and Conduction Properties in the Photoexcited States of Ni(dmit)2 Salts Containing Photosensitive Dyes. Magnetochemistry 2017, 3, 20. https://doi.org/10.3390/magnetochemistry3020020
Yamamoto R, Yamamoto T, Ohara K, Naito T. Dye-Sensitized Molecular Charge Transfer Complexes: Magnetic and Conduction Properties in the Photoexcited States of Ni(dmit)2 Salts Containing Photosensitive Dyes. Magnetochemistry. 2017; 3(2):20. https://doi.org/10.3390/magnetochemistry3020020
Chicago/Turabian StyleYamamoto, Ryoma, Takashi Yamamoto, Keishi Ohara, and Toshio Naito. 2017. "Dye-Sensitized Molecular Charge Transfer Complexes: Magnetic and Conduction Properties in the Photoexcited States of Ni(dmit)2 Salts Containing Photosensitive Dyes" Magnetochemistry 3, no. 2: 20. https://doi.org/10.3390/magnetochemistry3020020