Article

Mapping the Magnetic Anisotropy inside a Ni4 Cubane Spin Cluster Using Polarized Neutron Diffraction

1
Laboratoire des Multimatériaux et Interfaces, UMR CNRS 5615, Université Claude Bernard Lyon 1, 69622 Villeurbanne cedex, France
2
Laboratory of Inorganic Chemistry, Institut de Chimie Moléculaire et des Matériaux d’Orsay (ICMMO), UMR CNRS 8182, Université Paris-Sud, 91405 Orsay cedex, France
3
Laboratoire Léon Brillouin (LLB), CEA-CNRS, UMR CNRS 12, C.E.A. Saclay, 91191 Gif-sur-Yvette, France
4
SCIB, UMR-E 3 CEA/UJF-Grenoble 1, INAC, CEA-UJF, F-38054 Grenoble, France
*
Author to whom correspondence should be addressed.
Present address: Gebze Technical University, P.O. Box: 141, Gebze, Kocaeli 41400, Turkey and Institute of Applied Physics Academy of Sciences of R. Moldova, Academy Str. 5, MD2028 Chisinau, Moldova.
Present address: Institut de physique et chimie des matériaux de Strasbourg (IPCMS), UMR7504, 23 Rue du Loess, 67034 Strasbourg, France.
Magnetochemistry 2017, 3(3), 25; https://doi.org/10.3390/magnetochemistry3030025
Submission received: 24 April 2017 / Revised: 1 June 2017 / Accepted: 3 July 2017 / Published: 13 July 2017
(This article belongs to the Special Issue Transition Metal Magnetism)

Abstract

:
In this publication, we report on the study of the magnetic anisotropy of the cubane type tetranuclear cluster of Ni(II), [Ni4(L)4(MeOH)4] (H2L = salicylidene-2-ethanolamine; MeOH = methanol), by the means of angular-resolved magnetometry and polarized neutron diffraction (PND). We show that better than other usual characterization techniques—such as electron paramagnetic resonance spectroscopy (EPR) or SQUID magnetometry—only PND enables the full determination of the local magnetic susceptibility tensor of the tetranuclear cluster and those of the individual Ni(II) ions and the antiferromagnetic pairs they form. This allows highlighting that, among the two antiferromagnetic pairs in the cluster, one has a stronger easy-axis type anisotropy. This distinctive feature can only be revealed by PND measurements, stressing the remarkable insights that they can bring to the understanding of the magnetic properties of transition metals clusters.

1. Introduction

One of the present challenges in the field of molecular magnetism consists in understanding how to have the magnetic anisotropy under control, in order to design SMMs (single molecule magnets) with high blocking temperatures. This, indeed, requires the presence of a strong uniaxial magnetic anisotropy and, hence, a good knowledge of the magneto-structural relationships at the molecular level [1,2] Side by side with numerous theoretical studies based on quantum calculations [3,4,5], such knowledge has been greatly improved by the use of experimental methods, such as electron paramagnetic resonance spectroscopy (EPR) [6] or, more recently, by angular-resolved or torque magnetometry [7,8]. The main difficulty with these methods is to access the local magnetic anisotropy even when performed on single crystals. We recently showed that polarized neutron diffraction (PND) provides a unique tool to establish precise magneto-structural relationships in mononuclear and dinuclear transition metal complexes of Fe3+ and Co2+ ions [9,10]. In this paper we report the study, by angular-resolved magnetometry and polarized neutron diffraction, of the magnetic anisotropy of the [Ni4(L)4(MeOH)4] cluster (Figure 1), so-called [Ni4]. This complex presents a S = 4 paramagnetic ground spin-state resulting from dominant ferromagnetic interactions between two weakly antiferromagnetic Ni pairs, but shows no SMM behavior. The nature of the magnetic anisotropy of the [Ni4] cluster was previously investigated by the means of inelastic neutron scattering (INS) on powder [11] which showed the existence of a large easy-axis type anisotropy. The aim of the present study is to show how PND permits to map precisely the local magnetic anisotropy inside polynuclear complexes in the weak exchange limit, here in the case of a paramagnetic cubane-like tetranuclear Ni2+ complex.
The [Ni4] cluster crystallizes in the monoclinic space group P21/n, with cell parameters a = 13.0750(9) Å, b = 18.2933(10) Å, c = 18.7624(13) Å and β = 110.260(7) deg, with two different molecular orientations in the cell [11]. Following the classification of polynuclear complexes with cubane like structure [12] [Ni4] is a class II cluster, characterized by a distorted [Ni4O4] cubane core with alkoxo bridges, presenting four short and two long Ni…Ni distances (type 4+2 structure), with an approximate S4 symmetry (Figure 1c). Angular-resolved SQUID measurements provide the crystal (lattice) magnetic anisotropy but not the individual molecular principal magnetic axes because of the existence of two different molecular orientations in the cell, nor the local magnetic anisotropy on each Ni site. In contrast, PND measurements under a moderate magnetic field applied along different directions of the crystal allows to determine the local susceptibility tensor of the cluster and the directions of its principal axes with respect to its geometry. This cluster tensor can be written as the sum of so-called effective tensors [10], which are defined as single ion tensors perturbed by the magnetic exchange between Ni(II) ions. In the following, we show how PND gives access to both the single ion and effective tensors of the antiferromagnetic pairs in the cluster.

2. Materials and Methods

2.1. Synthesis

The [Ni4(L)4(MeOH)4] cluster was prepared as described in [11], where L2− is the bis-deprotonated ligand represented in Figure 1a. Large single crystals (size 9–12 mm3) were obtained by slow diffusion of methanol to a solution of [Ni4(L)4(MeOH)4] in ethyl acetate (EtOAc): the green precipitate of [Ni4(L)4(MeOH)4] was solubilized in a small quantity of EtOAc, then the obtained solution was filtered and carefully transferred into a long glass tube. The tube was inserted inside a HLC TK13 heating-block thermostat keeping the crystallization temperature constant. The solution was carefully layered with the same volume of pure EtOAc in order to avoid immediate mixing. Finally, a small volume of methanol was carefully added, the tube was closed and left undisturbed for about a month. The bottom part of the tube was constantly heated to 40 °C. After one month, large green single crystals were formed.

2.2. Magnetic Measurements

Magnetic measurements were performed at the CEA Grenoble with a Quantum Design (San Diego, CA, USA) SQUID magnetometer on polycrystalline samples using a PTFE sample holder and on a face-indexed single crystal using a rotator for angular resolved measurements.
Angle-resolved susceptibility measurements were performed on a single-crystal of (2 × 2 × 3 mm3) under a magnetic field of 0.1 T and at 10 K, temperature of the PND study. The orientation of the crystal on the magnetometer was set manually: Set 1: the crystal was set with the c axis along the rotation axis; Set 2: the crystal was set with the b axis along the rotation axis. In both cases, the a axis was initially set along the magnetic field (rotation angle Φ = 0).

2.3. Simulation of Angular-Resolved Magnetic Measurements

In order to further analyze the agreement between the single-crystal SQUID magnetic measurements and the PND experiments, we tentatively simulated the dependence of the magnetic susceptibility versus the rotation angle (Φ) using the cluster susceptibility tensor χ obtained from PND.
To do this, we implemented a Fortran 90 routine called CalcM. The source code of the program and more information about the algorithm are given in the Supplementary Materials. Basically, this program computes the magnetic moment for a user-defined set of magnetic field orientations H , magnetic susceptibility tensor χ for one molecule, and the symmetry equivalent positions in the considered lattice. More precisely, if we call C i the transformation matrices that link the n symmetry equivalent positions in the lattice to the asymmetric unit, the measured magnetic moment for the bulk can be expressed as:
m = 1 n i = 1 n ( C i 1 × χ × C i ) H H H H ,
where we assumed n = 1 accounts for the asymmetric unit.
For the present study, only two equivalent positions have to be considered, as we are dealing with a centrosymmetric monoclinic lattice: the asymmetric unit and its image by a mirror plane perpendicular to the crystal b axis. Accordingly we tentatively simulated the two sets of data given as rotation around the c (Set 1) and b axes (Set 2) for which we, thus, considered two lists of magnetic field orientations:
Set 1: Considering a crystal rotating around the c axis and a magnetic field initially parallel to the a axis, one may write, in the ( i , j , k )frame (with i // a * , j // b , k // c ), the magnetic field as:
H = ( cos ( ) sin ( ) 0 ) ,
Set 2: It was not possible to simulate the experimental data considering a rotation around the b axis and the magnetic field initially along the a axis. A rotation around an axis comprised in the ( b , c * ) plane was instead considered, with a field initially parallel to a . Calling ω the angle between the rotation axis and the crystal b axis, and Φ the rotation angle we can express the orientation of the magnetic field in the ( i , j , k ) frame as:
H = ( M 1 × R = × M ) H 0 ,
where H 0 is the initial orientation of the magnetic field:
H 0 = ( cos ( β 90 ° ) 0 sin ( β 90 ° ) ) ,
R is the rotation matrix around the axis written in an intermediate (but handier) orthonormal frame ( e , f , g ) with e // a , f // b , g // c * :
R = = ( cos s i n   ω   s i n   cos ω sin sin ω sin cos 2 ω cos ω sin ω ( 1 cos ) cos ω sin cos ω sin ω ( 1 cos ) sin 2 ω ( 1 cos ) + cos ) ,
and M the change of basis matrix from ( e , f , g ) to ( i , j , k ):
M = ( c o s ( β 90 ° ) 0 sin ( β 90 ° ) 0 1 0 sin ( β 90 ° ) 0 cos ( β 90 ° ) ) ,

2.4. Neutron Diffraction

2.4.1. Polarized Neutron Diffraction

The expression of the flipping ratio measured in a PND experiment for the Bragg reflection of scattering vector Q is:
R ( Q ) = I + I ,
where I+ and I are the intensities which are diffracted by the crystal when the incident neutron beam has alternate up (+) and down (−) directions of vertical polarization.
The diffracted intensities can be expressed in terms of the nuclear structure factor F N ( Q ) and the magnetic structure factor F M ( Q ) , which is a vector, whose direction depends on the local orientations of the magnetic moments in the sample with respect to the vertical magnetic field H . For a centrosymmetric space group, structure factors are real quantities and the flipping ratio has the following expression:
R ( Q ) = F N 2 + F M 2 + 2 P F N F M z F N 2 + F M 2 2 e P F N F M z ,
where P is the vertical beam polarization, e the flipping efficiency, F M is the projection of F M ( Q ) onto a plane perpendicular to the scattering vector Q and F M z is the component of F M along the vertical Z direction.
The local susceptibility approach for paramagnets consists in writing the local magnetic moment m i of an atom i as the product of the local susceptibility tensor χ i by the applied field H [13]. The magnetic structure factor can then be written as a sum over the cell of the induced atomic magnetic moment m i characterized by the magnetic form factor f m i ( Q ) :
F M ( Q ) = i c e l l χ i H f m i ( Q ) e i Q . r ,
The flipping ratio measurements then allows to determine the six components χij of the susceptibility tensor, provided the data are collected under a moderate magnetic field in order to ensure a linear magnetization behavior, for three successive orthogonal orientations with respect to the crystal.
Flipping ratio measurements were performed at 10 K on the polarized neutron diffractometer 5c1 at LLB-Orphée (Saclay, France) on a single crystal of pyramidal shape (3 × 2 × 1.5) mm3, for three different orientations of the crystal with respect to the vertical applied magnetic field (see Table 1). The same sample was used on the 5c2 diffractometer. From the magnetization curve at 10 K, it appears magnetization remains linear with field at 2 T, whatever the field orientation with respect to the crystal lattice. Therefore, data collection for the magnetic susceptibility tensor determination were performed at 10 K under 2 T.

2.4.2. Unpolarized Neutron Diffraction

A complementary unpolarized neutron diffraction data collection was performed on the 4-circle diffractometer 5c2 at LLB-Orphée, on the same sample as used for 5c1, cooled to 20 K in a fridge, in order to determine the thermal parameters at low temperature. The details of the data collection are reported in Table 2. The cell parameters from [3] were used for the data collection at 20 K. The integrated nuclear intensities were measured for 91 reflections only, which had previously been observed by PND on 5c1. Due to the low number of observations, the position parameters of all atoms were fixed to their room temperature values as obtained from X-ray diffraction, and only isotropic thermal parameters were refined. The JANA program [14] was used for the refinement. Atoms of the same element were constrained to have the same Uiso thermal parameter. The thermal parameters for the Ni atoms were fixed to zero. Only five parameters were refined on 91 reflections (scale factor and Uiso(C), Uiso(N), Uiso(O), Uiso(H)) using 109 constraints. The following thermal parameters were obtained: Uiso(C) = 0.008(6), Uiso(N) = 0.013(14), Uiso(O) = 0.018(19), Uiso(H) = 0.070(13) and used to calculate the nuclear structure factors that are necessary for the PND data analysis.

3. Results and Discussion

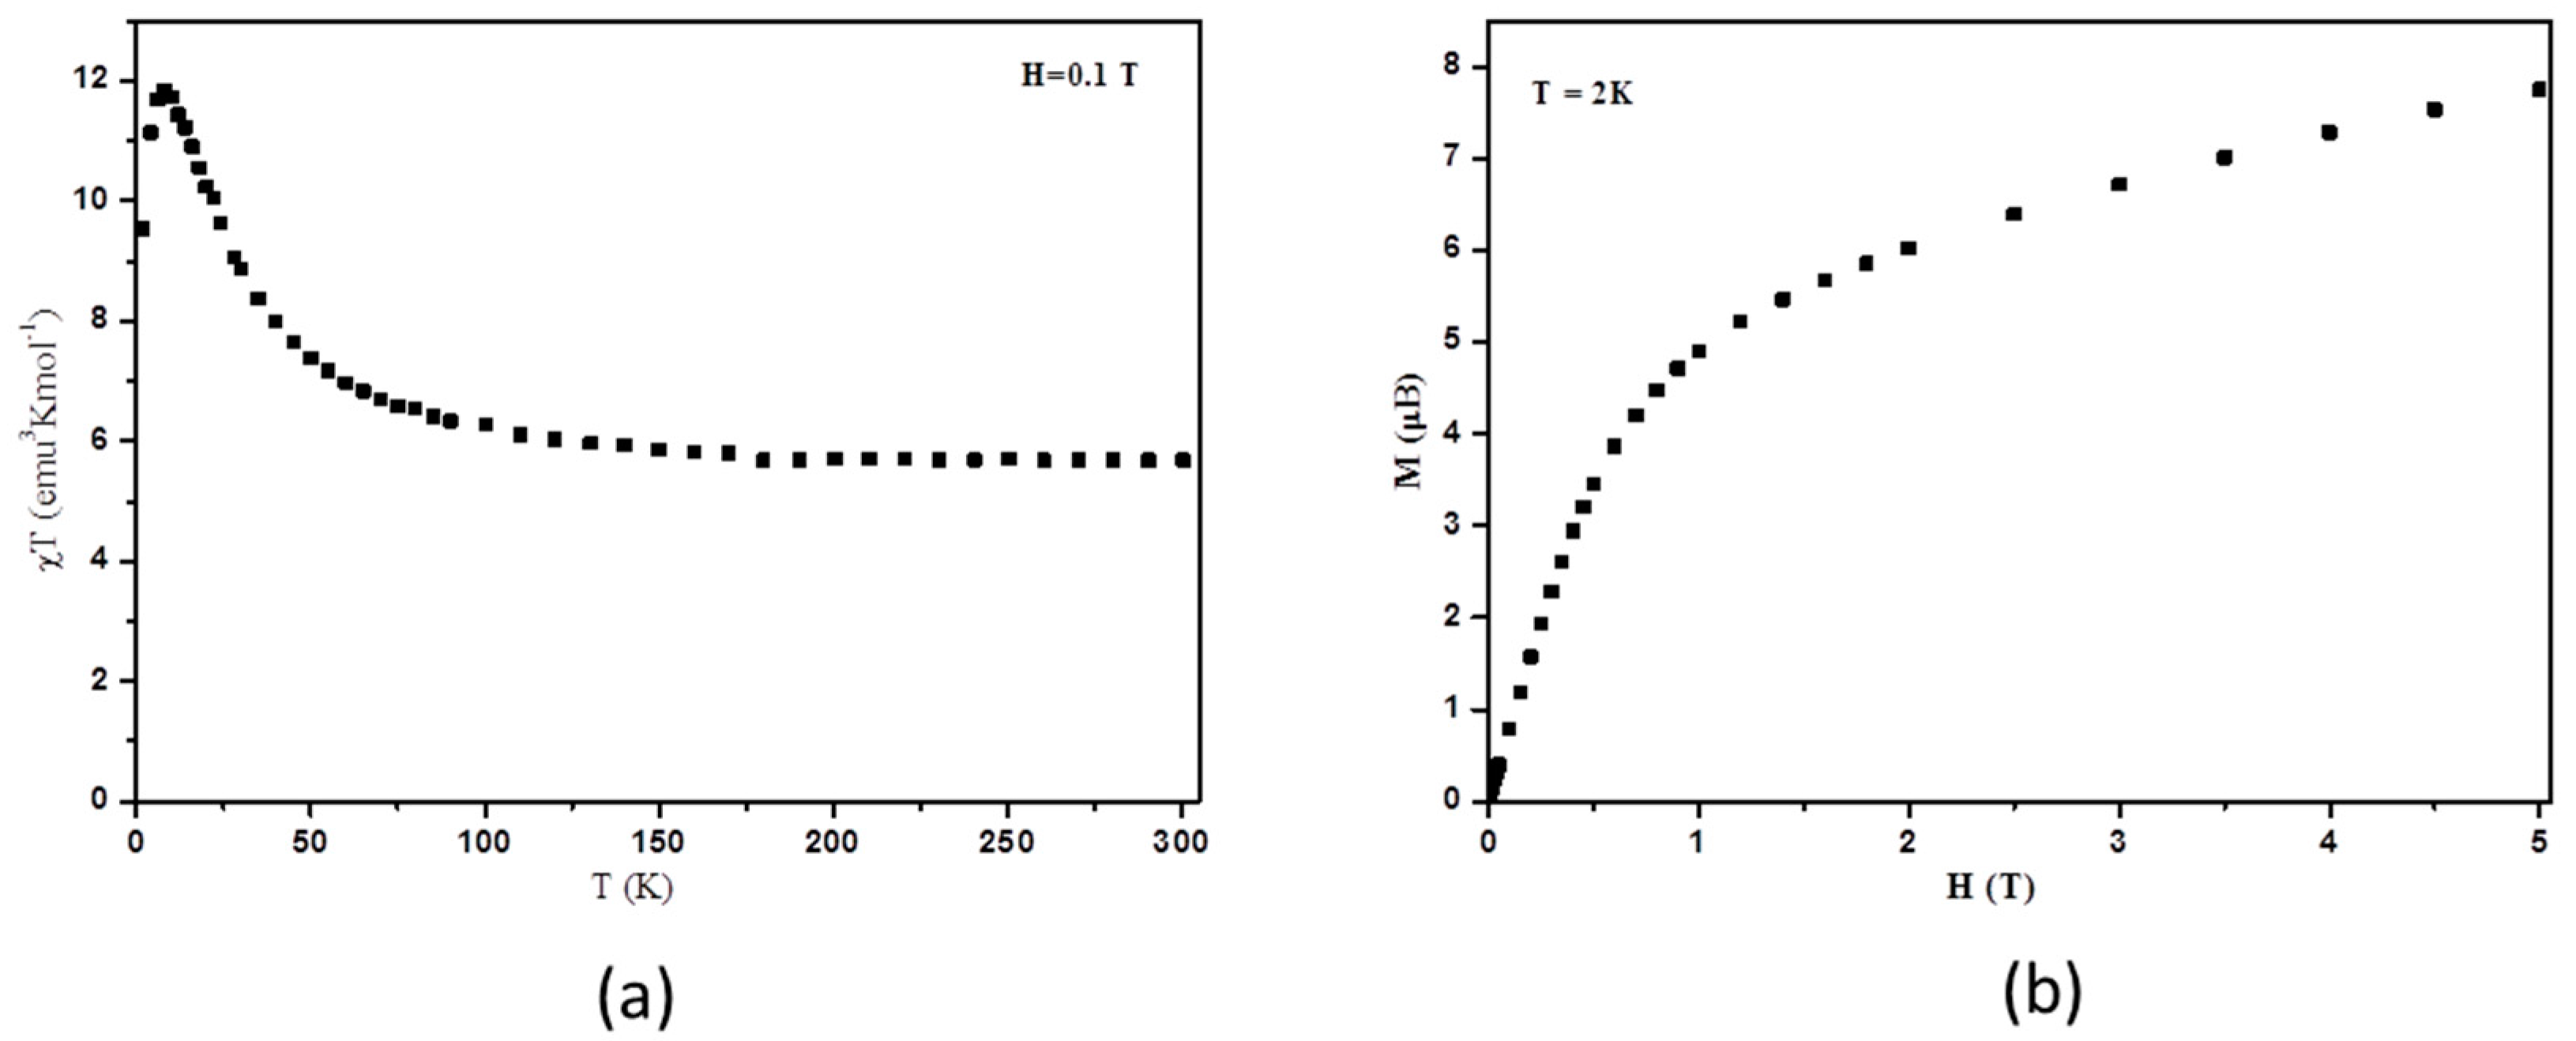
3.1. Bulk Magnetic Anisotropy from Magnetometry

Magnetic measurements on a polycrystalline sample are in agreement with the previously reported study [3], as shown on Figure 2. In a magnetic field of 0.1 T the temperature dependence of the product of the molar magnetic susceptibility with temperature (χT) is 5.67 emu·K·moL−1 (Figure 2a), which is higher than the expected value for four uncorrelated Ni2+ ions. The χT product continuously increases upon cooling to reach a maximum of 11.83 cm3·K·moL−1 at 8 K, indicating the dominant ferromagnetic interactions within the cluster. The maximum value is close to the expected value for an S = 4 ground spin-state with a g-value of 2.2. However, this g-value is quite high, in agreement with ground spin-state anisotropy. At 2 K, magnetization increases continuously with the field (Figure 2b) but does not reach saturation at 5 T.
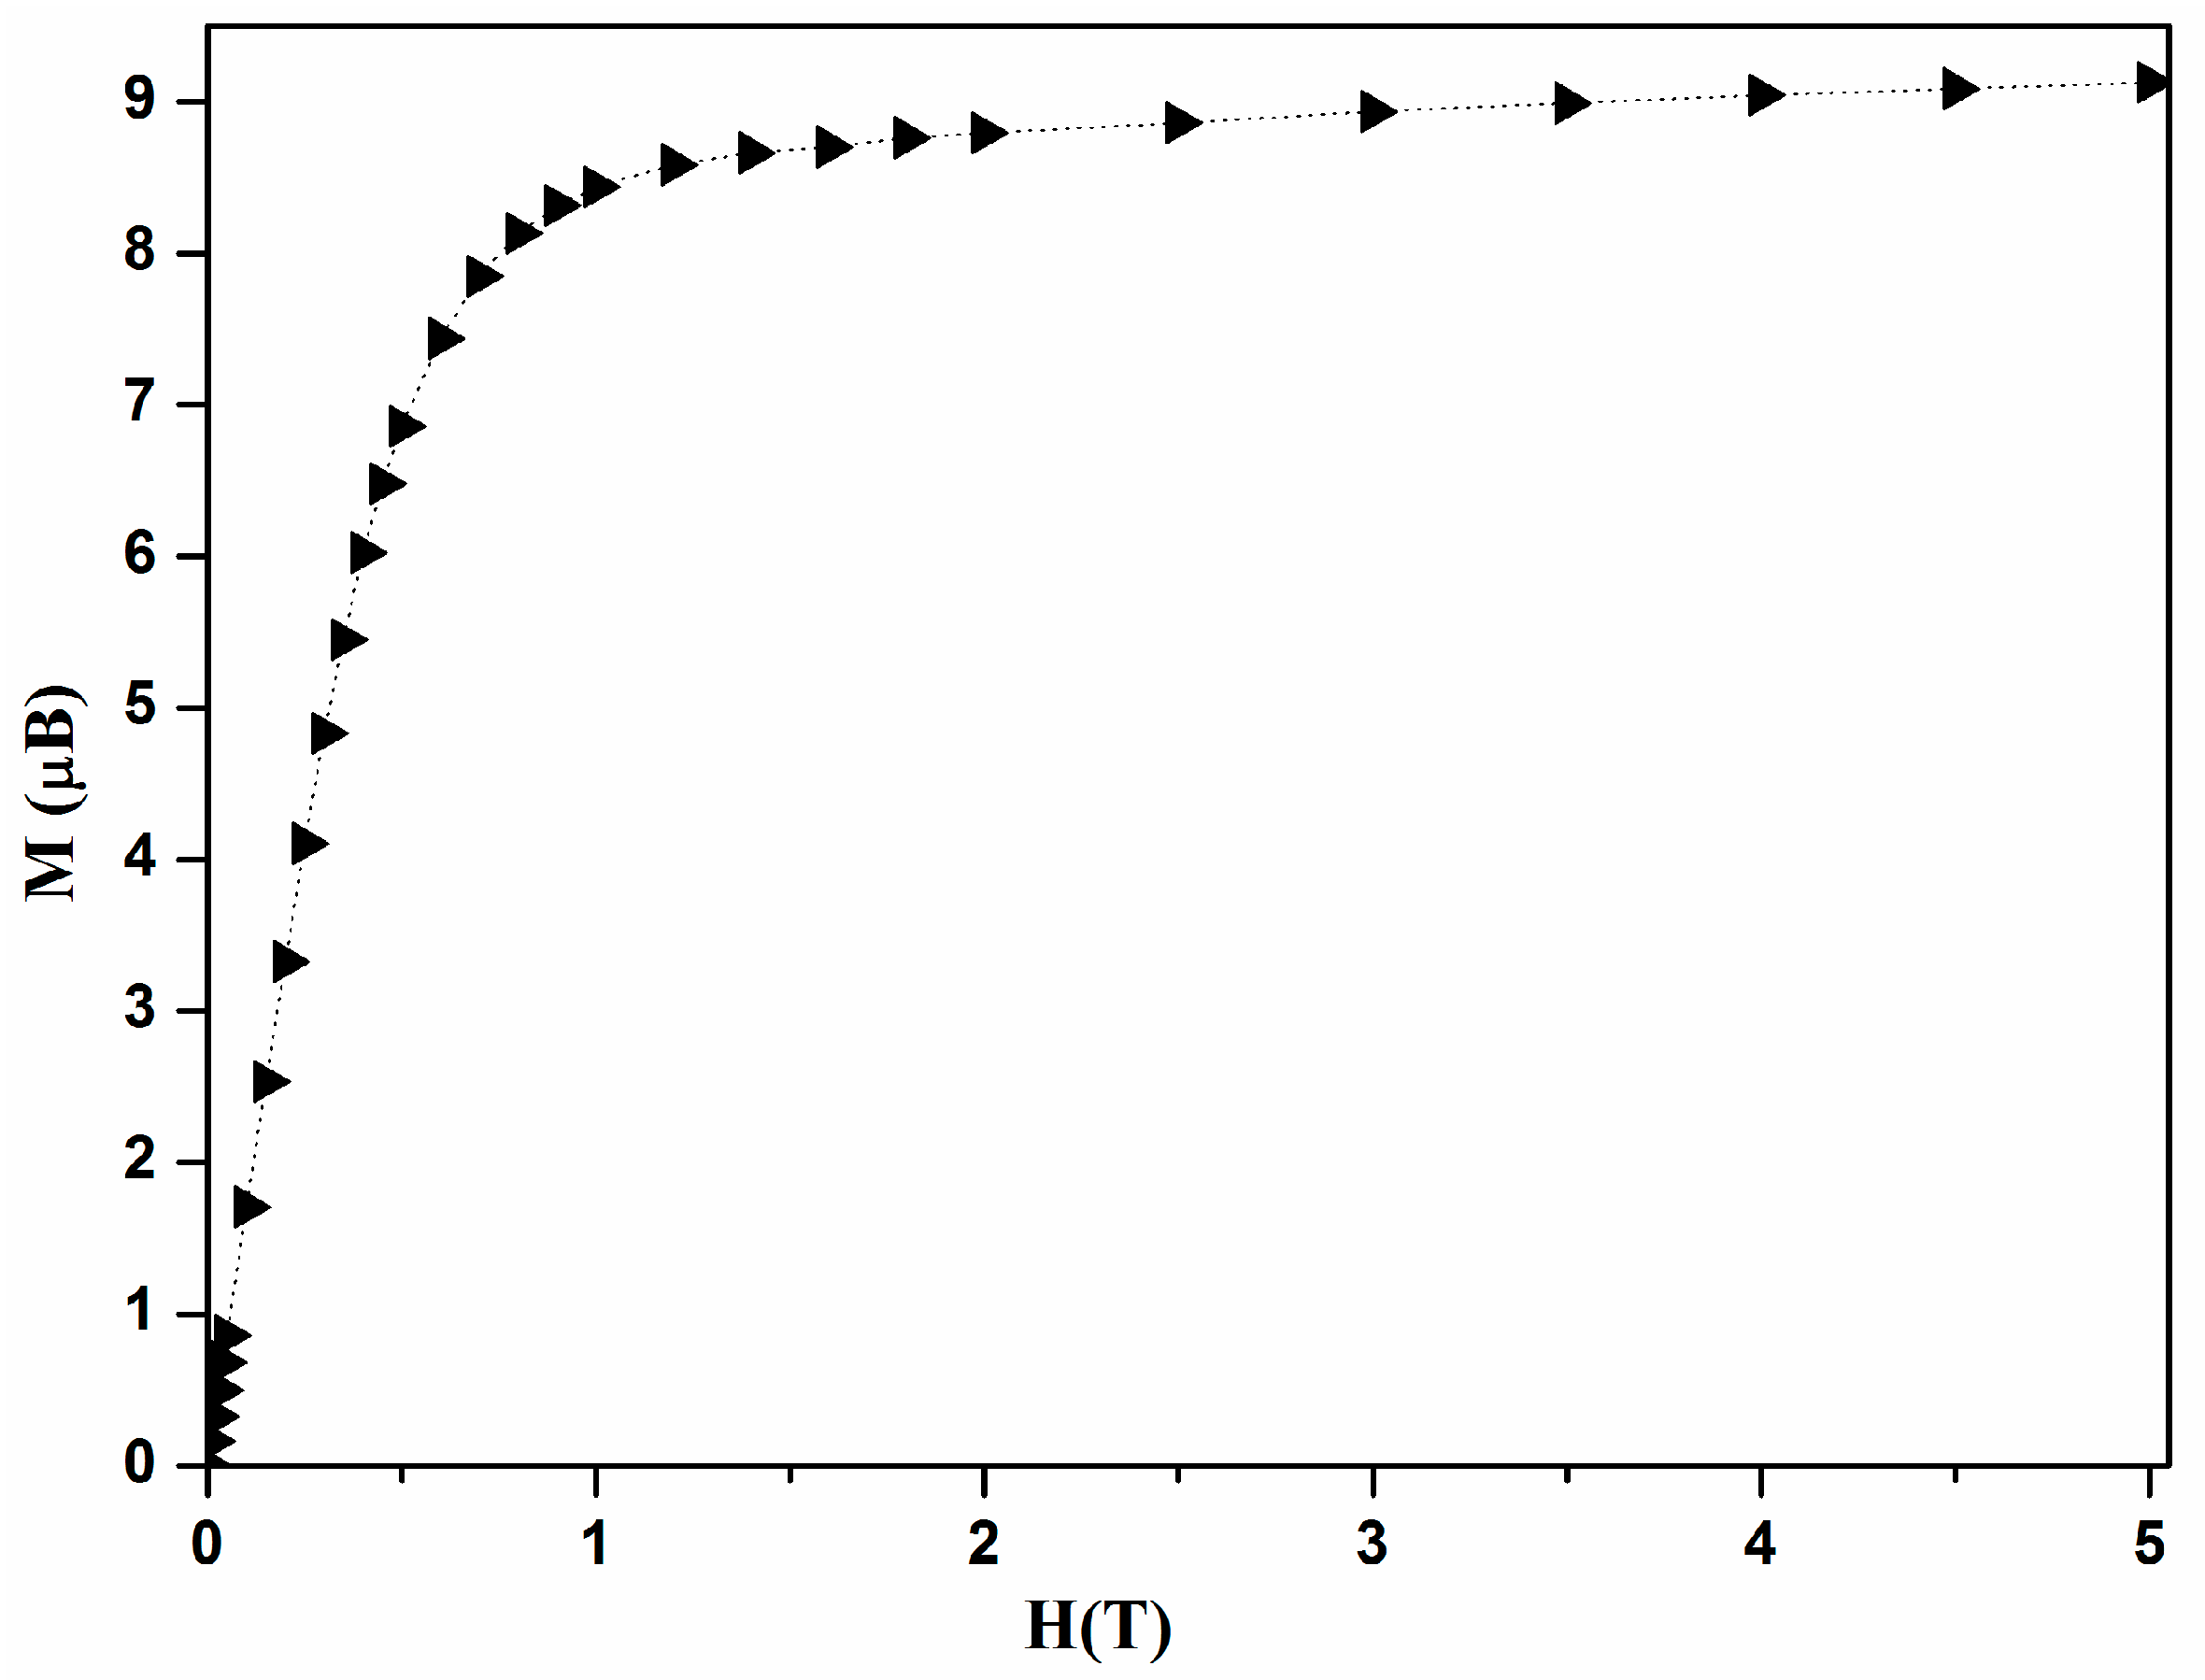
We report in Figure 3 the field dependence of magnetization at 2 K for a single crystal of [Ni4], with its easy axis directed along the applied field. It shows a rapid increase and reaches a saturation value of 9 µB which corresponds to a ground spin-state S = 4 with g = 2.2.
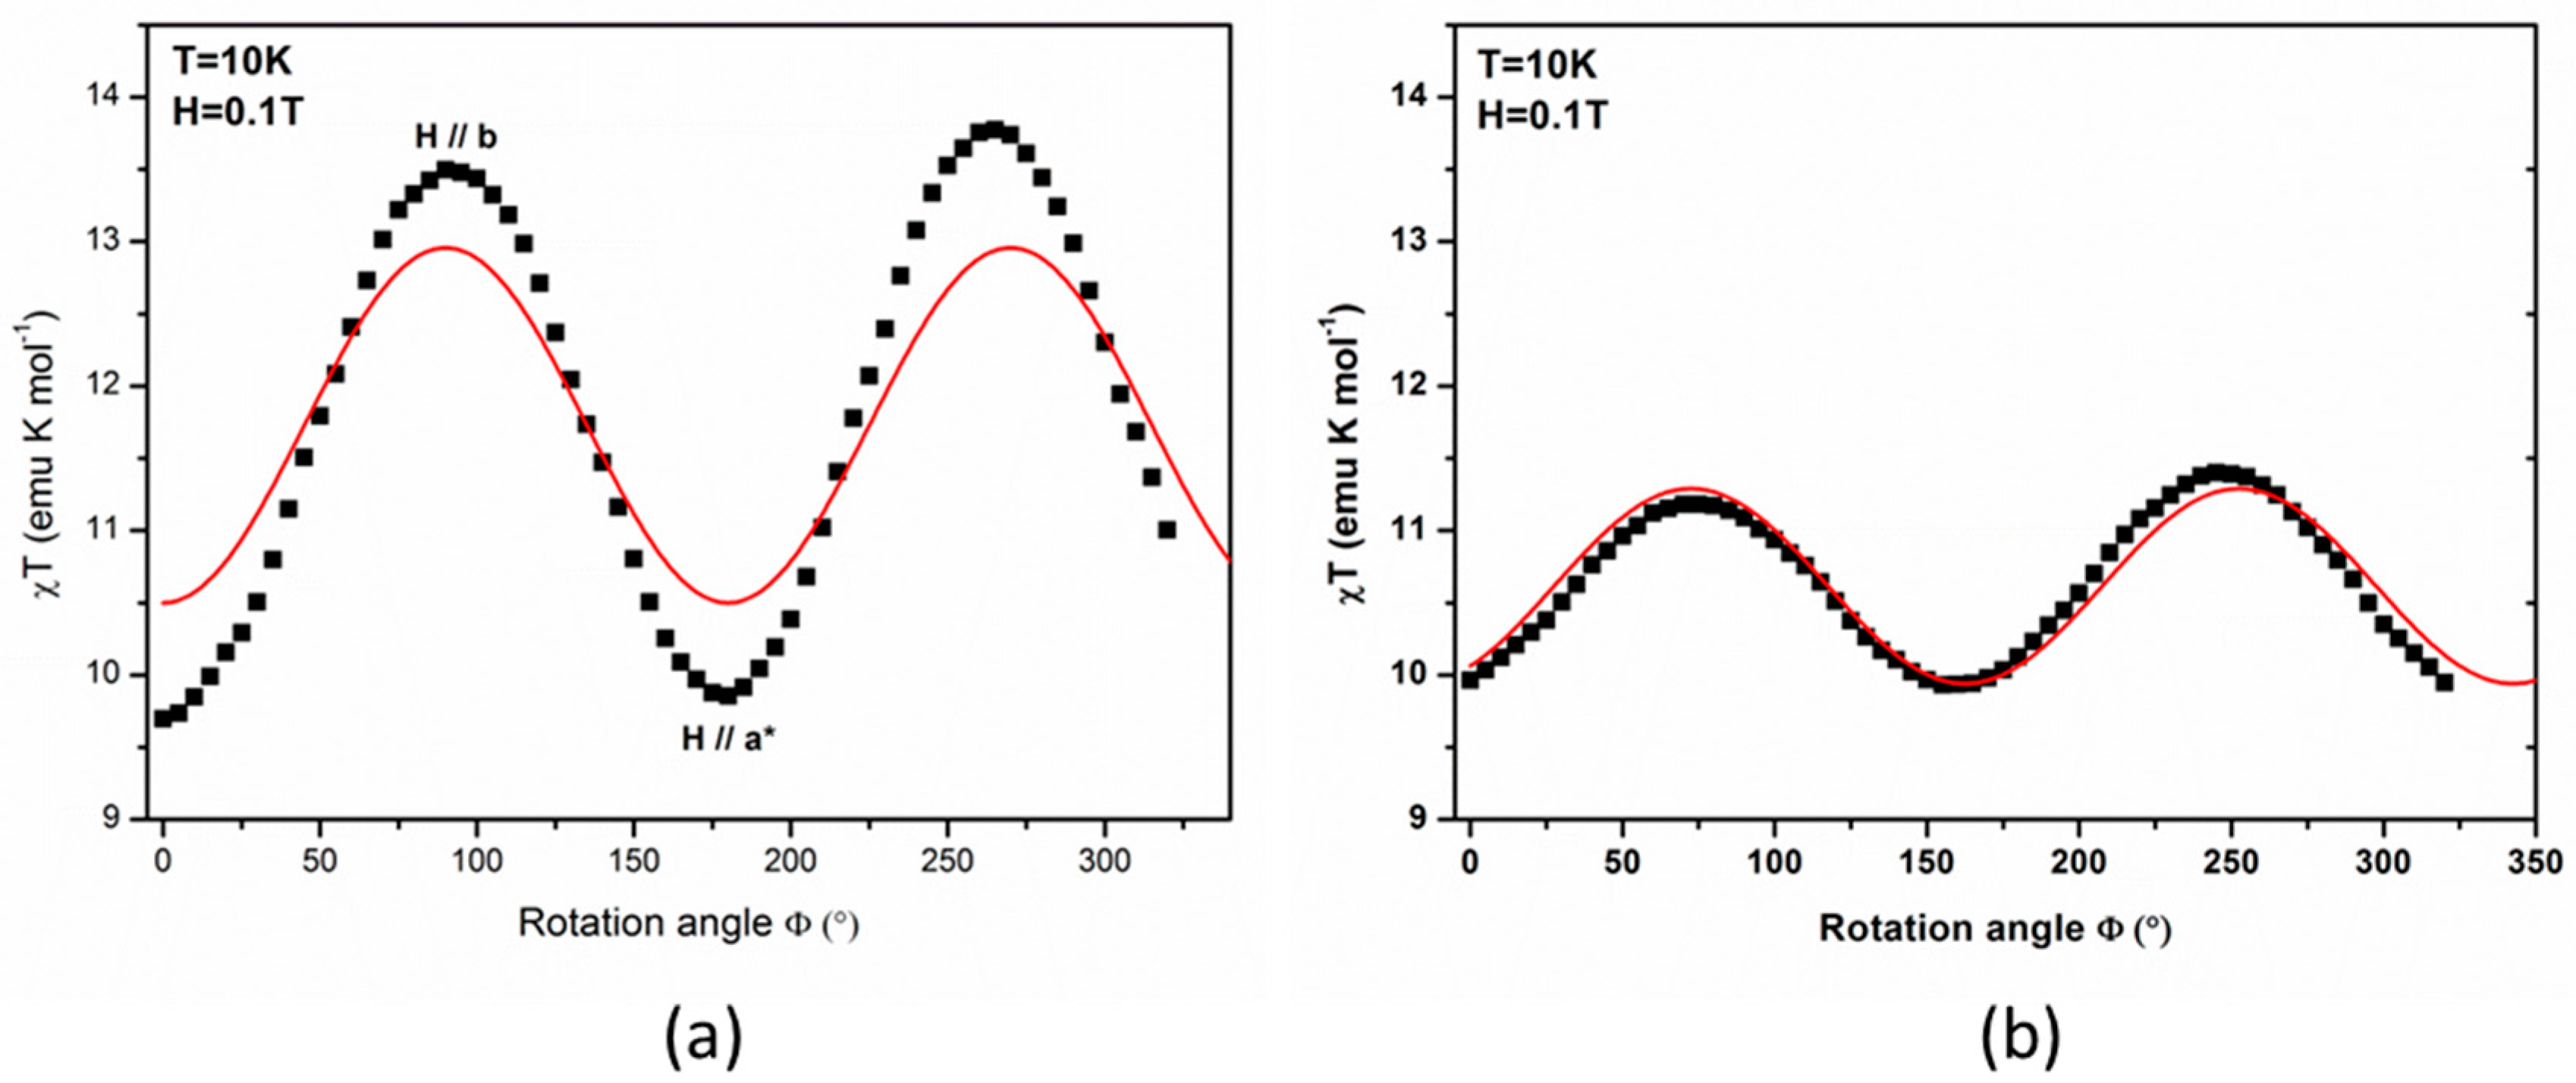
The results of angle-resolved susceptibility measurements on single crystal are displayed in Figure 4, in the form of the product of the magnetic susceptibility with temperature (χT) versus the rotation angle (Φ). The crystal was successively rotated around the c and b crystal axes with, in both cases, the a axis initially set along the applied magnetic field (rotation angle Φ = 0). As may be expected, the presence of minima and maxima clearly reveals the existence of an appreciable magnetic anisotropy. It can be noticed that the maximal χT values for the rotation around the c axis are well above the ones observed for the rotation around the b axis, while the minima are similar for both experiments.
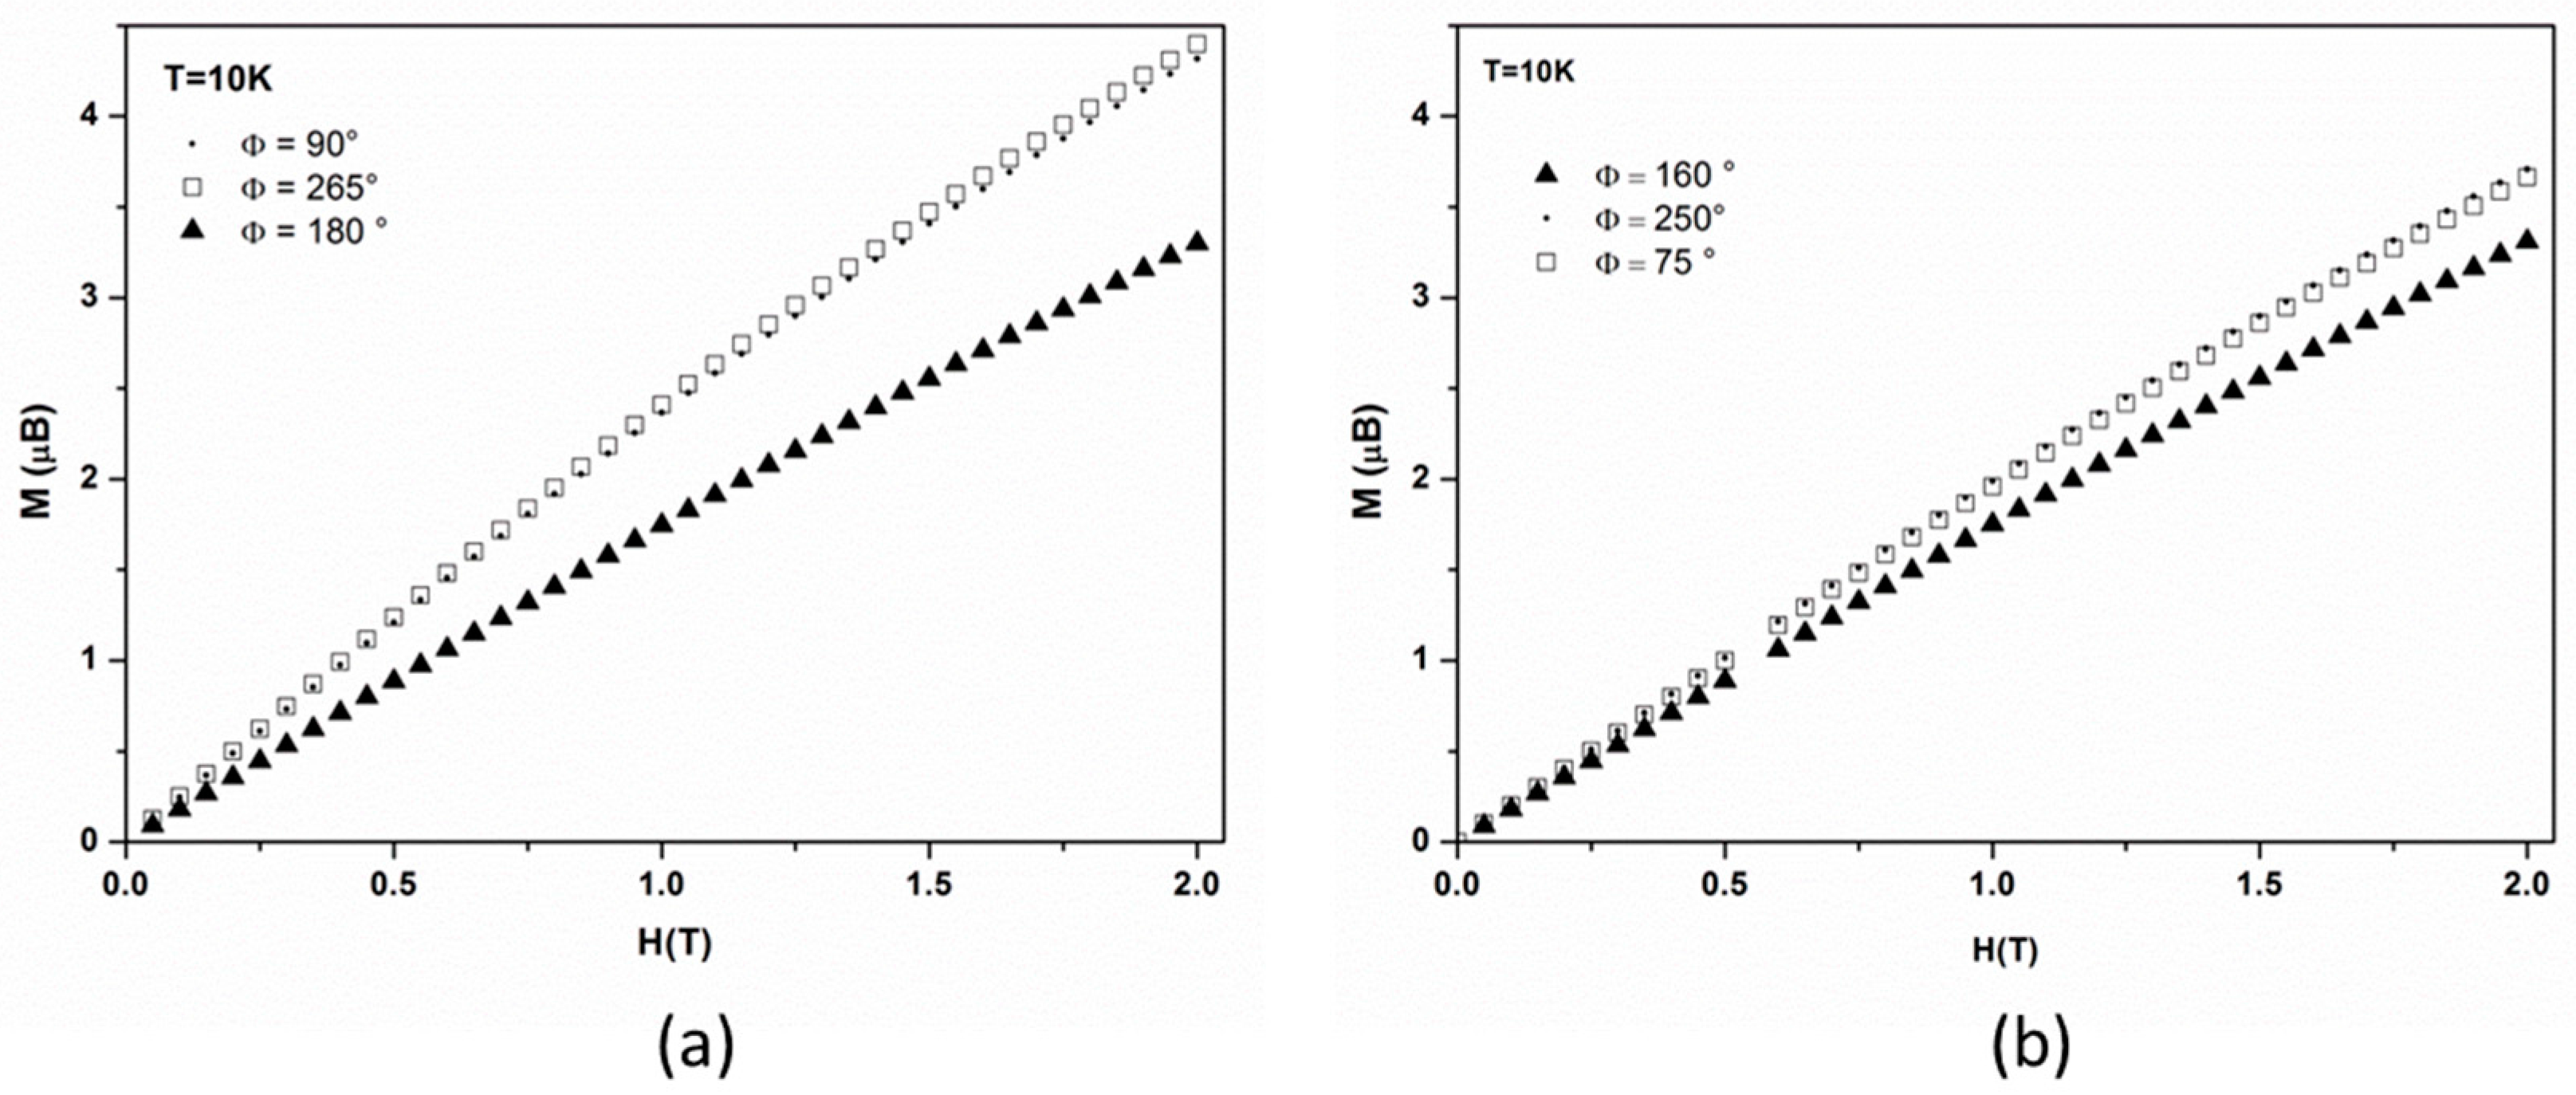
For each set of data we also measured the dependence of magnetization with the magnetic field at each maximum and minimum, at 10 K and up to 2 T, which is the magnetic field used during the PND study. For rotation around the c axis (Figure 5a), the field dependence of magnetization for the two maxima ( H // b and H // b ) superimpose as may be expected, and magnetization continuously increases up to 4.4 µB at 2 T, while, for the minimum ( H // a * ), it increases up to 3.4 µB. For the b axis rotation (Figure 5b), close values (3.3 and 3.7 µB) are observed at 2 T for both the minimum and two maxima of Figure 4b.

3.2. Local Susceptibility Tensor from PND

The paramagnetic susceptibility tensor of the crystal results from the sum of the local susceptibility tensors of each molecular cluster in the lattice, which are related by the symmetry operations of the space group. There are four clusters with two different molecular orientations in the cell and, therefore, the magnetic proper axes of the crystal (bulk) may not coincide with the molecular cluster proper axes:
χ c r y s t a l = s y m 4 χ c l u s t e r
By the successive application of a magnetic field on a single crystal of Ni4, along three orthogonal directions, we managed to collect three experimental flipping ratio datasets. This enables the refinement of the six components of the local (molecular) cluster tensors, χ i j c l u s t e r , which are reported in the first row of Table 3. However, due to the low number of accurate flipping ratios (see Table 4), the χ 23 c l u s t e r and χ 31 c l u s t e r components provided by refinement are below the limit of significance (less than 1.5σ) and, therefore, have been set to zero in the final refinement. The local susceptibility tensor expressed in the ( i , j , k ) basis set, i.e., a Cartesian basis set with i // a * , j // b , k // c , is then the following:
χ c l u s t e r = ( 1.88 0.72 0 0.72 2.32 0 0 0 1.04 )   i n   μ B T 1
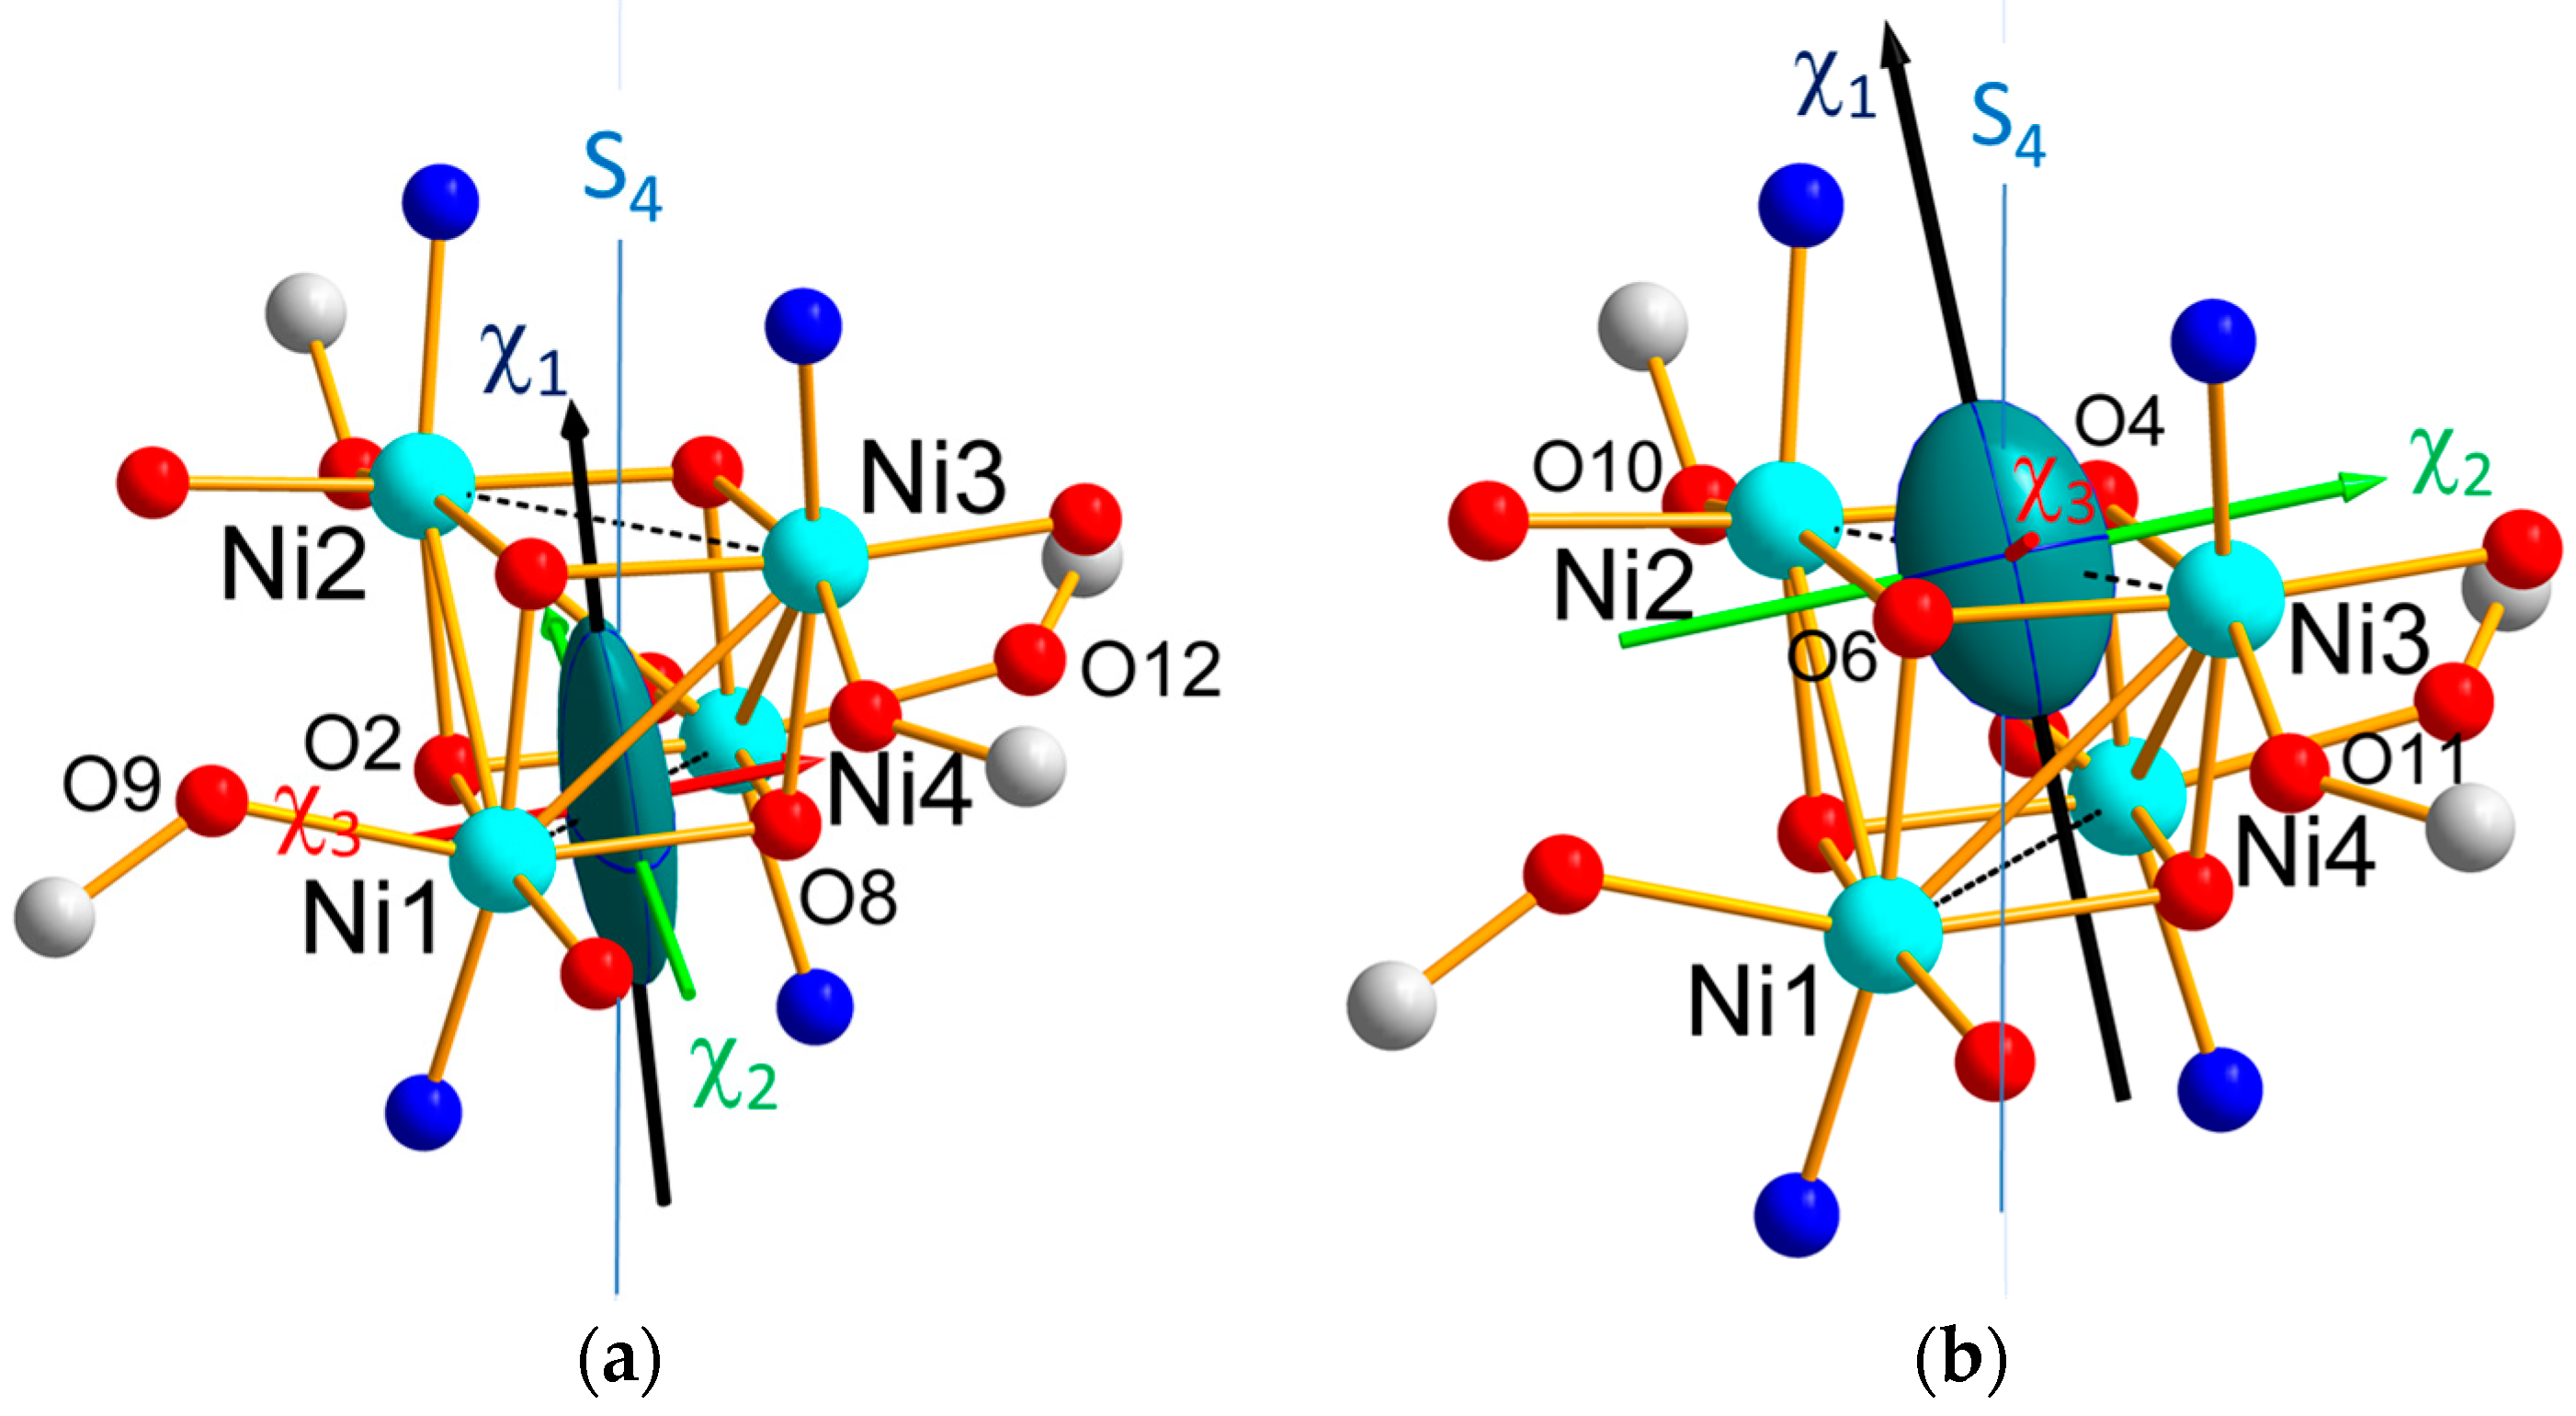
Diagonalization of this tensor provides its eigenvectors and eigenvalues, i.e., the directions of the cluster magnetic axes and the associated magnetic susceptibilities. The latter are gathered in Table 4 and the components of the eigenvectors in the ( i , j , k ) frame are provided in Table S1. The directions of the cluster magnetic axes are displayed in Figure 6, altogether with the magnetic ellipsoid of the cluster.
As we already stated, the susceptibility tensor of the cluster results from the sum of individual Ni tensors involving single ion paramagnetic contributions ( χ N i 𝑙 ) and additional terms due to ferro- (WF) and antiferromagnetic (WAF) exchange between the Ni(II) ions:
χ c l u s t e r = l = 1 , 4 N i χ N i 𝑙 + W F + W A F .
This tensor can be rewritten as a sum of “effective tensors” χ N i 𝑙 which include the perturbation due to the antiferromagnetic exchange between Ni(II) ions belonging to Ni–Ni pairs and the ferromagnetic exchange interactions between the Ni atoms along the diagonal of the Ni4O4 cube. This approximation is justified by the weakness of the magnetic exchange interactions in the cluster, as shown by the coupling constants deduced from magnetic measurements, JF = 8(1) cm−1 and JAF = −3(1) cm−1 from [11]:
χ c l u s t e r = l = 1 , 4 N i χ N i 𝑙 .
The six components χij for each Ni ion were first refined, on the joint basis of the three datasets, but only those for which the obtained value was larger than 1.5 times the error bar were included in the final refinement. The refinement of the local susceptibility tensors χ N i 𝑙 (with l = 1, 4) evidences a strong similarity between the Ni1 and Ni4 susceptibilities on one side and between Ni2 and Ni3 on the other side as showed by the reported components in Table 1. This suggests that the two Ni atoms belonging to a same antiferromagnetic (AF) pair, (Ni1, Ni4) and (Ni2, Ni3), respectively, have similar magnetic behaviors with respect to the applied magnetic field. Furthermore, the refined eigenvalues of each Ni local tensor, reported in Table 2, show that the Ni1 and Ni4 tensors are more anisotropic than those of Ni2 and Ni3. This feature is reflected by the magnetic ellipsoids drawn in Figure 7, together with the directions of the eigenvectors, whose components are reported in Table S1.
Therefore we introduced two “effective tensors” χ p a i r k (with k = 1, 2) associated with each of the AF pairs, which include the perturbation by ferromagnetic exchange interactions between the Ni atoms of the pairs.
χ c l u s t e r = k = 1 , 2 χ p a i r k ,
The components of the two tensors associated to each AF pair are reported in Table 1 and the corresponding eigenvalues in Table 2. The components of the eigenvectors can be found in Table S1. The obtained values indicate the tensor associated to the Ni1-Ni4 pair is more anisotropic than the tensor relative to the Ni2–Ni3 pair, in agreement with the previous findings on the single ion tensors. The magnetic ellipsoids and principal magnetic axes are represented in Figure 8. The easy axes ( χ 1 ) of the pairs are both close to the S4 pseudo-symmetry axis, but the hard ( χ 3 ) and intermediate ( χ 2 ) axes are found nearly perpendicular to each other axes, as well.

3.3. Discussion

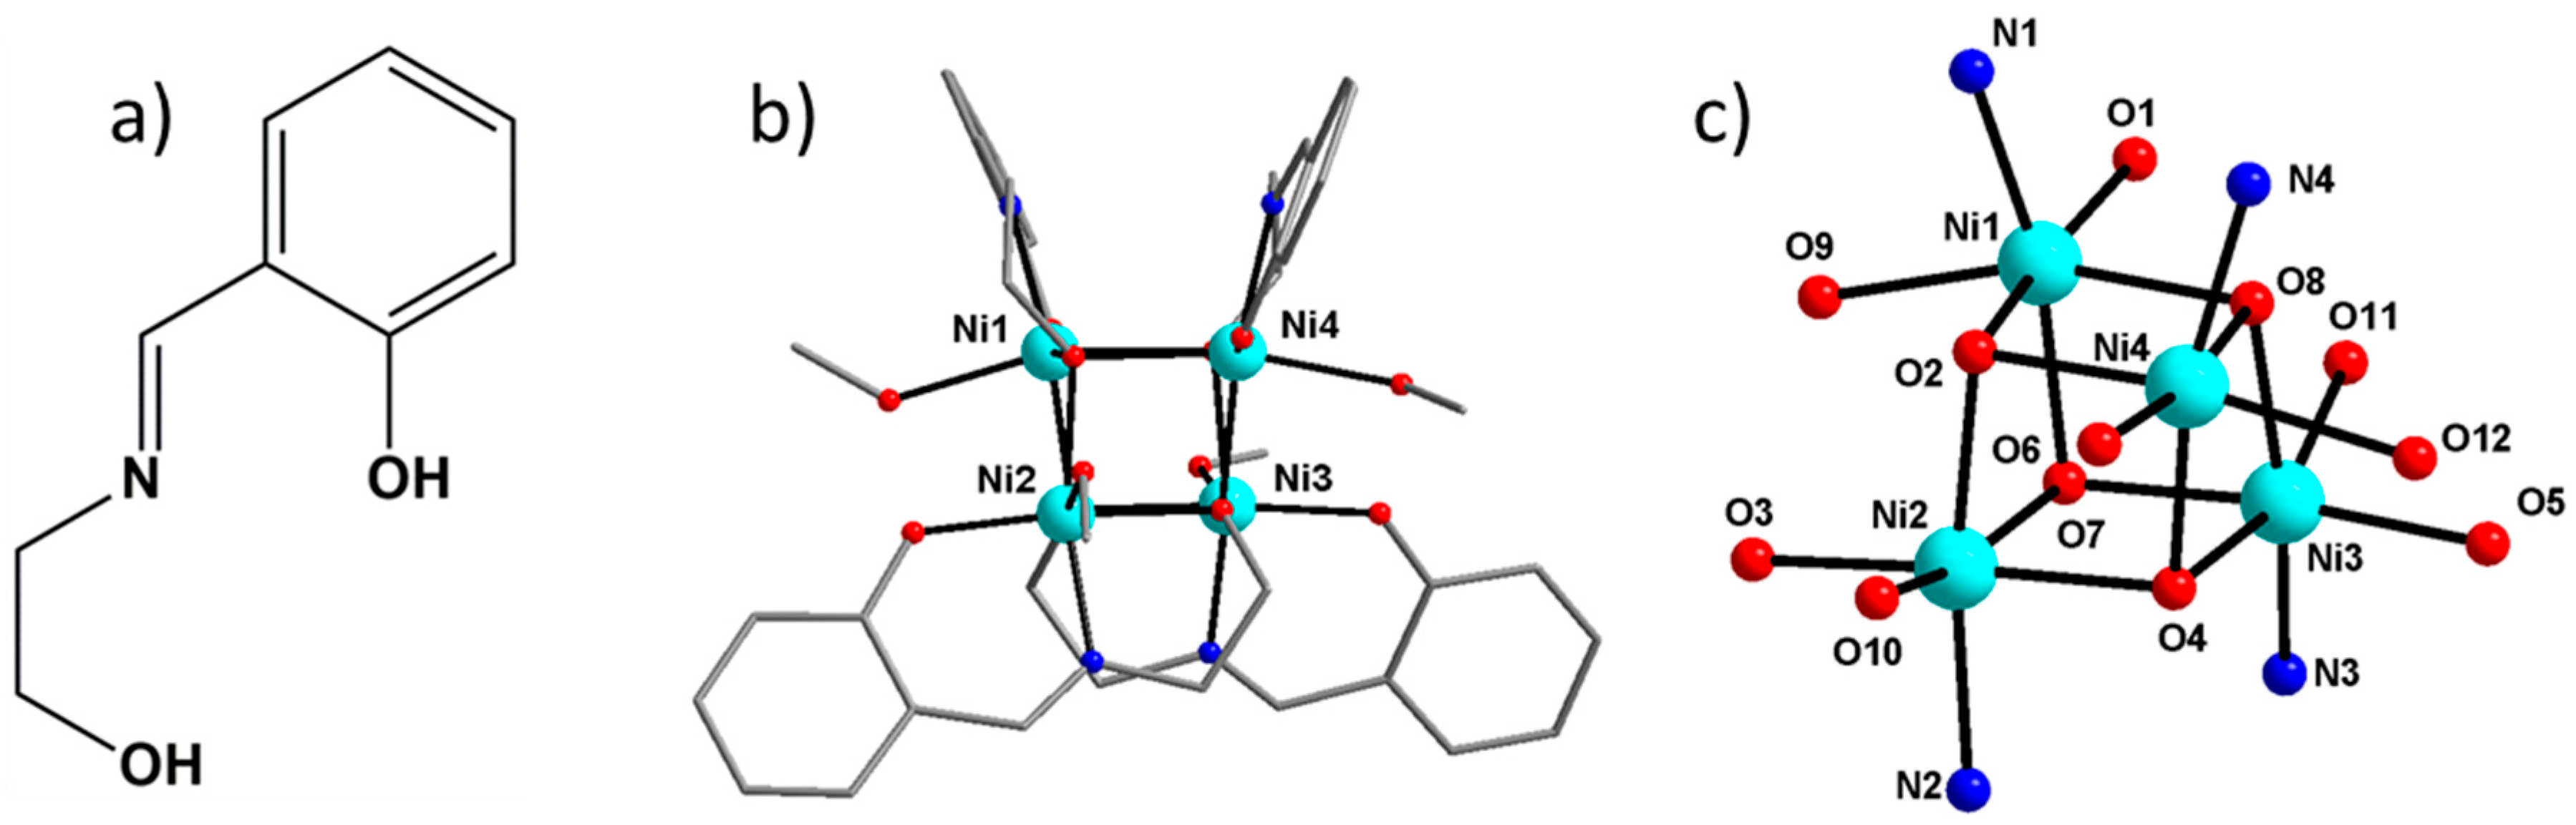
The main features of the local geometry around the Ni atoms in [Ni4] are reported in Table 5. The deformation of the coordination octahedron around each Ni atom of this cluster is due a tetragonal elongation along the O–Ni–O direction involving the coordinated methanol and the bridging alkoxide [15]. The local geometries around Ni1 and Ni4 (Ni2 and Ni3, respectively) are very similar, as exemplified by the longest distance between opposite edge atoms in the octahedron (which reflects the distortion of the octahedron): 4.246 Å for Ni1, and 4.254 Å for Ni4. Noteworthy, this distance is slightly larger (4.275 Å) for both Ni2 and Ni3.
It has to be noticed that the directions of tetragonal elongation are roughly parallel for Ni1 and Ni4 on one side and for Ni2 and Ni3 on the other side, i.e., for atoms which are AF coupled. In contrast, the elongation direction for one AF pair is orthogonal to the elongation direction of the other pair, i.e., for atoms which are ferromagnetically coupled. The structural characteristics of the six Ni2O2 bridges of the cubane are summarized in Table 6. The AF bridges present longer Ni…Ni distances (3.19 Å) with two short and two long Ni–O bonds and bridging angles of 100–101 deg., while the ferromagnetic bridges display shorter Ni…Ni distances (3.04 Å) with three short and one long Ni–O bonds and bridging angles of 91 to 97 deg, as shown in Figures S1 and S2 in the Supplementary Information.
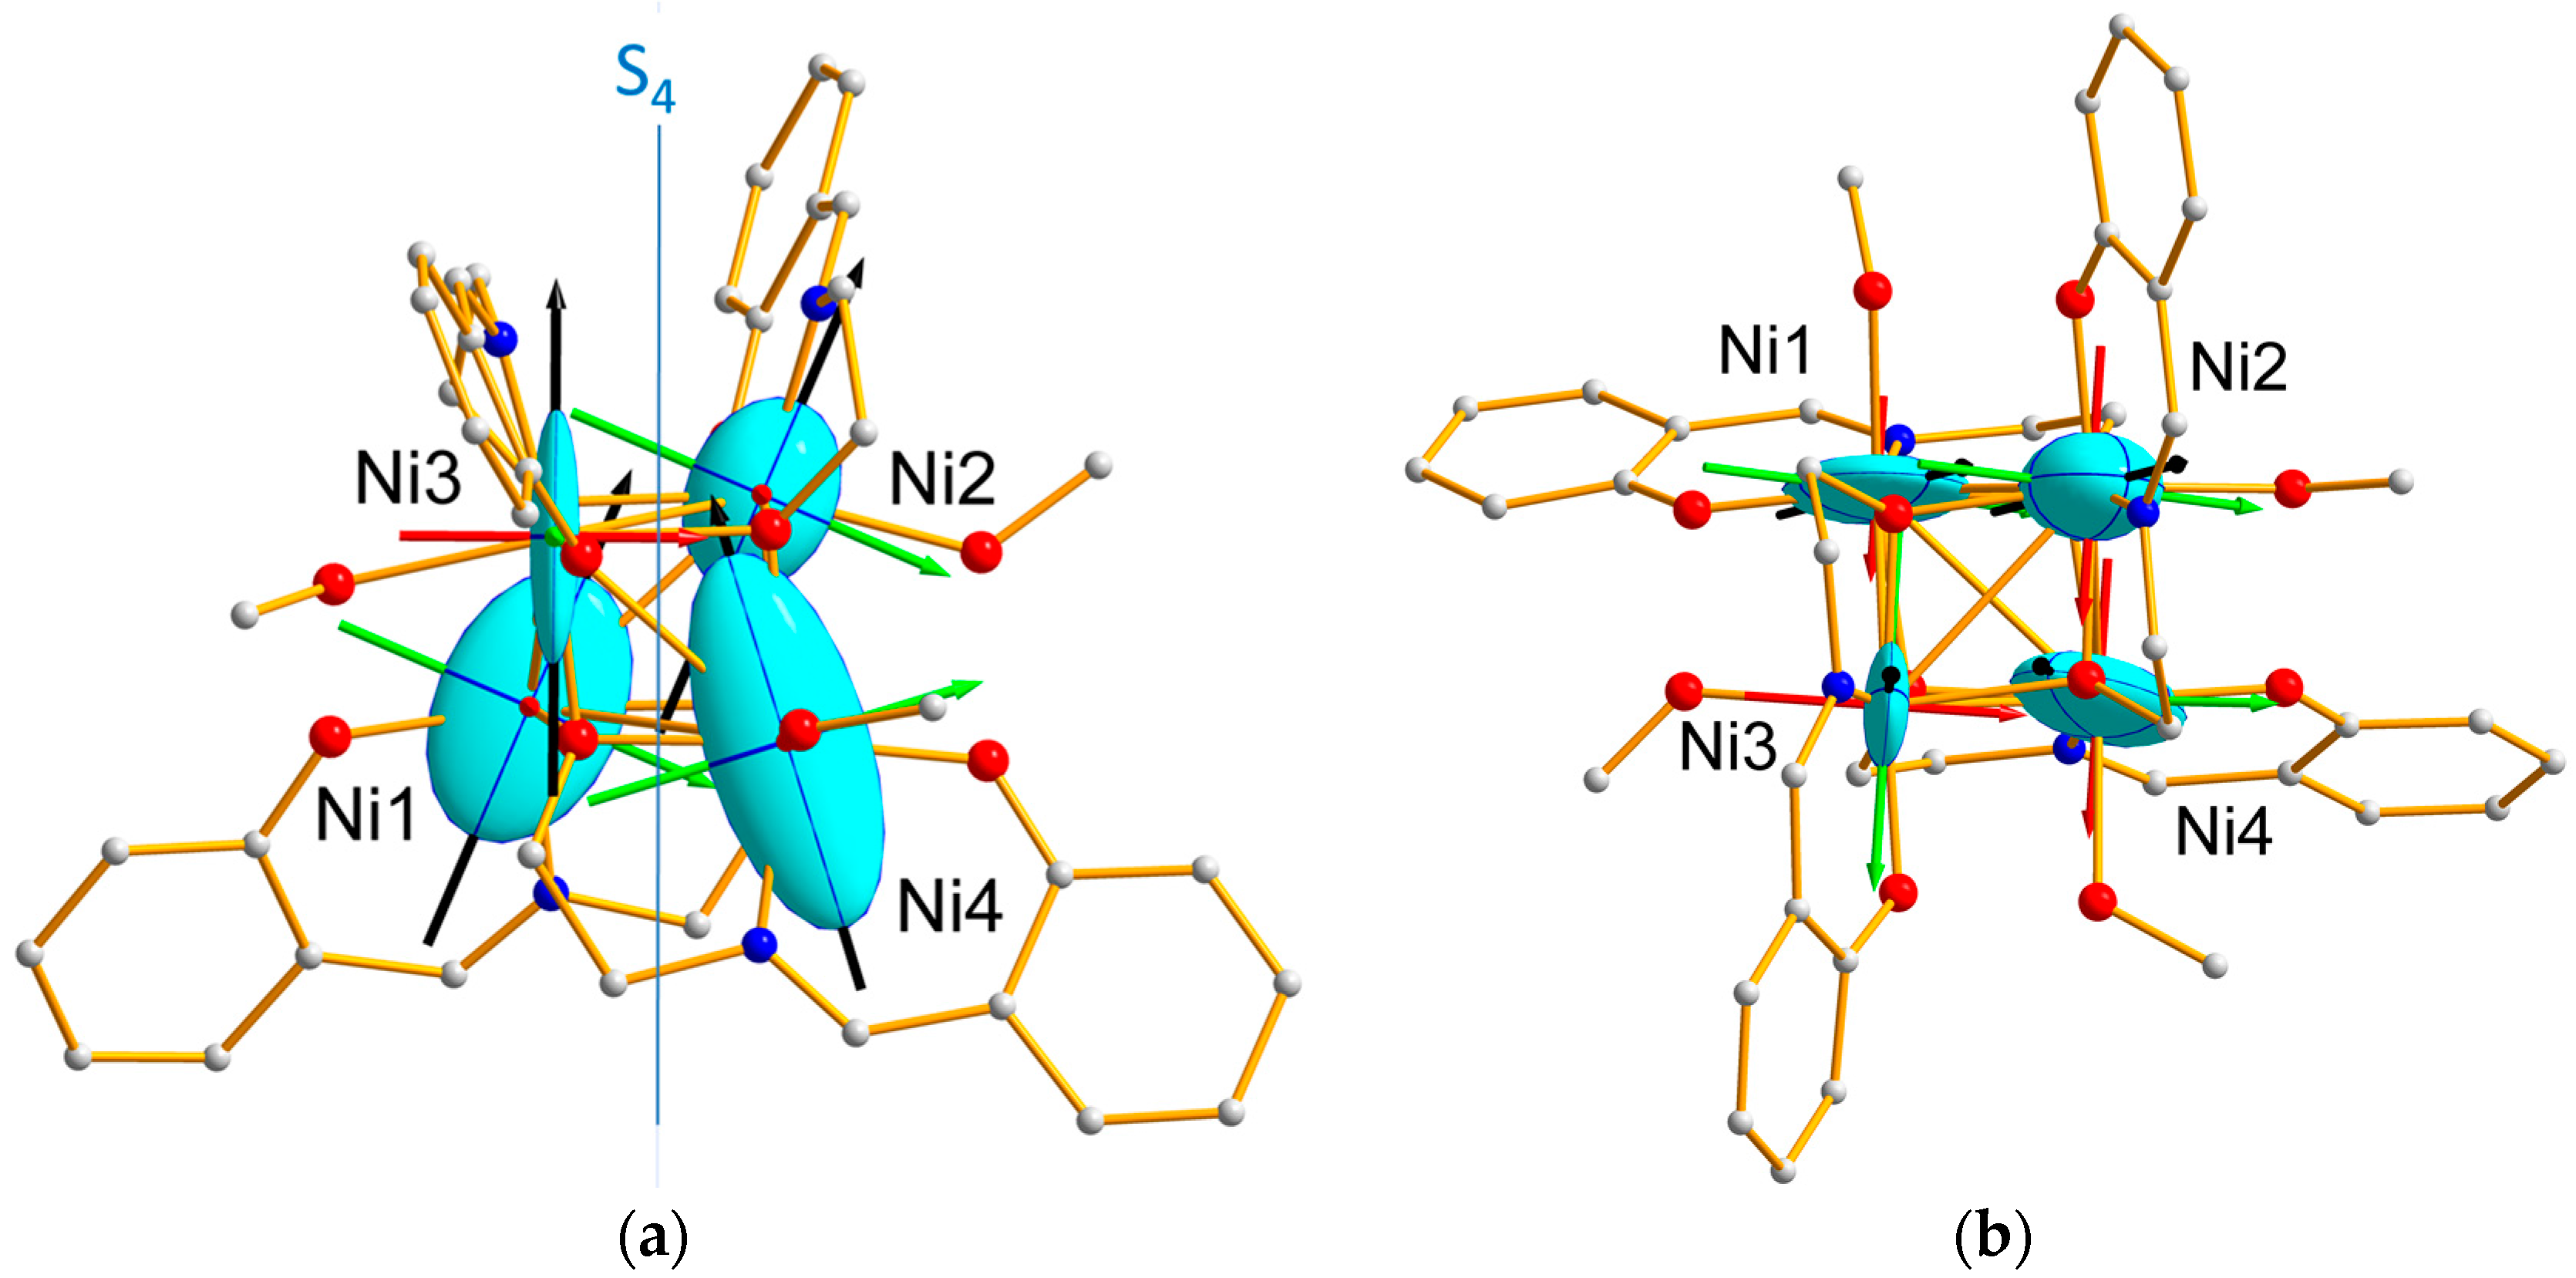
The similarity between the Ni “effective” single-ion susceptibility tensors obtained from PND analysis, for (Ni1, Ni4) on one hand, and (Ni2, Ni3) on the other hand, can be correlated to the two corresponding local geometries. Although the local tetragonal distortion is slightly larger for (Ni2, Ni3) than for (Ni1, Ni4), with a O-Ni-O distance of 4.275 Å compared to 4.25 Å, the (Ni1, Ni4) tensors are more anisotropic than the (Ni2, Ni3) ones. This suggests that the axial distortion of the coordination octahedron is not the only source of magnetic anisotropy. Actually, another feature of the octahedral environment distortion for the Ni1 and Ni4 ions may be related to the more anisotropic character of their single-ion magnetic behavior: the deformation of the triangular faces of the octahedron. The sum of the deviations from 60 deg (in absolute magnitude) of the inner angles of the eight faces is indeed equal to 115.6 deg for (Ni1, Ni4) and 112.6 deg for (Ni2, Ni3). This would in turn mean that deformation in the equatorial directions of the coordination octahedron plays an important role.
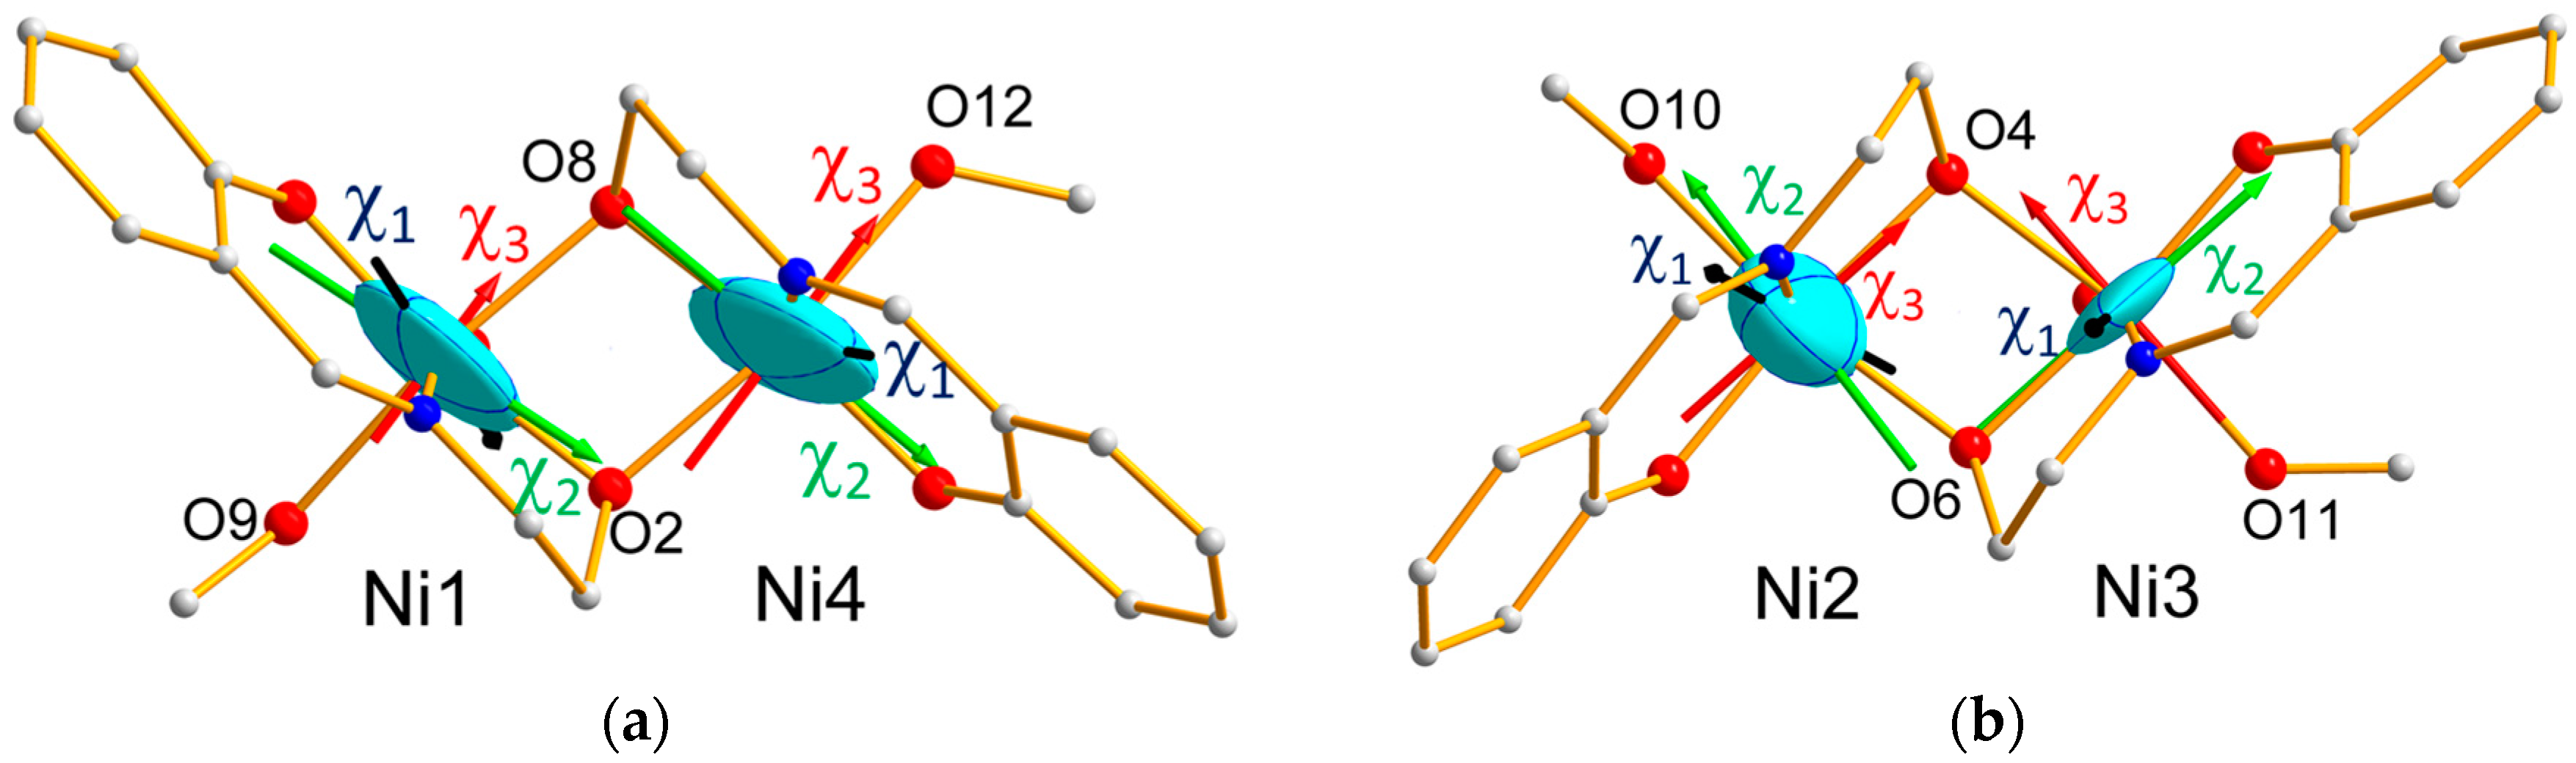
As it can be seen in Figure 4a,b, which display the ellipsoids relative to the Ni1O2Ni4 and Ni2O2Ni3 bridges, the directions of the χ 3 hard magnetic axes for Ni1, Ni3 and Ni4 are close to the local distortion axes, i.e., along the O–Ni–O direction involving methanol and bridging alkoxide, as speculated in [15]. This is not verified for the Ni2 ion. However, from Table 4, the eigenvalues of the Ni2 local tensor corresponding to the mean and hard axes are close to each other (χ2 = 0.42(20)μB/T and χ3 = 0.33(6)μB/T) with overlapping error bars, showing that it is difficult to discriminate between these two directions and that the exact direction of the hard axis in the plane perpendicular to the easy axis cannot be determined from the Ni2 local tensor.
The effective magnetic tensors associated to each antiferromagnetic pair (Figure 8) reflect the resultant of the effective single ion tensors of the Ni ions involved in the pair (Figure 9). Noticeably, the hard magnetic axes of the both pairs are perpendicular to each other, in agreement with the local directions of tetragonal distortion.
The cluster experimental local susceptibility tensor (Equation (11)) at 10 K obtained from the PND data analysis may be used to calculate the bulk magnetization induced by a magnetic field, applied in any direction of space, for a more direct comparison with the angular-resolved measurements. Taking into account the symmetry operations of the P21/c space group, the crystal susceptibility tensor can be deduced from Equations (10) and (11), which leads to the bulk susceptibility tensor:
χ b u l k = 1 4 χ c r y s t a l = ( 1.9 ( 2 ) 0 0 0 2.3 ( 1 ) 0 0 0 1.0 ( 1 ) )   i n   μ B T 1 , .
This tensor is diagonal in the ( i , j , k ) basis set and, therefore, its eigenvectors, i.e., the bulk magnetic proper axes, coincide with the a * , b , and c axes, which fully agrees with the SQUID data analysis.
In order to further compare the PND results with the angular-resolved magnetic data, the single crystal SQUID data were simulated using the experimental cluster susceptibility tensor from PND and a homemade program taking into account the magnetic field orientations and the lattice symmetry. For the first set of data, given as rotations around the crystal c axis, the simulation reproduces well the positions of maxima at 90° and 180° and the minimum at 265° as shown in Figure 4a (solid curves). Thus, the maxima at 90° and 180° can be ascribed to the b axis and the minimum at 265° to the a * axis.
For the second set, given as rotations around the b axis, the simulation of the maxima at 75° and 160° and minimum at 250° was not possible as such. Moreover in Figure 5a, the magnetization value at 2 T for the minimum (3.3 µB) differs from the expected one (2µB) from the PND bulk tensor (Equation (15)) for H // c , while for the maximum (3.7 µB) it is larger than the expected value (3.8 µB) from Equation (15) for the intermediate axis H // a * . This is very likely due to a tilt of the rotation axis in the ( b , c * ) plane, as the precise orientation of the b axis proved to be very hard to find because of the crystal shape. The simulation of the data reported in Figure 4b only proved possible when considering the true rotation axis was tilted from the b axis in the ( b , c * ) plane, with the magnetic field initially close to the a axis, as already proposed. The best agreement between our simulation and the experimental data, displayed on Figure 4b, was obtained for a tilt angle ω of −65°, suggesting the rotation axis was actually closer to c than to b as first expected. As one can note, with such a hypothesis a very good agreement is reached with the experimental data, both on the locations and magnitudes of the extrema of the curve. Alas, this implies that the orientations in the lattice corresponding to these extrema are rather ill-defined and, thus, prevents a proper assignment of the maxima or the minima.
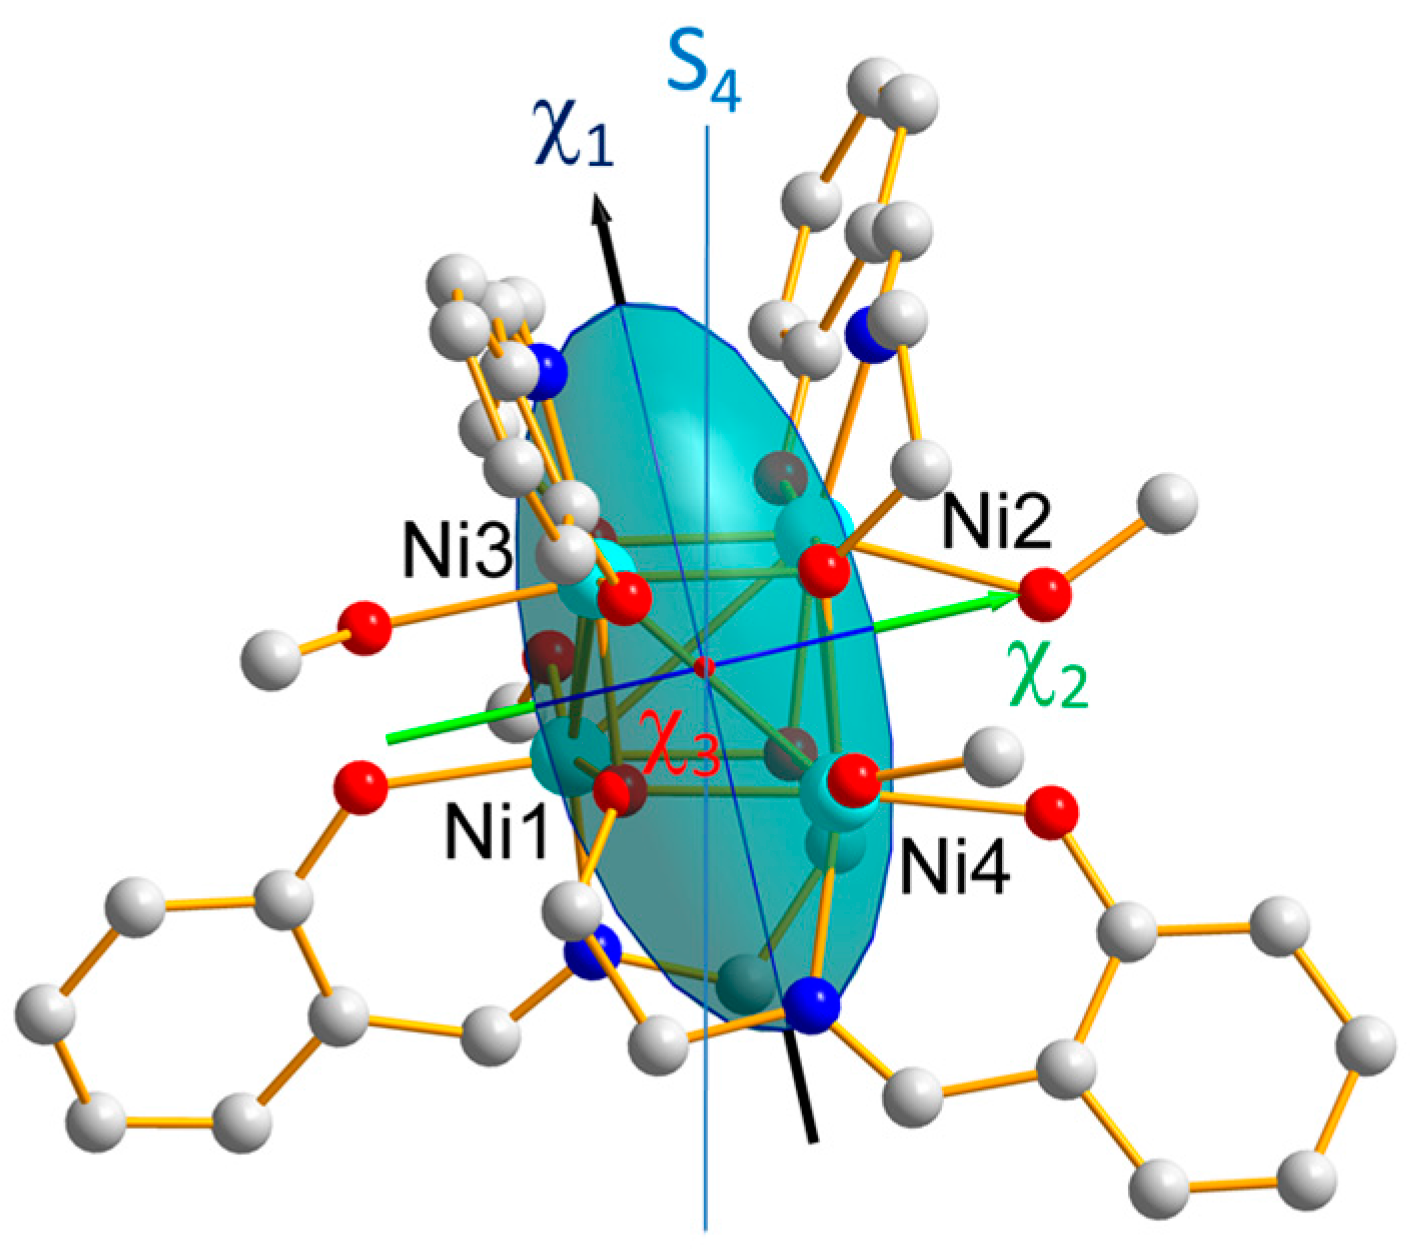
As shown in Figure 1, the local easy magnetic axis χ 1 of the cluster is close to the pseudo-symmetry S4 axis, in agreement with the conclusion of the previous INS investigation [3]. The following Hamiltonian was used for the full description of the eight transitions in the INS spectra (with selection rules ΔMS = ±1) [3]:
H ^ a n i s o = H ^ Z F S + B 4 0 O ^ 4 0 + B 4 4 O ^ 4 4 ,
where H ^ Z F S is the zero-field splitting (ZFS) Hamiltonian:
H ^ Z F S = D [ S ^ z 2 1 3 S ( S + 1 ) ] + E ( S ^ x 2 S ^ y 2 ) ,
and B 4 n O ^ 4 4 n   w i t h   n = 0 ,   4 are high order terms (Stevens operators) corresponding to crystal field effects.
The axial and rhomboedral ZFS parameters of the cluster were found to be equal to D = −0.93(2) cm−1 and E =0.023(8) cm−1(due to deviations from S4 cluster symmetry). The observed axial anisotropy of the cluster magnetic ellipsoid (χ1 >> χ2, χ3) confirms the easy axis-type magnetic anisotropy of the cluster predicted by the negative sign of D.

4. Conclusions

Polarized neutron diffraction on single crystal provides a detailed mapping of the magnetic anisotropy inside the title [Ni4] cubane cluster, which would otherwise remain entirely inaccessible using any other technique, for instance magnetometry or EPR, in such a compound with two different molecular orientations in the cell. Provided that the magnetic exchange coupling inside the cluster is weak enough (and, therefore, single ion anisotropy is dominant), the local susceptibility tensors can be obtained from PND for each individual Ni2+ ion, and also for the two different pairs of antiferromagnetically-coupled Ni2+ ions. Our results show that the strength of the local magnetic anisotropy is clearly related to the local geometry of the Ni coordination octahedron. They confirm that the orientation of the hard axes of the Ni2+ ions is governed by the tetragonal elongation along the O-Ni-O direction involving the coordinated methanol and the bridging alkoxide. However, the single ion magnetic anisotropy is not only stemming from this axial distortion, but also originates from the deformation in the equatorial directions of the coordination octahedron, as shown by the strongest axial anisotropy of the AF pair which displays the weakest axial elongation but largest equatorial distortion.
Our PND results are in agreement with the macroscopic angular resolved magnetic measurements which only give access to the crystal magnetic anisotropy. They are also consistent with the negative value of the ZFS parameter D for the cluster, as provided by a previous INS study (which, we remind, only gives access to the anisotropy parameters and not to the directions of the magnetic axes).
PND confirms that the easy magnetic axis of the cluster is close to the S4 pseudosymmetry axis as assumed in the INS study, but in addition and exclusively it reveals the easy axis anisotropy of the cluster is mastered by the anisotropy of one of the two antiferromagnetic pairs, which presents stronger axial anisotropy than the other one.

Supplementary Materials

The following are available online at www.mdpi.com/2312-7481/3/3/25/s1. Table S1. Components of the eigenvectors of the susceptibility tensor from PND for the cluster, individual ions, and antiferromagnetic pairs; Figure S1. Geometry of the two antiferromagnetic NiO2Ni bridges; Figure S2. Geometry of the four NiO2Ni bridges presenting ferromagnetic coupling. The source code of the CalcM program; Manual of information about the algorithm.

Acknowledgments

Y.C. thanks the European Union/European Commission for Marie Curie fellowship. M.L. thanks NMI3-2 (European Union/European Commission) for a post-doctoral fellowship (FP7 Work Package on Neutron Imaging).

Author Contributions

D.L. and J-F.J. performed the magnetic measurements, B.G., O.I, Y.C. performed the polarized neutron diffraction experiments; A.B. and M.L. performed the 4-circle neutron diffraction experiment; B.G., M.L. and F.G. analyzed the data; O.I. performed the samples crystallization; B.G., O.I., D.L. and F.G. wrote the paper.

Conflicts of Interest

The authors declare no conflict of interest.

References

  1. Neese, F.; Pantazis, D.A. What is not required to make a single molecule magnet. Faraday Discuss. 2011, 148, 229–238. [Google Scholar] [CrossRef] [PubMed]
  2. Rinehart, J.D.; Long, J.R. Exploiting single-ion anisotropy in the design of f-element single-molecule magnets. Chem. Sci. 2011, 2, 2078–2085. [Google Scholar] [CrossRef]
  3. Jung, J.; Cador, O.; Bernot, K.; Pointillart, F.; Luzon, J.; Guennic, B.L. Influence of the supramolecular architecture on the magnetic properties of a DyIII single-molecule magnet: an ab initio investigation. Beilstein. J. Nanotechnol. 2014, 5, 2267–2274. [Google Scholar] [CrossRef] [PubMed]
  4. Zhang, P.; Jung, J.; Zhang, L.; Tang, J.; Le Guennic, B. Elucidating the magnetic anisotropy and relaxation dynamics of low-coordinate lanthanide compounds. Inorg. Chem. 2016, 55, 1905–1911. [Google Scholar] [CrossRef] [PubMed]
  5. Chibotaru, L.; Ungur, L.; Aronica, C.; Elmoll, H.; Pilet, G.; Luneau, D. Structure, magnetism, and theoretical study of a mixed-valence CoII3CoIII4 heptanuclear wheel: Lack of SMM behavior despite negative magnetic anisotropy. J. Am. Chem. Soc. 2008, 130, 12445–12455. [Google Scholar] [CrossRef] [PubMed]
  6. Ghosh, S.; Datta, S.; Friend, L.; Cardona-Serra, S.; Gaita-Arino, A.; Coronado, E.; Hill, S. Multi-frequency epr studies of a mononuclear holmium single-molecule magnet based on the polyoxometalate HoIII(W5O18)2]9−. Dalton Trans. 2012, 41, 13697–13704. [Google Scholar] [CrossRef] [PubMed]
  7. Boulon, M.-E.; Cucinotta, G.; Liu, S.-S.; Jiang, S.-D.; Ungur, L.; Chibotaru, L.F.; Gao, S.; Sessoli, R. Angular-resolved magnetometry beyond triclinic crystals: Out-of-equilibrium studies of Cp*Ercot single-molecule magnet. Chem. Eur. J. 2013, 19, 13726–13731. [Google Scholar] [CrossRef] [PubMed]
  8. Perfetti, M.; Cucinotta, G.; Boulon, M.-E.; El Hallak, F.; Gao, S.; Sessoli, R. Angular-resolved magnetometry beyond triclinic crystals part II: Torque magnetometry of Cp*Ercot single-molecule magnets. Chem. Eur. J. 2014, 20, 14051–14056. [Google Scholar] [CrossRef] [PubMed]
  9. Ridier, K.; Mondal, A.; Boilleau, C.; Gillon, B.; Chaboussant, G.; Le Guennic, B.; Costuas, K.; Lescouëzec, R. Polarized neutron diffraction to probe local magnetic anisotropy of a low-spin Fe(III) complex. Angew. Chem. Int. Ed. 2016, 55, 3963–3967. [Google Scholar] [CrossRef] [PubMed]
  10. Ridier, K.; Gillon, B.; Gukasov, A.; Chaboussant, G.; Cousson, A.; Luneau, D.; Borta, A.; Jacquot, J.-F.; Checa, R.; Chiba, Y.; et al. Polarized neutron diffraction as a tool for mapping the molecular magnetic anisotropy: Local susceptibility tensors in Co2+ complexes. Chem. Eur. J. 2016, 22, 724–735. [Google Scholar] [CrossRef] [PubMed]
  11. Sieber, A.; Boskovic, C.; Bircher, R.; Waldmann, O.; Ochsenbein, S.T.; Chaboussant, G.; Güdel, H.U.; Kirchner, N.; van Slageren, J.; Wernsdorfer, W.; et al. Synthesis and spectroscopic characterization of a new family of Ni4 spin clusters. Inorg. Chem. 2005, 44, 4315–4325. [Google Scholar] [CrossRef] [PubMed]
  12. Ruiz, E.; Rodriguez-Fortea, A.; Alemany, P.; Alvarez, S. Density functional study of the exchange coupling in distorted cubane complexes containing the Cu4O4core. Polyhedron 2001, 20, 1323–1327. [Google Scholar] [CrossRef]
  13. Gukasov, A.; Brown, P.J. Determination of atomic site susceptibility tensors from polarized neutron diffraction data. Phys. Condens. Matter 2002, 14, 8831–8839. [Google Scholar] [CrossRef]
  14. Petricek, V.; Dusek, M.; Palatinus, L. Crystallographic computing system JANA2006: General features. Z. Kristallogr. 2014, 229, 345–352. [Google Scholar]
  15. Nihei, M.; Hoshino, N.; Ito, T.; Oshio, H. Structures and magnetic properties of metal cubes. Polyhedron 2003, 22, 2359–2362. [Google Scholar] [CrossRef]
Figure 1. (a) salicylidene-2-ethanolamine (H2L); (b) molecular structure of [Ni4] cluster; and (c) the view of the cubane core with labels.
Magnetochemistry 03 00025 g001
Figure 2. Magnetic behavior of a polycrystalline sample. (a) Temperature dependence of the product of the magnetic susceptibility with temperature (χT) under an applied field of 0.1 T. (b) Field dependence of magnetization at 2 K.
Magnetochemistry 03 00025 g002
Figure 3. Field dependence of the magnetization at 2 K fora single crystal of [Ni4] with the magnetic field set parallel to the magnetic easy axis.
Magnetochemistry 03 00025 g003
Figure 4. Dependence of the product of the magnetic susceptibility with temperature (χT) with the rotation angle Φ at 10 K, under a static field of 0.1 T: (a) for a rotation around the crystal c axis and (b) for a rotation around the crystal b axis . The red curve is the simulation from the PND data.
Magnetochemistry 03 00025 g004
Figure 5. Dependence of the magnetization at 10 K with the magnetic field at the maxima and minima of the χT(Φ) curves: a) for the rotation around the c axis and b) for the rotation around the b axis.
Magnetochemistry 03 00025 g005
Figure 6. Magnetic ellipsoid associated to the cluster susceptibility tensor in projection along the crystal c axis. Easy axis is depicted in black, mean axis in green and hard axis in red. The pseudo-S4 symmetry axis is represented in blue.
Magnetochemistry 03 00025 g006
Figure 7. Magnetic ellipsoids associated to the Ni effective single ion susceptibility tensors: (a) in projection along the crystallographic c axis; and (b) in projection along the pseudo S4 axis. Easy axes are in black, mean axes in green and hard axes in red. The pseudo-symmetry axis S4 is represented in blue.
Magnetochemistry 03 00025 g007
Figure 8. Magnetic ellipsoids associated to the antiferromagnetic pairs: (a) Ni1–Ni4; and (b) Ni2–Ni3. The easy magnetic axes are represented in black, the mean axes in green and hard axes in red.
Magnetochemistry 03 00025 g008
Figure 9. Magnetic ellipsoids associated to the single-ion tensors for the Ni atoms involved in AF pairs, in projection along the S4 pseudo axis: (a) Ni1–Ni4; (b) Ni2–Ni3. The easy magnetic axes are represented in black, the mean axes in green, and the hard axes in red.
Magnetochemistry 03 00025 g009
Table 1. Details of the PND data collections.
PND Data Collections
Instrument5c1 (LLB)
Temperature (K)10
Field (T)2
Field components 1Hx−0.7022−0.3395−0.0256
Hy0.1858−0.93470.1361
Hz0.6873−0.10540.9904
Number of observations 241258273
Nobs with |1−R| > 2σ 477548
1 in the( i , j , k ) cartesian basis set.
Table 2. Details of the 4-circle neutron data collection and thermal parameter refinement.
4-Circle Neutron Diffraction Data Collection
Instrument5c2 (LLB)
Temperature (K)20
N measured reflections225
N merged reflections111
N used reflections (I > 3σ)91
N refined parameters5
R(F)0.124
Rw(F)0.133
GOF5.96
Table 3. Susceptibility tensor components in (μB/T) from PND for the cluster, individual ions, and antiferromagnetic pairs. As a footnote: the respective goodness-of-fits in the combined refinement are relative to the three different datasets.
χ11χ22χ33χ23χ31χ12
Cluster 1[Ni4]1.88(24)2.32(12)1.04(12)0.00.0−0.72(28)
Ions 2Ni10.63(18)0.68(12)0.16(9)0.00.00.0
Ni20.42(20)0.48(8)0.33(6)0.00.00.0
Ni30.23(18)0.58(9)0.32(7)0.00.0−0.18(12)
Ni40.74(21)0.85(11)0.20(9)0.00.0−0.33(13)
Pairs 3Ni1–Ni41.40(24)1.50(14)0.36(10)0.00.0−0.26(16)
Ni2–Ni30.60(16)1.02(10)0.66(8)0.00.00.0
1 GOF: 2.2, 2.3, 2.9; 2 GOF: 2.3, 2.0, 3.2; 3 GOF: 2.1, 2.1, 2.9.
Table 4. Eigenvalues of the susceptibility tensors in (μB/T) from PND for the cluster, individual ions, and antiferromagnetic pairs.
χ1χ2χ3
cluster[Ni4]2.841.361.04
ionsNi10.68(12)0.63(18)0.16(9)
Ni20.48(8)0.42(20)0.33(6)
Ni30.660.320.15
Ni41.130.460.20
pairsNi1–Ni41.721.180.36
Ni2–Ni31.02(10)0.66(8)0.60(16)
Table 5. Ni local geometry in [Ni4] from the X-ray structure [3]: distance between opposite atoms of the NiO5N octahedral.
Central AtomAxial d(O…O) (Å)Equatoriald(O…O) (Å)Equatoriald(N…O) (Å)
Ni1O8…O94.246O1…O23.990N1…O64.008
Ni2O6…O104.275O3…O44.007N2…O23.995
Ni3O4…O114.275O5…O63.987N3…O83.977
Ni4O2…O124.254O7…O83.997N4…O44.007
Table 6. Structural characteristics of the Ni2O2 bridges in [Ni4] from the X-ray structure [3].
CouplingNi…Ni DistanceNi–O–Ni AnglesShort Ni–O Bond LengthsLong Ni–O Bond Length
ferromagneticNi1–Ni23.03896.5–96.62.030, 2.040, 2.0512.116
Ni1–Ni33.03294.0–96.32.019, 2.024, 2.0512.121
Ni2–Ni43.04291.1–96.32.033, 2.040, 2.0502.115
Ni3–Ni43.03993.1–97.32.023, 2.024, 2.0502.136
antiferromagneticNi1–Ni43.184100.42.022, 2.0302.115, 2.121
Ni2–Ni33.195100.1–101.22.019, 2.0332.116, 2.136

