SERS Detection of Penicillin G Using Magnetite Decorated with Gold Nanoparticles


Department of Chemistry, CICECO-Aveiro Institute of Materials, University of Aveiro, 3810-193 Aveiro, Portugal
*
Author to whom correspondence should be addressed.
Magnetochemistry 2017, 3(4), 32; https://doi.org/10.3390/magnetochemistry3040032
Submission received: 30 August 2017
/
Revised: 16 October 2017
/
Accepted: 18 October 2017
/
Published: 23 October 2017
Abstract
:Sensitive and reliable procedures for detecting vestigial antibiotics are of great relevance for water quality monitoring due to the occurrence of such emergent pollutants in the aquatic environment. As such, we describe here research concerning the use of multifunctional nanomaterials combining magnetic and plasmonic components. These nanomaterials have been prepared by decorating magnetite nanoparticles (MNP) with colloidal gold nanoparticles (Au NPs) of distinct particle size distributions. Several analytical conditions were investigated in order to optimize the surface enhanced Raman scattering (SERS) detection of penicillin G (PG) dissolved in water. In particular, the dependence of the SERS signal by using distinct sized Au NPs adsorbed at the MNP was investigated. Additionally, microscopic methods, including Raman confocal microscopy, were employed to characterize the SERS substrates and then to qualitatively detect penicillin G using such substrates. For example, magnetic–plasmonic nanocomposites can be employed for magnetically concentrate analyte molecules and their removal from solution. As a proof of concept, we applied magneto-plasmonic nanosorbents in the removal of aqueous penicillin G and demonstrate the possibility of SERS sensing this antibiotic.
1. Introduction
Penicillin derivatives are among the most prescribed antibiotics and the presence of vestiges of these pharmaceuticals in water has been considered a global environmental problem. The human excretion of antibiotics without undergoing metabolism (up to 90%), the intentional disposal of unused drugs into the sewer and extensive veterinary use are the main factors that contribute to the presence of antibiotics in sewage [1,2]. Since conventional wastewater treatments do not efficiently eliminate these drugs, the fate of such contaminants is very often natural environments such as aquatic ecosystems. As such, several harmful consequences have been foreseen which have become evident through the frequent occurrence of antibiotic resistance among certain bacterial pathogens. As part of the solution to mitigate this problem, the vestigial detection of such antibiotics is important because this contaminant can bioaccumulate in aquatic life before entering into drinking water sources.
The conventional methods are time and cost consuming. Surface-enhanced Raman spectroscopy (SERS) allows the detection of several analytes and provides enhanced Raman signals of adsorbed molecules onto certain metal surfaces [3,4]. SERS enhancement occurs due to the interaction of an incident electromagnetic field with localized surface plasmon resonance (LSPR) observed on certain metals, such as colloidal silver and gold. This effect has been explained by two main mechanisms. Firstly, an electromagnetic effect in which there is a local field enhancement generated by the excitation of the LSPR of the metallic nanostructure; secondly, a chemical effect that arises due to the formation of a complex between the metal surface and the chemisorbed molecules. As a consequence, the total enhancement factor may be higher than 1010 [5,6], which turns this spectroscopic method into a powerful tool for trace detection in environmental monitoring applications. Indeed, a number of SERS substrates have been reported aimed at the detection of antibiotics in water [7,8,9,10,11,12,13]. Examples of SERS substrates for the detection of antibiotics include Ag colloids and Ag-loaded matrices, such as poly(styrene) and graphene.
The last decades have seen an unprecedented progress in the synthesis and applications of nanoparticles with distinct functionalities [14,15,16,17,18]. In particular, recent developments in nanomaterial science and environmental nanotechnology have provided new sorbents for water trace pollutants via magnetic separation [19,20,21,22]. The upgrade of such sorbents for simultaneous use in water purification and contaminant detection is a challenging task but of great practical interest for sensing applications, thus following current interest in developing multifunctional nanomaterials. In this context, the development of SERS-active magnetic nanomaterials has attracted much attention, because it provides innovative platforms that combine magnetic responsiveness and the ability for Raman monitoring within a single material [23,24,25,26,27,28,29,30,31,32,33,34,35,36,37]. Penicillin G (PG) belongs to the β-lactam antibiotics family whose structure is composed of a five-membered sulfur-containing thiazolidine ring fused to a beta-lactam ring and a phenyl ring attached to the side chain (Figure S1, Supporting Information). The intensive use of PG as a pharmaceutical associated with the potential contamination of waters has raised interest in the SERS analysis of this antibiotic [8,9,11,12,38,39,40,41,42,43,44]. To the best of our knowledge, there are no SERS studies on this analyte using magneto-plasmonic substrates. This prompts us to investigate the development of magnetic–plasmonic substrates for the detection of PG, also known as benzylpenicillin, in the context of water analysis. This research will demonstrate that dithiocarbamate functionalized magnetite particles are suitable sorbents for the uptake of colloidal Au NPs, thus yielding new SERS active substrates for the removal and detection of PG.
2. Results and Discussion
As a first step of this research, magnetite particles were prepared by the partial oxidation of a ferrous salt using a mild oxidant (KNO3) in alkaline conditions (KOH) [45]. The obtained nanoparticles showed a cubic shape and ferrimagnetic behavior with a saturation magnetization of 86 emu/g. The subsequent step involved the surface modification of the magnetite particles with hybrid siliceous shells enriched in dithiocarbamate groups [21]. This chemical surface modification procedure was carried out in order to promote the adsorption of colloidal Au NPs at the magnetite surfaces via sulfur donor groups (dithiocarbamate moieties), which are well known for their strong affinity to gold [46]. In fact, it is well known that soft acids (e.g., Au) have a strong chemical affinity to soft bases (e.g., S donor ligands), thus leading in this case to Au NPs decorating the dithiocarbamate functionalized magnetite particles.
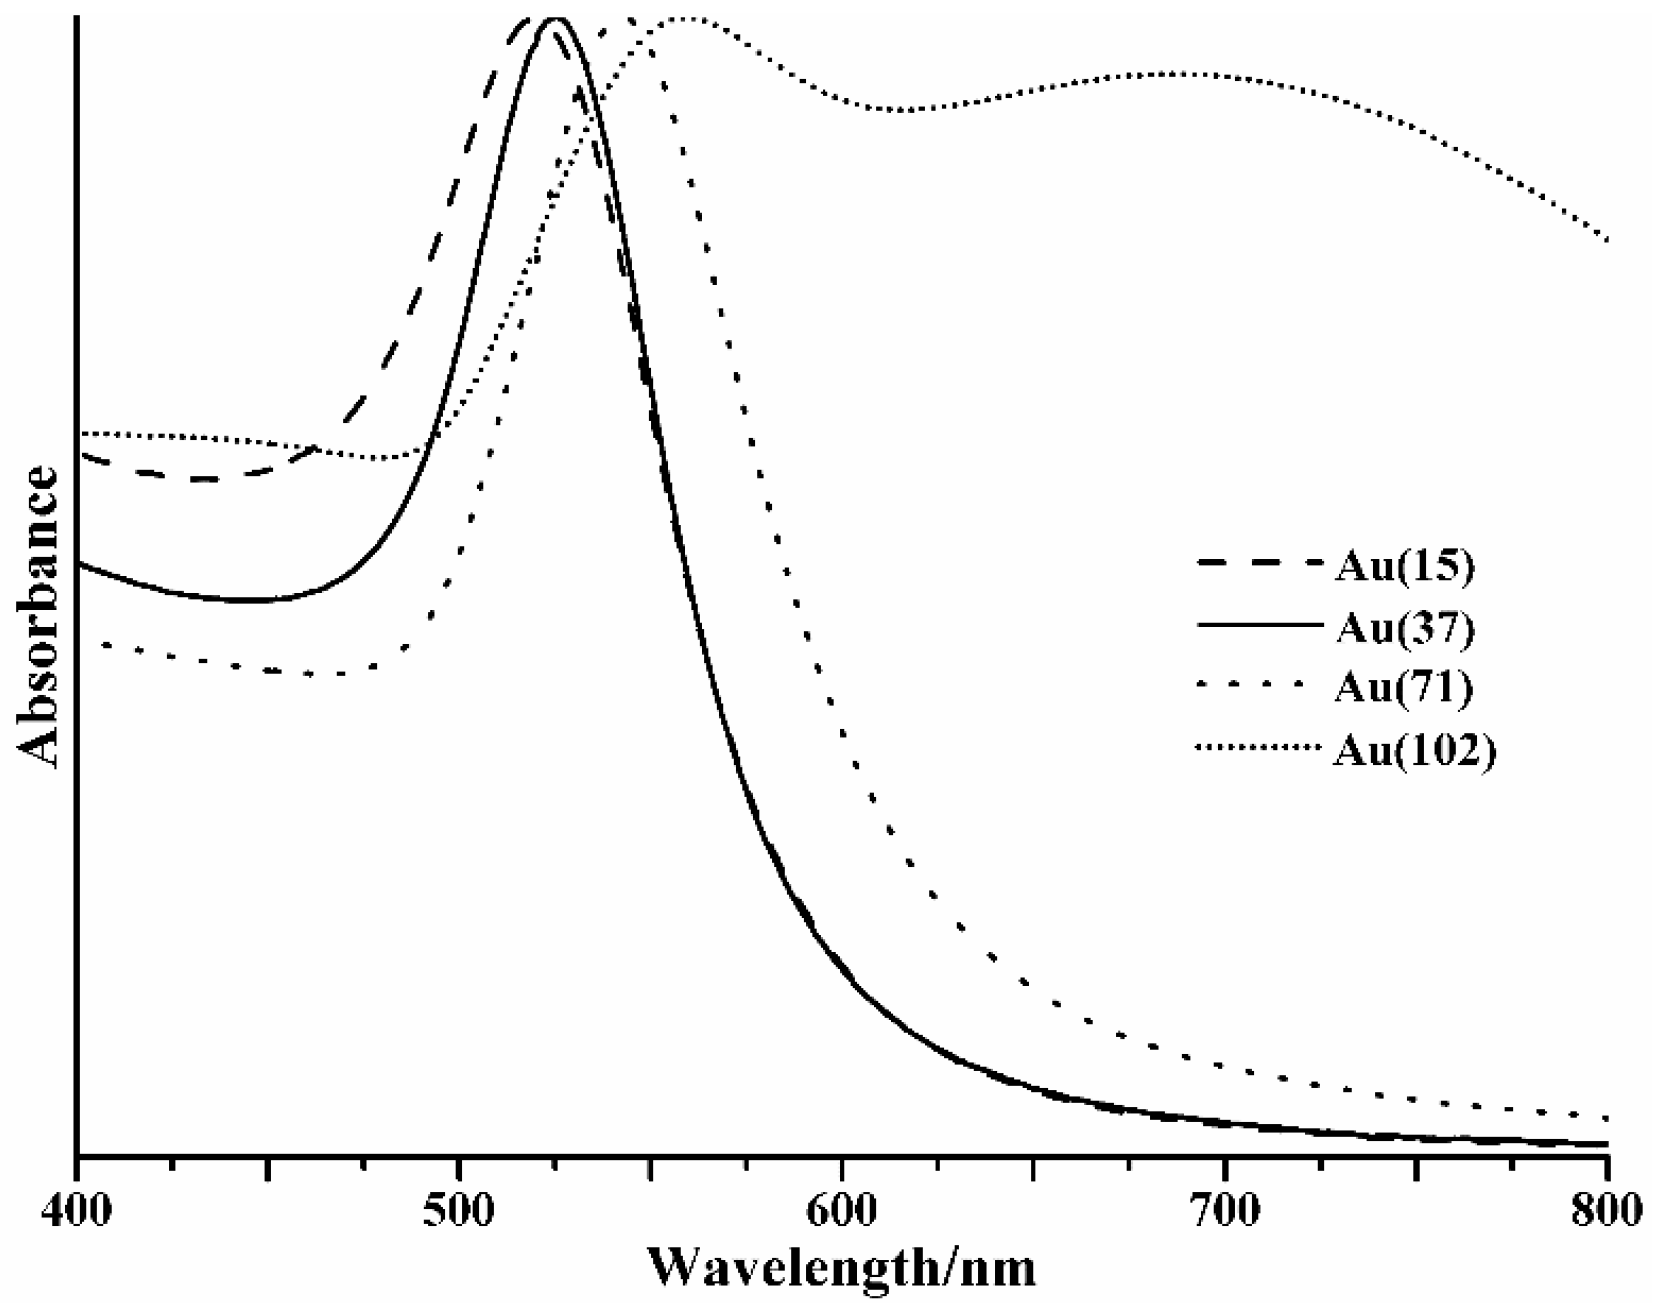
Distinctly-sized colloidal Au NPs were prepared using a seeded growth approach by following the method described by Ziegler and Eychmüller [47]. For this purpose, particles with an average diameter of 15.3 ± 1.5 nm were firstly synthesized by the citrate method and then used as seeds for their subsequent growth into larger nanoparticles. Colloidal Au NPs with an average diameter of 37 ± 2.5 nm were prepared using a one-step growth method, whereas the 71 ± 5.1 nm particles were obtained by using two growth steps and finally, a process of three growing steps was employed to produce particles of 102 ± 9.1 nm diameter. It is well known that LSPR of Au nanoparticles results in intense absorbance in the visible spectrum, whose location and profile depend on morphological features such as particle size and aggregation state. Figure 1 shows that as the average particle diameter increases, the absorption maximum is red-shifted from 525 to 542 nm and the broadening of the LSPR band occurs, probably due to an increase of size polydispersity. When the average diameter reaches 102 nm, there is a red-shift to 684 nm and a shoulder appears at lower wavelengths (∼550 nm), corresponding to a quadrupolar resonance [48,49].
The Au colloids were then contacted with an aqueous suspension of MNP, after which magnetic separation was performed in order to remove the nanosorbents from the suspension. It should be noted here that the dithiocarbamate groups on the surface of the magnetic adsorbents act as a glue between the Au NPs and the magnetite, resulting in robust magnetic–plasmonic structures. It is interesting to note that although using a distinct chemical strategy, metal alkyldithiocarbamates have also been used to produce metal sulfide nanophases decorating amorphous SiO2 particles [50]. Here, TEM analysis performed on the collected powders clearly shows cubic shaped magnetite particles decorated with Au nanospheres, whose size can vary depending on the starting colloid employed (Figure 2). The XRD patterns of the powdered samples confirmed the presence of the crystalline phases (Fe3O4 and Au) in these coupled nanostructures (Figure 3). The grey bars highlight the reflections of face centered cubic Au.
Figure 4 shows the SERS spectra of PG after depositing an aliquot of an aqueous solution (10−4 M, pH 5) of the antibiotic over distinct MNP-Au substrates. The conventional Raman spectrum of powdered PG is also shown for comparative purposes (Figure S2 shows the Raman spectrum in a wider wavenumber range). The stronger band in this spectrum is observed at 1000 cm−1, which is a Raman signature of PG, though its assignment has not been consensual in the literature. Hence, some authors have assigned this Raman band to the phenyl ring vibrational modes [8,9,12,39,40,42], while others assigned it to the presence of the beta lactam ring [11,38,41,44]. Nevertheless, for the magnetic–plasmonic substrates employed here, which differ in the average size of the Au NPs adsorbed at the surface, the SERS spectra always showed the band at about 1000 cm−1. This band appears in a spectral window in which only the Raman band assigned to the PG is observed, thus it is particularly useful as a diagnosis band for the presence of PG because there is no interference from bands ascribed to the substrate. Also, it should be noted that PG was not detected during Raman measurements performed in similar conditions, but using several MNP substrates without Au nanophases. This is consistent with the interpretation that the Raman band at 1000 cm−1 assigned to PG is a consequence of a surface enhancement effect due to the presence of the Au NPs. It has been reported that the band at about 1600 cm−1 (Figure S2) is particularly sensitive in SERS analysis, because it is thought to be associated to the interaction of the carboxylate group with the metal surface [11]. However, our substrates also show a Raman signal at this wavenumber region (Figure S2) and therefore such a band was not considered for further monitoring. On the other hand, the Au NPs are not uniformly distributed over the MNP surfaces, which might result in a SERS intensity signal dependent on the region analyzed. Although the homogeneity of solid substrates for SERS has been tackled using distinct strategies [51,52,53], the SERS spectra shown here are representative of several regions analyzed that originated a Raman signal for PG.
The TEM images (Figure 2) show that the Au NPs formed larger aggregates at the sorbents surfaces, which have been reported to provide sites of local strong enhancement of the electromagnetic field (“hot spots”) within interparticle junctions [54,55]. However, it is not clear that the aggregation state by itself could explain the differences observed in the SERS magnification signal among all the substrates employed. For example, visual inspection of TEM images corresponding to samples MNP-Au(71) and MNP-Au(102) does not provide distinct features concerning the aggregation state of the Au NPs over the magnetite surfaces. On the other hand, the magnetic–plasmonic substrates MNP-Au(37), MNP-Au(71), and MNP-Au(102) have shown extensive Au NP aggregation, as compared to those in which the Au seeds were used, and for which there was no observation of a SERS signal of PG.
The above discussion has confirmed the relevance of the morphological features of the magneto-plasmonic substrates in order to achieve a SERS signal for PG dissolved in water. Another important aspect to be considered here concerns the analytical conditions of the specimen itself, hence the pH of the aqueous solution can be determinant for the quality of the SERS analysis of PG. In fact, it is well known that PG undergoes fast degradation in alkaline conditions (pH > 7.5), wherein the amide bond opens to give penicilloic acid, while in acidic conditions (pH 3 or less) the β-lactam ring opens, leading to penillic acid as the final product [56]. These structural modifications cause significant changes in the electronic delocalization within the molecule and therefore can influence analyte detection by SERS. Hence, aqueous samples of PG at markedly distinct pH values (3 and 11) were used in our subsequent SERS analysis.
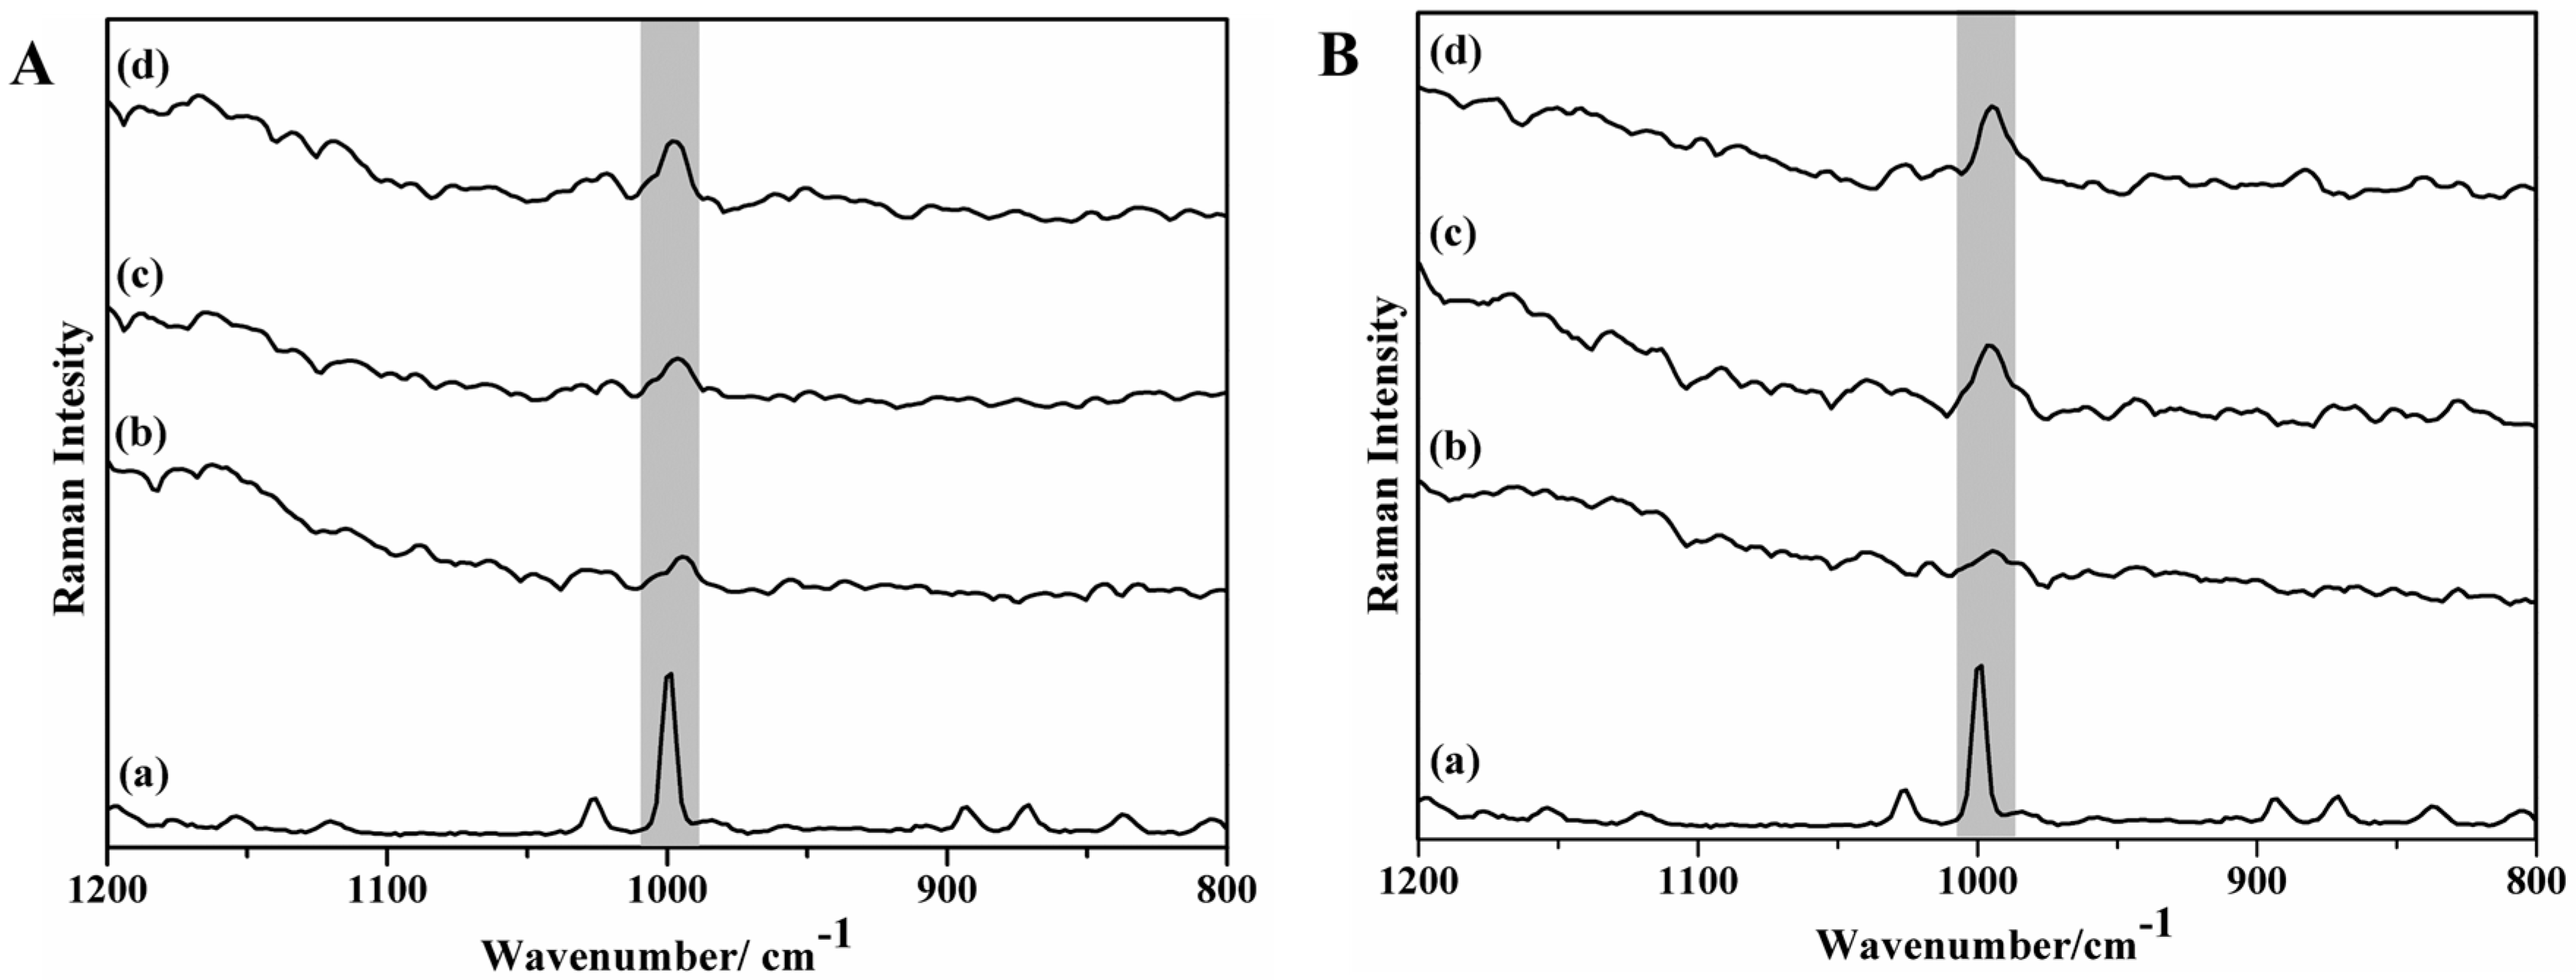
Figure 5A,B show the SERS spectra of PG at pH 3 and pH 11, respectively, using the three distinct MNP-Au solid substrates described above. In these conditions of acidic and alkaline pH, PG undergoes degradation, wherein the amide bond opens to give penillic acid and penicilloic acid (Figure 6) [56]. Figure 5A,B does not show significant differences by analyzing the band at 1000 cm−1 in the SERS spectra of PG acquired at a distinct pH. This has been observed regardless of the substrate employed in these measurements. These results are in line with the assignment of the band at 1000 cm−1 to the phenyl ring, which is not markedly affected by the degradation of the PG.
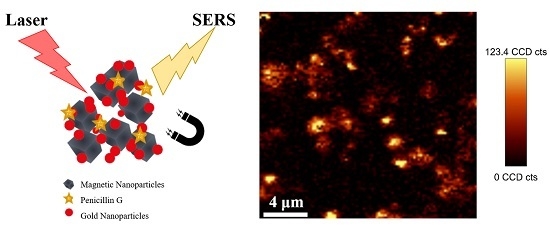
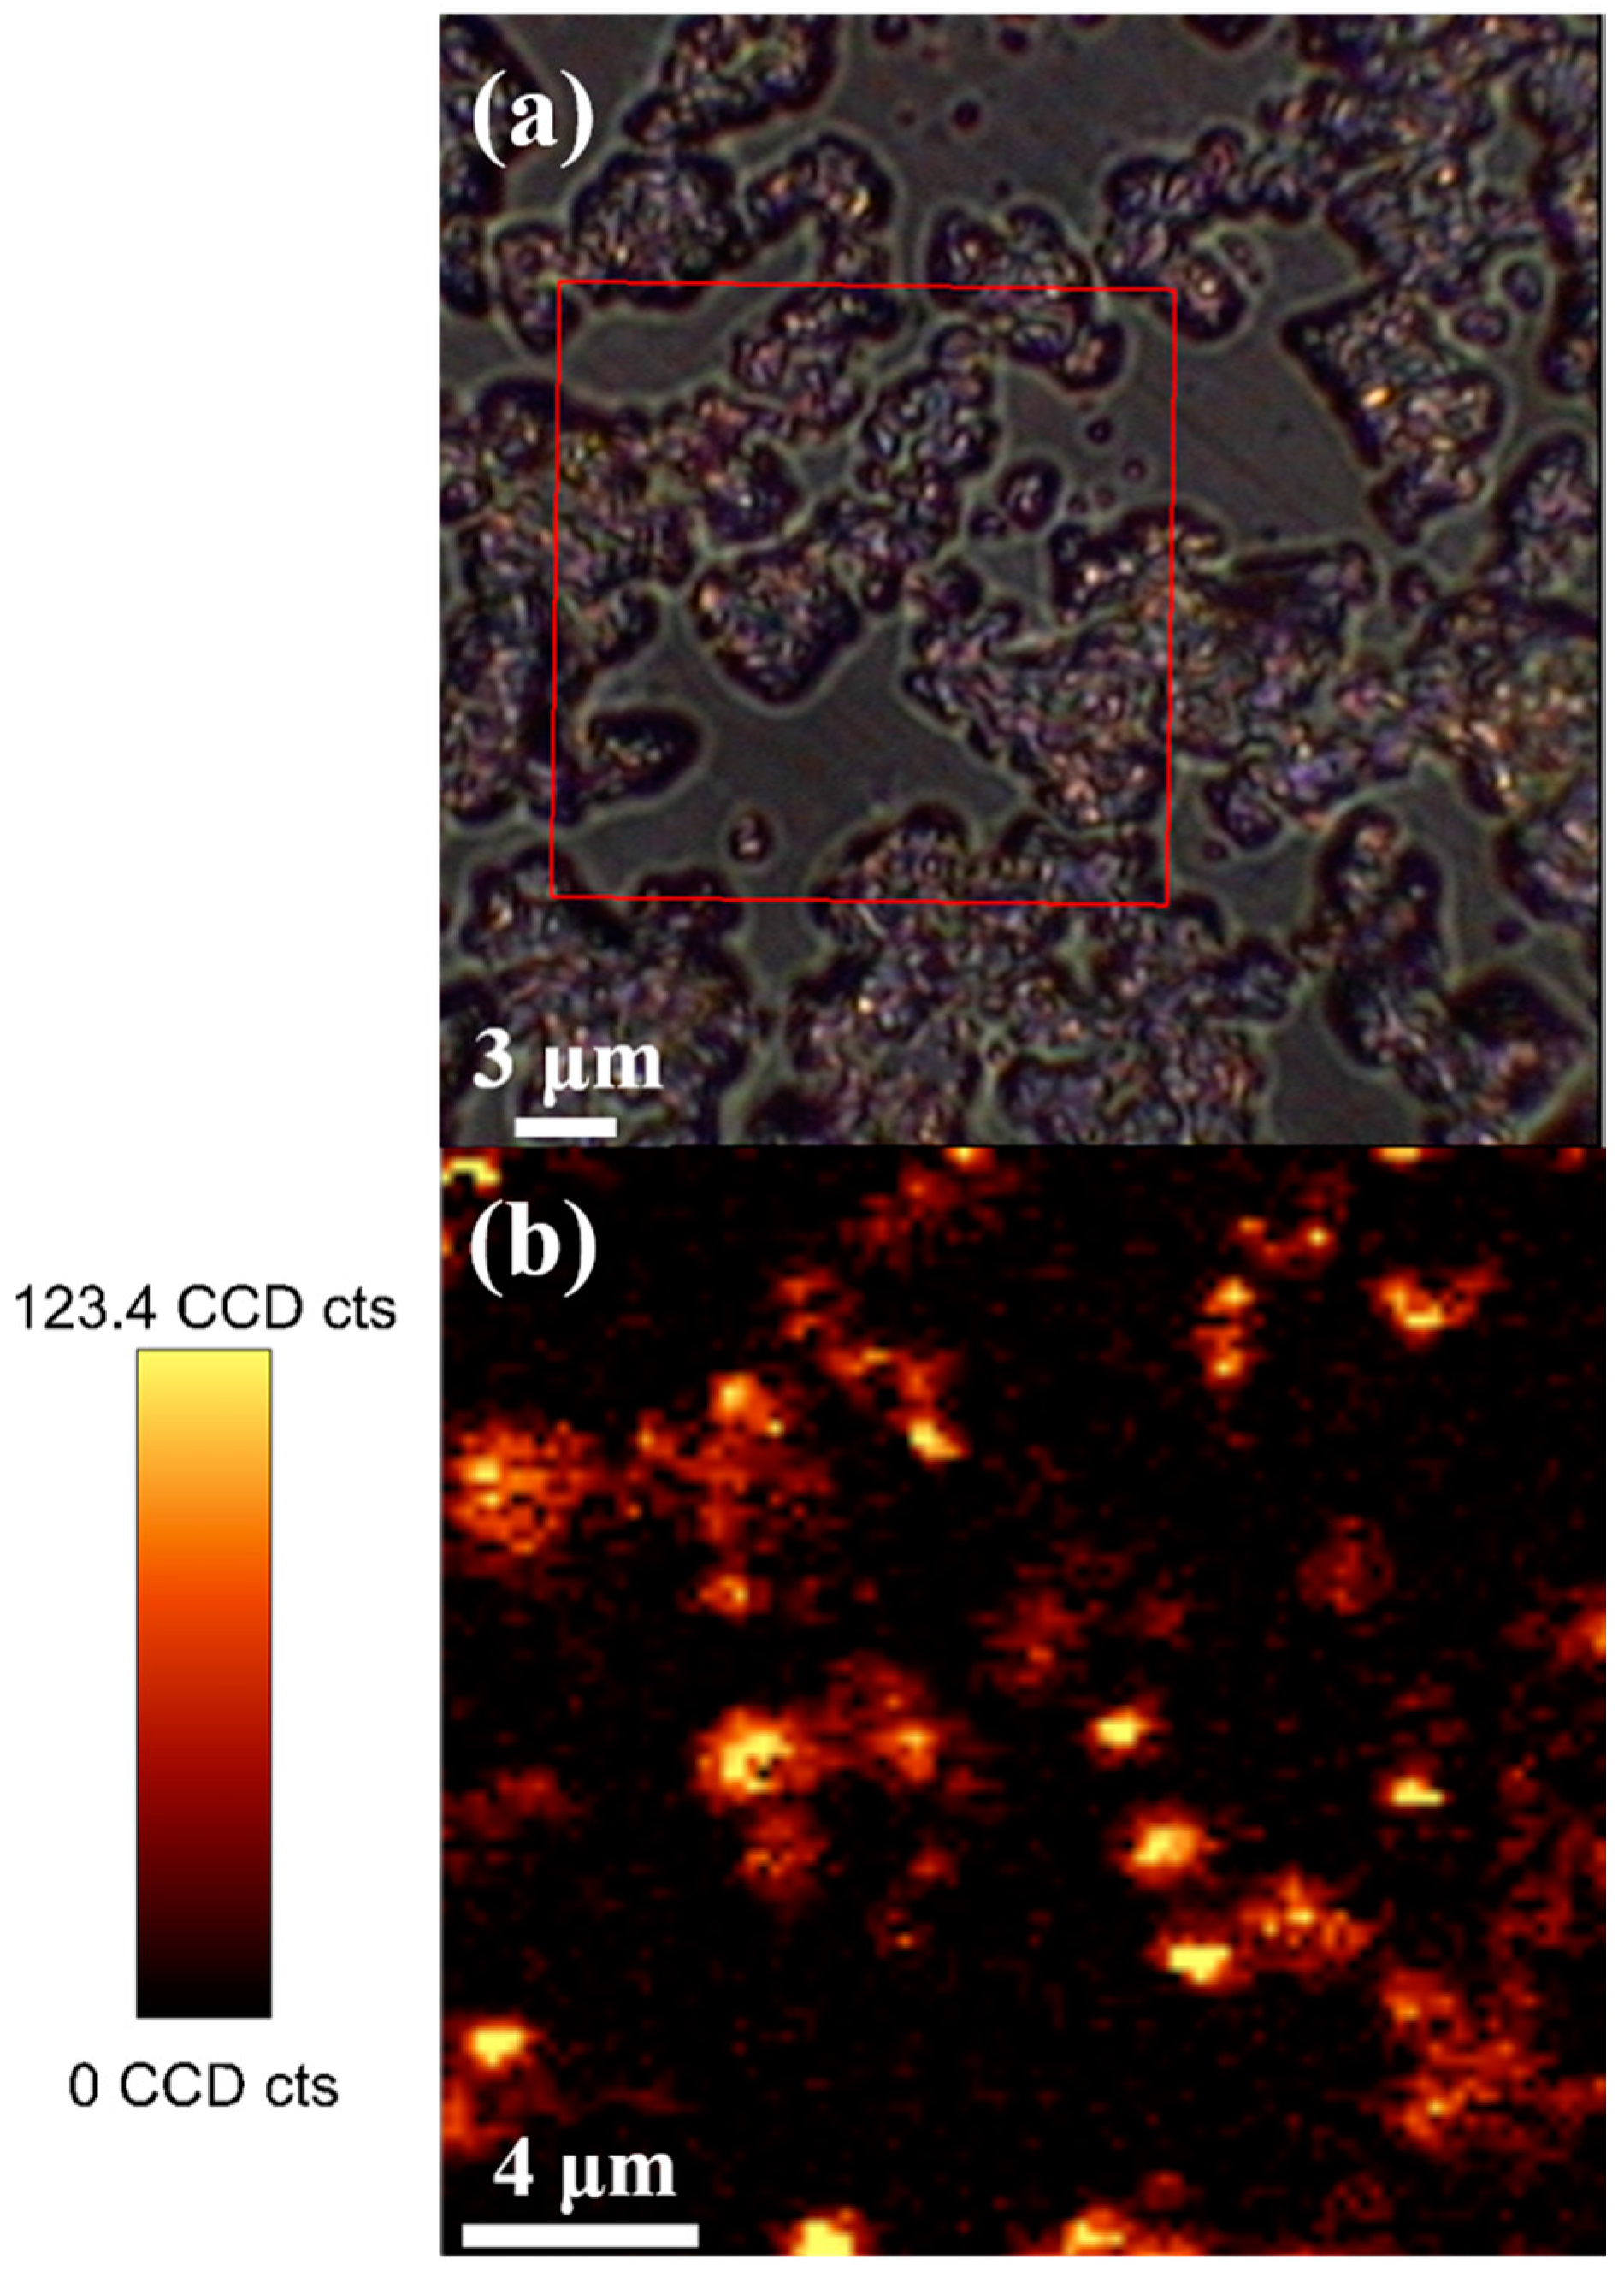
In order to explore the spatial distribution of the PG on the MNP-Au composite surface, Raman imaging of PG was recorded using MNP-Au(102) as the substrate. Figure 7 shows an optical micrograph together with the respective Raman image of PG. Raman imaging was performed using 10,000 spectra by raster-scanning the laser beam over a surface area around 10 × 10 μm and accumulating a full Raman spectrum at each pixel. Raman images were constructed by integrating over the Raman intensity of the PG band at 1000 cm−1. In Figure 7, the bright areas are associated to strong SERS signal intensities of PG, which also correspond to areas in which Au nanoparticles are necessarily present. Note that the Raman imaging of PG also shows regions of higher intensity in specific areas of the nanocomposite, which might be due to the presence of Au NP aggregates as discussed above for the TEM analysis (Figure 2d).
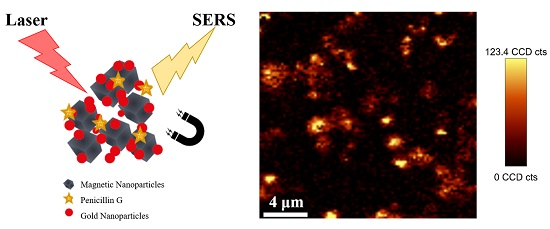
Although the main focus of this research has been the application of the magneto-plasmonic nanosorbents for the SERS detection of PG, some preliminary experiments were carried out aiming at the water removal and SERS detection of PG. Figure 8 shows the Raman imaging obtained from SERS analysis of PG, using MNP-Au(102) as substrates, after contacting these nanostructures with a solution 10−1 M in PG and subsequent magnetic separation using a laboratorial magnet (NdBFe). The first consequence to be drawn from the analysis of Figure 8 is the observation of regions rich in Au NPs in which adsorption of PG has occurred. These regions are assigned by the brighter yellow spots spread uniformly over the magnetic–plasmonic nanostructures. For the MNP-Au(102) substrates, the relative amount of Fe:Au, as determined by inductively coupled plasma (ICP) spectroscopy, was 0.00414:0.00359 molar ratio. Also note that these particles were collected magnetically from a colloidal suspension containing dissolved PG, thus the corresponding SERS signal results necessarily from PG adsorbates attached to the Au surfaces. Although further experiments using variable conditions will be necessary to establish the best analytical conditions for PG detection, the current results demonstrate the potential of the magneto-plasmonic nanosorbents described here for the SERS detection of PG.
3. Materials and Methods
3.1. Materials
Ferrous sulfate heptahydrate (FeSO4·7H2O, >99%), carbon disulfide (CS2, 99%), citric acid monohydrate (C6H8O7·H2O, ≥99%) and ethanol (CH3CH2OH, >99%) were obtained from Panreac. Potassium nitrate (KNO3, >99%), tetraethyl orthosilicate (Si(OC2H5)4, TEOS, 99%), sodium citrate tribasic dihydrate (Na3C6H5O7·2H2O, 99%), chloroauric acid trihydrate (HAuCl4·3H2O, ≥99.9%) and 3-aminopropyltriethoxysilane (H2N(CH2)3Si(OC2H5)3, APTES, >99%) were purchased from Sigma-Aldrich. Potassium hydroxide (KOH, >86%) and sodium hydroxide (NaOH, >98%) were purchased from Pronolab. Penicillin G sodium salt (C16H17N2NaO4S) and ascorbic acid (C6H8O6) were obtained from Alfa Aesar and José M. Vaz Pereira, respectively. Ammonia solution (NH3, 25%) was obtained from Riedel-de-Häen. All chemicals were used as received without any further purification and all aqueous solutions were freshly prepared using ultrapure water (18.2 mΩ·cm−1).
3.2. Preparation of MNP-Au Nanocomposites
Multifunctional nanomaterials combining magnetic and plasmonic components were prepared by the surface-modification of colloidal magnetite nanoparticles with siliceous shells enriched in dithiocarbamate groups [21], followed by adsorption of gold nanoparticles onto the silica surfaces [57].
3.2.1. Surface Functionalization of Magnetite Particles
The synthesis of dithiocarbamate functionalized Fe3O4 particles included two steps. Magnetite nanoparticles were prepared by hydrolysis of FeSO4·7H2O using a mixture of KOH and KNO3, under a N2 stream [45]. Then, a one-step procedure was performed for the encapsulation of as-prepared magnetite nanoparticles and the grafting of dithiocarbamate groups which include the alkaline hydrolysis of TEOS in the presence of the precursor siloxydithiocarbamate, SiDTC, using a previously reported method [21]. The compound SiDTC was obtained by conversion of APTES into the corresponding dithiocarbamate, involving the reaction of APTES with CS2 in alkaline medium by using sodium ethoxide as base [21,58].
3.2.2. Seeded-Growth Synthesis of Gold Nanoparticles
The Au NPs were prepared using a seeded-growth approach to obtain nanoparticles over a range of sizes. This method is based on the reduction of HAuCl4·3H2O using a mixture of ascorbic acid and sodium citrate as reducing agents. First, seed particle solutions were prepared using the citrate method, thus 2 mL of sodium citrate solution (1% w/v, containing 0.05% w/v citric acid) were added to 50 mL of HAuCl4·3H2O solution (10 mM) previously brought to boiling temperature under vigorous stirring. The solution was kept boiling for 5 min and was then allowed to cool down. These colloidal Au nanoparticles were used as seeds to obtain the bigger Au NPs following the method described by Ziegler and Eychmüller [47].
3.2.3. Adsorption of Gold Nanoparticles at the Surface of Magnetite Nanoparticles
Typically, magnetite particles (1 mg) were added to the Au colloid (20 mL) and the mixture was stirred overnight in dark conditions, using a minirotator. This procedure was repeated for each Au colloid characterized by a distinct average particle size. The nanocomposites MNP-Au(15), MNP-Au(37), MNP-Au(71) and MNP-Au(102) were collected by a magnet NdBFe, followed by washing with deionized water.
3.3. SERS Experiments
The MNP-Au nanocomposites with distinct Au NPs were used as SERS substrates for the detection of PG. Aqueous solutions of PG with distinct concentrations (10−1–10−4 M) were prepared to establish the lower detection limit for the substrates used in SERS. Thus, a drop of the MNP-Au suspension was added to a glass slide and then a laboratorial magnet (NdBFe) was placed under the glass holder while the water was evaporated. Then, an aliquot (10 μL) of the analyte solution was deposited on the surface of MNP-Au nanocomposites and left drying at room temperature. For all the SERS measurements, the pure magnetic nanoparticles were used as a control sample. The effect of protonation and deprotonation of PG was investigated by recording the SERS spectra at different pH values (3, 6, and 11) using NaOH (0.1 M) and HCl (0.1 M) solutions to adjust the pH of solutions of the analyte. The SERS experiments were performed in different areas of the nanocomposites in order to check the reproducibility of the measurements.
Uptake of PG from Water and SERS Detection
The ability of MNP-Au(102) composites to uptake and subsequently detect PG was preliminarily assessed by contacting the substrates (1 mg) with an aqueous solution of PG (50 mL, 10−1 M) under stirring for 15 h (minirotor). The sample was analyzed by SERS after magnetic separation of the MNP-Au(102) particles using a magnet. Then the sample was added to a glass slide and dried at room temperature.
3.4. Instrumentation
A Jasco V560 Ultraviolet/visible (UV/Vis) spectrophotometer (JASCO Inc., Mary’s Court, Easton, MD, USA) was used for recording the absorption spectra of the samples. The morphology and size of the particles were analyzed by transmission electron microscopy (TEM), using a Hitachi H-9000 TEM microscope operating at 300 kV (Chiyoda, Tokyo, Japan). Samples for the TEM analysis were prepared by evaporating the diluted suspensions of the NPs on a copper grid coated with an amorphous carbon film. For a selected magneto-plasmonic sample, the relative amount of Fe/Au was determined by ICP by dissolving the sample in a strong acidic solution under microwave heating. Raman spectral imaging was performed in a combined Raman-AFM-SNOM confocal microscope WITec alpha300 RAS+ (WITec, Ulm, Germany) at CICECO, in the Chemistry Department of the University of Aveiro. A He:Ne laser operating at 633 nm was used as the excitation source with the power set at 500 μW (nanocomposite-based samples) and at 22 mW (PG aqueous solutions). Raman imaging experiments were performed by raster-scanning the laser beam over the samples and accumulating a full Raman spectrum at each pixel. Raman images were constructed by integrating specific Raman bands using WITEC software (WITec, Ulm, Germany) for data evaluation and processing. The crystallite phase of the nanoparticles was identified using an X-ray diffractometer Philips X’Pert equipped with a Cu Kα monochromatic radiation source. The PG adsorption experiments were performed using a Grant Bio PTR-25 360 Vertical Mini Rotator (Cambridge, UK).
4. Conclusions
We investigated the use of magnetic Fe3O4 nanosorbents for the uptake of plasmonic nanoparticles as a strategy to design new magnetic–plasmonic SERS substrates. In these systems, the magnetic nanosorbents had their surface modified with dithiocarbamate groups, which allows the chemisorption of Au NPs and subsequent application as SERS active surfaces for the detection of PG dissolved in water. This strategy offers a convenient method to develop further studies envisaging the optimization of the substrate performance by adsorbing the magnetic particles with Au colloidal NPs with distinct SERS activity. The focus of this research was mainly to demonstrate the potential of such substrates for PG detection using the SERS effect, although there is potential for using the magneto-plasmonic properties of such materials in other water remediation processes [59,60]. For example, multifunctional nanosorbents combining magnetic and plasmonic components can be explored for the removal and laboratorial detection of a certain analyte or for monitoring a water purification process. Although this is not a straightforward procedure due to the number of optimization parameters involved, our preliminary results clearly showed that the magneto-plasmonic nanosorbents described here are promising systems for those purposes and can be further explored in such environmental applications.
Supplementary Materials
The following are available online at www.mdpi.com/2312-7481/3/4/32/s1.
Acknowledgments
P. C. Pinheiro thanks the Fundação para a Ciência e Tecnologia (FCT) for the PhD grant SFRH/BD/96731/2013. S. Fateixa thanks FCT for the grant SFRH/BPD/93547/2013. This work was financed by national funding from FCT by FEDER through program COMPETE and by national funding through FCT in the frame of project CICECO—FCOMP-01-0124-FEDER-037271 (Ref. FCT Pest-C/CTM/LA0011/2013).
Author Contributions
Paula C. Pinheiro performed the laboratory work, including the synthesis, Raman spectroscopy studies and general characterization of all the materials. Sara Fateixa performed and designed the Raman confocal microscopy experiments. Tito Trindade supervised the research. All the authors have analyzed the data and made contributions to the writing of the paper.
Conflicts of Interest
The authors declare no conflict of interest.
References
- Kümmerer, K. Antibiotics in the aquatic environment—A review—Part I. Chemosphere 2009, 75, 417–434. [Google Scholar] [CrossRef] [PubMed]
- Kümmerer, K. Antibiotics in the aquatic environment—A review—Part II. Chemosphere 2009, 75, 435–441. [Google Scholar] [CrossRef] [PubMed]
- Aroca, R. Surface-Enhanced Vibrational Spectroscopy; John Wiley & Sons, Ltd.: Chichester, UK, 2006; ISBN 9780470035641. [Google Scholar]
- Fateixa, S.; Nogueira, H.I.S.; Trindade, T. Hybrid nanostructures for SERS: Materials development and chemical detection. Phys. Chem. Chem. Phys. 2015, 17, 21046–21071. [Google Scholar] [CrossRef] [PubMed]
- Abbas, A.; Brimer, A.; Slocik, J.M.; Tian, L.; Naik, R.R.; Singamaneni, S. Multifunctional analytical platform on a paper strip: Separation, preconcentration, and subattomolar detection. Anal. Chem. 2013, 85, 3977–3983. [Google Scholar] [CrossRef] [PubMed]
- Nie, S.; Emory, S.R. Probing single molecules and single nanoparticles by Surface-Enhanced Raman Scattering. Science 1997, 275, 1102–1106. [Google Scholar] [CrossRef] [PubMed]
- Zhao, K.; Zhao, J.; Wu, C.J.; Zhang, S.W.; Deng, Z.W.; Hu, X.X.; Chen, M.L.; Peng, B. Fabrication of silver-decorated sulfonated polystyrene microspheres for surface-enhanced Raman scattering and antibacterial applications. RSC Adv. 2015, 5, 69543–69554. [Google Scholar] [CrossRef]
- Li, Y.T.; Qu, L.L.; Li, D.W.; Song, Q.X.; Fathi, F.; Long, Y.T. Rapid and sensitive in-situ detection of polar antibiotics in water using a disposable Ag-graphene sensor based on electrophoretic preconcentration and surface-enhanced Raman spectroscopy. Biosens. Bioelectron. 2013, 43, 94–100. [Google Scholar] [CrossRef] [PubMed]
- Clarke, S.J.; Littleford, R.E.; Smith, W.E.; Goodacre, R. Rapid monitoring of antibiotics using Raman and surface enhanced Raman spectroscopy. Analyst 2005, 130, 1019–1026. [Google Scholar] [CrossRef] [PubMed]
- Calborean, A.; Maniu, D.; Chis, V.; Iliescu, T.; Rastogi, V.K. Raman and SERS investigations of trihydrate amoxicillin. J. Optoelectron. Adv. Mater. 2007, 9, 680–685. [Google Scholar]
- Iliescu, T.; Baia, M.; Pavel, I. Raman and SERS investigations of potassium benzylpenicillin. J. Raman Spectrosc. 2006, 37, 318–325. [Google Scholar] [CrossRef]
- Filgueiras, A.L.; Paschoal, D.; Santos, F.D.; Sant, A.C. Adsorption study of antibiotics on silver nanoparticle surfaces by surface-enhanced Raman scattering spectroscopy. Spectrochim. Acta Part A Mol. Biomol. Spectrosc. 2015, 136, 979–985. [Google Scholar] [CrossRef] [PubMed]
- Xie, Y.; Zhu, X.; Sun, Y.; Wang, H.; Qian, H.; Yao, W. Rapid detection method for nitrofuran antibiotic residues by surface-enhanced Raman spectroscopy. Eur. Food Res. Technol. 2012, 235, 555–561. [Google Scholar] [CrossRef]
- Alivisatos, A.P. Perspectives on the physical chemistry of semiconductor nanocrystals. J. Phys. Chem. 1996, 100, 13226–13239. [Google Scholar] [CrossRef]
- Esteves, A.C.C.; Trindade, T. Synthetic studies on II/VI semiconductor quantum dots. Curr. Opin. Solid State Mater. Sci. 2002, 6, 347–353. [Google Scholar] [CrossRef]
- Khajeh, M.; Laurent, S.; Dastafkan, K. Nanoadsorbents: Classification, preparation, and applications (with emphasis on aqueous media). Chem. Rev. 2013, 113, 7728–7768. [Google Scholar] [CrossRef] [PubMed]
- Kango, S.; Kalia, S.; Celli, A.; Njuguna, J.; Habibi, Y.; Kumar, R. Surface modification of inorganic nanoparticles for development of organic-inorganic nanocomposites—A review. Prog. Polym. Sci. 2013, 38, 1232–1261. [Google Scholar] [CrossRef]
- Riley, M.; Vermerris, W. Recent advances in nanomaterials for gene delivery—A review. Nanomaterials 2017, 7, 94. [Google Scholar] [CrossRef] [PubMed]
- Dave, P.N.; Chopda, L.V. Application of iron oxide nanomaterials for the removal of heavy metals. J. Nanotechnol. 2014, 2014, 1–14. [Google Scholar] [CrossRef]
- Xu, P.; Zeng, G.M.; Huang, D.L.; Feng, C.L.; Hu, S.; Zhao, M.H.; Lai, C.; Wei, Z.; Huang, C.; Xie, G.X.; et al. Use of iron oxide nanomaterials in wastewater treatment: A review. Sci. Total Environ. 2012, 424, 1–10. [Google Scholar] [CrossRef] [PubMed]
- Tavares, D.S.; Daniel-da-Silva, A.L.; Lopes, C.B.; Silva, N.J.O.; Amaral, V.S.; Rocha, J.; Pereira, E.; Trindade, T. Efficient sorbents based on magnetite coated with siliceous hybrid shells for removal of mercury ions. J. Mater. Chem. A 2013, 1, 8134–8143. [Google Scholar] [CrossRef]
- Pinheiro, P.C.; Sousa, C.T.; Araújo, J.P.; Guiomar, A.J.; Trindade, T. Functionalization of nickel nanowires with a fluorophore aiming at new probes for multimodal bioanalysis. J. Colloid Interface Sci. 2013, 410, 21–26. [Google Scholar] [CrossRef] [PubMed] [Green Version]
- Contreras-Cáceres, R.; Abalde-Cela, S.; Guardia-Girós, P.; Fernández-Barbero, A.; Pérez-Juste, J.; Alvarez-Puebla, R.A.; Liz-Marzán, L.M. Multifunctional microgel magnetic/optical traps for SERS ultradetection. Langmuir 2011, 27, 4520–4525. [Google Scholar] [CrossRef] [PubMed]
- Zhai, Y.; Zhai, J.; Wang, Y.; Guo, S.; Ren, W.; Dong, S. Fabrication of iron oxide core/gold shell submicrometer spheres with nanoscale surface roughness for efficient surface-enhanced Raman scattering. J. Phys. Chem. C 2009, 113, 7009–7014. [Google Scholar] [CrossRef]
- Yu, W.; Huang, Y.; Pei, L.; Fan, Y.; Wang, X.; Lai, K. Magnetic Fe3O4/Ag hybrid nanoparticles as surface-enhanced raman scattering substrate for trace analysis of furazolidone in fish feeds. J. Nanomater. 2014, 2014, 1–8. [Google Scholar] [CrossRef]
- Hu, Y.; Sun, Y. Stable magnetic hot spots for simultaneous concentration and ultrasensitive surface-enhanced Raman scattering detection of solution analytes. J. Phys. Chem. C 2012, 116, 13329–13335. [Google Scholar] [CrossRef]
- Baniukevic, J.; Hakki Boyaci, I.; Goktug Bozkurt, A.; Tamer, U.; Ramanavicius, A.; Ramanaviciene, A. Magnetic gold nanoparticles in SERS-based sandwich immunoassay for antigen detection by well oriented antibodies. Biosens. Bioelectron. 2013, 43, 281–288. [Google Scholar] [CrossRef] [PubMed]
- Zhang, H.; Harpster, M.H.; Park, H.J.; Johnson, P.A.; Wilson, W.C. Surface-enhanced raman scattering detection of DNA derived from the west nile virus genome using magnetic capture of raman-active gold nanoparticles. Anal. Chem. 2011, 83, 254–260. [Google Scholar] [CrossRef] [PubMed]
- Kadasala, N.R.; Wei, A. Trace detection of tetrabromobisphenol A by SERS with DMAP-modified magnetic gold nanoclusters. Nanoscale 2015, 7, 10931–10935. [Google Scholar] [CrossRef] [PubMed]
- Han, X.X.; Schmidt, A.M.; Marten, G.; Fischer, A.; Weidinger, I.M.; Hildebrandt, P. Magnetic silver hybrid nanoparticles for surface-enhanced resonance raman spectroscopic detection and decontamination of small toxic molecules. ACS Nano 2013, 7, 3212–3220. [Google Scholar] [CrossRef] [PubMed]
- Sun, H.-L.; Xu, M.-M.; Guo, Q.-H.; Yuan, Y.-X.; Shen, L.-M.; Gu, R.-A.; Yao, J.-L. Surface enhanced Raman spectroscopic studies on magnetic Fe3O4@AuAg alloy core—Shell nanoparticles. Spectrochim. Acta Part A Mol. Biomol. Spectrosc. 2013, 114, 579–585. [Google Scholar] [CrossRef] [PubMed]
- Kim, K.; Choi, J.; Lee, H.B.; Shin, K.S. Silanization of Ag-deposited magnetite particles: An efficient route to fabricate magnetic nanoparticle-based raman barcode materials. ACS Appl. Mater. Interfaces 2010, 2, 1872–1878. [Google Scholar] [CrossRef] [PubMed]
- Du, J.; Jing, C. Preparation of thiol modified Fe3O4@Ag magnetic SERS probe for PAHs detection and identification. J. Phys. Chem. C 2011, 115, 17829–17835. [Google Scholar] [CrossRef]
- Wang, J.; Wu, X.; Wang, C.; Rong, Z.; Ding, H.; Li, H.; Li, S.; Shao, N.; Dong, P.; Xiao, R.; et al. Facile synthesis of Au-coated magnetic nanoparticles and their application in bacteria detection via a SERS method. ACS Appl. Mater. Interfaces 2016, 8, 19958–19967. [Google Scholar] [CrossRef] [PubMed]
- Wheeler, D.A.; Adams, S.A.; López-luke, T.; Torres-Castro, A.; Zhang, J.Z. Magnetic Fe3O4-Au core-shell nanostructures for surface enhanced Raman scattering. Ann. Phys. 2012, 679, 670–679. [Google Scholar] [CrossRef]
- Quaresma, P.; Osório, I.; Carvalho, P.A.; Pereira, A.; Langer, J.; Araújo, J.P.; Pastoriza-Santos, I.; Liz-Marzán, L.M.; Franco, R.; Baptista, P.V.; et al. Star-shaped magnetite@gold nanoparticles for protein magnetic separation and SERS detection. RSC Adv. 2014, 4, 3659–3667. [Google Scholar] [CrossRef]
- Hu, F.; Lin, H.; Zhang, Z.; Liao, F.; Shao, M.; Lifshitz, Y.; Lee, S.-T. Smart liquid SERS substrates based on Fe3O4/Au nanoparticles with reversibly tunable enhancement factor for practical quantitative detection. Sci. Rep. 2015, 4, 1–10. [Google Scholar] [CrossRef] [PubMed]
- Jiang, X.; Qin, X.; Yin, D.; Gong, M.; Yang, L.; Zhao, B.; Ruan, W. Rapid monitoring of benzylpenicillin sodium using Raman and surface enhanced Raman spectroscopy. Spectrochim. Acta Part A Mol. Biomol. Spectrosc. 2015, 140, 474–478. [Google Scholar] [CrossRef] [PubMed]
- Reipa, V.; Horvath, J.J. Surface-Enhanced Raman Study of Benzylpenicillin. Appl. Spectrosc. 1992, 46, 1009–1013. [Google Scholar] [CrossRef]
- Peng, Y.; Liu, M.; Zhao, J.; Yuan, H.; Li, Y.; Tao, J.; Guo, H. Determination of benzylpenicillin potassium residues in duck meat using surface enhanced raman spectroscopy with Au nanoparticles. J. Spectrosc. 2016, 2016, 1–7. [Google Scholar] [CrossRef]
- Chen, Y.; Li, X.; Yang, M.; Yang, L.; Han, X.; Jiang, X.; Zhao, B. High sensitive detection of penicillin G residues in milk by surface-enhanced Raman scattering. Talanta 2017, 167, 236–241. [Google Scholar] [CrossRef] [PubMed]
- Zhou, Q.; Thokchom, A.K.; Kim, D.J.; Kim, T. Inkjet-printed Ag micro-/nanostructure clusters on Cu substrates for in-situ pre-concentration and surface-enhanced Raman scattering. Sensors Actuators B Chem. 2017, 243, 176–183. [Google Scholar] [CrossRef]
- Zhao, K.; Wu, C.; Deng, Z.; Guo, Y.; Peng, B. Preparation of silver decorated silica nanocomposite rods for catalytic and surface-enhanced Raman scattering applications. RSC Adv. 2015, 5, 52726–52736. [Google Scholar] [CrossRef]
- El-Zahry, M.R.; Refaat, I.H.; Mohamed, H.A.; Rosenberg, E.; Lendl, B. Utility of surface enhanced Raman spectroscopy (SERS) for elucidation and simultaneous determination of some penicillins and penicilloic acid using hydroxylamine silver nanoparticles. Talanta 2015, 144, 710–716. [Google Scholar] [CrossRef] [PubMed]
- Girginova, P.I.; Daniel-da-Silva, A.L.; Lopes, C.B.; Figueira, P.; Otero, M.; Amaral, V.S.; Pereira, E.; Trindade, T. Silica coated magnetite particles for magnetic removal of Hg2+ from water. J. Colloid Interface Sci. 2010, 345, 234–240. [Google Scholar] [CrossRef] [PubMed]
- Xue, Y.; Li, X.; Li, H.; Zhang, W. Quantifying thiol-gold interactions towards the efficient strength control. Nat. Commun. 2014, 5, 1–9. [Google Scholar] [CrossRef] [PubMed]
- Ziegler, C.; Eychmüller, A. Seeded growth synthesis of uniform gold nanoparticles with diameters of 15–300 nm. J. Phys. Chem. C 2011, 115, 4502–4506. [Google Scholar] [CrossRef]
- Niu, J.; Zhu, T.; Liu, Z. One-step seed-mediated growth of 30–150 nm quasispherical gold nanoparticles with 2-mercaptosuccinic acid as a new reducing agent. Nanotechnology 2007, 18, 325607–325614. [Google Scholar] [CrossRef]
- Rodríguez-Fernández, J.; Pérez-Juste, J.; García De Abajo, F.J.; Liz-Marzán, L.M. Seeded growth of submicron Au colloids with quadrupole plasmon resonance modes. Langmuir 2006, 22, 7007–7010. [Google Scholar] [CrossRef] [PubMed]
- Monteiro, O.C.; Esteves, A.C.C.; Trindade, T. The synthesis of SiO2@CdS nanocomposites using single-molecule precursors. Chem. Mater. 2002, 14, 2900–2904. [Google Scholar] [CrossRef] [Green Version]
- Polavarapu, L.; Pérez-Juste, J.; Xu, Q.-H.; Liz-Marzán, L.M. Optical sensing of biological, chemical and ionic species through aggregation of plasmonic nanoparticles. J. Mater. Chem. C 2014, 2, 7460–7476. [Google Scholar] [CrossRef]
- Gómez-Graña, S.; Fernández-López, C.; Polavarapu, L.; Salmon, J.B.; Leng, J.; Pastoriza-Santos, I.; Pérez-Juste, J. Gold nanooctahedra with tunable size and microfluidic-induced 3D assembly for highly uniform SERS-active supercrystals. Chem. Mater. 2015, 27, 8310–8317. [Google Scholar] [CrossRef]
- Fernández-López, C.; Polavarapu, L.; Solís, D.M.; Taboada, J.M.; Obelleiro, F.; Contreras-Cáceres, R.; Pastoriza-Santos, I.; Pérez-Juste, J. Gold nanorod-pNIPAM hybrids with reversible plasmon coupling: Synthesis, modeling, and SERS properties. ACS Appl. Mater. Interfaces 2015, 7, 12530–12538. [Google Scholar] [CrossRef] [PubMed]
- Kneipp, H.; Kneipp, K. Surface-enhanced hyper Raman scattering in silver colloidal solutions. J. Raman Spectrosc. 2005, 36, 551–554. [Google Scholar] [CrossRef]
- Radziuk, D.; Moehwald, H. Prospects for plasmonic hot spots in single molecule SERS towards the chemical imaging of live cells. Phys. Chem. Chem. Phys. 2015, 17, 21072–21093. [Google Scholar] [CrossRef] [PubMed]
- Deshpande, A.D.; Baheti, K.G.; Chatterjee, N.R. Degradation of β-lactam antibiotics. Curr. Sci. 2004, 87, 1684–1695. [Google Scholar]
- Lopes, J.L.; Marques, K.L.; Girão, A.V.; Pereira, E.; Trindade, T. Functionalized magnetite particles for adsorption of colloidal noble metal nanoparticles. J. Colloid Interface Sci. 2016, 475, 96–103. [Google Scholar] [CrossRef] [PubMed]
- Goubert-Renaudin, S.; Schneider, R.; Walcarius, A. Synthesis of new dithiocarbamate-based organosilanes for grafting on silica. Tetrahedron Lett. 2007, 48, 2113–2116. [Google Scholar] [CrossRef]
- Fernandes, T.; Soares, S.; Trindade, T.; Daniel-da-Silva, A. Magnetic hybrid nanosorbents for the uptake of paraquat from water. Nanomaterials 2017, 7, 68. [Google Scholar] [CrossRef] [PubMed]
- Sreeju, N.; Rufus, A.; Philip, D. Studies on catalytic degradation of organic pollutants and anti-bacterial property using biosynthesized CuO nanostructures. J. Mol. Liq. 2017, 242, 690–700. [Google Scholar] [CrossRef]
Figure 1.
Visible spectra of distinctly sized Au colloidal nanoparticles (NPs).

Figure 2.
TEM images of surface modified MNP (magnetite nanoparticles) decorated with Au nanospheres of distinct average sizes: (a) MNP-Au(15); (b) MNP-Au(37); (c) MNP-Au(71); (d) MNP-Au(102).
Figure 2.
TEM images of surface modified MNP (magnetite nanoparticles) decorated with Au nanospheres of distinct average sizes: (a) MNP-Au(15); (b) MNP-Au(37); (c) MNP-Au(71); (d) MNP-Au(102).
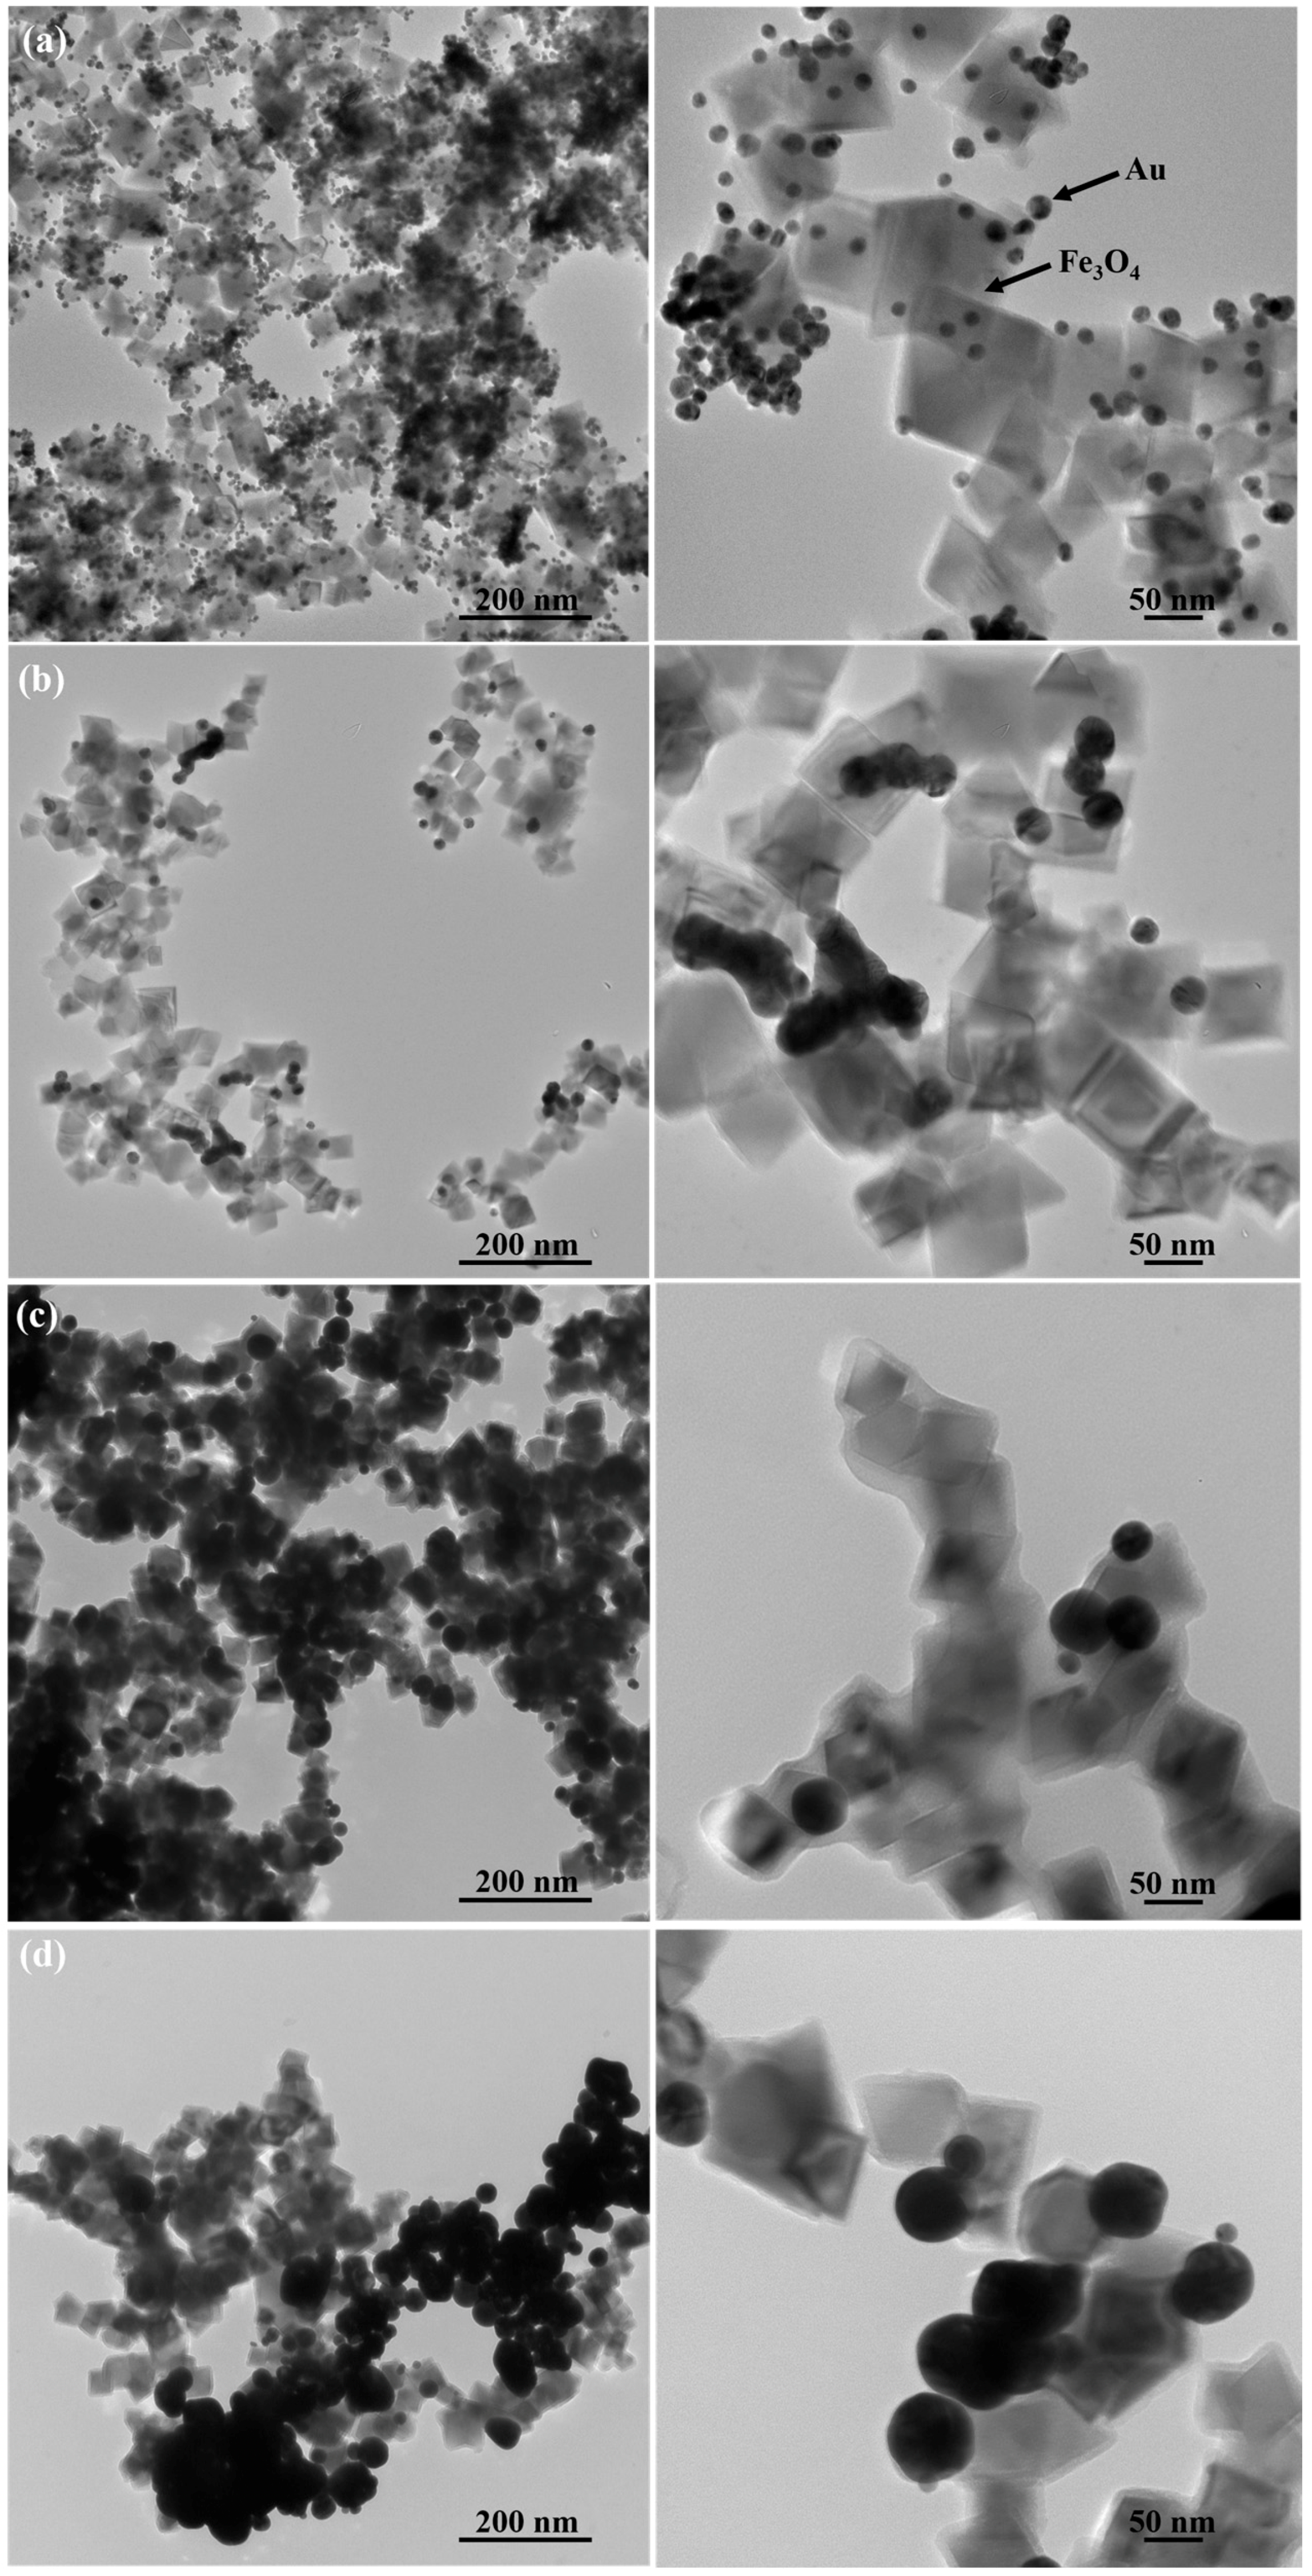
Figure 3.
XRD diffraction patterns of (a) MNP-Au(15); (b) MNP-Au(37); (c) MNP-Au(71); (d) MNP-Au(102).
Figure 3.
XRD diffraction patterns of (a) MNP-Au(15); (b) MNP-Au(37); (c) MNP-Au(71); (d) MNP-Au(102).
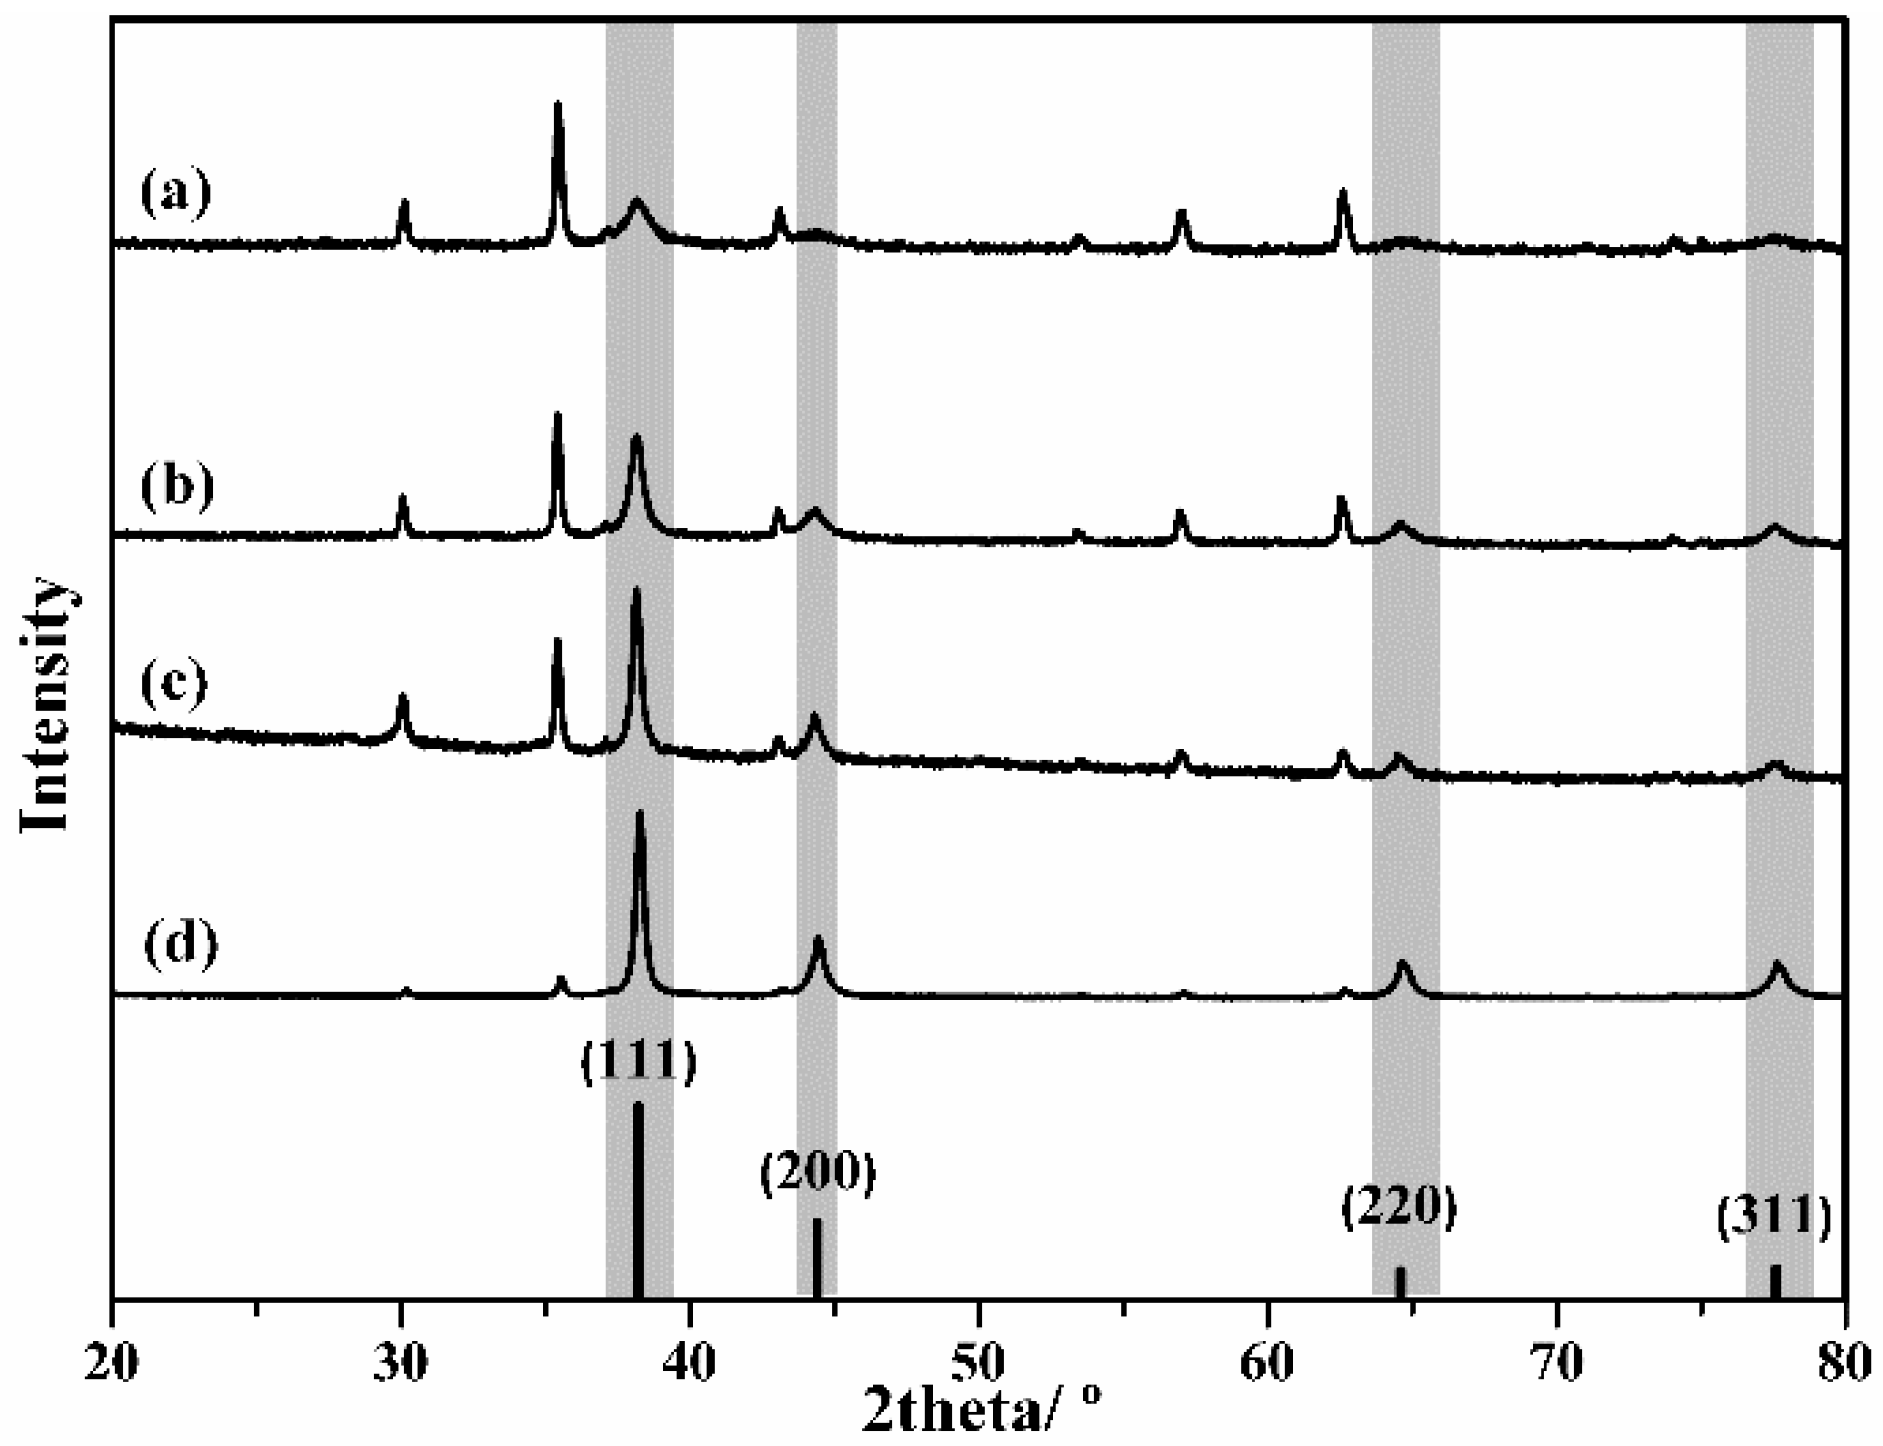
Figure 4.
(a) Conventional Raman spectrum of PG solid; and SERS monitoring of the 1000 cm−1 PG diagnosis band at pH 5, using a solution in the analyte with concentration 10−4 M: (b) MNP-Au(37); (c) MNP-Au(71); (d) MNP-Au(102) solid substrate (excitation line 633 nm).
Figure 4.
(a) Conventional Raman spectrum of PG solid; and SERS monitoring of the 1000 cm−1 PG diagnosis band at pH 5, using a solution in the analyte with concentration 10−4 M: (b) MNP-Au(37); (c) MNP-Au(71); (d) MNP-Au(102) solid substrate (excitation line 633 nm).
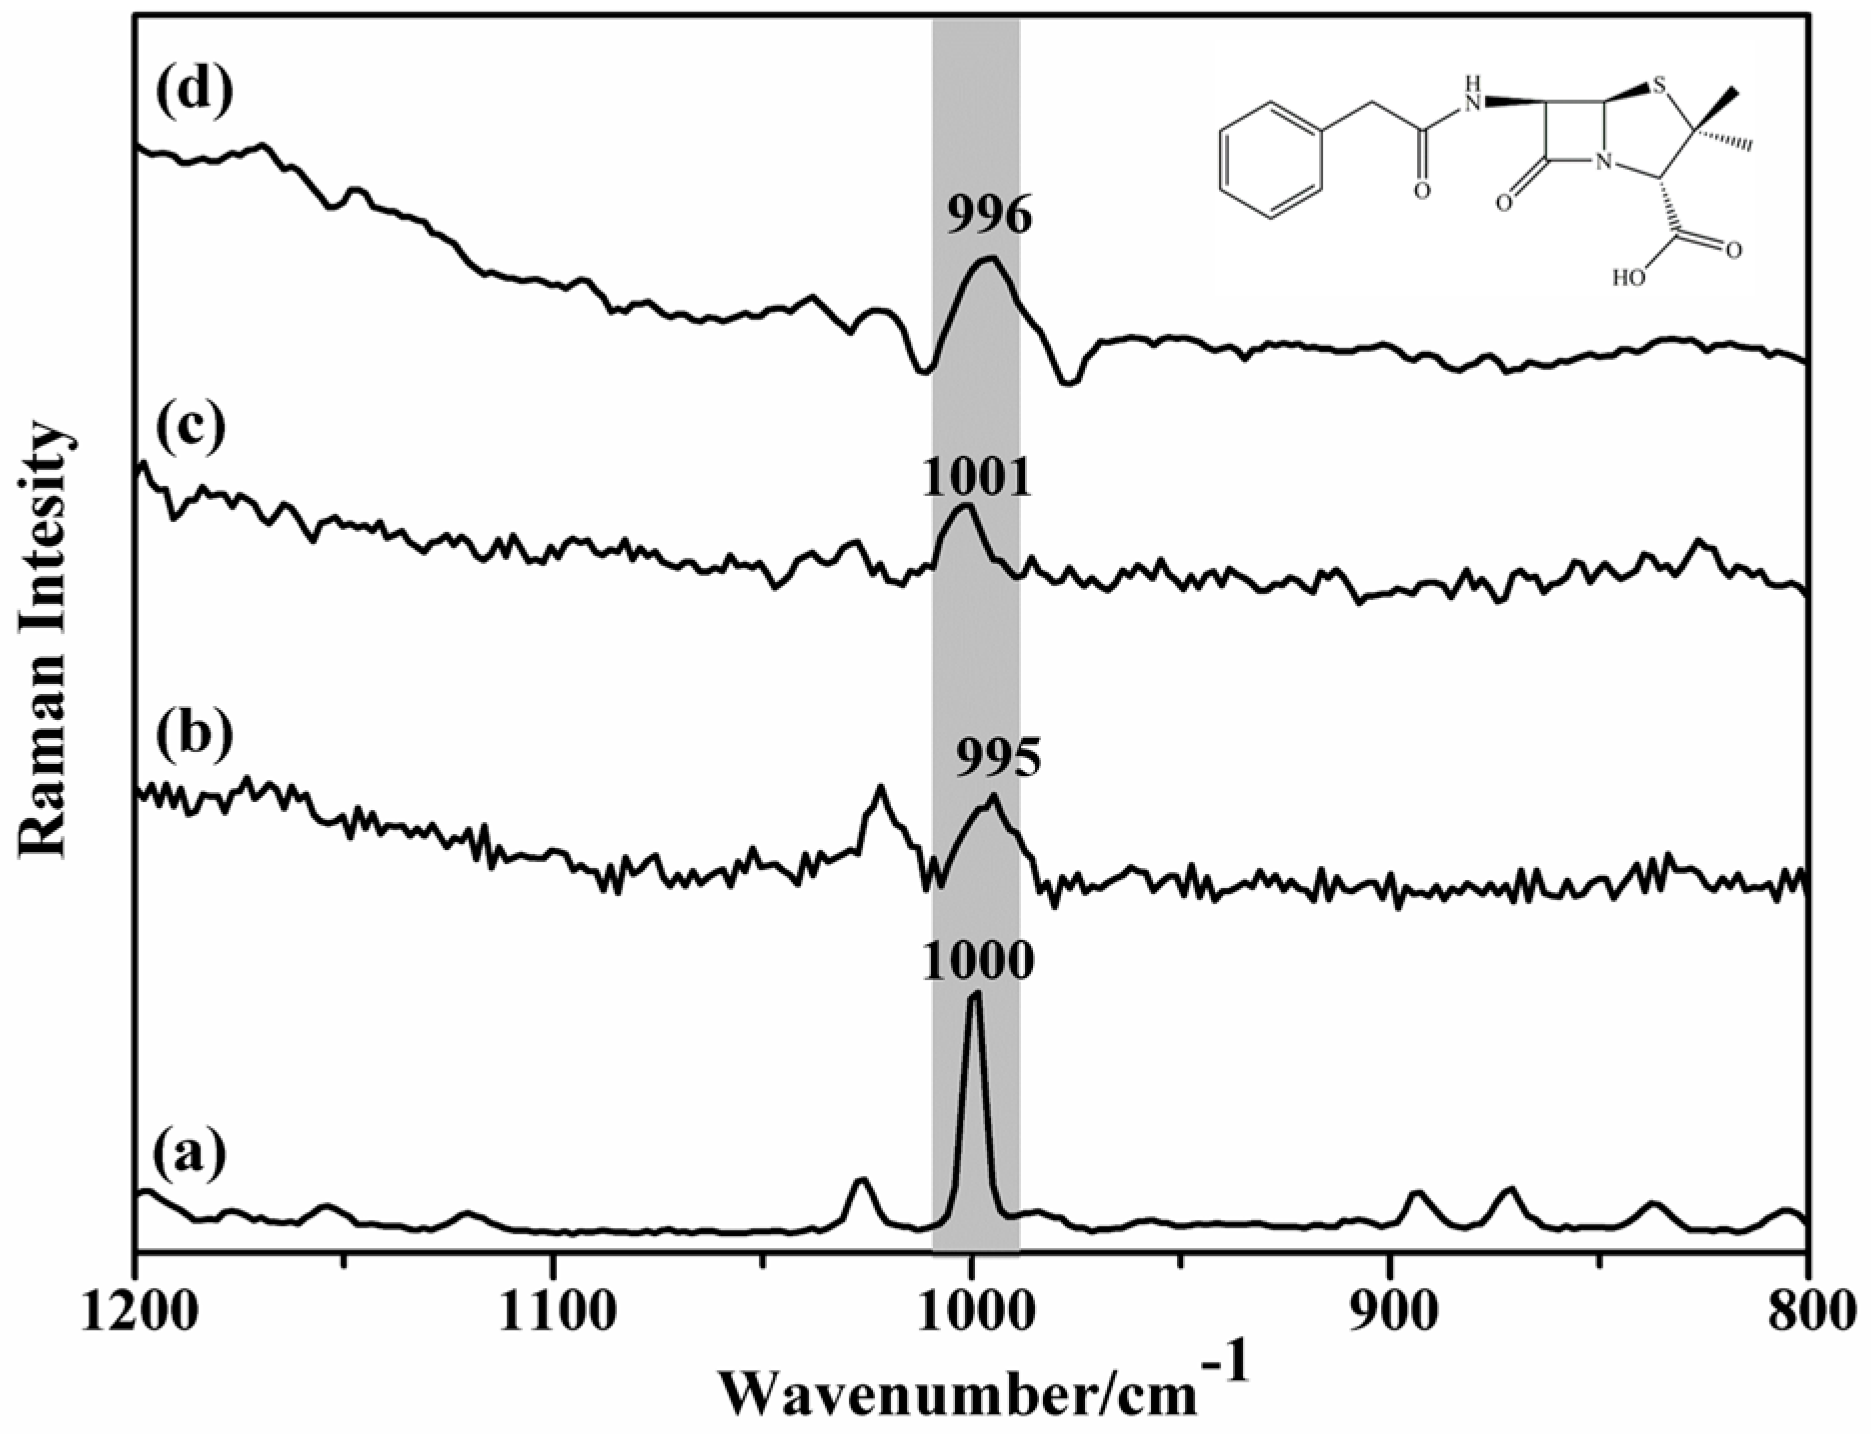
Figure 5.
SERS monitoring of the 1000 cm−1 PG diagnosis band, for a solution with concentration 10−4 M in the analyte and at pH 3 (A) and at pH 11 (B): (a) Conventional Raman spectrum of powdered PG and SERS using variable substrates, (b) MNP-Au(37); (c) MNP-Au(71); (d) MNP-Au(102) solid substrate (excitation line 633 nm).

Figure 6.
Chemical structures of PG and derived compounds at acidic and alkaline conditions.
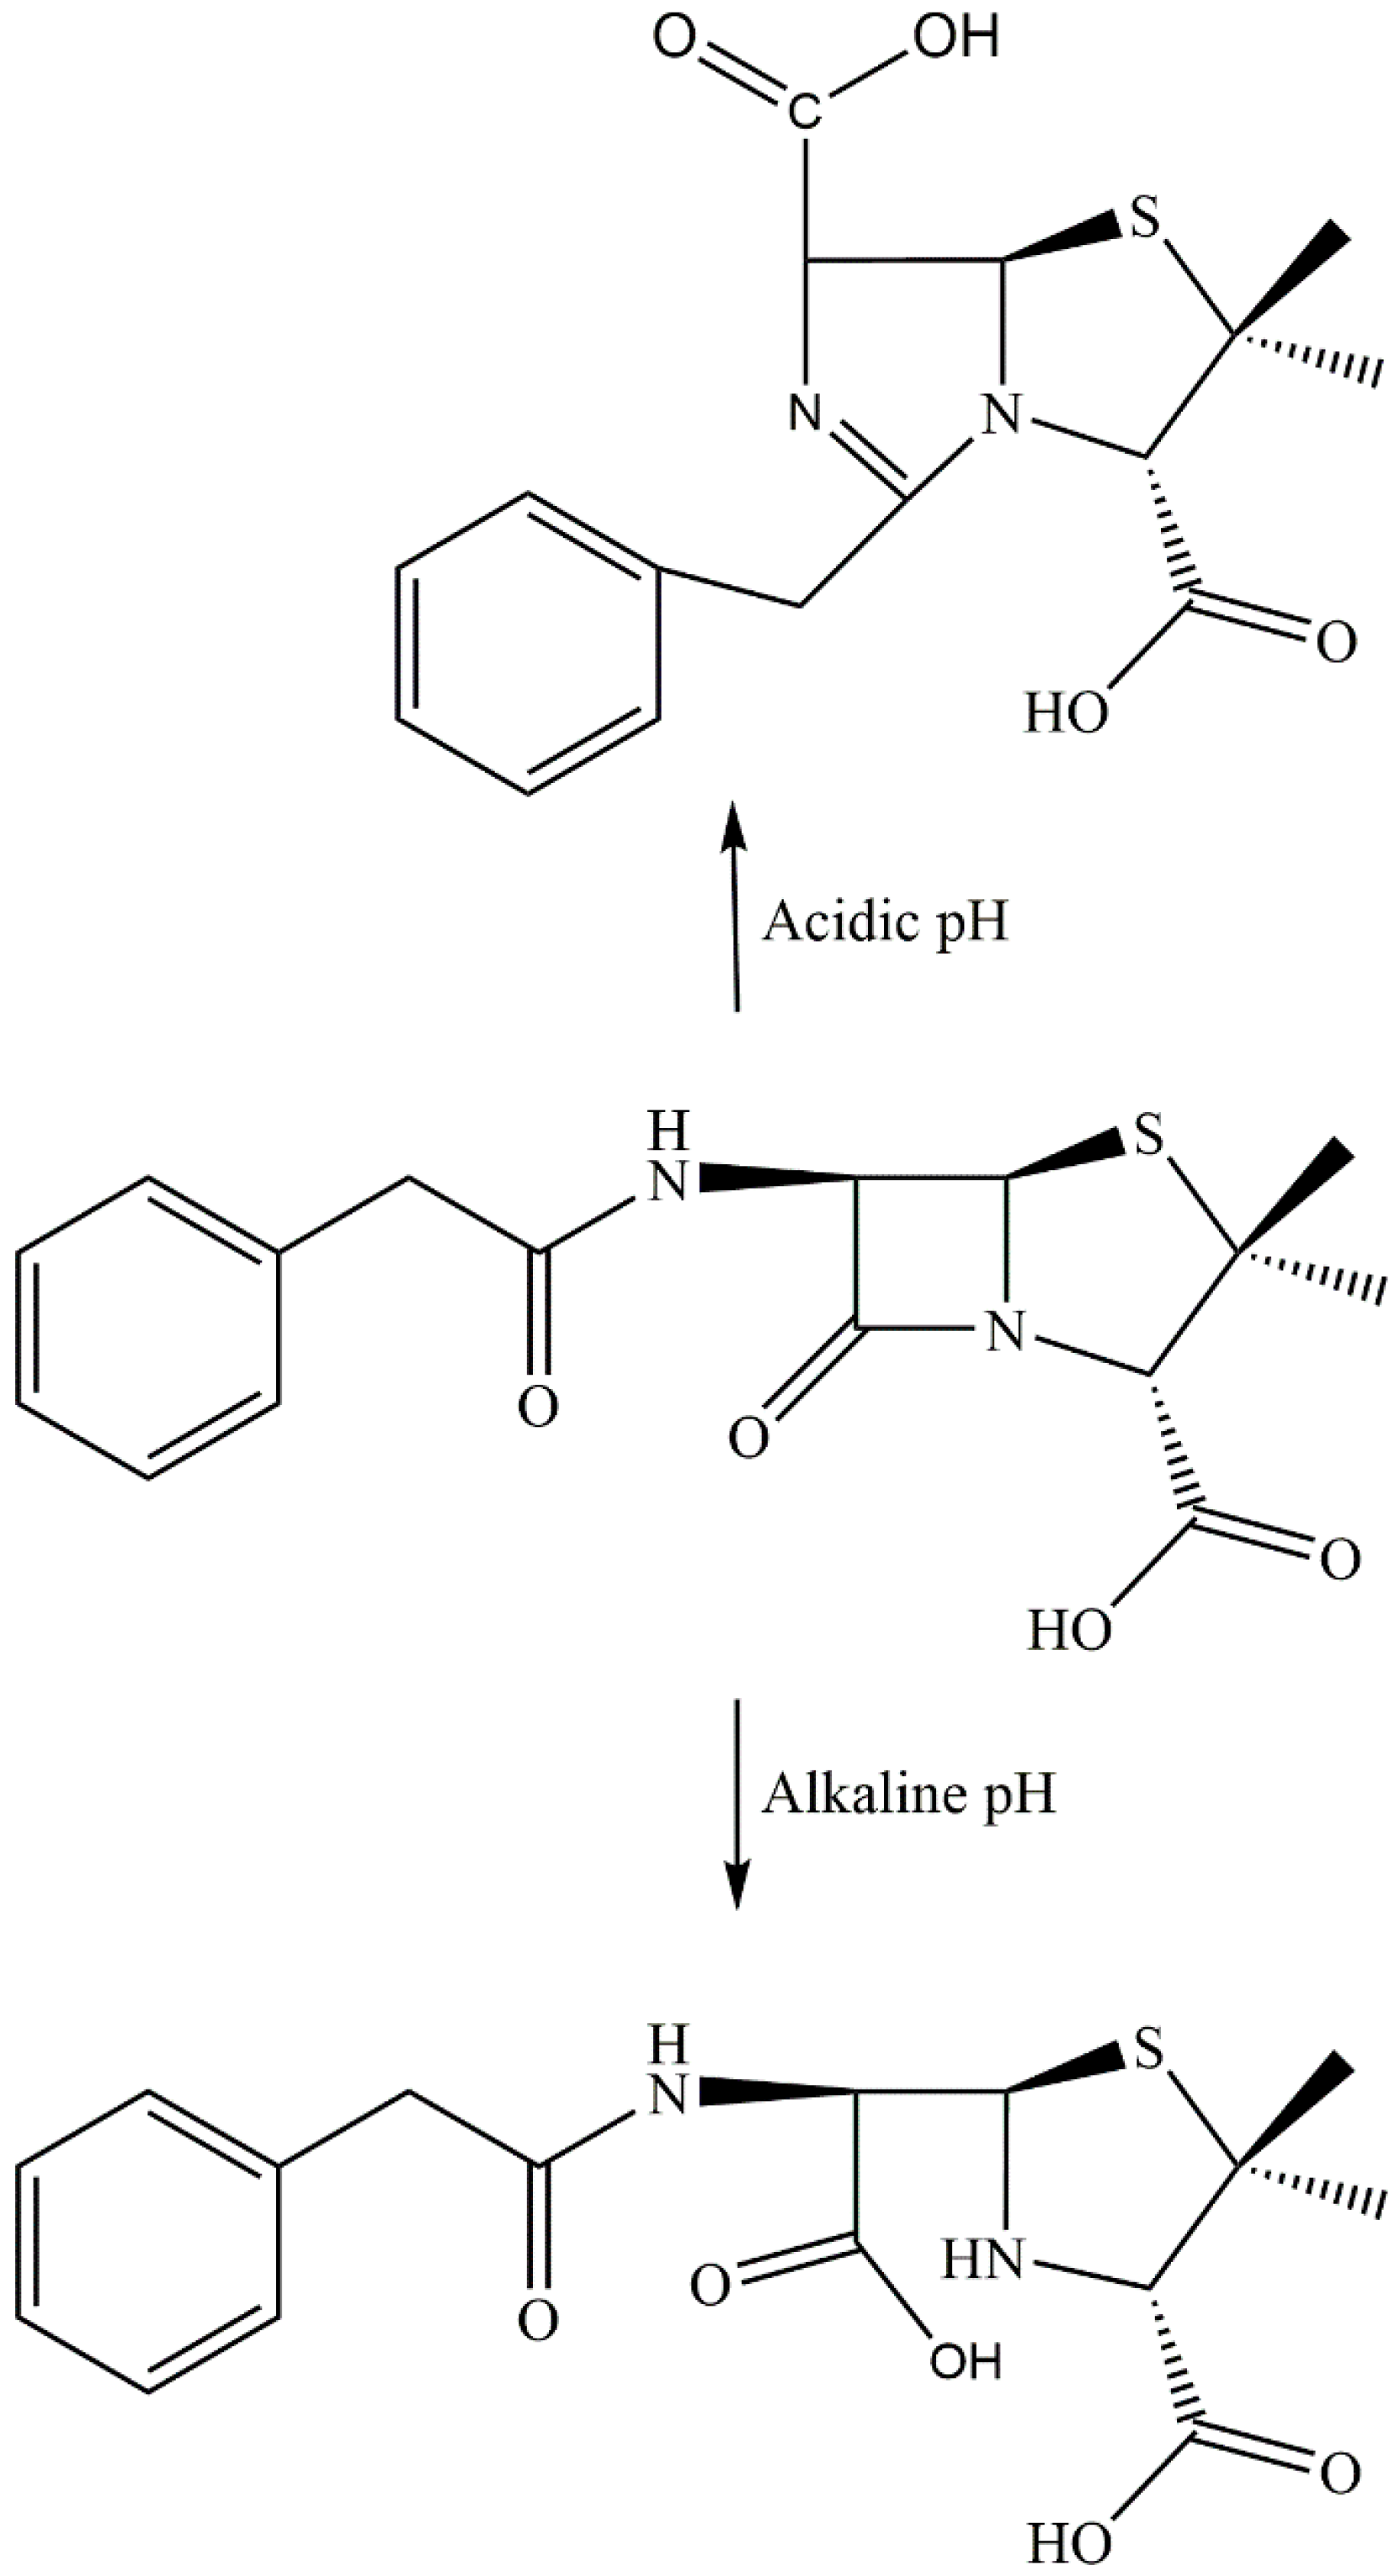
Figure 7.
(a) Optical image of the sample with the Raman scanned area marked in red; (b) Raman image obtained using the integrated intensity of the PG band at 1000 cm−1, over a surface area of 10 × 10 μm in MNP-Au(102), by placing a drop of aqueous solution of PG (10−4 M) (excitation at 633 nm, 500 μW laser power, 100 points per line × 100 lines per image, 0.2 s). The vertical bar on the left of the Raman image shows the color profile and the relative intensity scale of the band at 1000 cm−1.
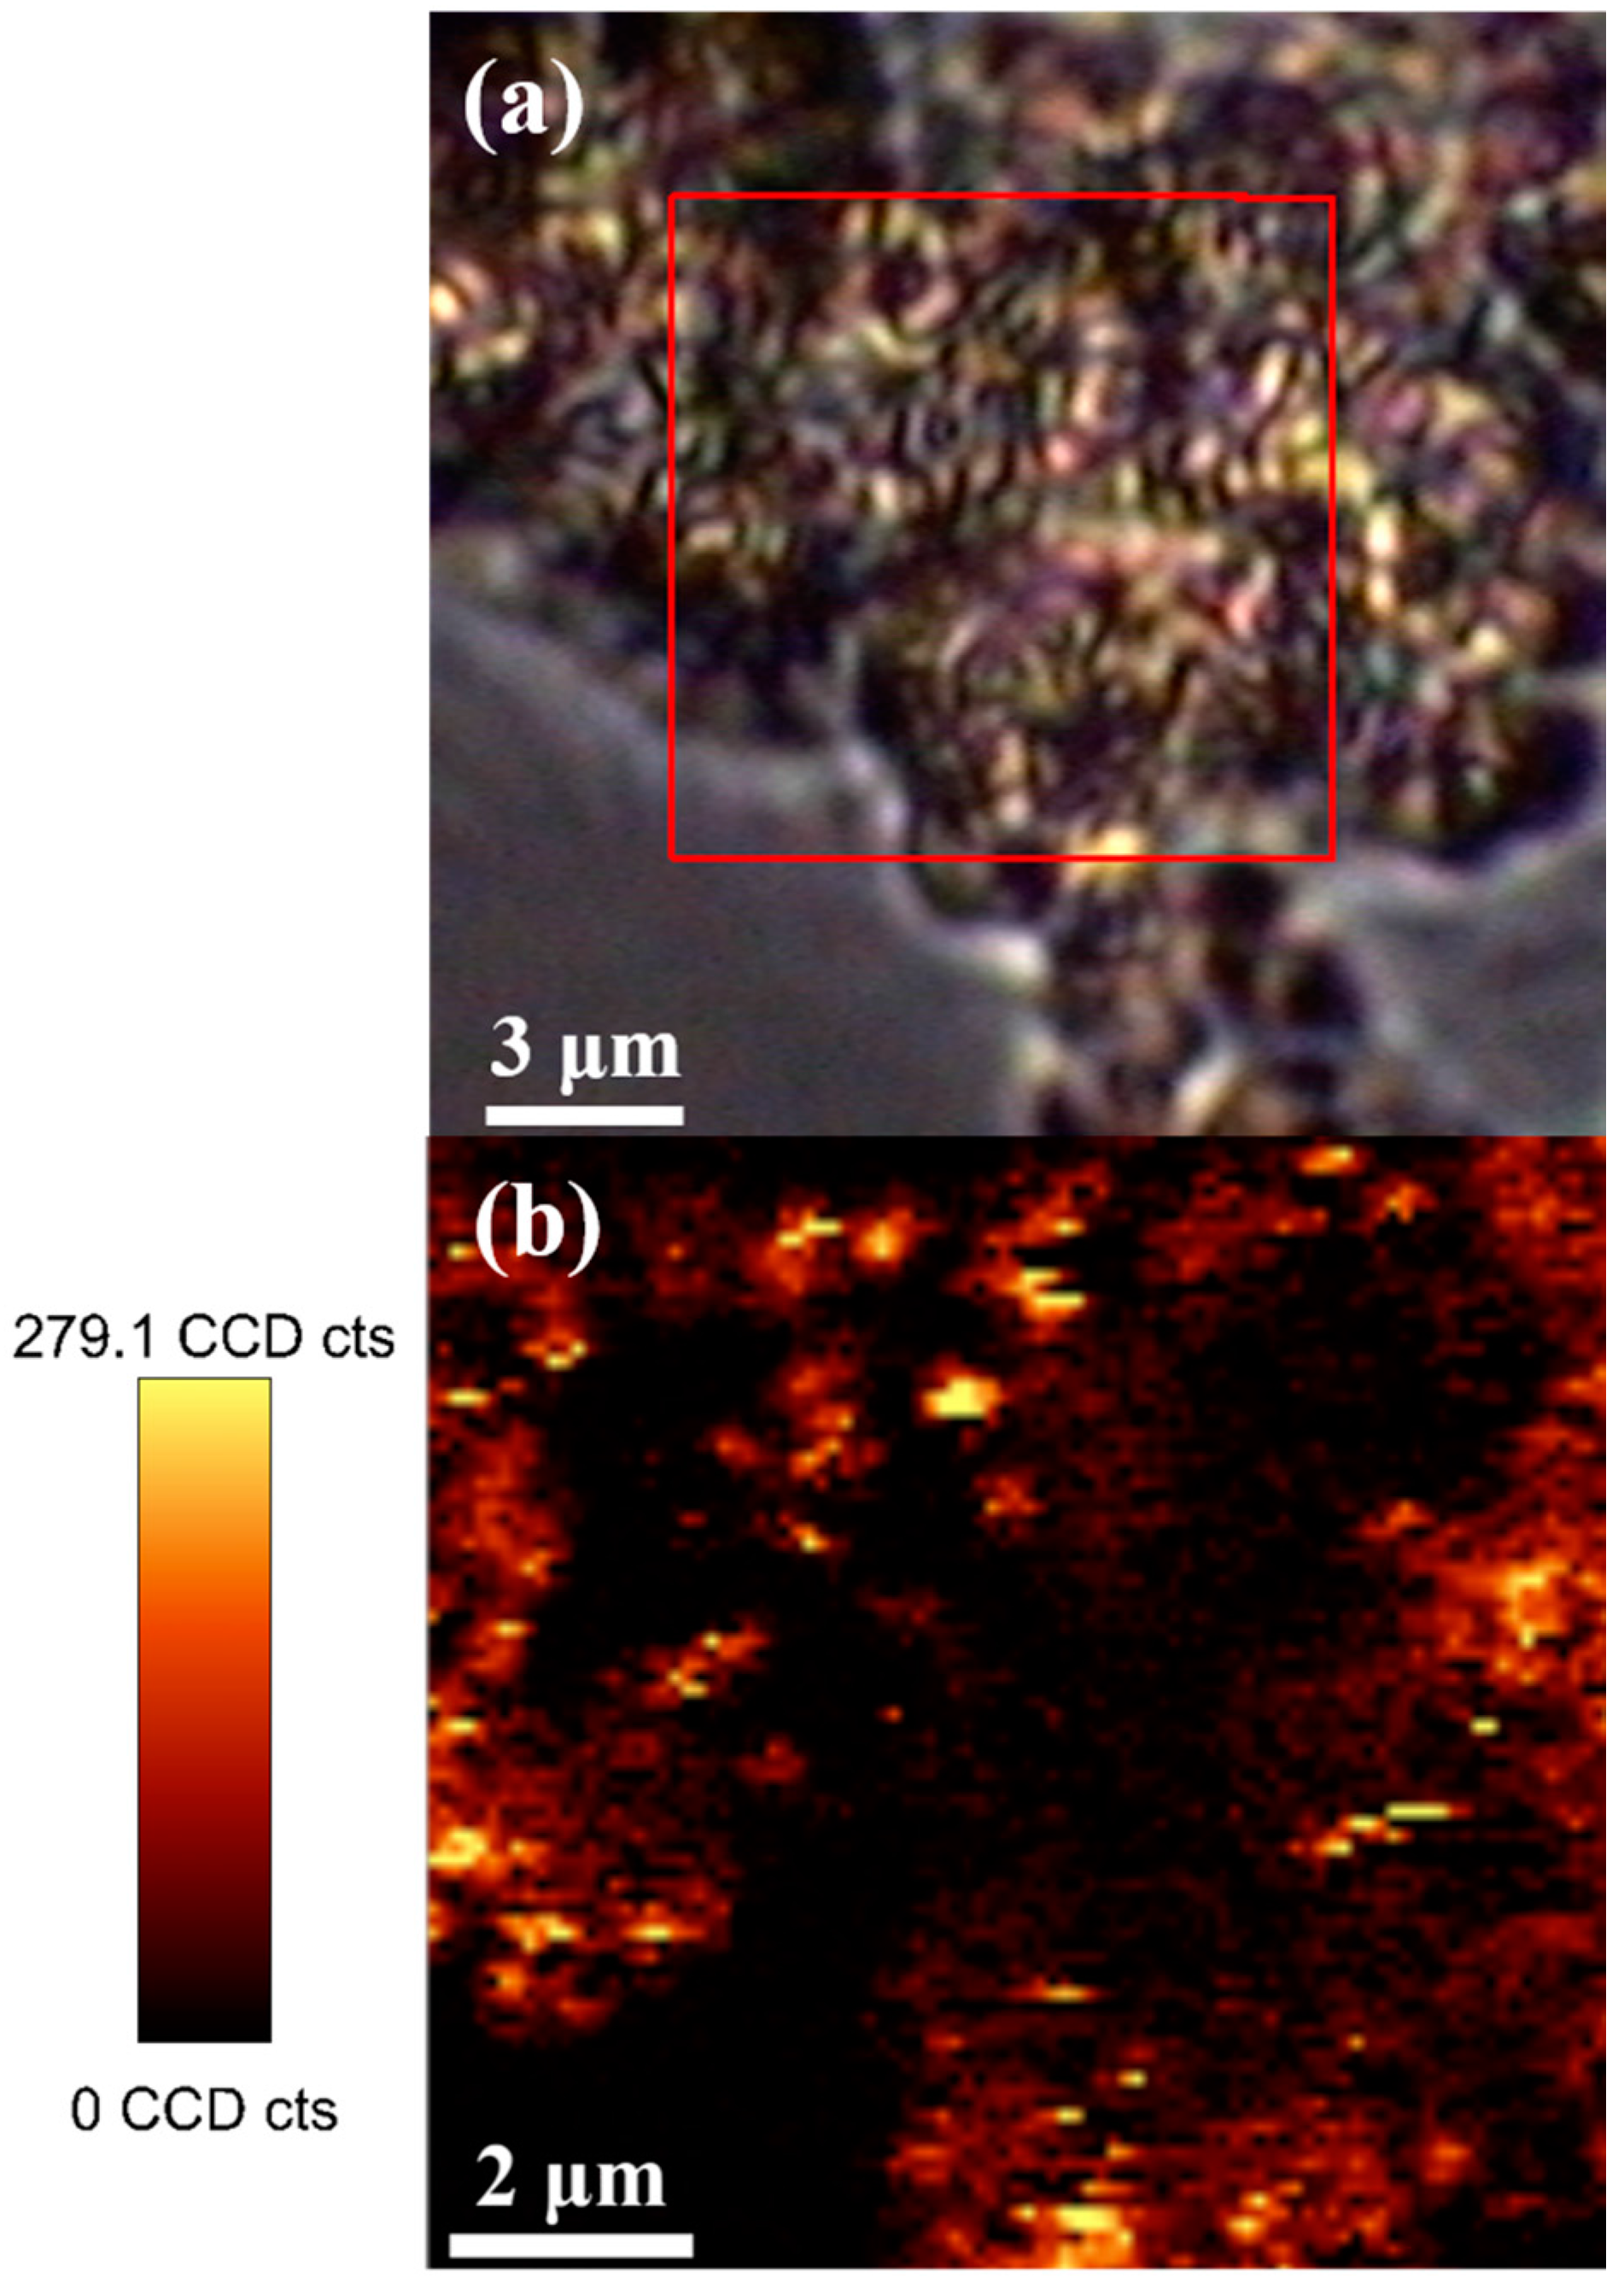
Figure 8.
(a) Optical image of the sample with the Raman scanned area marked in red; (b) Raman image obtained using the integrated intensity of the PG band at 1000 cm−1, over a surface area of 10 × 10 μm in MNP-Au(102) with adsorbed PG at initial concentration 10−1 M, (excitation at 633 nm, 500 μW laser power, 100 points per line × 100 lines per image, 0.2 s). The vertical bar on the left of the Raman image shows the color profile and the relative intensity scale of the band at 1000 cm−1.

© 2017 by the authors. Licensee MDPI, Basel, Switzerland. This article is an open access article distributed under the terms and conditions of the Creative Commons Attribution (CC BY) license (http://creativecommons.org/licenses/by/4.0/).
Share and Cite
MDPI and ACS Style
Pinheiro, P.C.; Fateixa, S.; Trindade, T. SERS Detection of Penicillin G Using Magnetite Decorated with Gold Nanoparticles. Magnetochemistry 2017, 3, 32. https://doi.org/10.3390/magnetochemistry3040032
AMA Style
Pinheiro PC, Fateixa S, Trindade T. SERS Detection of Penicillin G Using Magnetite Decorated with Gold Nanoparticles. Magnetochemistry. 2017; 3(4):32. https://doi.org/10.3390/magnetochemistry3040032
Chicago/Turabian StylePinheiro, Paula C., Sara Fateixa, and Tito Trindade. 2017. "SERS Detection of Penicillin G Using Magnetite Decorated with Gold Nanoparticles" Magnetochemistry 3, no. 4: 32. https://doi.org/10.3390/magnetochemistry3040032
Note that from the first issue of 2016, this journal uses article numbers instead of page numbers. See further details here.