Orientational Glasses: NMR and Electric Susceptibility Studies

1
Department of Physics, University of Florida, Gainesville, FL 32611, USA
2
Qorvo Inc., Richardson, TX 75080, USA
3
KETD East Qianjin Road Enterprise Science and Technology Park, Kunshan 215334, China
*
Author to whom correspondence should be addressed.
Magnetochemistry 2017, 3(4), 33; https://doi.org/10.3390/magnetochemistry3040033
Submission received: 3 October 2017
/
Revised: 11 October 2017
/
Accepted: 17 October 2017
/
Published: 1 November 2017
(This article belongs to the Special Issue Nuclear Magnetic Resonance Spectroscopy)
Abstract
:We review the results of a wide range of nuclear magnetic resonance (NMR) measurements of the local order parameters and the molecular dynamics of solid ortho-para hydrogen mixtures and solid nitrogen-argon mixtures that form novel molecular orientational glass states at low temperatures. From the NMR measurements, the distribution of the order parameters can be deduced and, in terms of simple models, used to analyze the thermodynamic measurements of the heat capacities of these systems. In addition, studies of the dielectric susceptibilities of the nitrogen-argon mixtures are reviewed in terms of replica symmetry breaking analogous to that observed for spin glass states. It is shown that this wide set of experimental results is consistent with orientation or quadrupolar glass ordering of the orientational degrees of freedom.
1. Introduction
Understanding the underlying physics and dynamics of glass systems has remained a challenge for contemporary physics despite the large number of experimental and theoretical studies that have shown that a wide variety of glass systems exhibit a number of universal features [1,2,3,4,5,6]. Considerable progress was made with the discovery of spin glasses [7,8,9,10,11,12] and the introduction of the concepts of frustration [13,14,15,16,17] and replica symmetry breaking [13,18,19,20]. Beyond the simple spin glasses, which displayed a random orientation of dipole moments, it was recognized very early in the history of spin glasses that molecular systems, and in particular diatomic molecules that have short-range anisotropic electrostatic interactions, were highly frustrated and that they formed a special class of glass systems with geometrical frustration. These new glass systems are characterized by (i) a broad distribution of order parameters provided that sufficient disorder was introduced and (ii) a strong temperature dependence for the molecular dynamics, often resembling a Fulcher–Vogel dependence [21,22].
The interest in the molecular glasses is that the interactions are accurately known, the frustration can be described in clear terms and the local order parameters can be measured directly by nuclear magnetic resonance (NMR) methods. Only recently has there been success in relating the low temperature properties of the molecular glasses to replica symmetry breaking [23,24], and in this paper, we review the experimental NMR methods that have been used to measure the order parameters of these systems and relate the observations to electric susceptibility studies and the models of replica symmetry.
2. Orientational and Quadrupolar Glasses: Basics
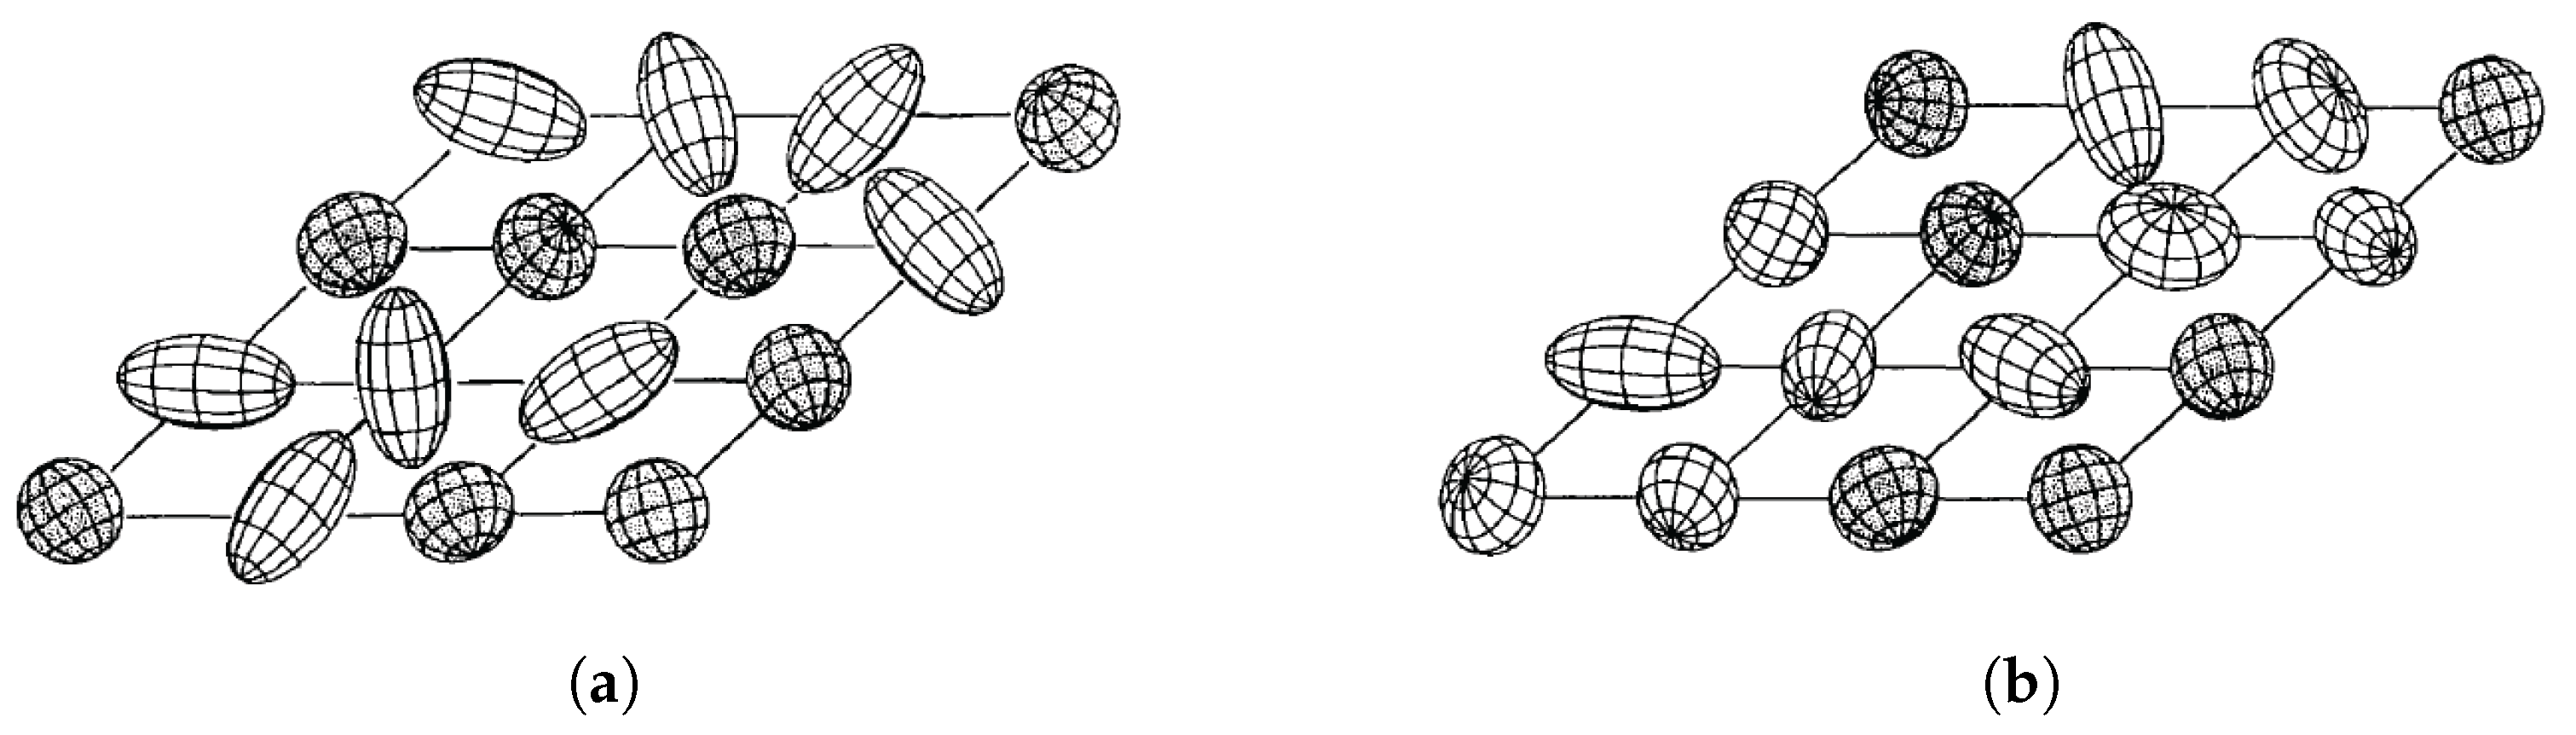
While spin glasses arise from the combination of frustration (of dipolar magnetic interactions) and disorder, the molecular orientational and quadrupolar glasses arise from the frustration of short-range interactions that are dominated by intermolecular electric quadrupole-quadrupole interactions resulting from the non-spherical electrostatic charge distribution of the molecules. The classic examples are ortho-para hydrogen mixtures [21,25,26,27] and solid N-Ar alloys [28,29]. The order parameters are given by two sets of parameters: (i) the local axes (x,y,z) for the mean orientation of the molecular axes and (ii) the degree of alignment or quadrupolarization about those axes. The latter in the classical case is given by the expectation values of the spherical harmonics, and For solid hydrogen, the orbital angular momentum J is a good quantum number. There are two molecular species: ortho-H (with orbital angular momentum J = 1 and total nuclear spin I = 1) and para-H (with J = 0 and I = 0). Only the ortho-H molecules have an electrostatic quadrupole moment and are subject to orientational or quadrupole ordering. The para-H molecules provide the disorder. Although the para-H molecules are the true ground state, the ortho-para conversion is a very slow process in pure solid hydrogen, and one can conduct experiments for a wide range of ortho-para mixtures (for a review of the properties of sold hydrogen, see Silvera [30]). For the ortho-H molecules, the order parameters are are given by and , which are the expectation values of the tensor operator equivalents of the spherical harmonics to within a simple numerical factor. Above a critical concentration of 55% ortho-H, the ortho molecules order in a four-sublattice anti-ferro-orientational Pa3 structure [30]. Below 55%, the ortho molecules form a quadrupolar glass with no sudden phase transition [31]. The onset of glass formation was signaled by the observation of a broad distribution of local order parameters at low temperatures. For a simple orientational glass, only the axes (x,y,z) are randomly distributed, while for the quadrupolar glass, both the axes and the quadrupolarizations vary randomly. The distinction between the two types of molecular glasses is illustrated in Figure 1 [31].
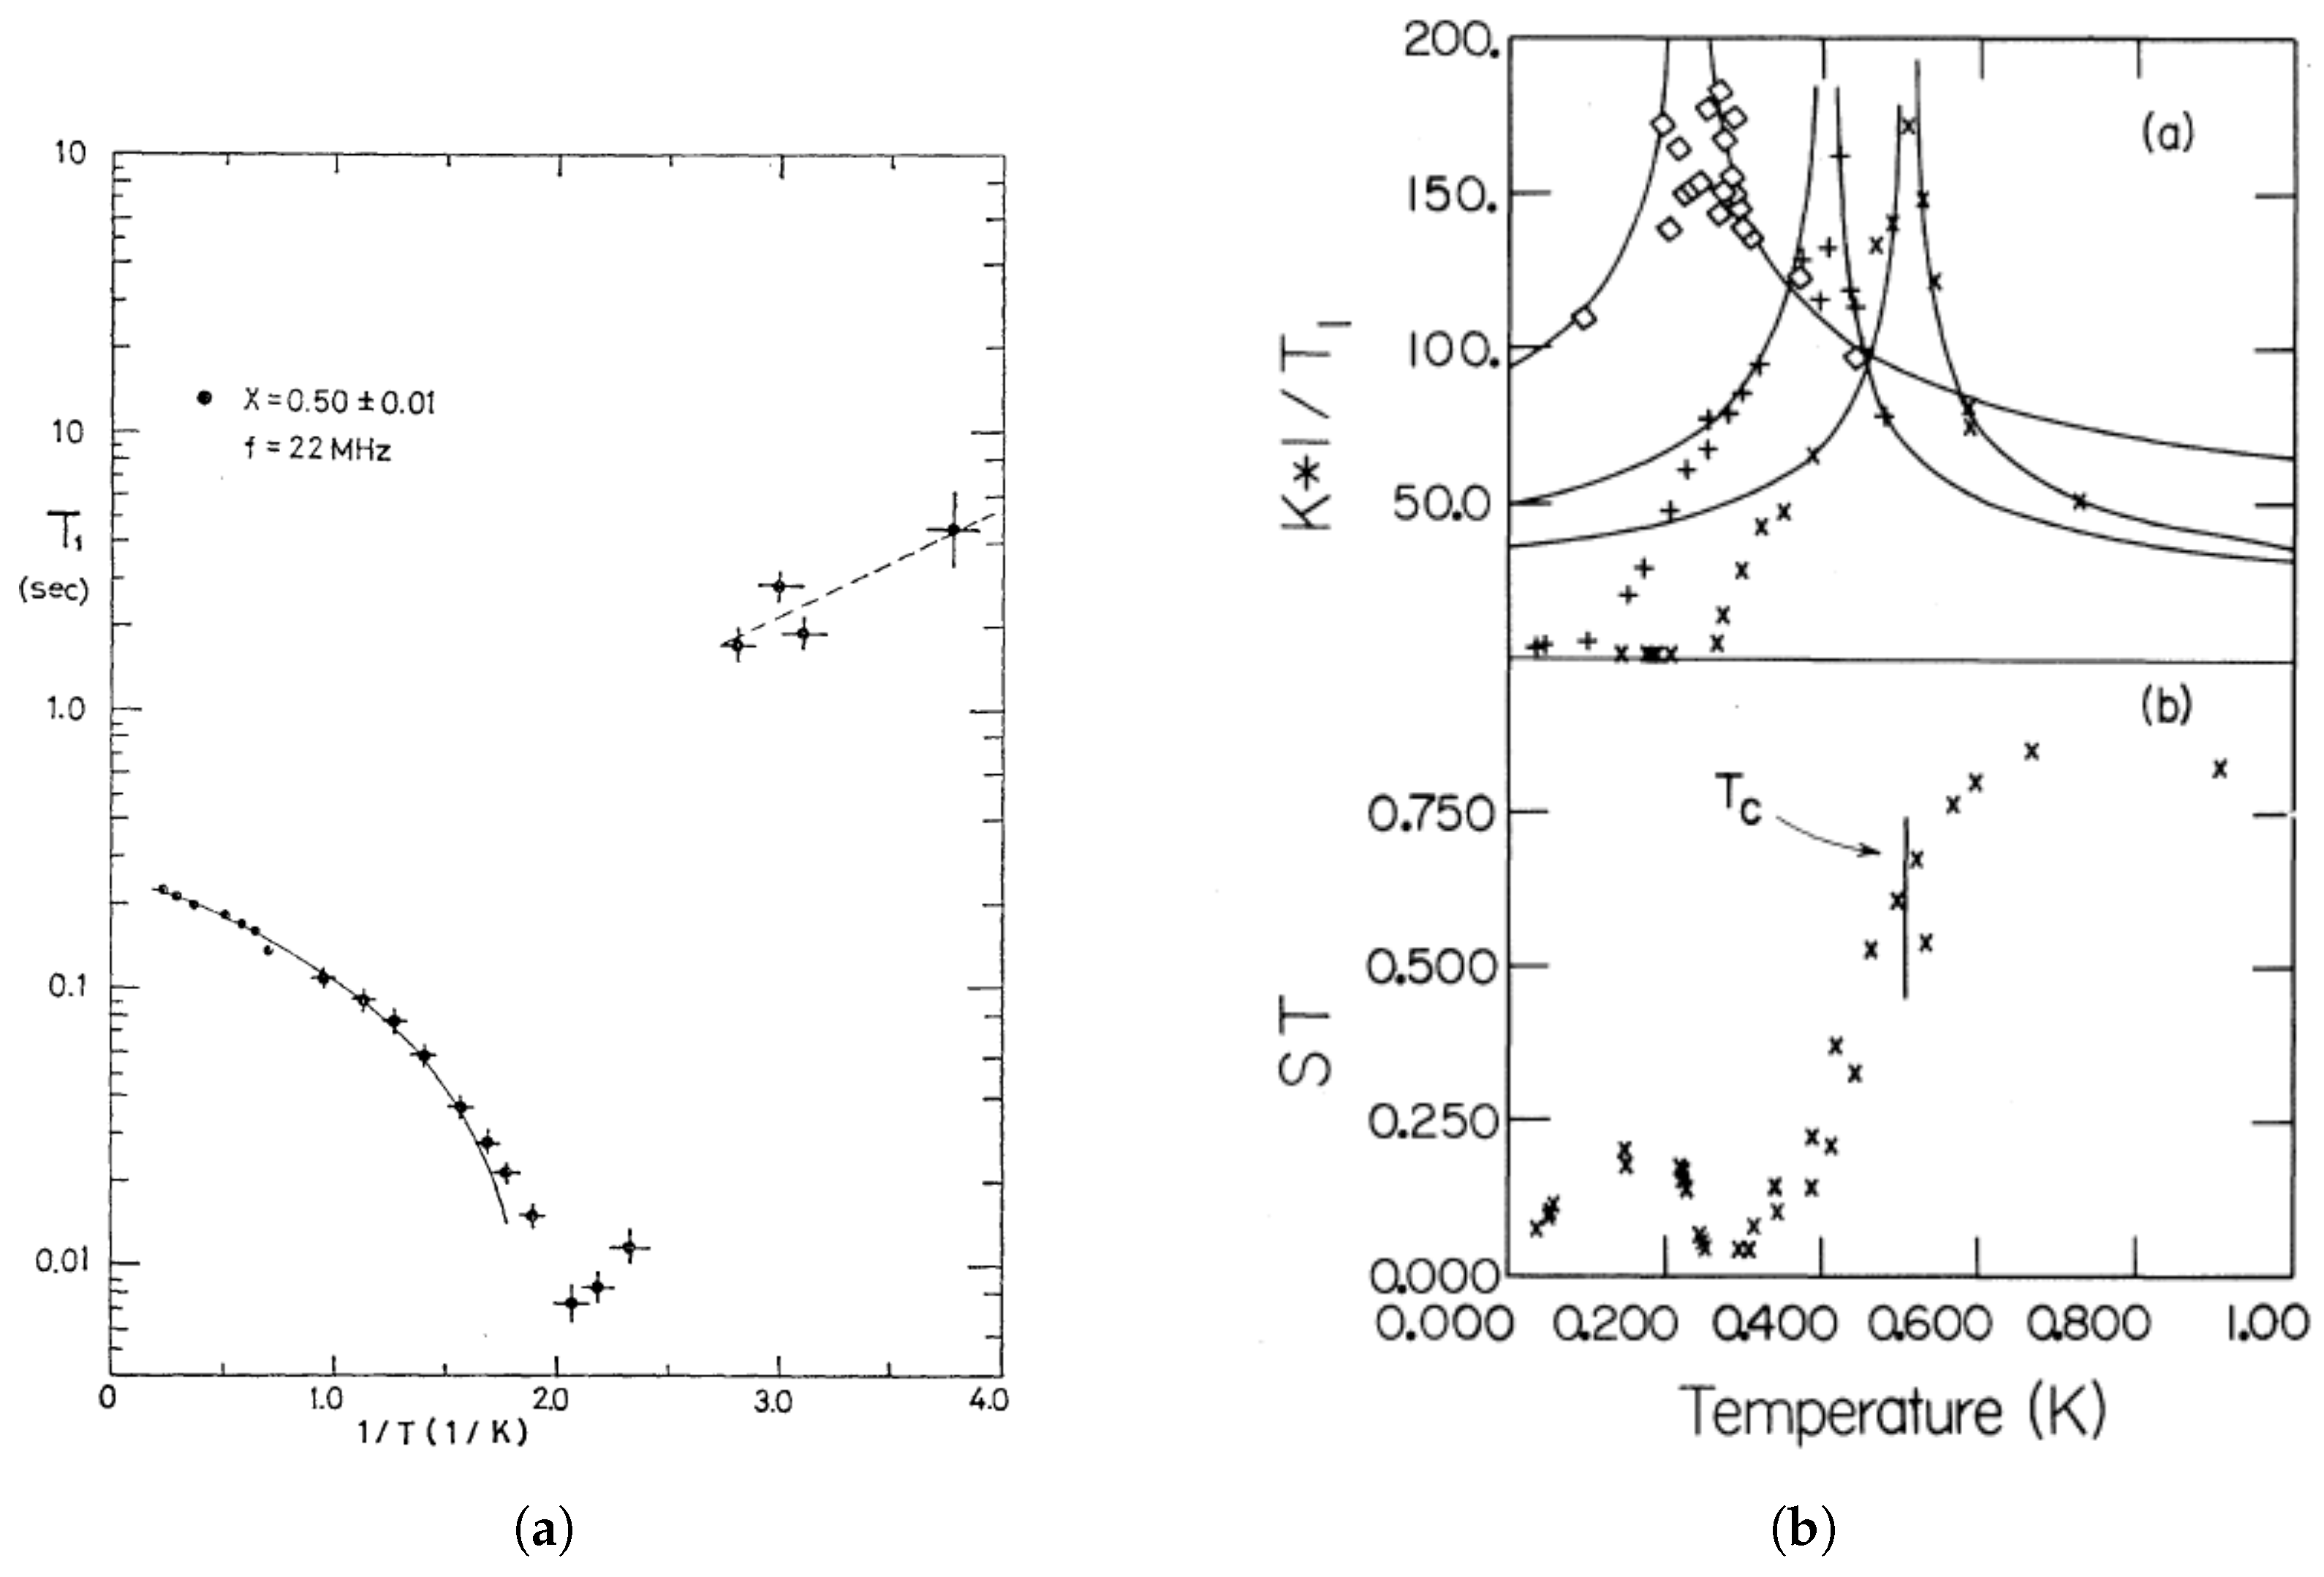
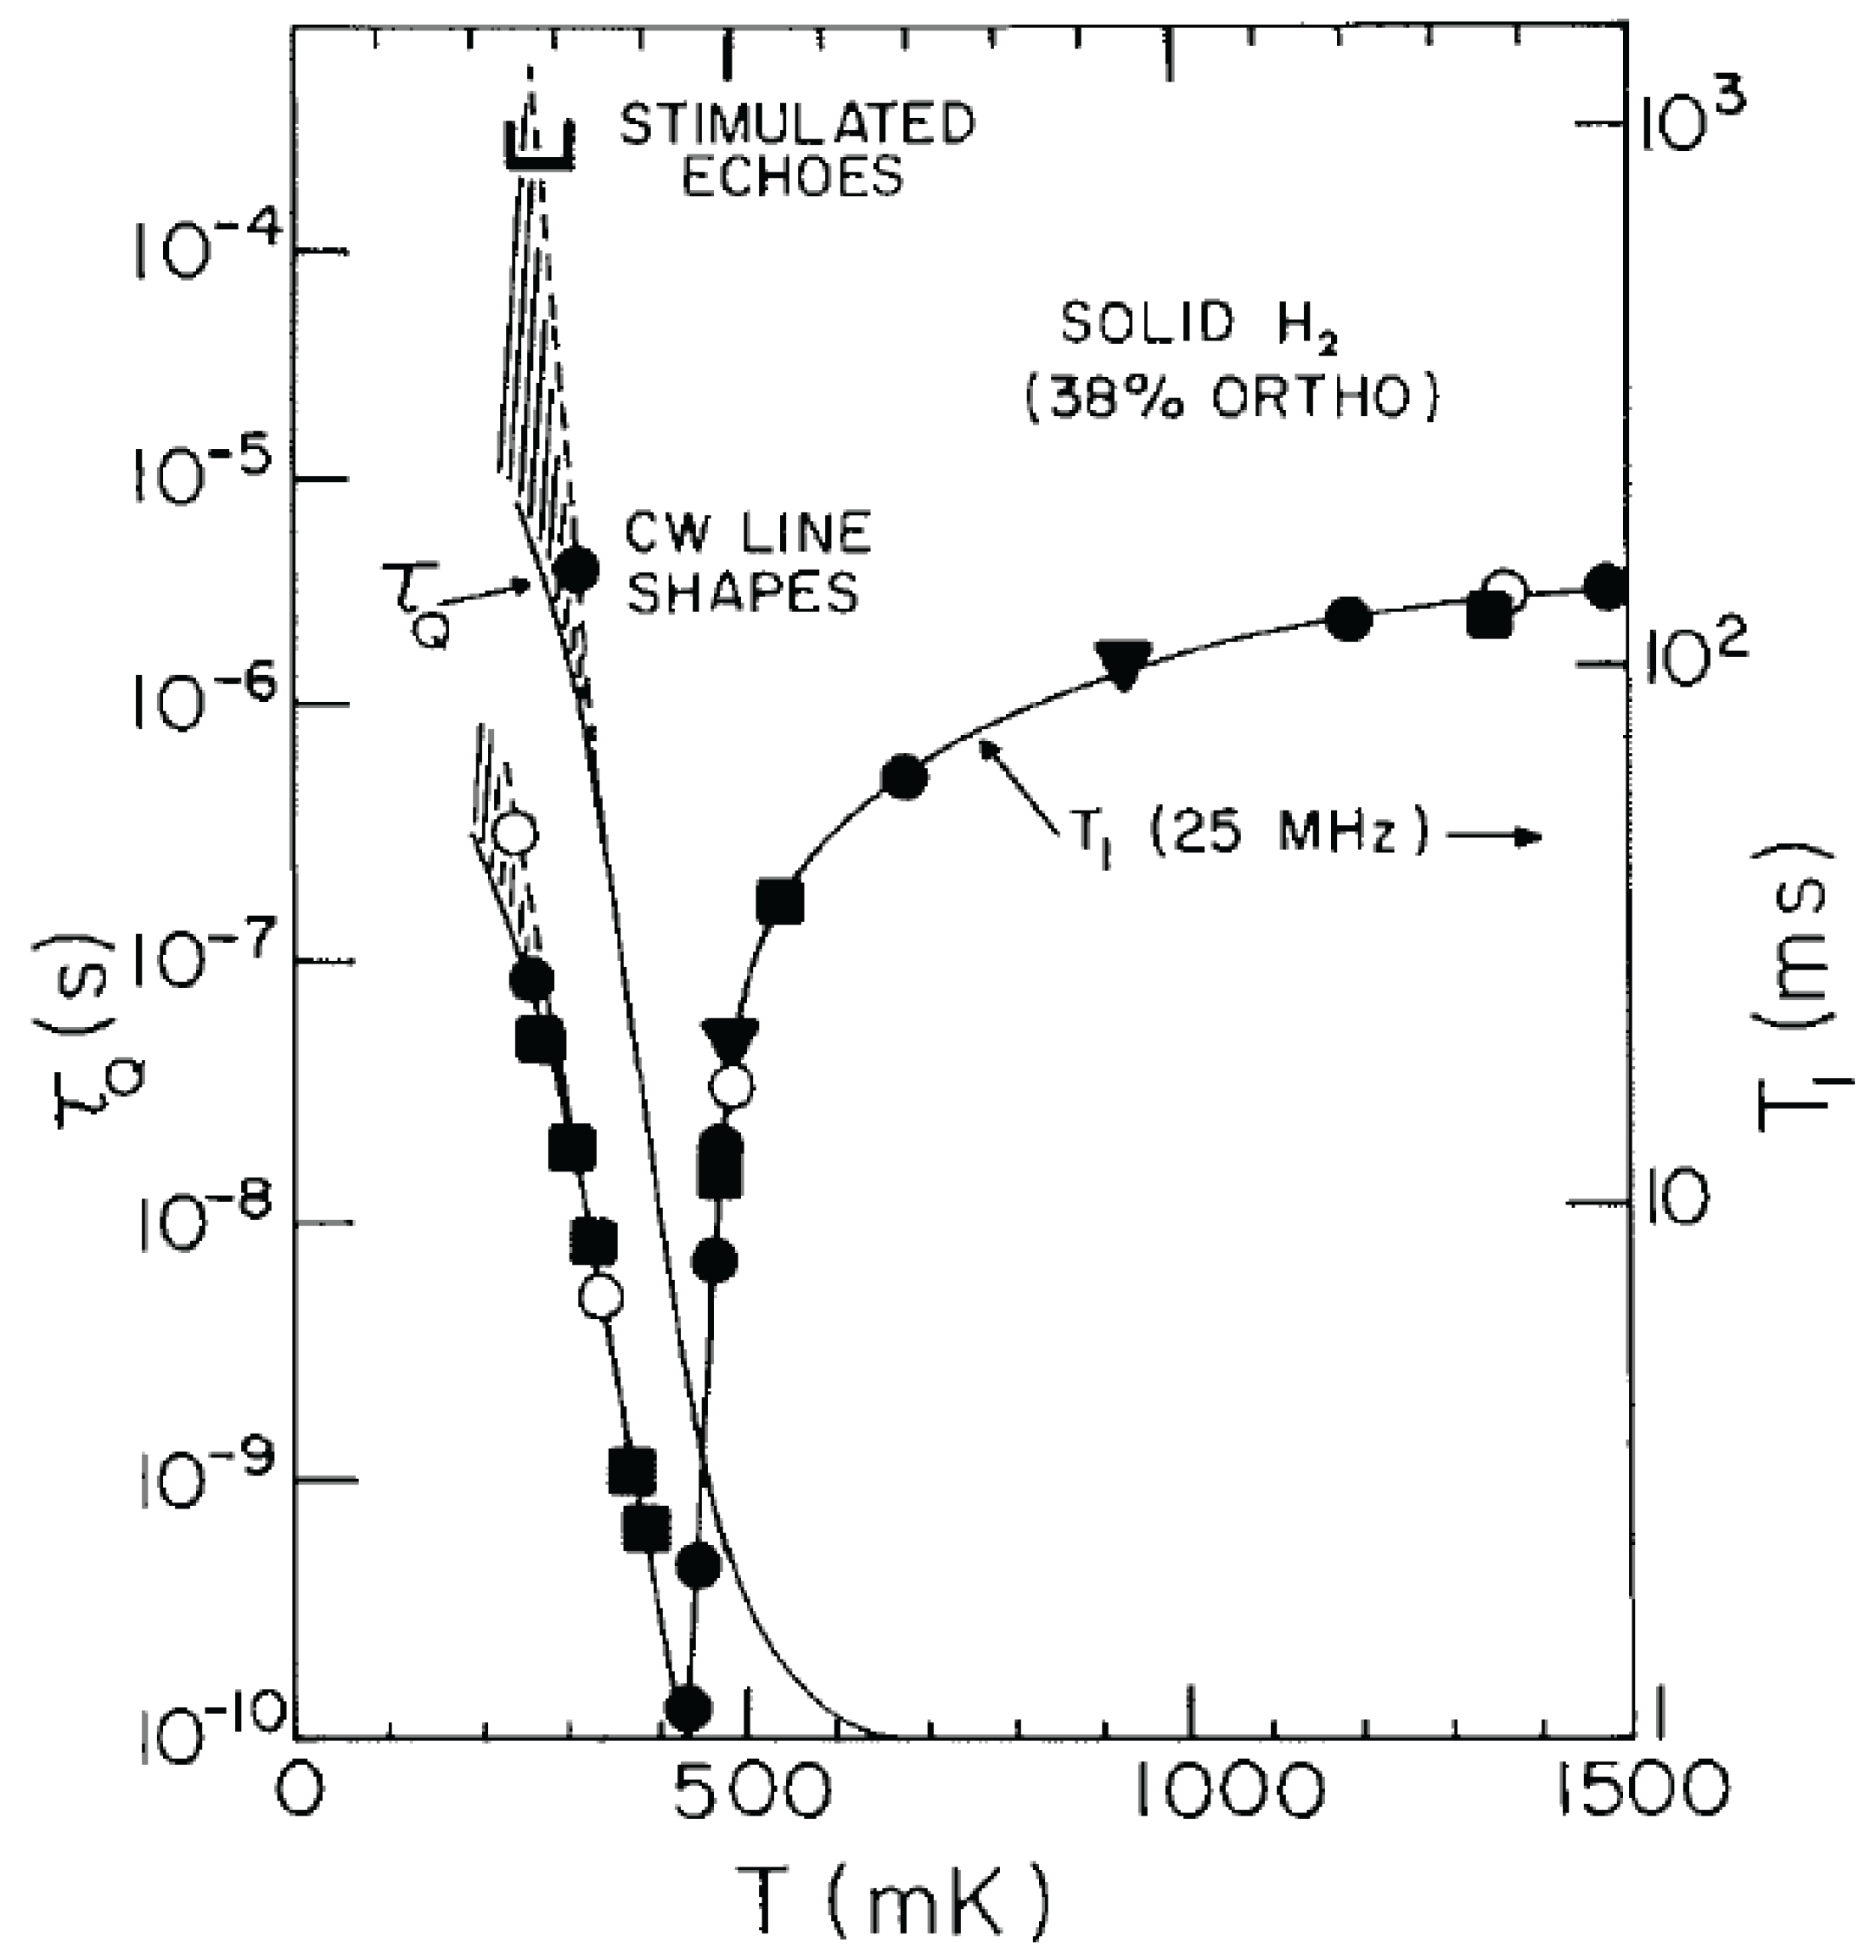
In addition to the static observations of the order parameters, experiments also showed strong temperature dependencies for the dynamics of the molecules (principally their thermal fluctuations about the mean molecular alignments) as inferred from various studies of the nuclear spin relaxation times. Two independent measurements of the relaxation times in solid ortho-para H mixtures are shown in Figure 2. The change in the static order parameter, (as defined above and represented by the variable in Figure 2b), is considerably less dramatic than the changes observed in the dynamical parameters that determine the nuclear spin-lattice relaxation times. The main difference in the two measurements shown in Figure 2 is the frequency of the measurements; 22 MHz for Figure 2a (Ishimoto et al. [25]) and 33 MHz for Figure 2b (Cochran et al. [26]). This difference was the first evidence of the characteristic frequency dependence of the response functions observed below the glass formation and will be discussed further in the next section.
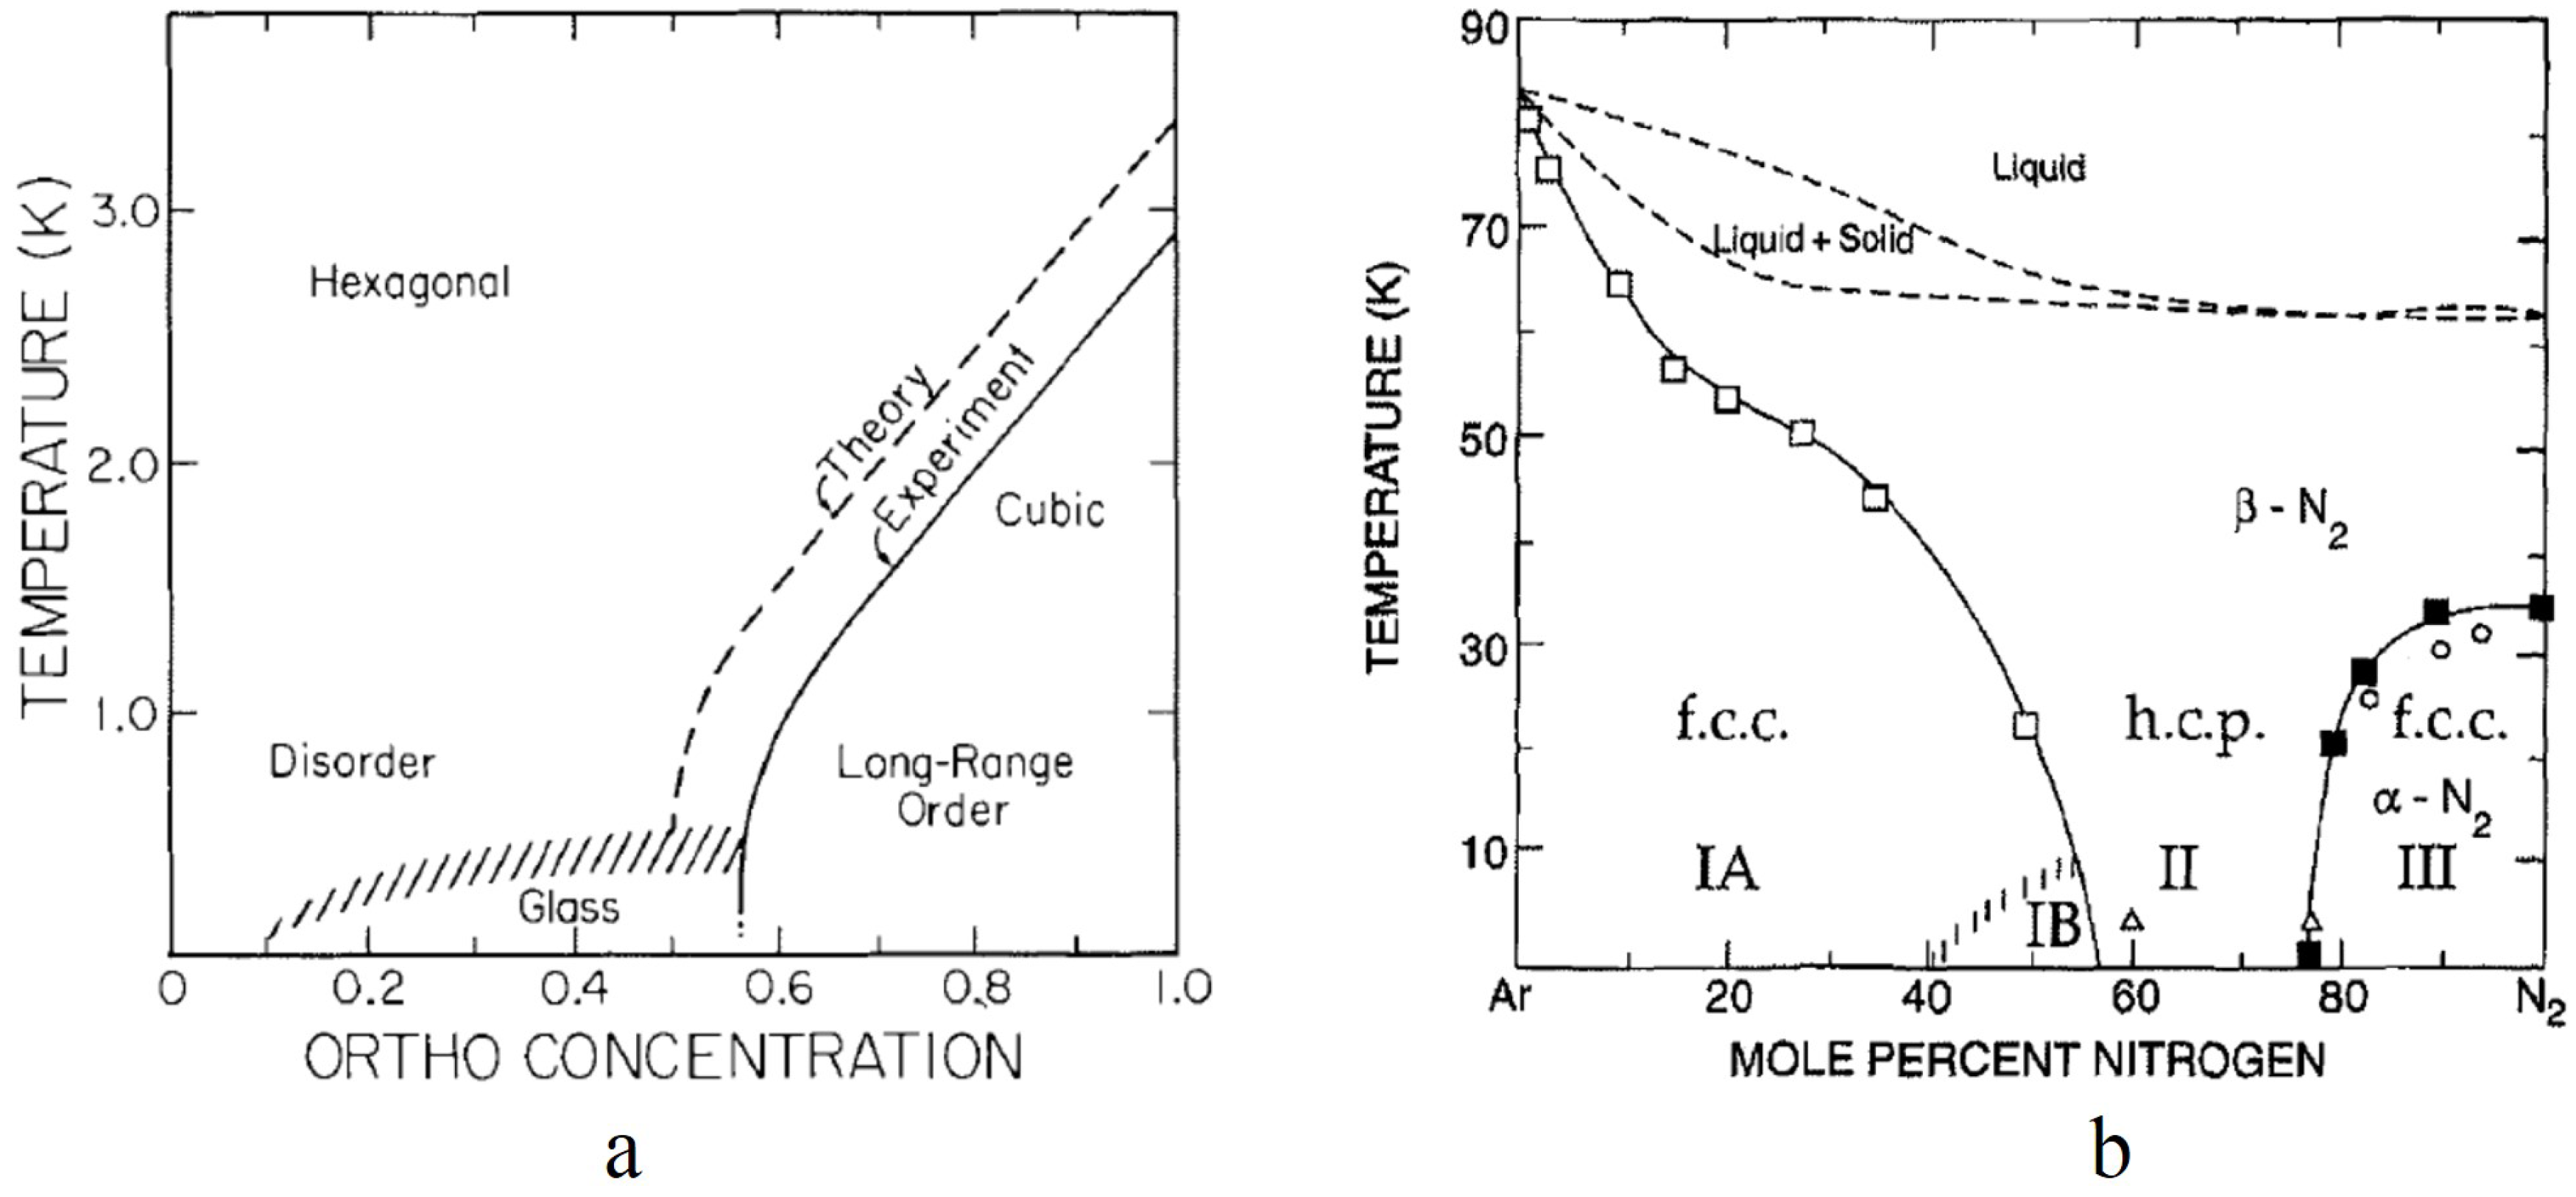
Studies of solid nitrogen-argon mixtures [33,34,35] showed similar features to those referenced above for solid ortho-para H mixtures. The randomness for the N-Ar solid mixtures is introduced by the replacement of nitrogen molecules with argon atoms, which are spherically symmetrical and carry no electrostatic quadrupole moment. At high nitrogen concentrations (more than 77%), long-range Pa3 ordering is observed similar to pure ortho-H. Below that critical concentration, glass behavior is observed at low temperatures. As indicated in Figure 3a,b, a lattice change is observed when the long-rage ordering occurs with the hcp lattice transitioning to an fcc lattice as the orientational ordering occurs. The critical concentration depends on the concentration dependence of the anisotropic interactions. A detailed restricted trace calculation [36] showed that the orientational fluctuations for ortho-para hydrogen mixtures varied as where x is the ortho concentration leading to a predicted critical concentration of 50%. No detailed calculation has been made for solid N-Ar mixtures. For the latter, it is noteworthy that for N concentrations less than 56%, a cubic lattice is maintained at low temperatures. This is important for any analysis of the glass formation because in the hcp structure, the symmetry of the electric quadrupole-quadrupole interaction is incompatible with the non-cubic lattice symmetry. As a consequence, replacing a quadrupole by a spherical diluent is equivalent to adding a local conjugate quadrupolar field so that for the hcp lattice, the glass formation is analogous to that of a spin glass in a static magnetic field, and any phase transition would be rounded out. The solid N-Ar mixtures at low concentrations (Phase II of Figure 3b) therefore provide a better testbed for understanding quadrupolar or orientational glass formation.
3. NMR Methods
NMR methods are sensitive to long-range ordering or orientational or quadrupolar glass ordering because the nuclear spin-spin interactions depend on the local order parameters. Both the nuclear dipole-dipole interactions and the anisotropic chemical shift interaction vary with the values of the local order parameter and thus alter the NMR spectra.
The intra-molecular dipole-dipole interaction between the two nuclei of one molecule can be written as [27]:
where we have introduced the irreducible orthonormal tensor operators and to describe the orientational and nuclear spin degrees of freedom, respectively. Under rotations, these operators transform equivalently to the spherical harmonics . In the manifold , the orientational operators are [27,39]:
with:
and
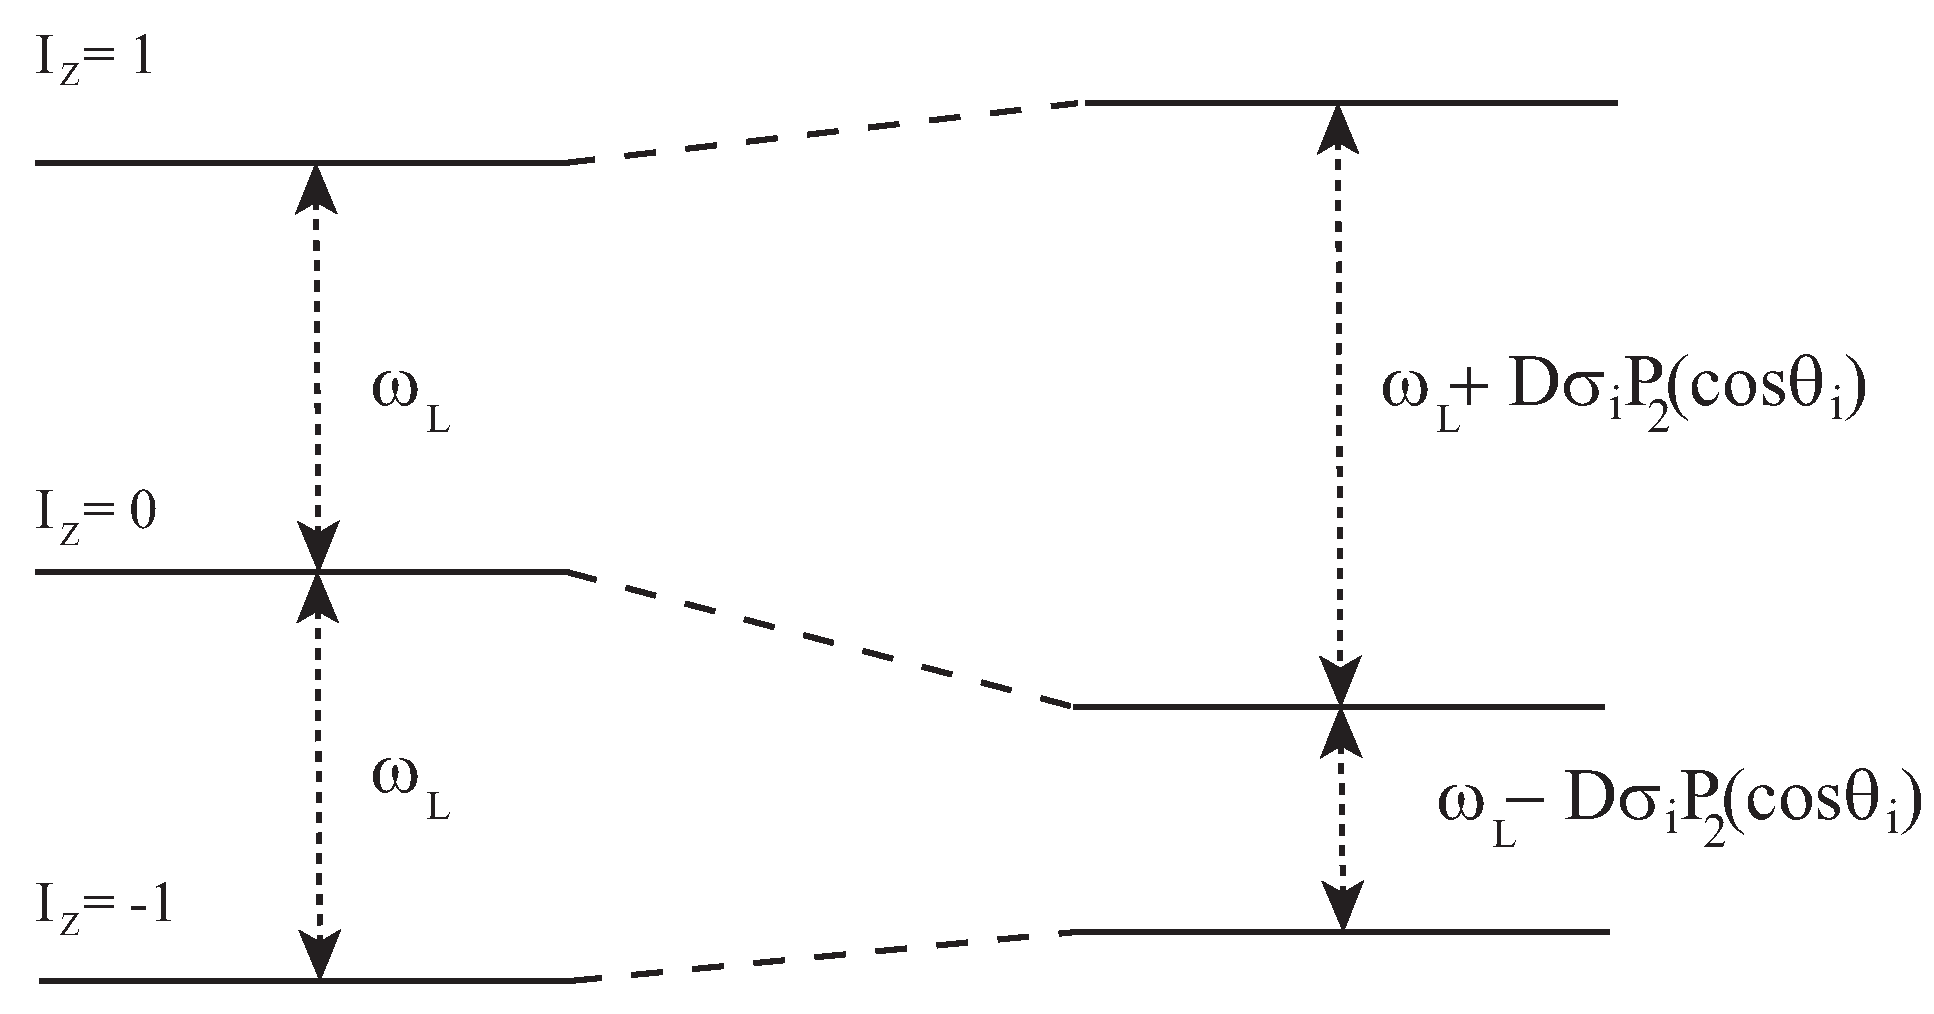
The strength of the intra-molecular dipole-dipole interaction for H is given by = 173.06 kHz. For a high magnetic field, the dipole interaction is only a weak perturbation of the nuclear Zeeman interaction, , where is the nuclear gyromagnetic ratio and is the magnetic field aligned along the z-axis. For the Zeeman term alone, the energy levels for one ortho-H molecule with total nuclear spin I= 1 consist of three equally-spaced levels corresponding to with energy separations where is the nuclear Larmor frequency. In the absence of any orientational ordering, the dipolar interaction averages to zero, and this energy separation is unperturbed. However, for a non-trivial orientational ordering, the expectation value of the secular component of (the part that commutes with the Zeeman interaction), , is non-zero, and the energy levels are perturbed as shown in Figure 4.
If the orientation of the magnetic field with respect to local axes of molecule i is defined by the polar angles ), we have for axial symmetry (which is usually assumed in the literature) [21,27],
where the local order parameter
From Equation (4) and Figure 4, we see that each molecule with a non-zero order parameter contributes a doublet to the NMR absorption line shape at:
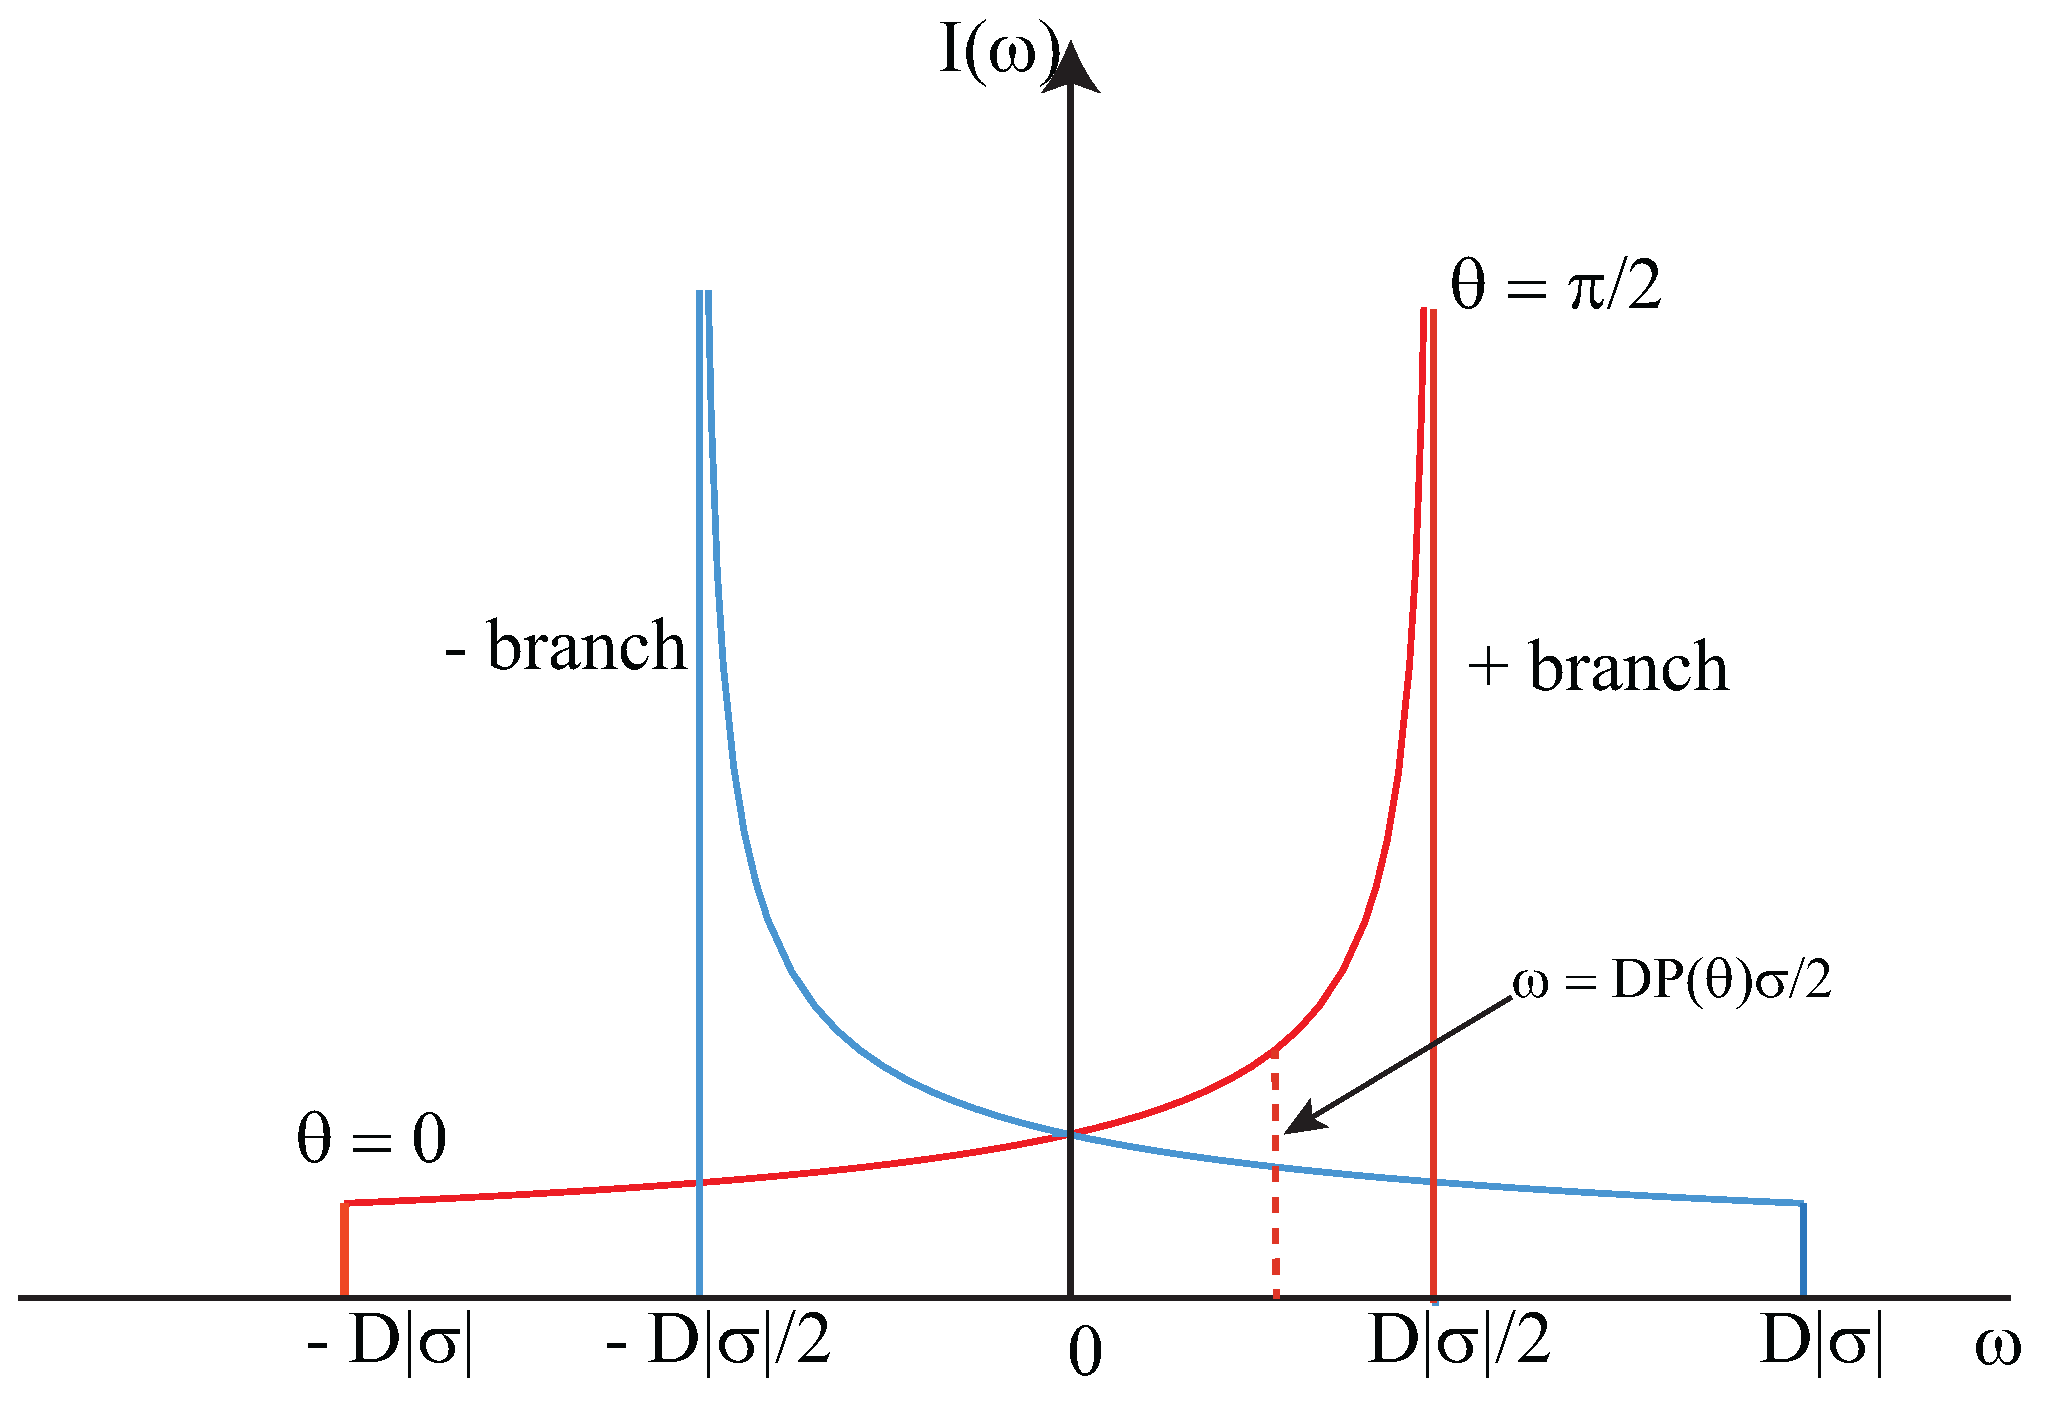
The experiments are almost always carried out for powdered samples, and we need to sum the contributions to the spectrum over a powder distribution of the crystalline orientations If is the line intensity at frequency for a fixed , we have . The line shapes therefore consist of a doublet given by:
These are the familiar Pake doublets and are shown in Figure 5 for .
In order to calculate the line shape expected for a quadrupolar glass, we need to consider an approximate form for the distribution of local order parameters. If is the probability of finding the value in the glass state, then we find from the distribution of the values of local entropies. For each molecule with local order parameter , the contribution to the entropy is:
For small , is linear in , and assuming the distribution of entropies, is a constant, we have as a first approximation:
Using this approximation and the expressions for the line shapes for the doublets given by Equation (7), the glass line shape is expected to be given by:
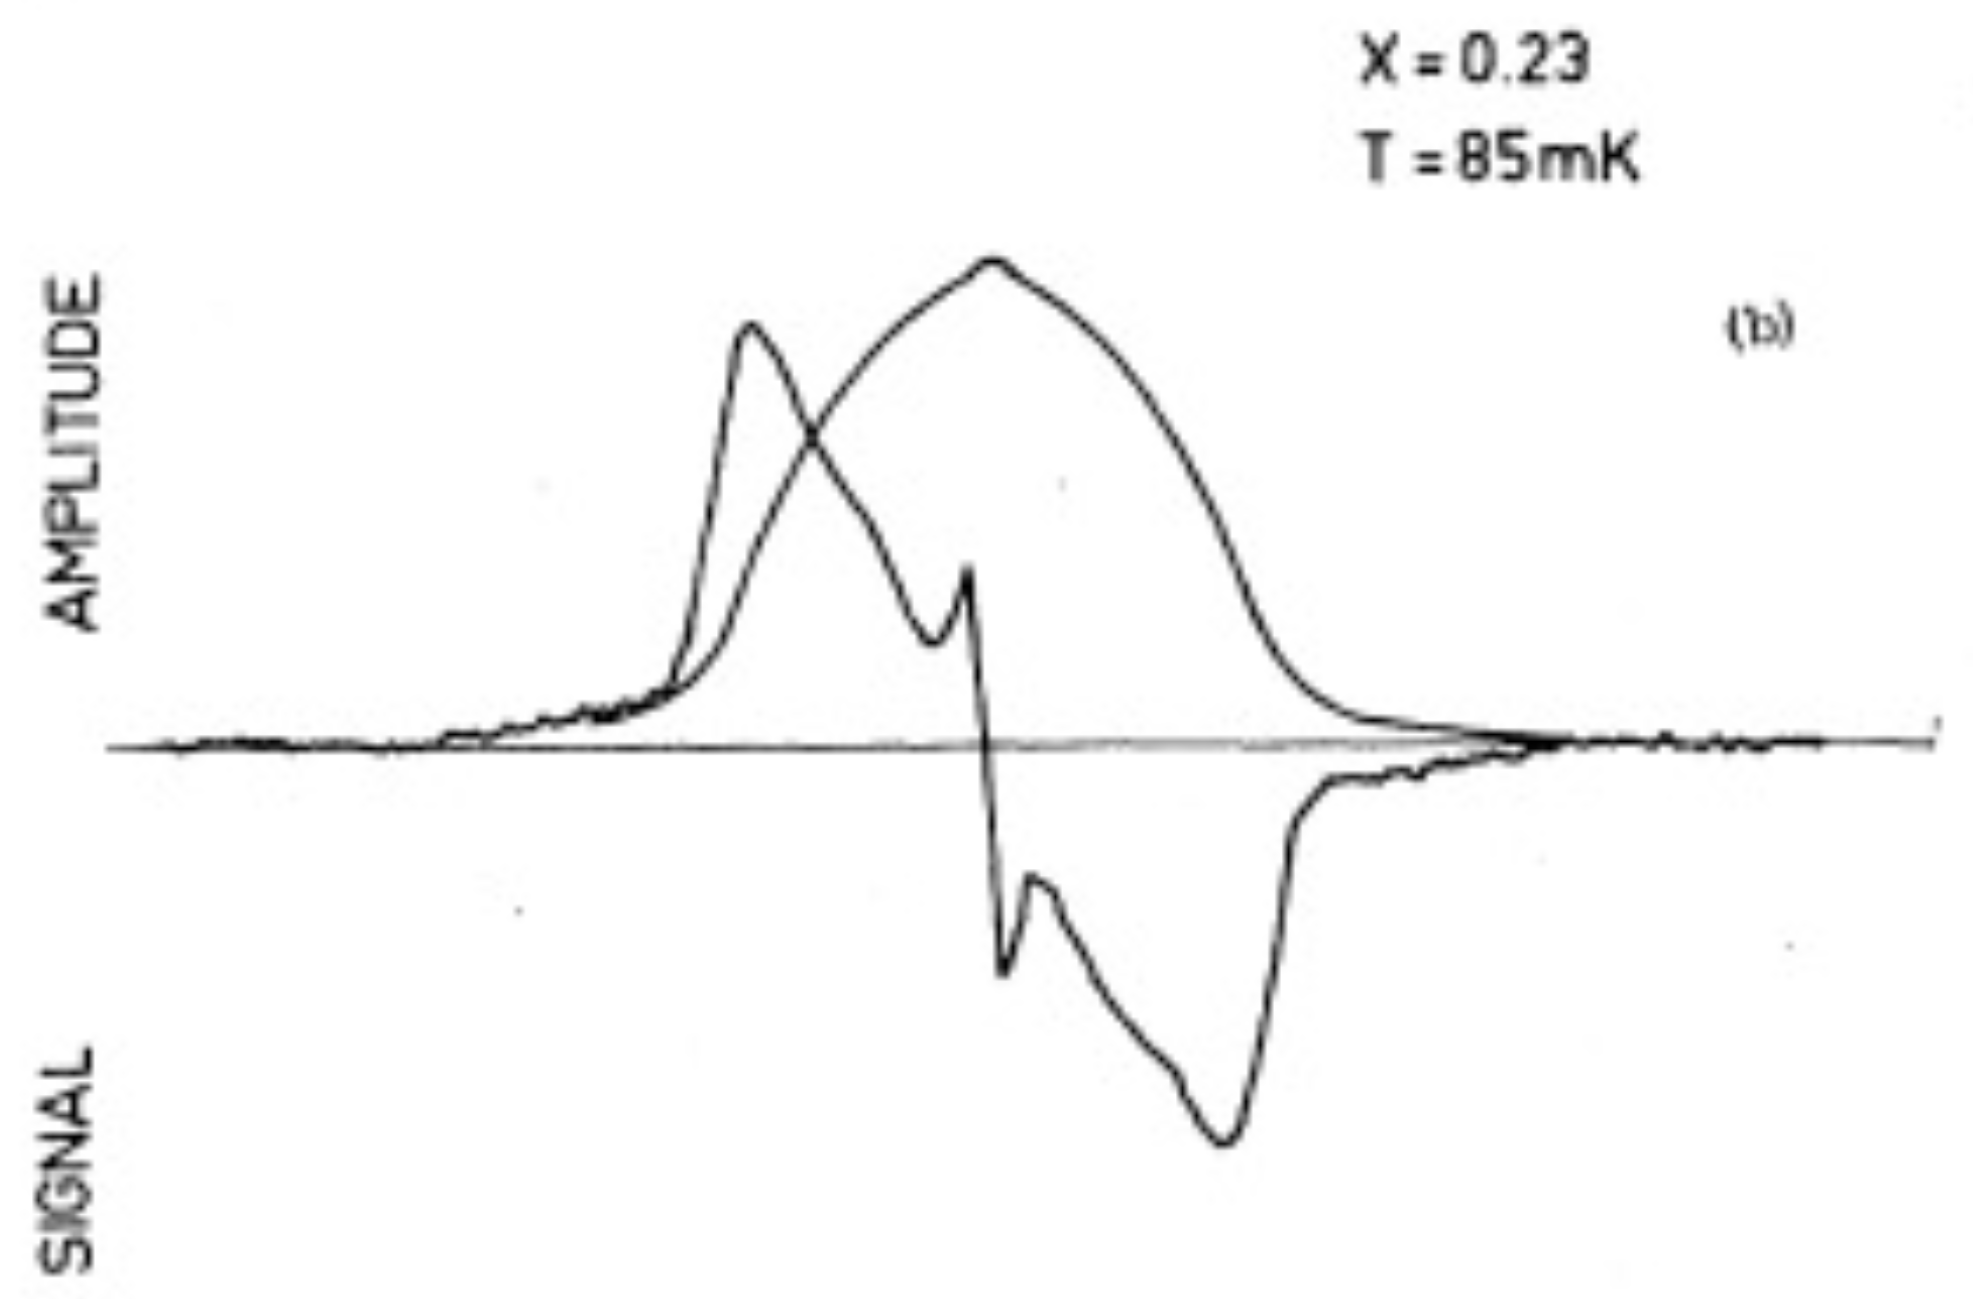
The calculated glass line shape using Equation (10) is shown in Figure 6. This shape is to be compared with the shape observed at low temperatures. An example is shown in Figure 7 for an ortho-H concentration of and a temperature of 85 mK. The general form is in good agreement with the predictions.
At lower temperatures and for high magnetic fields, the line shape shows a distinct asymmetry as shown in Figure 8. This asymmetry is due to the finite nuclear spin polarization (16% in the case of Figure 8). For non-trivial nuclear polarizations, the ratio of the amplitudes of the two branches of the Pake doublet is not unity. It is given by:
where is the nuclear Larmor frequency and T is the absolute temperature of the sample, obtained by a polynomial fit to the order parameter distribution function using to find:
using
The order parameter distribution estimated from the best fits to the NMR line shapes is shown in Figure 9 for ortho-para H samples with 23% ortho hydrogen [27]. There is a smooth variation with temperature with no discontinuity or other evidence of a sudden transition. The relevant parameter for a spin glass transition, however, is the Edwards–Anderson [40] order parameter given by:
where is the component of the spin at site i, is a thermodynamic average and is an average over configurations c. While the average vanishes for paramagnetism and for a spin glass, is non-zero for the spin glass.
For the quadrupolar glass, we therefore consider the glass order parameter:
The temperature dependence of the quadrupolar glass order parameter is calculated from the order parameter distribution functions determined from the NMR line shapes shown in Figure 10 [41]. Although there is no evidence for an abrupt transition in the temperature variation of , the observed temperature dependence is much stronger than that predicted for a non-collective simple random field model [42,43,44] shown by the broken dashed line of Figure 10. The observed variation is in good qualitative agreement with the model for a quadrupolar glass proposed by Lutchinskaia et al. [45] consistent with a collective quadrupolar glass ordering at low temperatures.
Classical orientational glass ordering can be observed in solid N-Ar mixtures using NMR techniques at low temperatures. Instead of the common isotope N, experimenters use N, which has nuclear spin , and the large (∼3 MHz) nuclear quadrupole interaction for N vanishes. For the diatomic molecule N, one can treat the total molecular nuclear spin as and use a similar analysis of the NMR spectra as was used for diatomic H. Because of the larger mass and large moment of inertia compared to H molecules, the angular momentum is not a good quantum number, and the local order parameters are purely classical and given by:
where is the angle between the instantaneous molecular orientation and the mean orientation. The NMR line shapes for local orientational ordering in solid N-Ar mixtures have one major difference compared to those observed for solid hydrogen because there is an extra term in the nuclear spin Hamiltonian that depends on the orientational order parameter. That term is the anisotropic chemical shift resulting from the interaction between the nuclear spin and the magnetic fields of the molecular electron distribution given by:
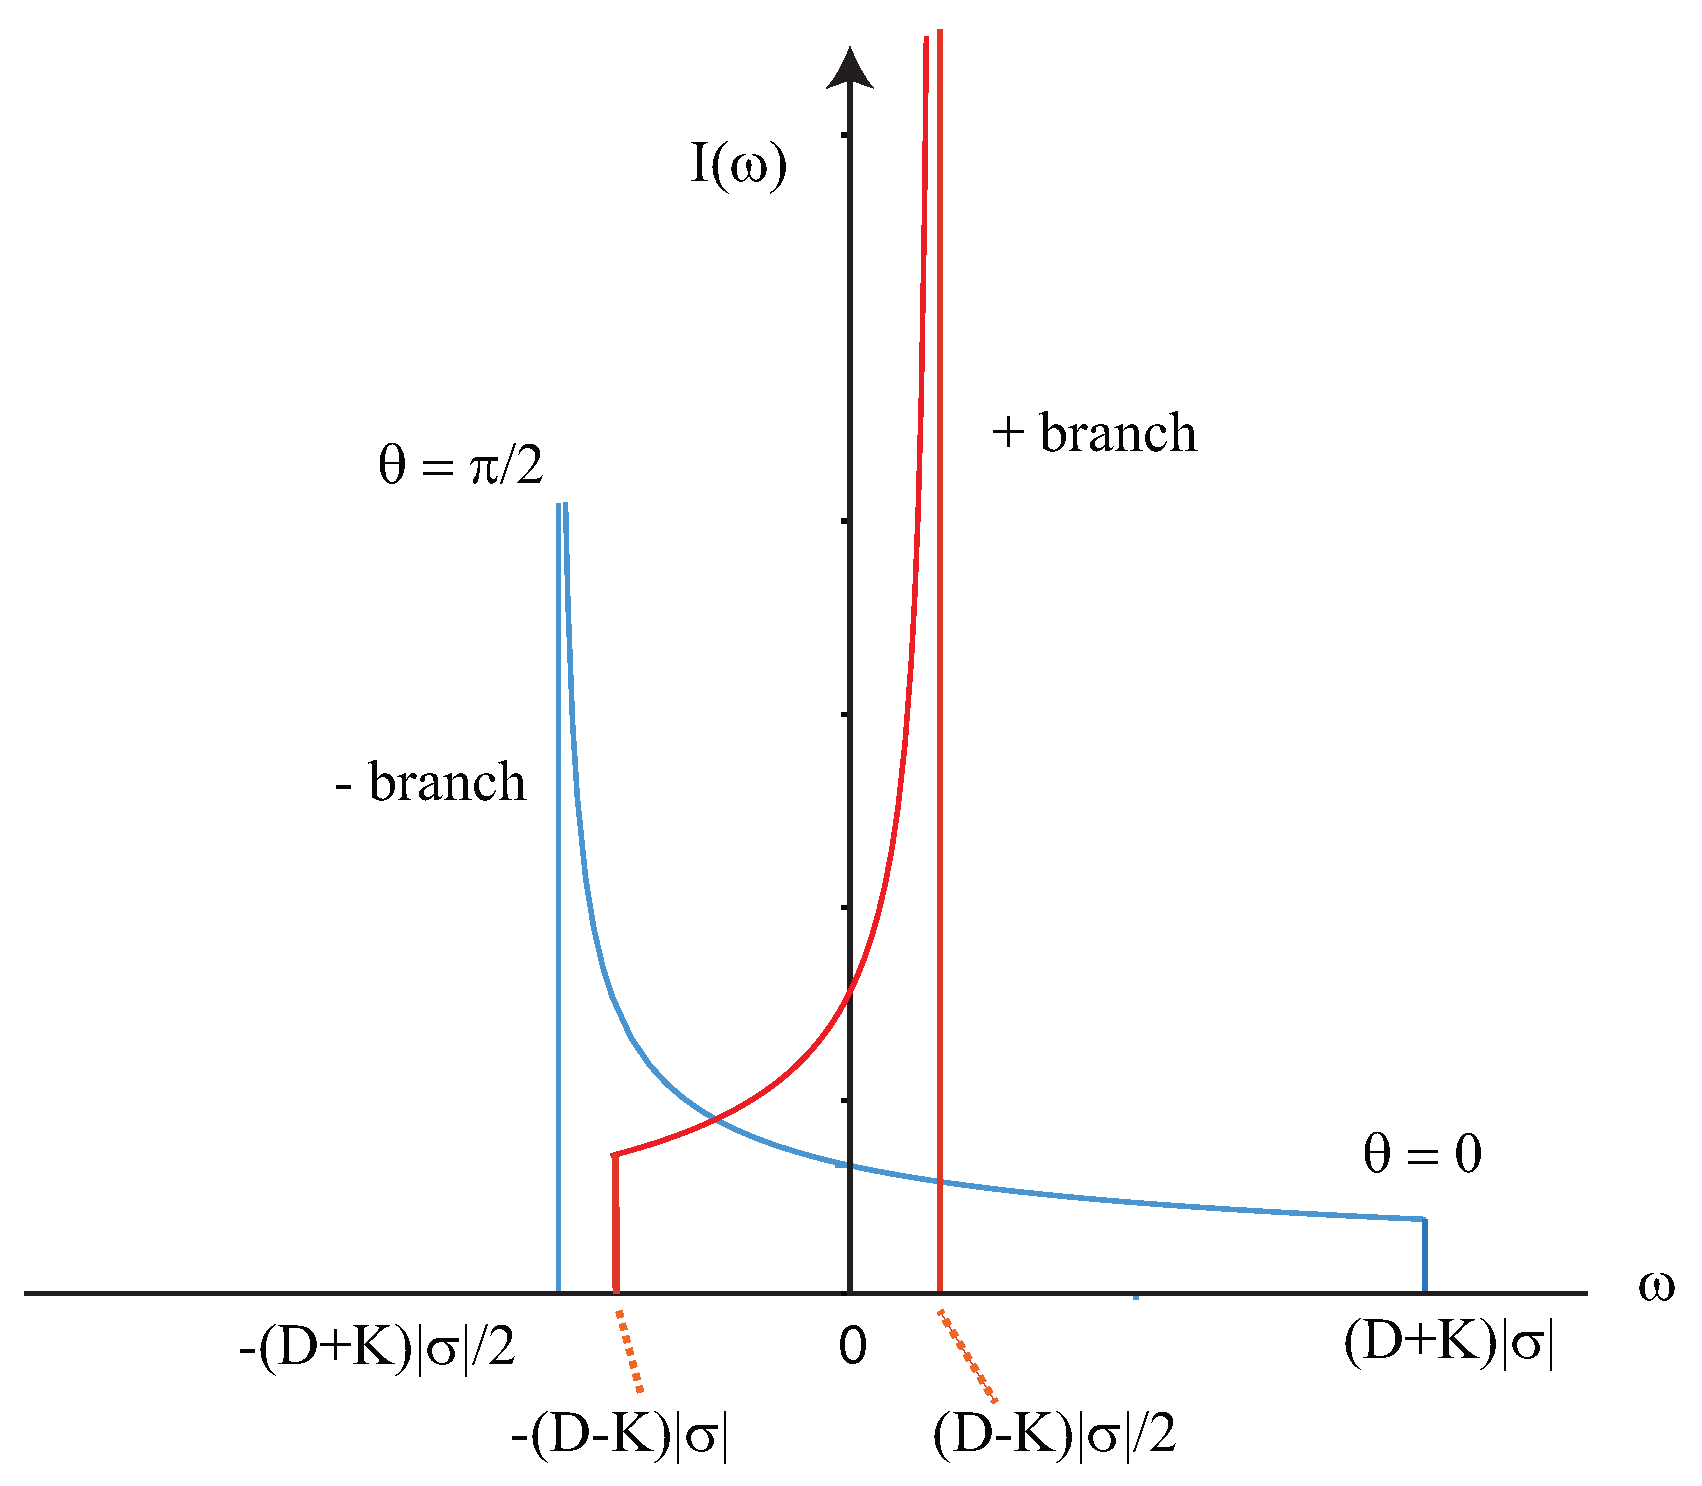
. The N NMR line shapes in the presence of a finite orientational order parameter form doublets for a powered sample, but unlike those for solid H, they are antisymmetric with Equation (6) replaced by:
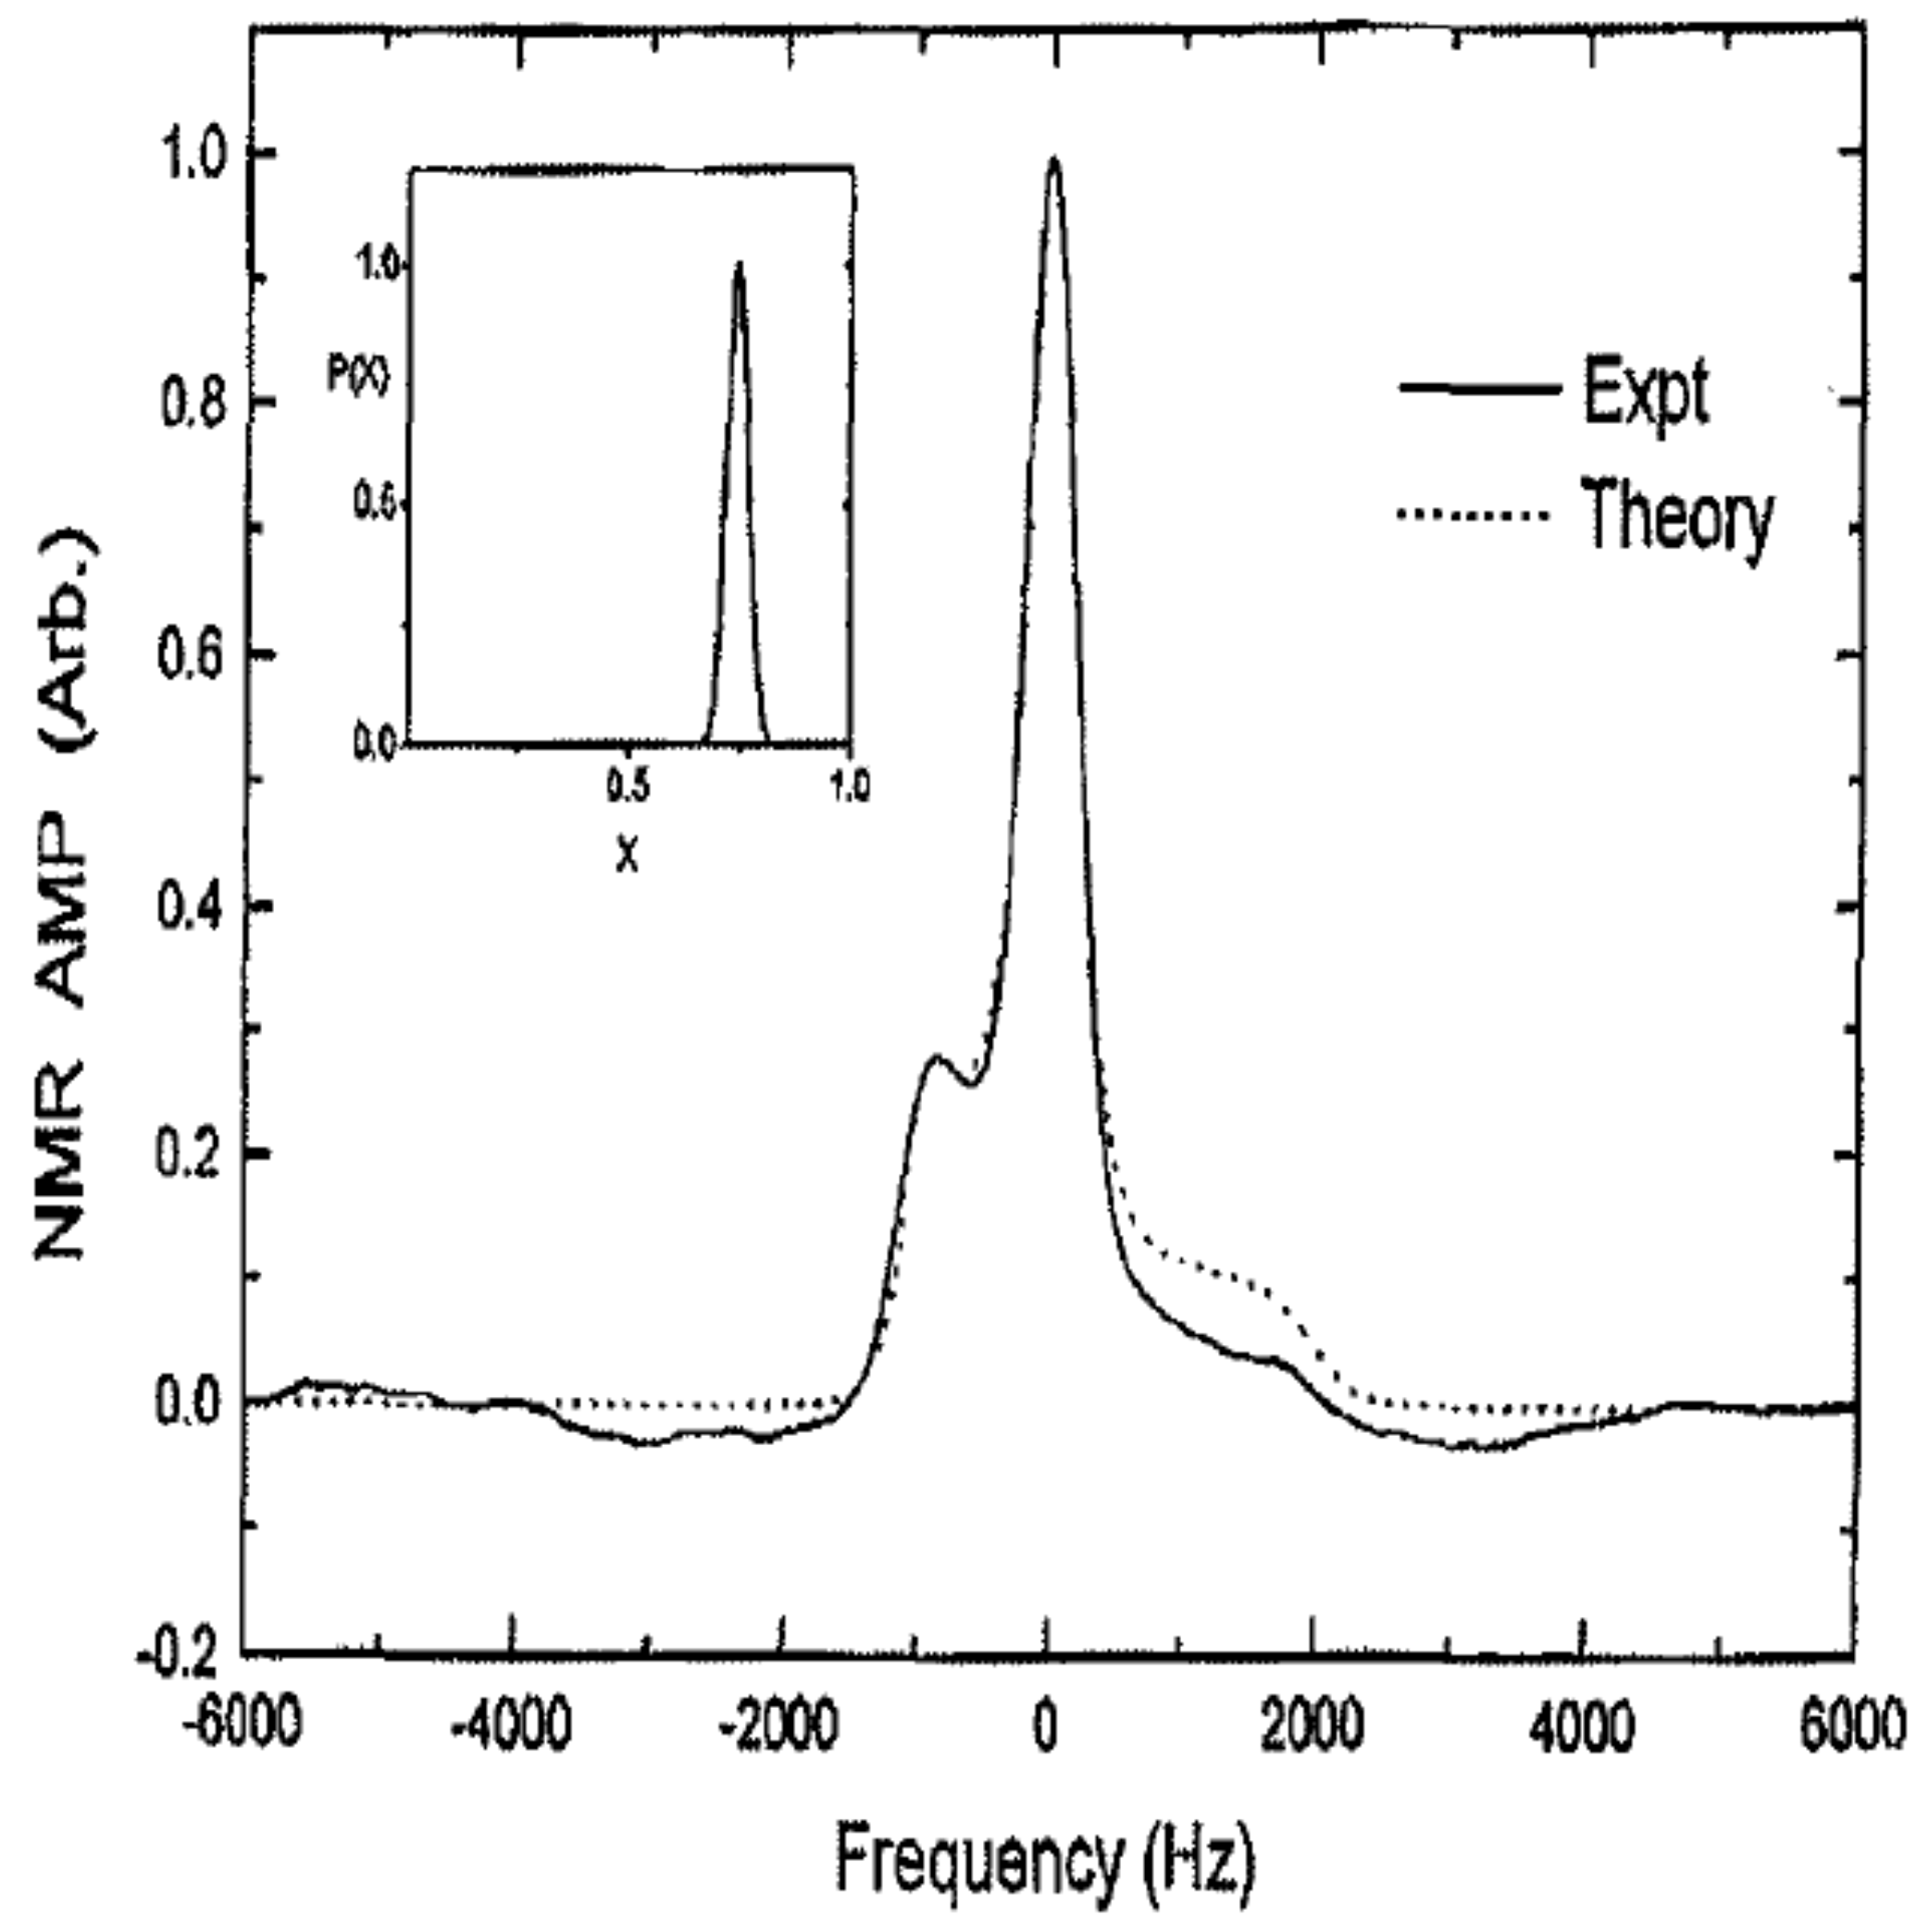
as illustrated in Figure 11. A typical line shape is shown in Figure 12 and compared with a calculated line shape for a fixed order parameter that includes a small broadening, as shown by the inset to Figure 12. The agreement is very satisfactory.
Narrow lines consistent with long-range ordering in a Pa3 structure are only observed for N concentrations above 76%, where the lattice structure remains fcc (Part III of Figure 3b). In the region where the lattice remains hcp for (Part II of Figure 3b), only broad NMR line shapes characteristic of quadrupolar glass-like ordering are observed. The remarkable observation is that in Region IB of the phase diagram (see Figure 3b), one once again observes a relatively narrow line shape (see Figure 13) for [38]. Because of the presence of high substitutional disorder, this narrow line shape is believed to be a true orientational glass (analogous to that depicted in Figure 1a) with a broad distribution of alignment angles, but a relatively narrow distribution of order parameters about those angles and with a mean . On further dilution of to 40%, only very broad NMR line shapes are observed in Region IA of Figure 3b.
While the NMR line shapes of solid ortho-para hydrogen mixtures and N-Ar mixtures are consistent with quadrupolar and orientational glass states at low temperature and the growth of the quadrupolar order parameter as the temperature is lowered suggests that the local ordering is collective in nature and not driven by fixed local fields, it is important that the dynamics be investigated to determine whether the characteristic rapid freezing of the orientational fluctuations occurs at the onset of glassiness. This is discussed in the next section.
4. Dynamics
NMR methods can be used to investigate the dynamics of molecular fluctuations and in particular the orientational or quadrupolar fluctuations over a wide frequency range [25,26,37]. The sensitivity of NMR methods to motions arises because fluctuations of the molecular alignments or local order parameters render the intra-molecular nuclear dipole-dipole interactions time dependent [46]. Specifically, the nuclear spin-lattice relaxation time, , due to the modulation of the dipole-dipole interactions, is given by:
D measures the strength of the intra-molecular dipole-dipole interaction, and is the nuclear Larmor frequency. is the spectral weight of the fluctuations at frequency .
The are the tensorial operators defined in Equation (2).
The expectation value must be calculated with a quantization axis parallel to the magnetic field. The order parameters, however, are calculated with respect to the local molecular symmetry axis. In order to carryout this evaluation, we therefore consider the rotation:
The are the rotation matrix elements, and the angles are polar angles defining the orientation of the magnetic field in a local reference frame aligned along the molecular equilibrium orientation. One then assumes [47] that the time dependence can be separated from the order parameter variations as:
The original data shown in Figure 14 [48] were interpreted in terms a single correlation time . The result, a strong almost exponential temperature dependence, resembles, but is not identical to a Fulcher–Vogel temperature dependence. The data in Figure 14 along with the results observed for the very slow dynamics determined by NMR stimulated echo studies [49] are among the most convincing experimental evidence for traditional glassy dynamics for the quadrupolar glass state of solid ortho-para hydrogen mixtures.
Further studies, however, showed that the nuclear spin relaxation was not a simple exponential, but rather a sum of different exponentials associated with different parts of the NMR line shape, as illustrated in Figure 15.
This spectral inhomogeneity of the nuclear spin-lattice relaxation can be expected from Equation (22). If one assumes that the relaxation is dominated by the fluctuations of the axial order parameter, , then Equation (22) leads to:
for the contribution to the relaxation by the dipole terms. The factor is the mean square variation of the operator . The angular terms are associated by different isochromats of the NMR line shape, and if one assumes Lorentzian forms with correlation time for the spectral densities , we have [47]:
is the frequency of an isochromat with respect to the center of the NMR absorption line. The spin-rotational (SR) interaction also contributes to the relaxation rate:
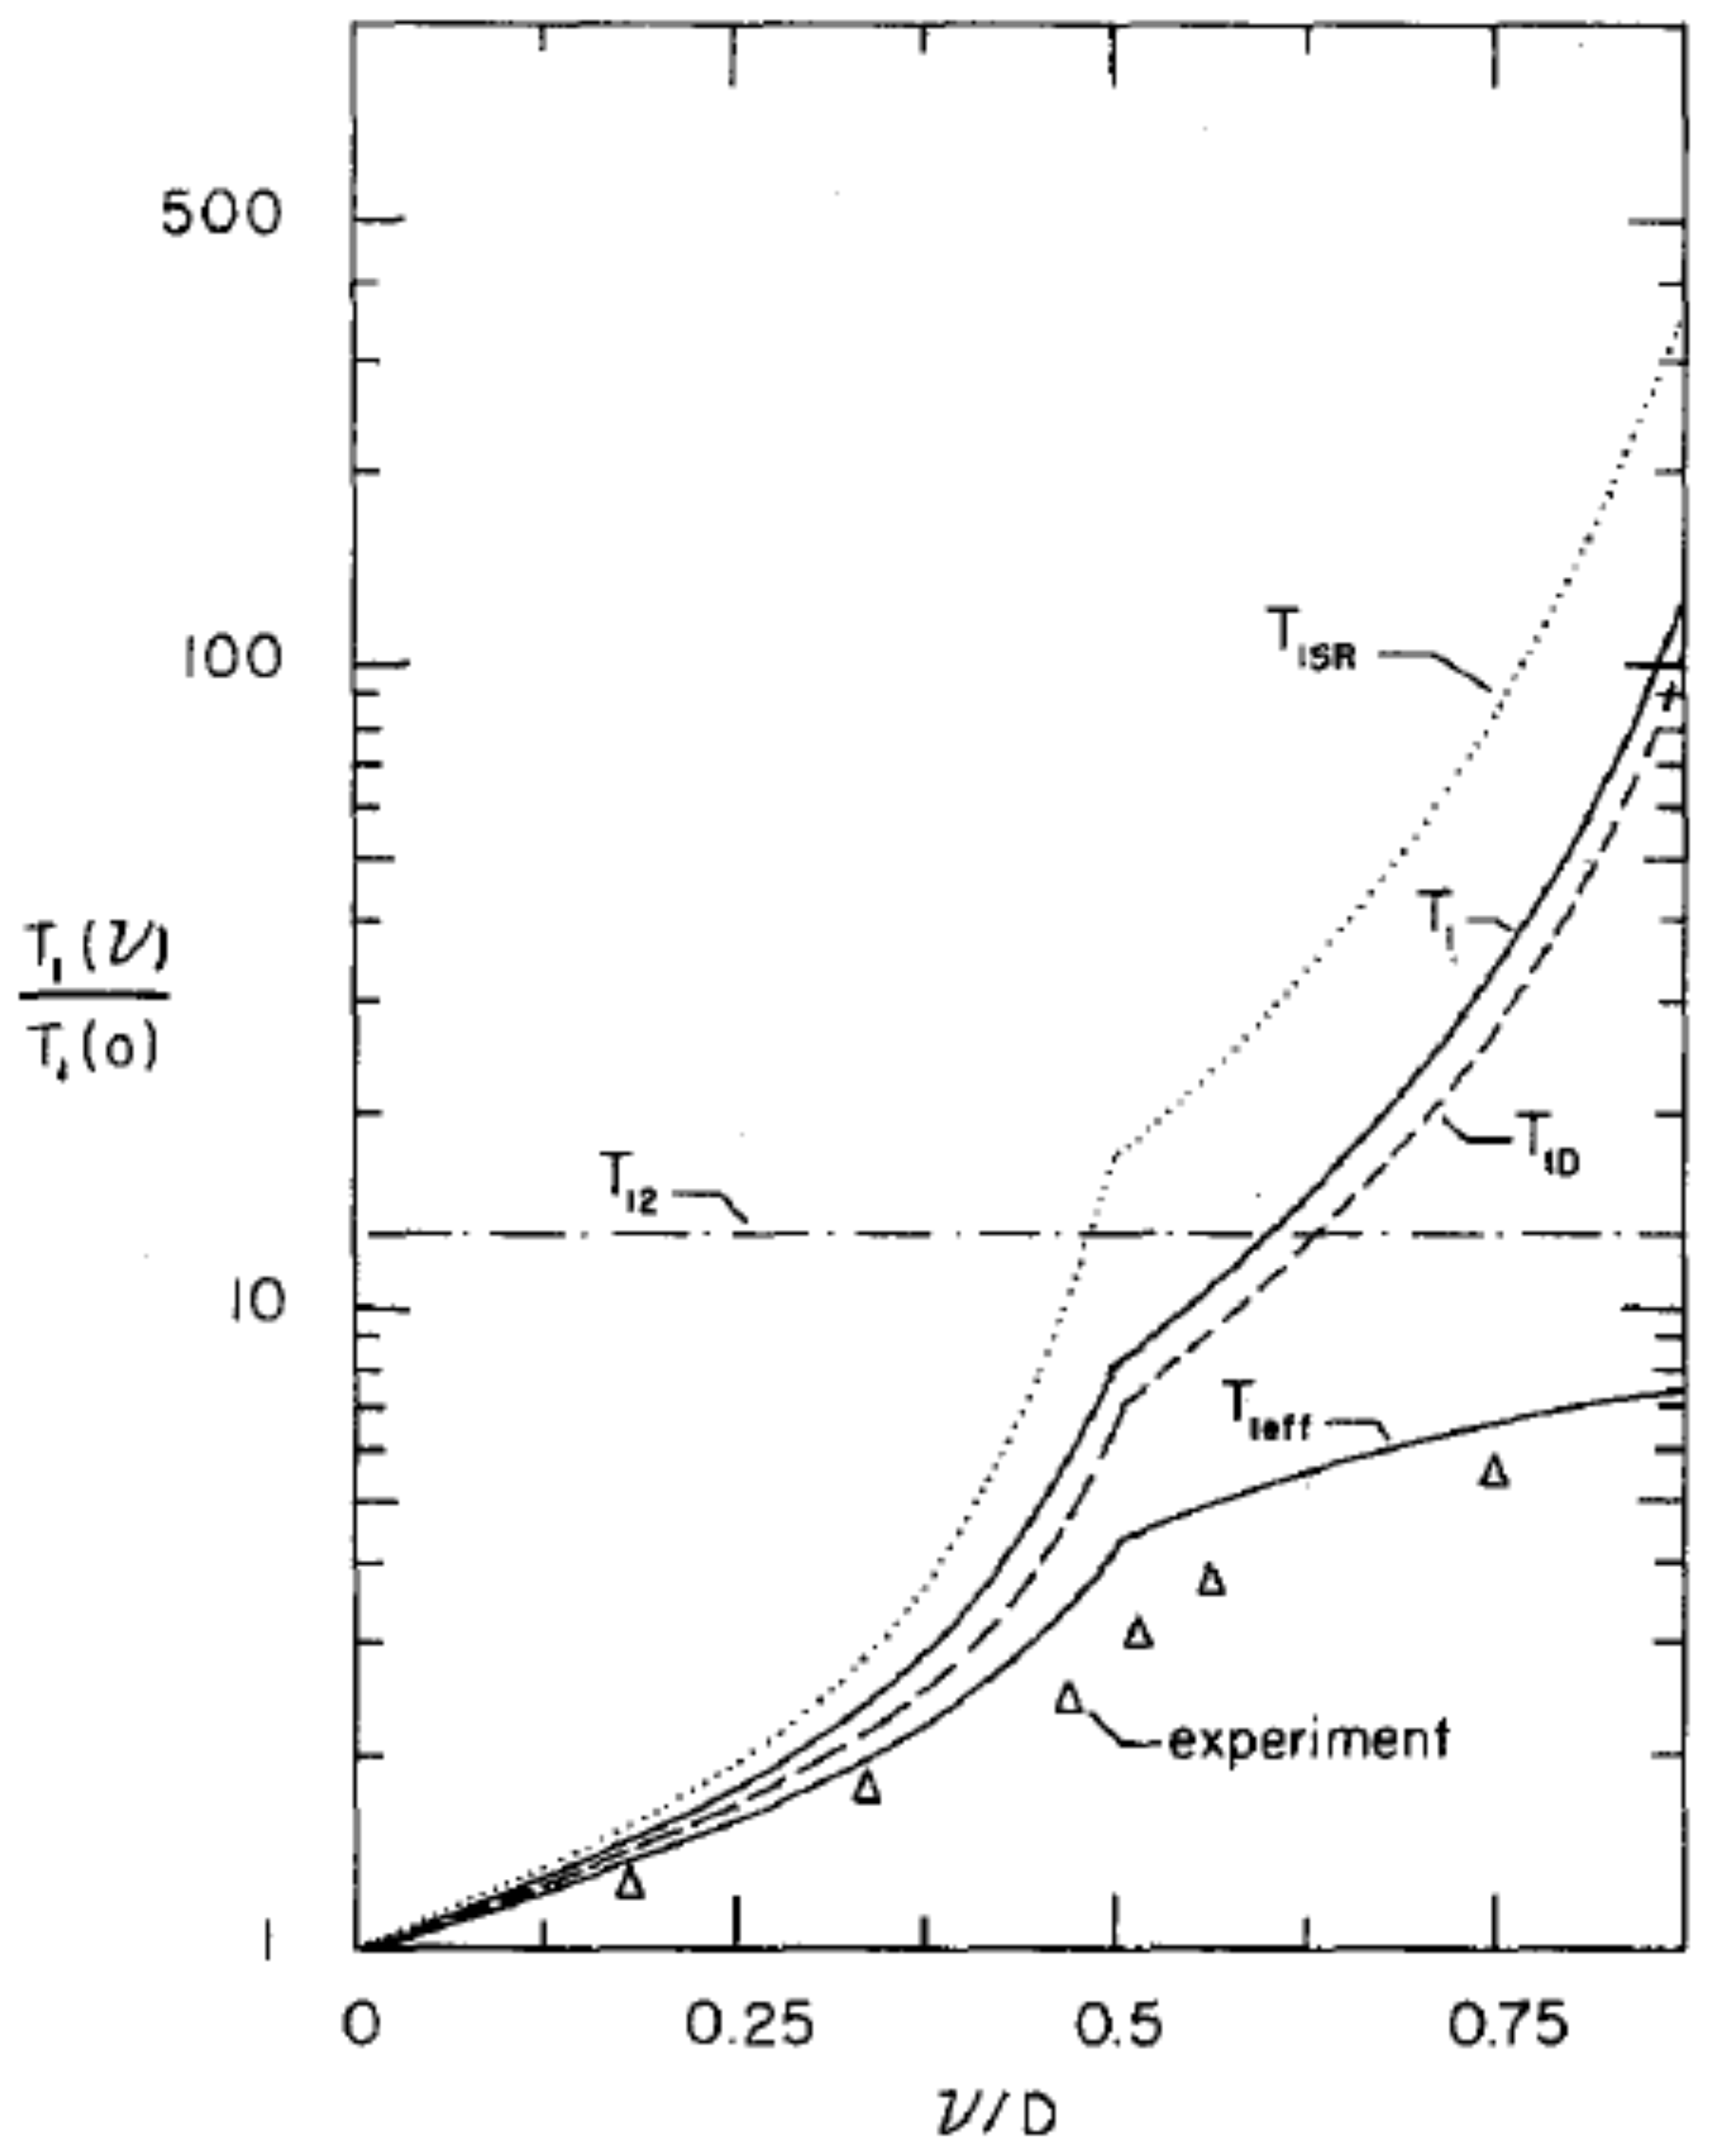
where kHz for a hydrogen molecule. These two contributions to the relaxation rate from the intra-molecular dipole-dipole and spin-rotation interactions are additive, and the overall relaxation given by is shown in Figure 16. The agreement with experiment is satisfactory. Yu et al. [50] also noted that cross-relaxation, , between different isochromats will tend to smooth out the inhomogeneities in the relaxation rates, and the observed relaxation will be determined by . The resulting variation of the relaxation as a function of is shown in Figure 16.
5. Thermodynamic Measurements
Measurements of the heat capacities of solid ortho-para hydrogen [51,52] and N-Ar mixtures [53,54] showed rather featureless temperature variations and were at first sight disappointing, but studies of the very slow dynamics of solid hydrogen with dilute ortho-H concentrations were able to provide a uniform picture for the very slow motions and the thermodynamic behavior. The low frequency dynamics was investigated using NMR stimulated echo techniques employing three RF pulses [49]. After a first pulse, the nuclear magnetization is rotated to a transverse axis (x-axis), where it evolves under the intra-molecular dipole interactions, which depend on the local order parameter. After a time , a second pulse stores the transverse magnetization along the original z-axis. The value stored depends on the original value of the order parameter. After a waiting time , a third pulse returns the stored magnetization back to the x-axis, and after a further time , a stimulated echo is formed, provided that the order parameter varies only very slowly in the waiting time . A variety of different pulse sequences can be considered but the simplest () about the same axes produces an echo signal:
designates a configurational average over sites i. The dependence on allows one to explore slow temporal fluctuations of the molecular order parameters over time . The results (Figure 17) were surprising, as they showed a unique logarithmic decay.
The logarithmic decay can be understood in terms of the droplet model proposed by Fisher and Huse [55,56]. Fisher and Huse considered the density of low energy states for connected clusters and argued that because the clusters are rare, they could be treated as “non-interacting two level systems”. For a free energy barrier , the tunneling rate at temperature T is:
where is an attempt frequency. For long times, is well defined because it is associated with a characteristic cluster size. The relaxation is hierarchical as low-energy barriers must be overcome before larger barriers can be crossed. The dynamics of of the faster degrees of freedom therefore constrain the slow motions. As a result, in time t, the barriers overcome will be those with energy less than where:
For all energy barriers traversed in time t, the order parameters change significantly, and the correlation functions will vanish after the barriers are crossed. If the density of low energy excitations is , the stimulated echo amplitude will be given by:
At low temperatures, we only need consider the density of states near , and the echo amplitude becomes:
is determined by the attempt frequency . Since the order parameter changes by the order of unity in time :
The decay of the stimulated echos is therefore directly related to the density of states at low energy, , which is expected to be constant and can be related to the thermodynamic measurements. From Figure 17, we find .
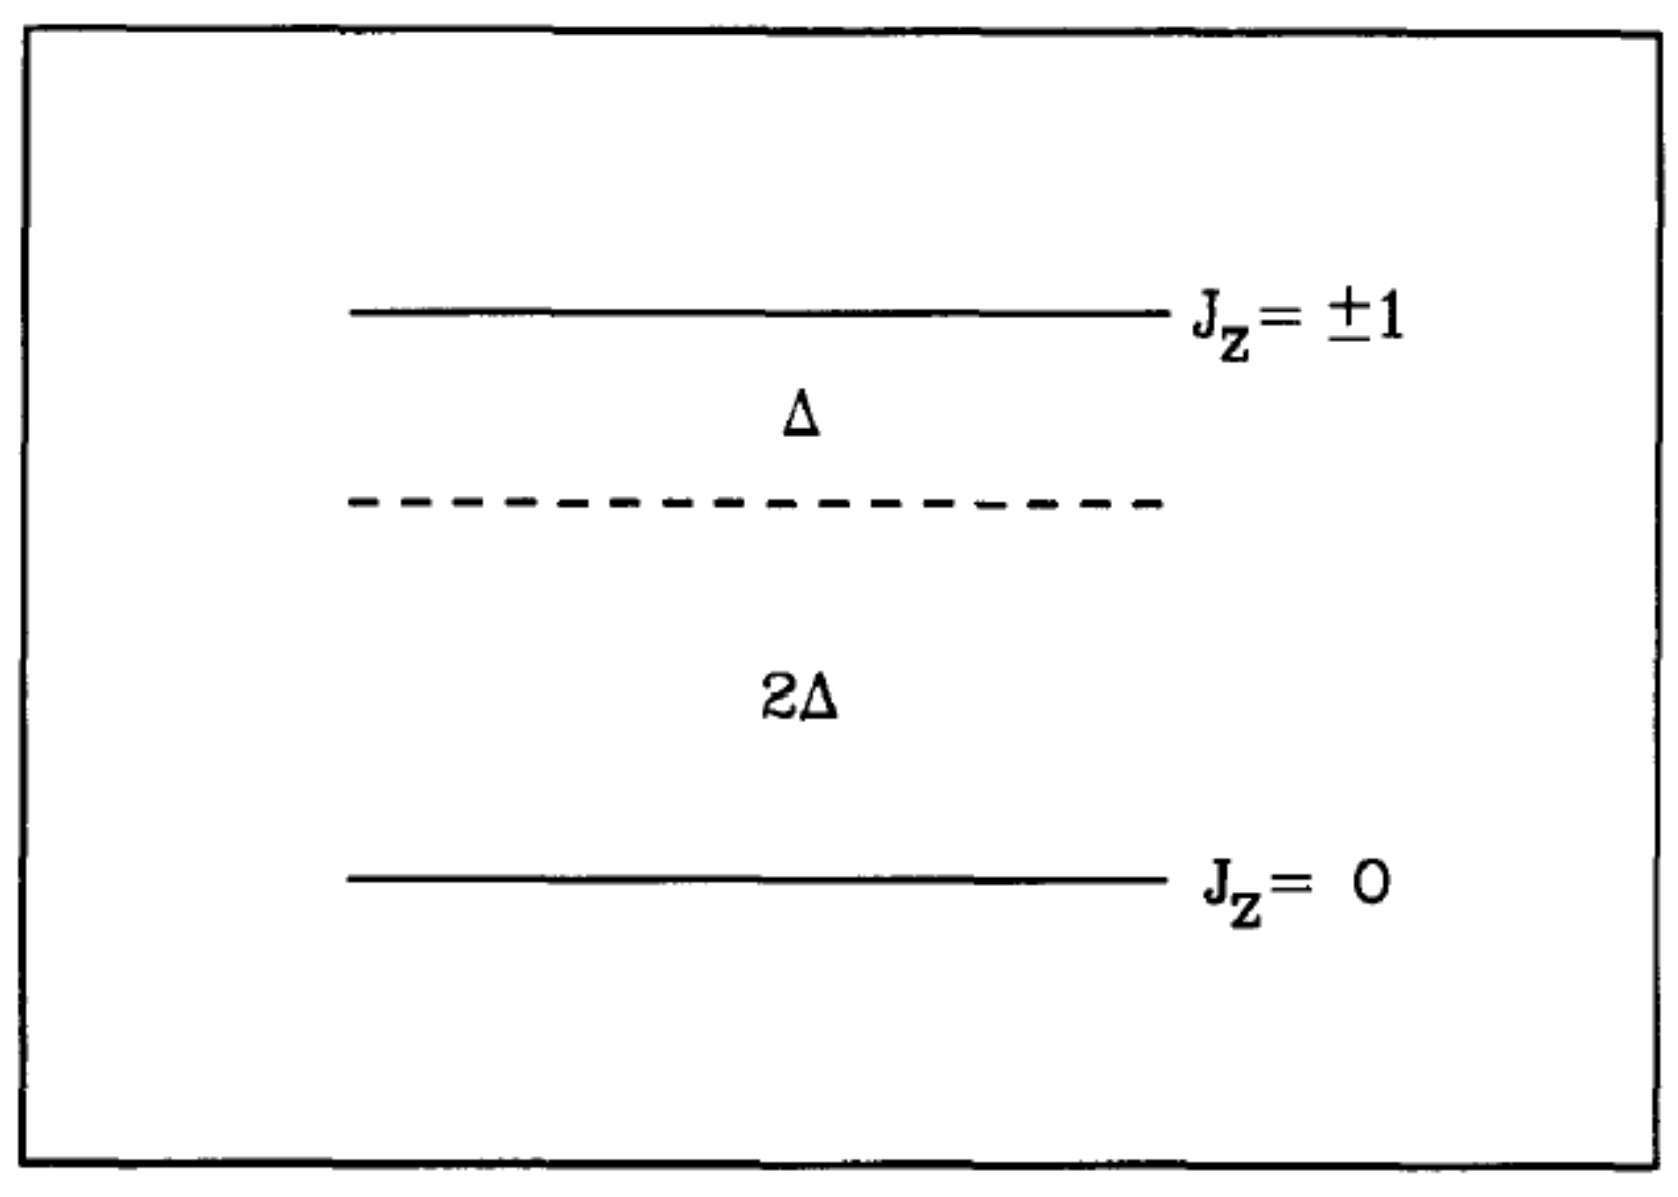
Knowledge of the density of energy levels allows one to calculate the heat capacity and test the interpretation of the dynamics against the experimental results for heat capacity studies [51,52,53,54]. Using the energy scheme of Figure 18, the heat capacity is calculated from the sum over the distribution of energy states as:
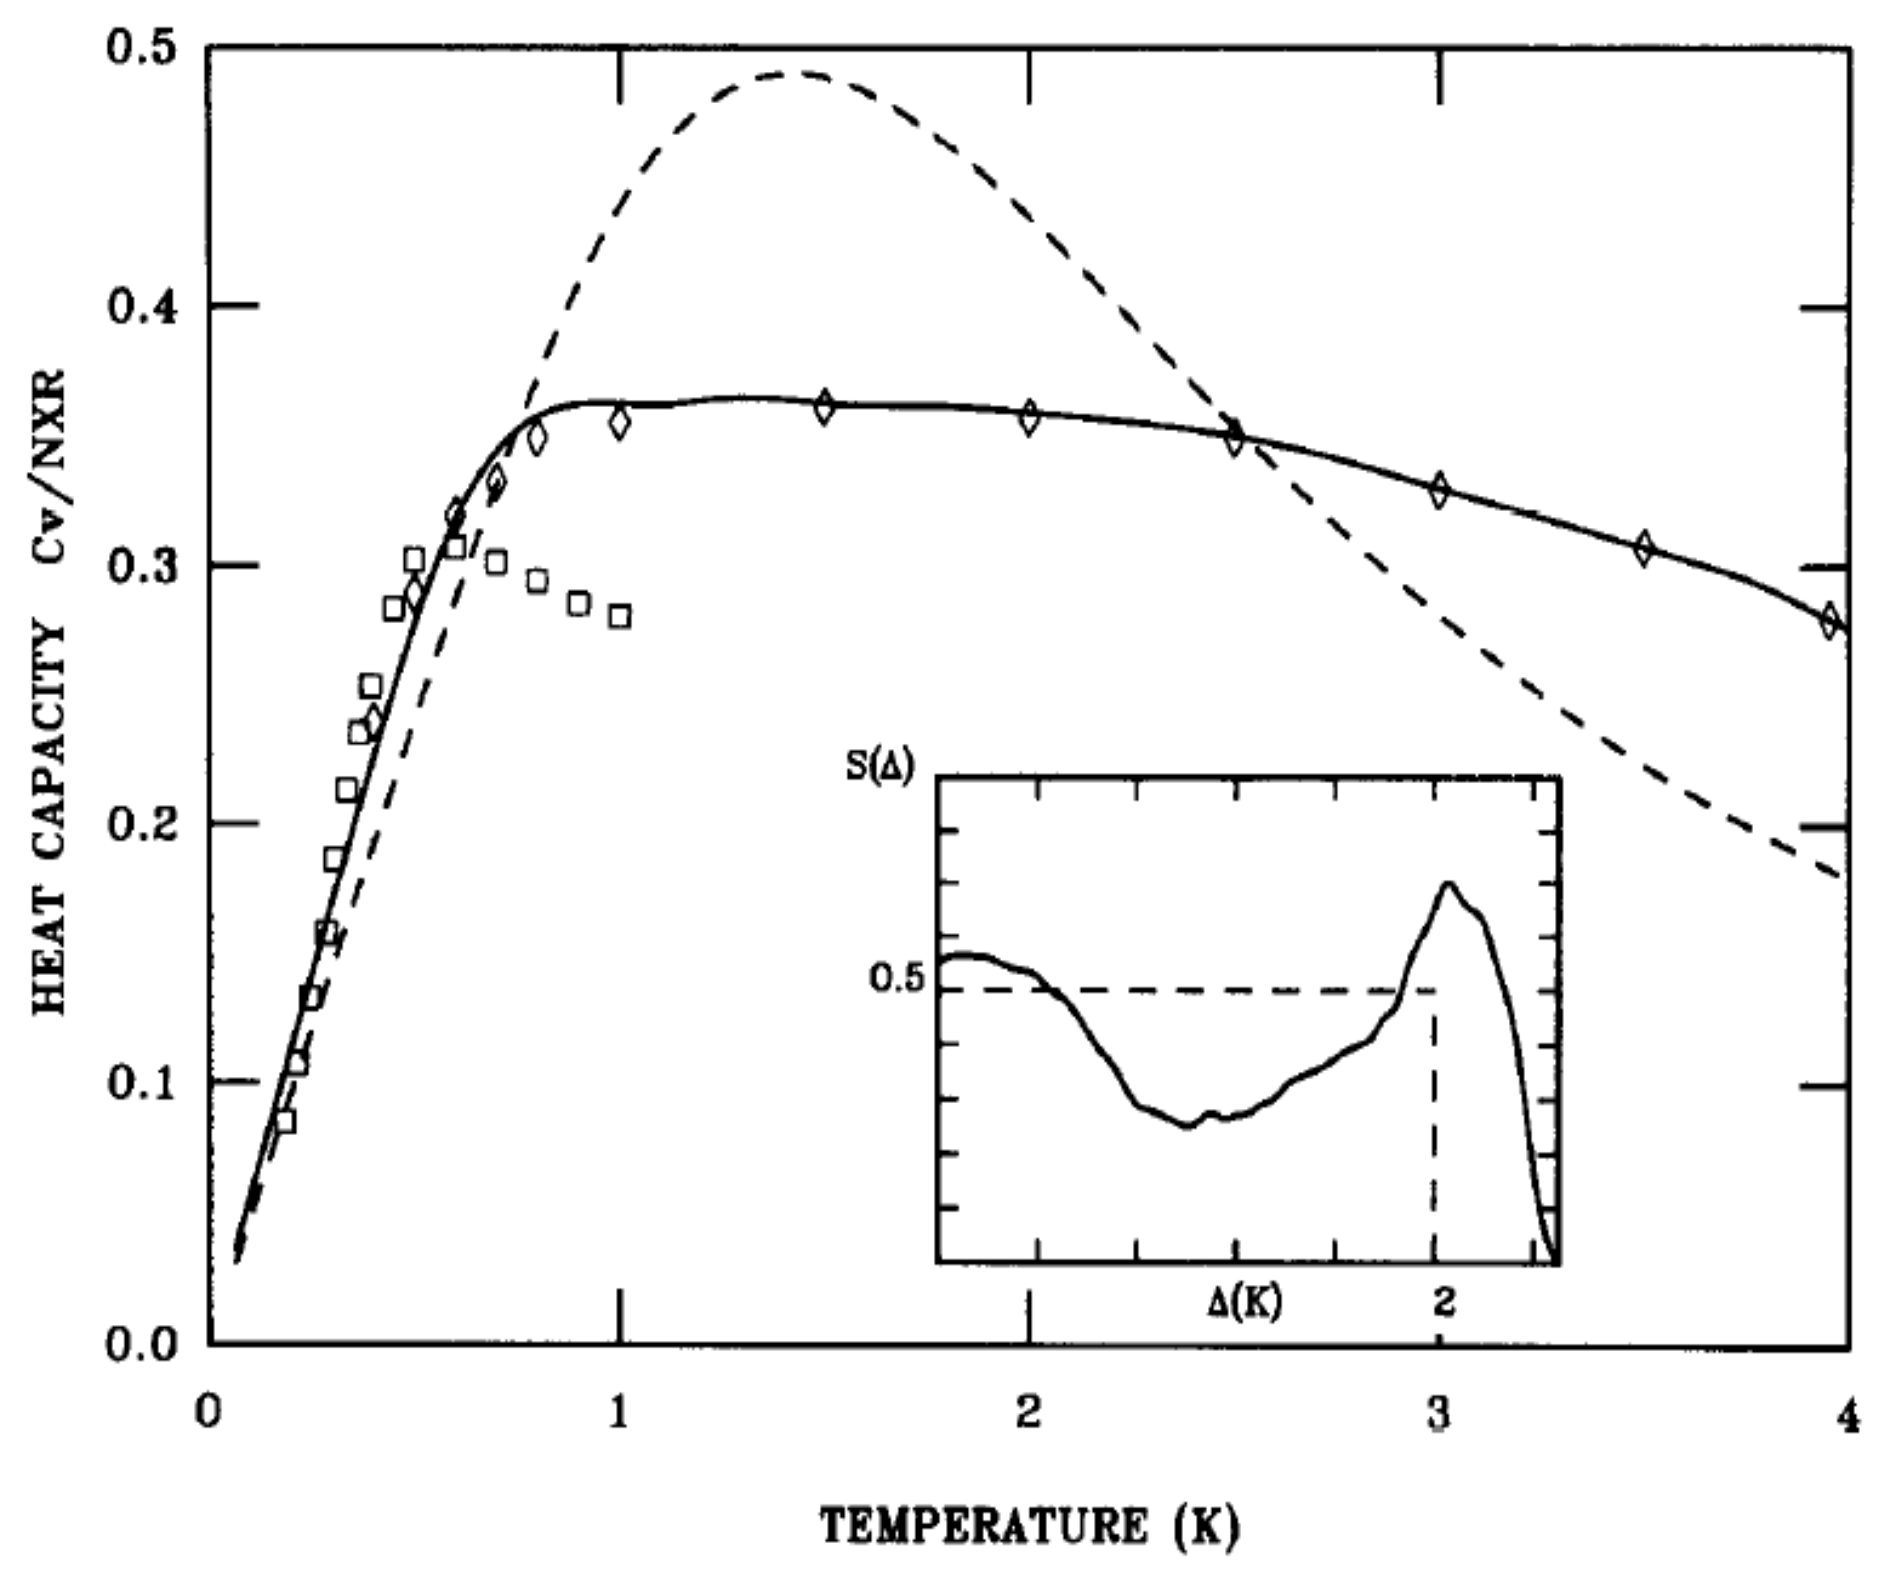
with . X is the ortho-H concentration. The result of the calculation shown in Figure 19 gives a good description of the characteristic linear temperature dependence at low temperatures, and an excellent fit is obtained using small deviations from a constant density of energy states shown by the solid line of Figure 19.
6. Dielectric Measurements
While the analysis of the NMR line shapes of solid ortho-para H and solid N-Ar mixtures with high disorder (that is, low concentrations of the active quadrupole bearing molecule (ortho-H or N)) show clear evidence of the formation of glassy states at low temperatures and the temperature dependence of the dynamics cannot be understood except in terms of local collective ordering, the characteristic hysteresis of the susceptibility (the parameter conjugate to the local order parameters) remained elusive until the studies of Pilla et al. [57,58] using electric susceptibility measurements. These measurements were carried out on dilute solid N-Ar mixtures for concentrations where the lattice remained cubic. In this case, the concern that there exist local electric field gradients due to the introduction of substitutional disorder is greatly lessened, and the system is much closer to the class of the familiar spin glasses.
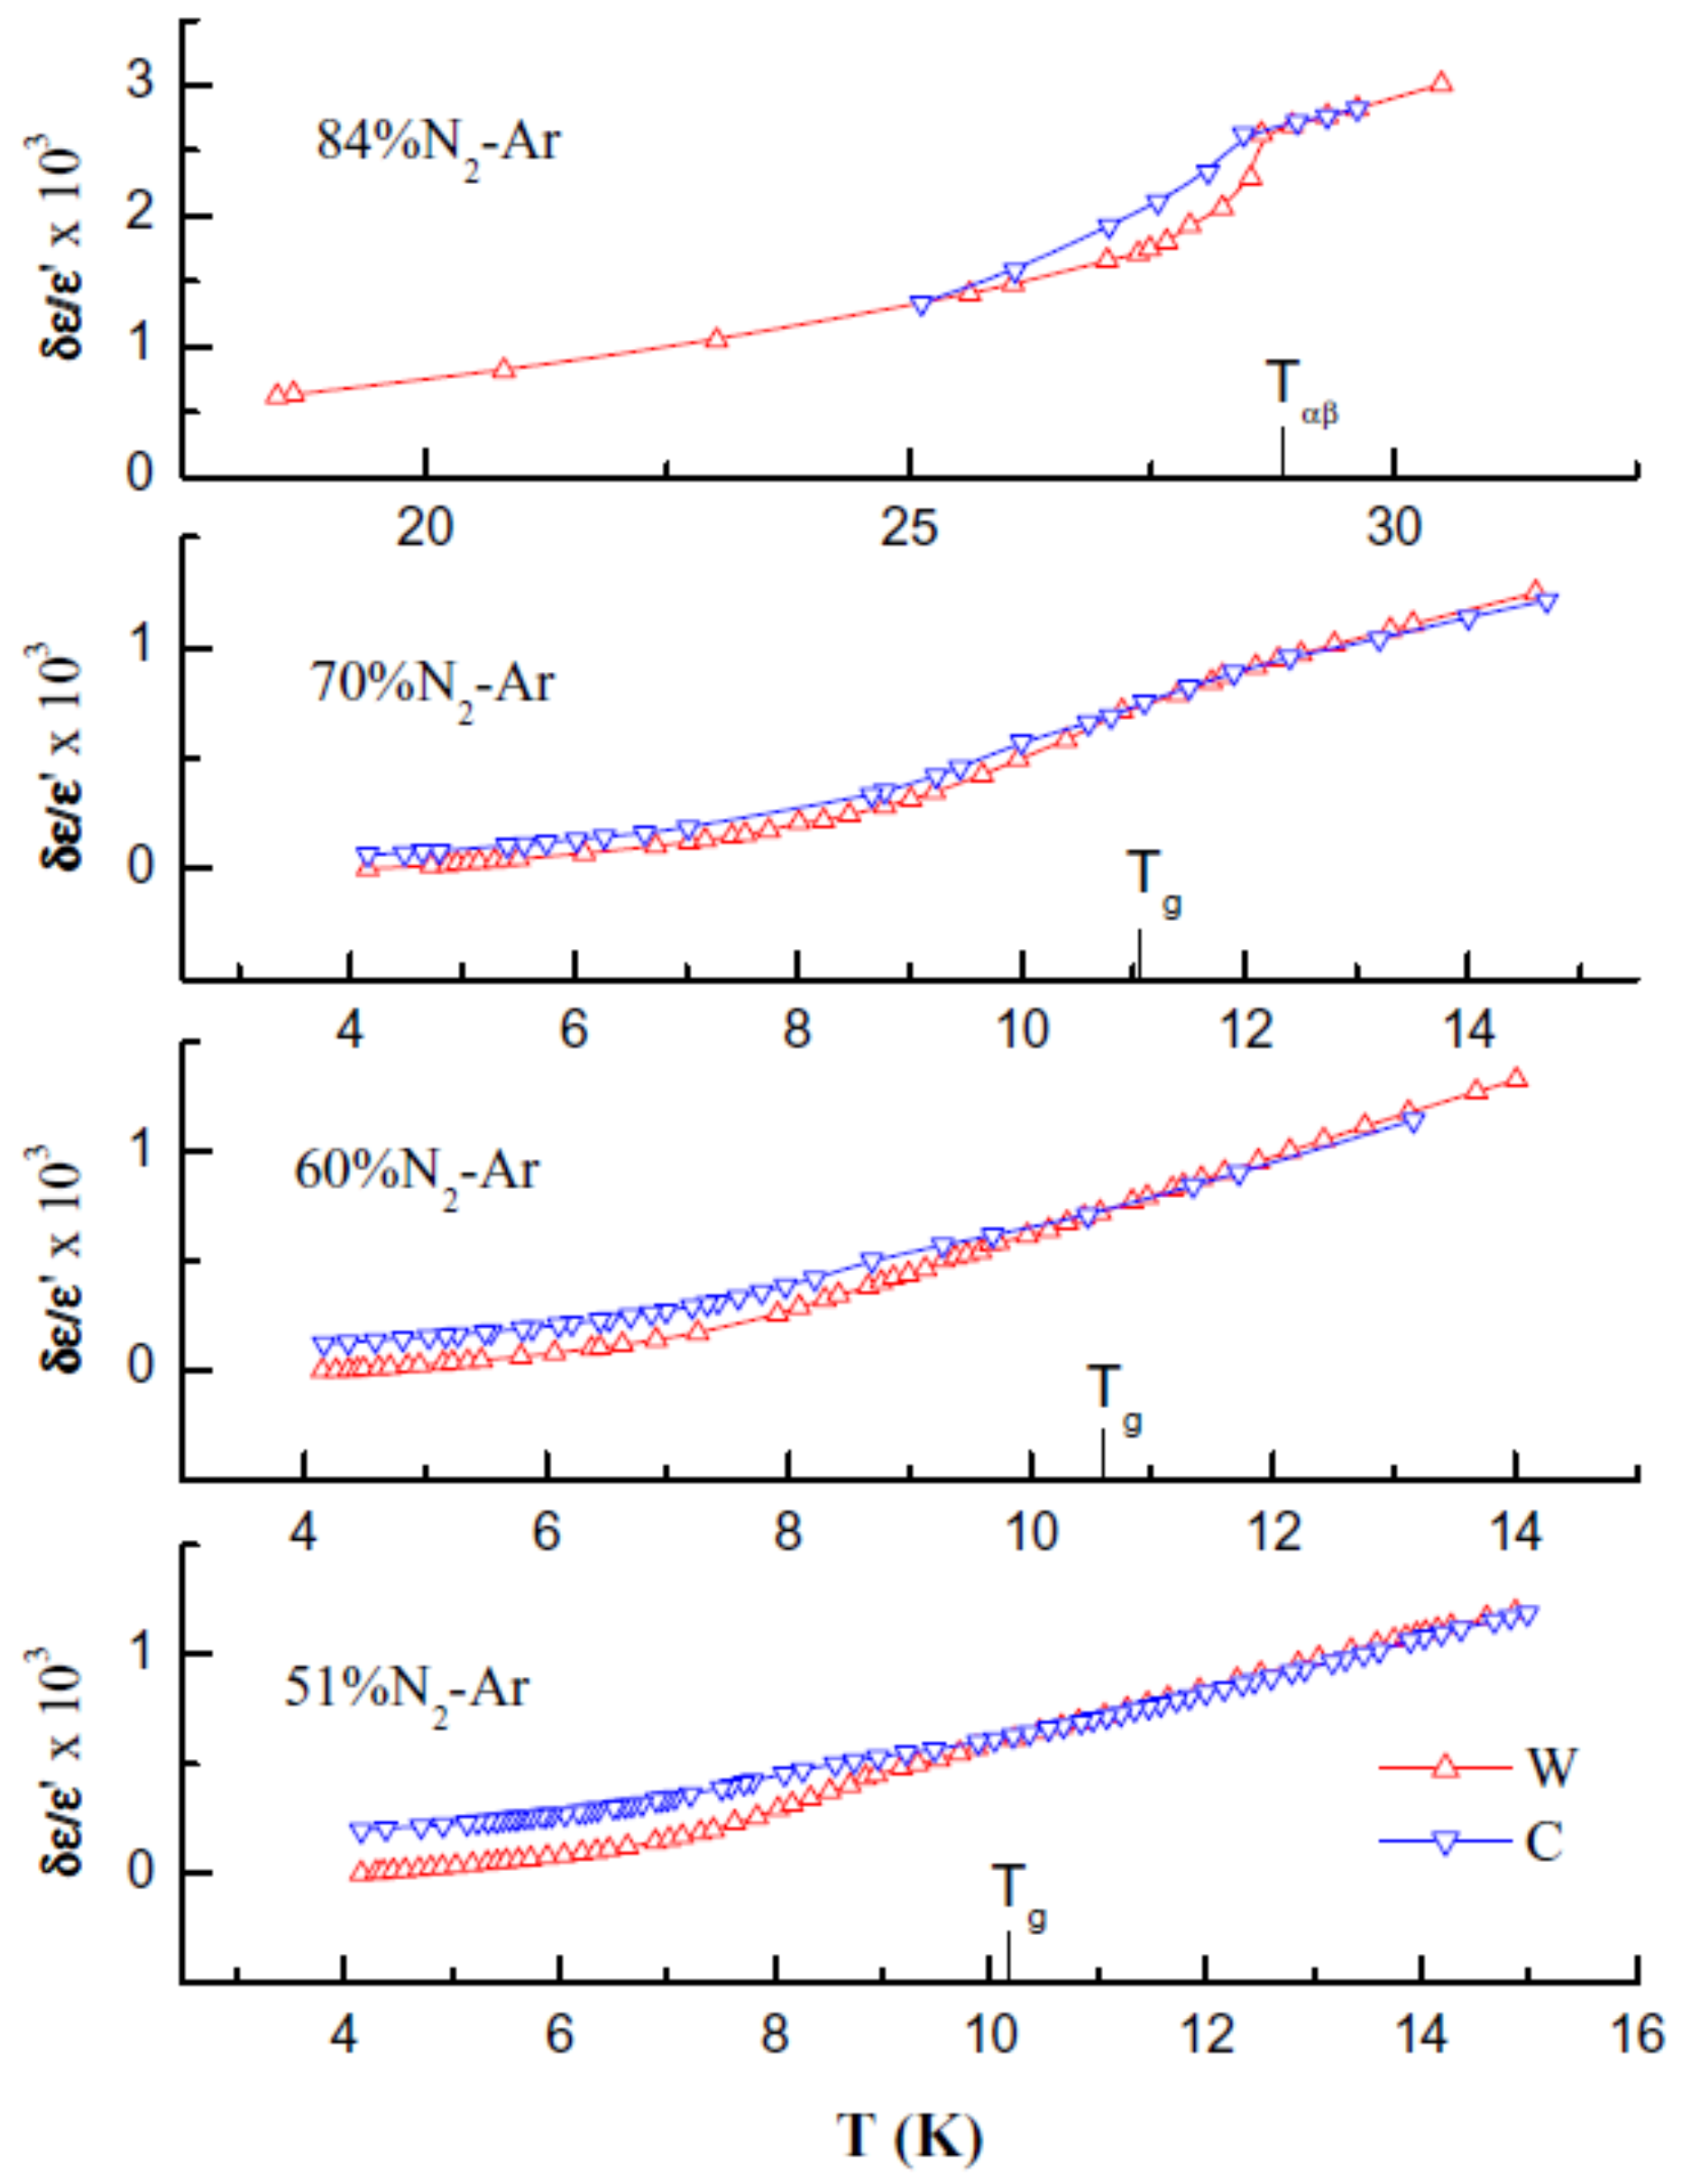
The use of a high sensitivity capacitance bridge [59] to measure dielectric susceptibilities showed distinct hystereses in the observed values of the dielectric susceptibility on thermal cycling [57]. The break in the observed values of at 9.8 ± 0.1 K (Figure 20) clearly marks a well-defined dynamical transition for solid N-Ar mixtures with 51% N that was absent in the NMR measurements.
The really significant consequence of the dielectric susceptibility measurements for the molecular glasses is that they can be used to test the applicability of replica symmetry breaking theories to this class of glass states [14,60]. For simple replica symmetry breaking, Cugliandolo and Kurchan [18] developed a generalized fluctuation dissipation theorem for the generalized susceptibility:
where is a generalized coordinate. The essential result is that below the characteristic glass freezing temperature of the dynamics, , the change in the response function depends on the waiting time because of the changes in the landscape of free energy barriers that occur in the time . The response function is defined by:
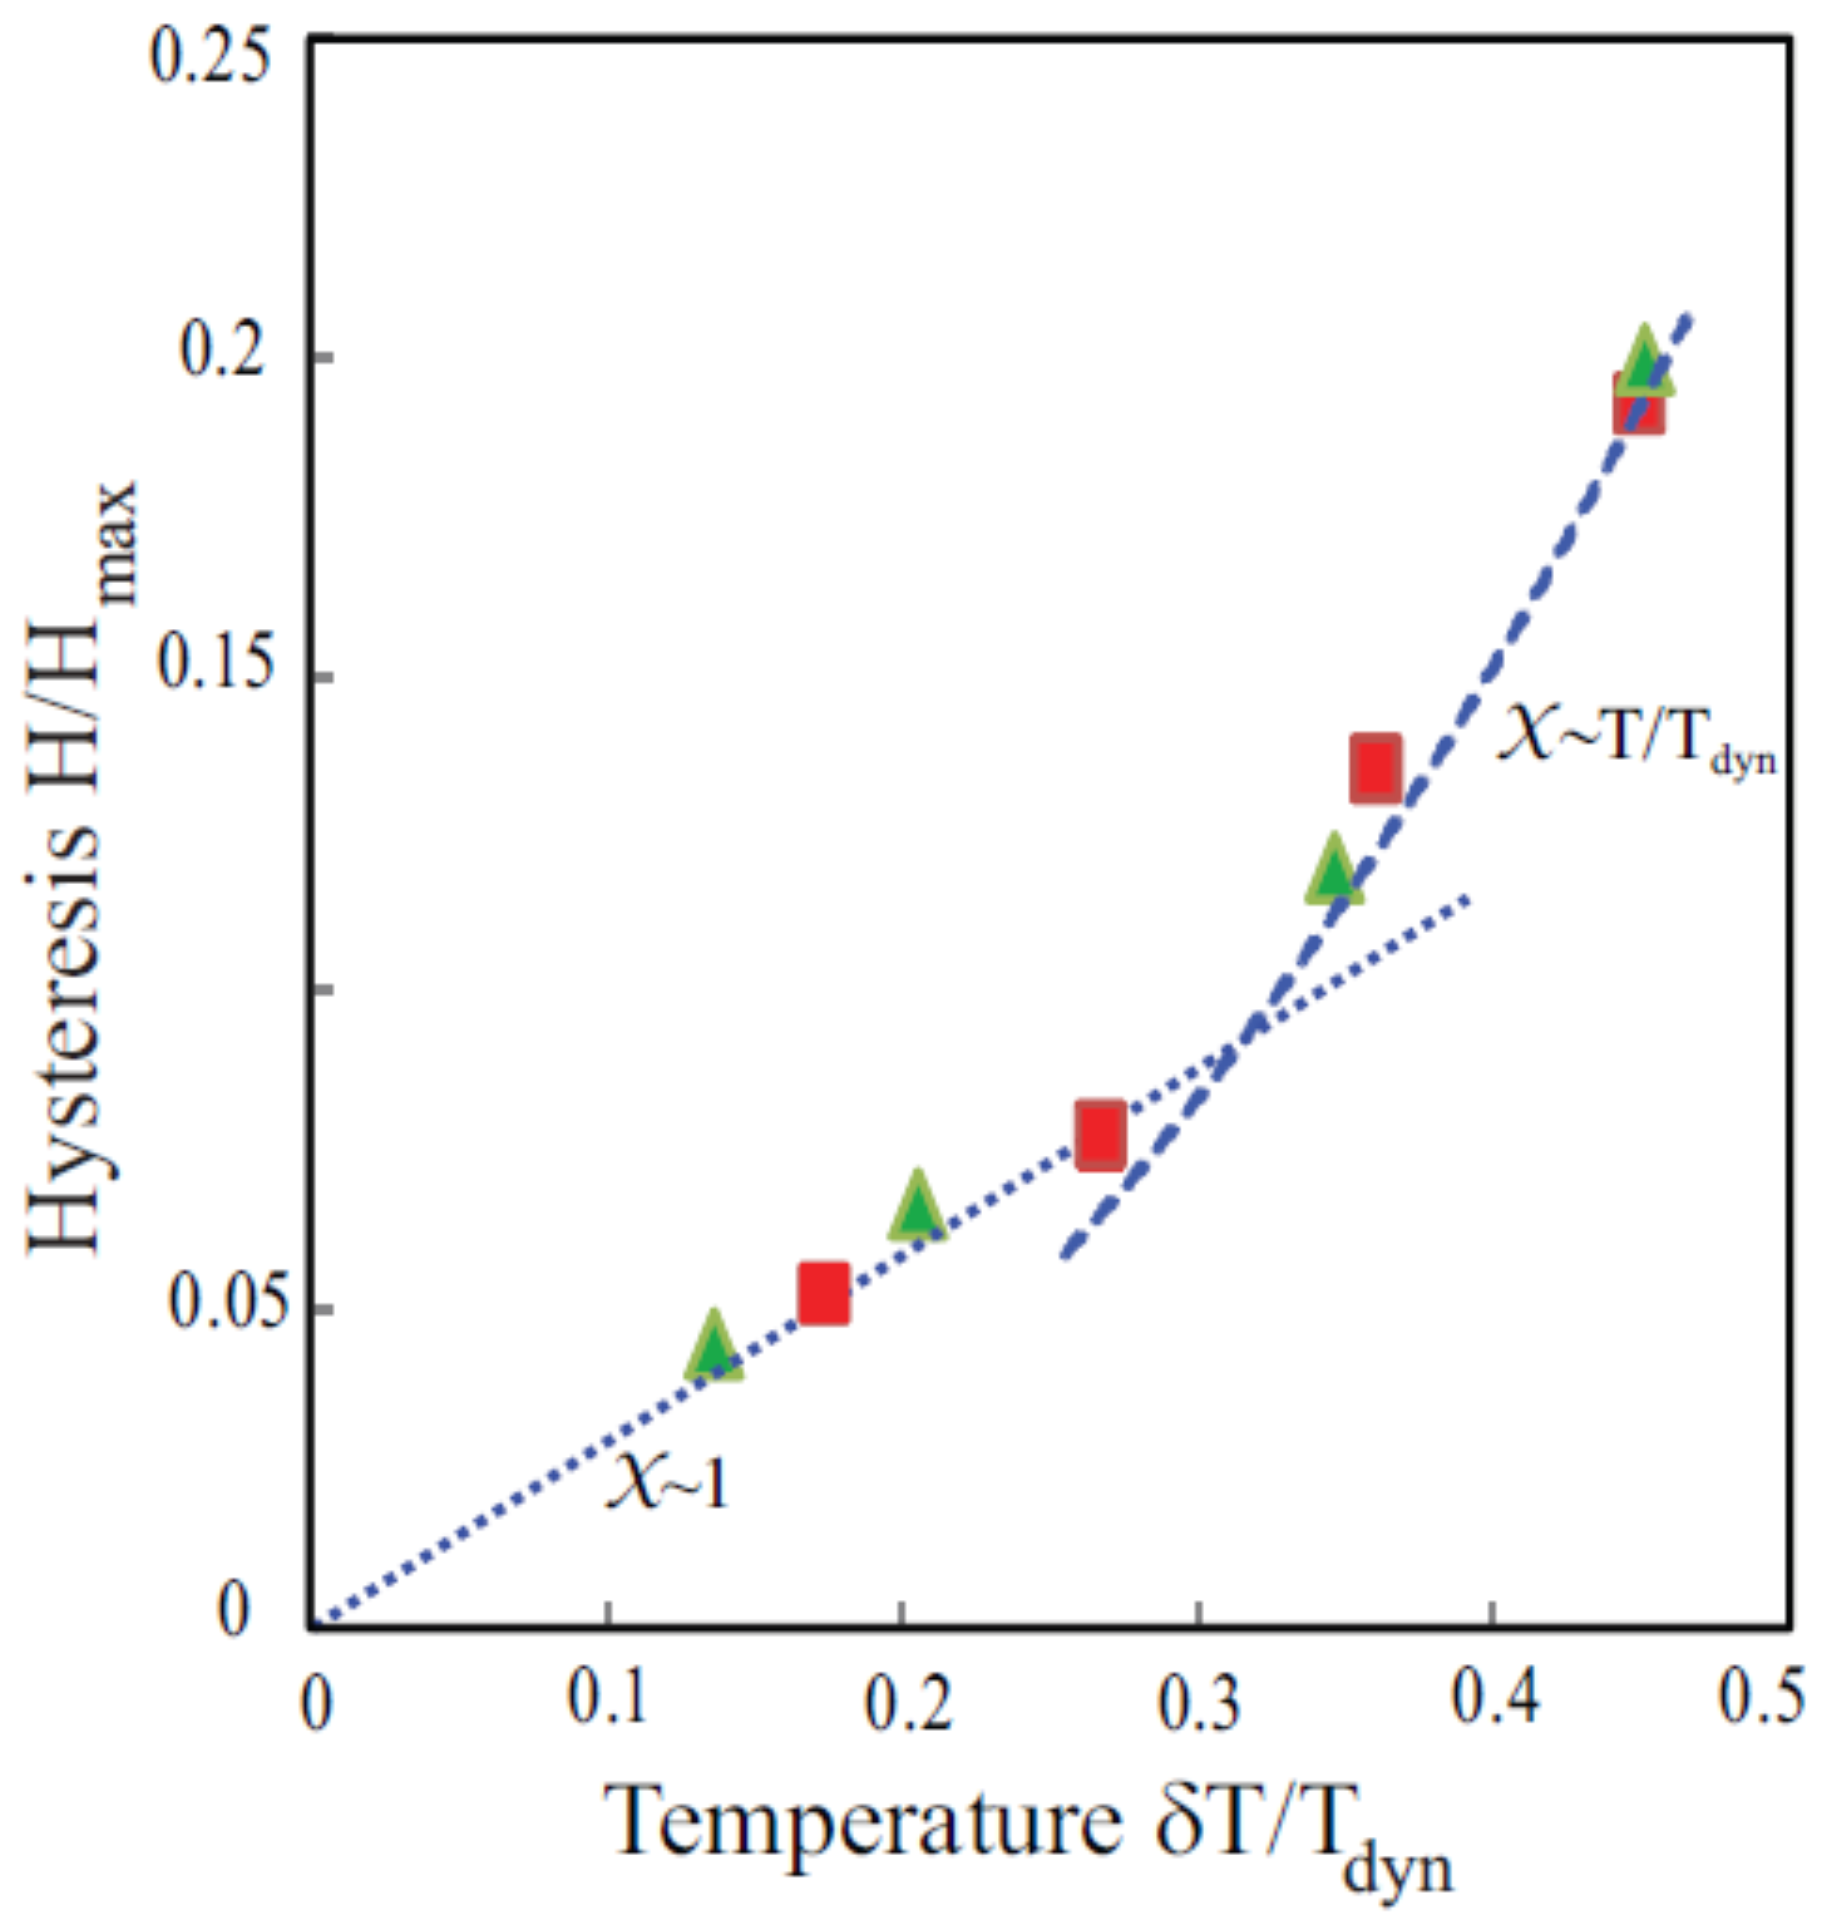
where is the relevant susceptibility. Pilla et al. [23] showed that as a consequence of this generalized fluctuation dissipation theorem, for large excursions compared to 1 (the classical result) for small . The results are shown in Figure 21.
7. Discussion
The experimental results for the NMR studies of the line shapes of solid ortho-para H and solid N-Ar mixtures using continuous wave techniques show that the quadrupole-bearing molecules in these mixtures have a broad distribution of local order parameters at low temperatures. These parameters consist of two kinds: (i) quadrupolar, referring to the deviation from spherical symmetry of the average molecular alignments; and (ii) orientational, referring only to the orientation of the average alignment of the molecular axes. Ortho-para H mixtures for ortho concentration less than 55% and N-Ar mixtures for % form quadrupolar glasses with both the quadrupolar and orientational parameters broadly distributed. Solid N-Ar mixtures for % form orientational glasses for which the local quadrupolar parameters are constant (but not necessarily zero), and only the orientational axes vary. The equivalent of the Edwards–Anderson order parameter, , shows a rapid variation with temperature (stronger than non-collective para-orientational models would predict), but with no sharp transition for studies down to the lowest temperatures (35 mK for solid ortho-para H mixtures and 1.5 K for solid N-Ar mixtures).
The dynamics associated with the freezing of the molecular orientational and quadrupolar fluctuations in the quadrupolar glass states has been determined using pulsed NMR techniques, either using standard pulse sequences or stimulated echo sequences. The latter is particularly useful for providing information about the very slow dynamics in the glass states. If the relaxation is interpreted in terms of a characteristic fluctuation time (which does give a good description of the data), increases rapidly with decreasing temperature below a temperature characteristic of a given ortho-H or N concentration. In addition, the unique logarithmic decay of the stimulated echos provides a measure of the density of energy states near . This density of states can be used to calculate the heat capacity as a function of temperature. Good agreement is found especially for the magnitude of the characteristic linear dependence on temperature for .
Finally, studies of the dielectric susceptibility that depends on the orientational parameters for the molecules have been made at very low audio frequencies, and the experiments show unmistakable hystereses on thermal cycling. Pilla and colleagues [57] have been able to show that this is consistent with the replica symmetry breaking models of Parisi [13], and these results put these disordered quadrupolar molecular solids in the same class as other frustrated systems that exhibit spin-glass-like behavior at low temperatures. Further studies of the dynamics for very low quadrupolar concentrations in solid N-Ar mixtures as one varies the concentration through the lattice percolation concentration would provide a valuable test of the underlying physics since the belief is that it is the frustration of the short-range interactions that lie at the origin of the formation of these glass states.
8. Conclusions
NMR studies of the line shapes of solid ortho-para-H and solid N-Ar mixtures showed that at low temperatures the quadrupole bearing molecules (ortho-H and N) were characterized by a broad range of local order parameters. This characterization lead to the interpretation of the low temperature behavior in terms of a quadrupolar glass analogous to a spin glass. The transition to the glass state as a function of temeprature was, however, smooth with no sudden phase transition. The temperature evolution of the Edwards-Anderson order parameter was nevertheless much stronger than that predicted for non-collective effects. Measurements of the nuclear spin relaxation times provided more insight into the local dynamics and implied a rapid freezing of the dynamical degrees of freedom. A deeper understanding of the underlying physics was provided by analysis of the decay of stimulated NMR echoes designed to explore ultra-slow motions that characterize the thermal behavior of spin glass materials as the system is governed by the crossing of energy barriers in a complex configuration landscape. This analysis provided an unambiguous measure of the density of low energy excitations and lead to a quantitative fit for the results of heat capacity measurements. Finally, the temperature of the quadrupolar susceptibility deduced from measurements of the dielectric susceptibility revealed hysteresis effects that are consistent with the replica symmetry breaking models of generalized spin glass theories.
Acknowledgments
This research has been supported by the National Science Foundation’s Division of Materials Science through DMR-1303599 and DMR-1157490).
Author Contributions
N.S., J.H., S.P. and E.G. conceived of and designed the experiments. J.H., S.P. and E.G. performed the experiments.; N.S, J.H., K.M., S.P. and E.G. analyzed the data. N.S. and J. H. wrote the paper.
Conflicts of Interest
The authors declare no conflict of interest. The founding sponsors had no role in the design of the study; in the collection, analyses or interpretation of data; in the writing of the manuscript; nor in the decision to publish the results.
References
- Pohl, R.O.; Salinger, G.L. The anomalous thermal properties of glasses at low temperatures. Ann. N. Y. Acad. Sci. 1976, 279, 150–172. [Google Scholar] [CrossRef]
- Anderson, P.W.; Halperin, B.I.; Varma, C.M. Anomalous low-temperature thermal properties of glasses and spin glasses. Philos. Mag. 1972, 25, 1–9. [Google Scholar] [CrossRef]
- Phillips, J.C. Stretched exponential relaxation in molecular and electronic glasses. Rep. Prog. Phys. 1996, 59, 1133. [Google Scholar] [CrossRef]
- Kokshenev, B.B.; Borges, P.D.; Sullivan, N.S. Moderately and strongly supercooled liquids: A temperature-derivative study of the primary relaxaton time scale. J. Chem. Phys. 2005, 122, 114510. [Google Scholar] [CrossRef] [PubMed]
- Mézard, M.; Parisi, G.; Virasoro, M.A. SK Model: The Replica Solution without Replicas. EPL (Europhys. Lett.) 1986, 1, 77. [Google Scholar] [CrossRef]
- Binder, K.; Kolb, W. Glassy Materials and Disordered Solids; An Introduction to Their Statistical Mechanics; World Scientific Publishing: Singapore, 2005. [Google Scholar]
- Cannella, V.; Mydosh, J.A. Magnetic Ordering in Gold-Iron Alloys. Phys. Rev. B 1972, 6, 4220–4237. [Google Scholar] [CrossRef]
- Rivier, N.; Adkins, K. Resistivity of spin glasses. J. Phys. F Met. Phys. 1975, 5, 1745. [Google Scholar] [CrossRef]
- Edwards, S.F.; Anderson, P.W. Theory of spin glasses. II. J. Phys. F Met. Phys. 1976, 6, 1927. [Google Scholar] [CrossRef]
- Sherrington, D. A transparent theory of the spin glass. J. Phys. C Solid State Phys. 1975, 8, L208. [Google Scholar] [CrossRef]
- Murani, A.P. High-Temperature Spin Dynamics of Cu-Mn Spin-Glasses. Phys. Rev. Lett. 1978, 41, 1406–1409. [Google Scholar] [CrossRef]
- Binder, K.; Young, A.P. Spin glasses: Experimental facts, theoretical concepts, and open questions. Rev. Mod. Phys. 1986, 58, 801–976. [Google Scholar] [CrossRef]
- Parisi, G. Testing replica predictions in experiments. Il Nuovo Cimento D 1998, 20, 1221–1228. [Google Scholar] [CrossRef]
- Mézard, M.; Parisi, G.; Sourlas, N.; Toulouse, G.; Virasoro, M. Nature of the Spin-Glass Phase. Phys. Rev. Lett. 1984, 52, 1156–1159. [Google Scholar] [CrossRef]
- Holdsworth, P.C.W.; Gingras, M.J.P.; Bergersen, B.; Chan, E.P. Random bonds and random fields in two-dimensional orientational glasses. J. Phys. Condens. Matter 1991, 3, 6679. [Google Scholar] [CrossRef]
- Dzyaloshinsk, I.; Volovik, G. On the concept of local invariance in the theory of spin glasses. J. Phys. 1978, 39, 693–700. [Google Scholar] [CrossRef]
- Chowdhury, D. Spin Glasses and Other Frustrated Systems; Princeton University Press: Princeton, NJ, USA, 1987. [Google Scholar]
- Cugliandolo, L.F.; Kurchan, J. Analytical solution of the off-equilibrium dynamics of a long-range spin-glass model. Phys. Rev. Lett. 1993, 71, 173–176. [Google Scholar] [CrossRef] [PubMed]
- Cugliandolo, L.F.; Kurchan, J. Mean-field theory of temperature cycling experiments in spin glasses. Phys. Rev. B 1999, 60, 922–930. [Google Scholar] [CrossRef]
- Parisi, G. Spin glasses and fragile glasses: Statics, dynamics and complexity. Proc. Nat. Acad. Sci. USA 2006, 103, 7948–7955. [Google Scholar] [CrossRef] [PubMed]
- Sullivan, N.S.; Devoret, M.; Cowan, B.P.; Urbina, C. Evidence for quadrupolar glass phases in solid hydrogen at reduced ortho concentrations. Phys. Rev. B 1978, 17, 5016–5024. [Google Scholar] [CrossRef]
- Treusch, J. (Ed.) Theory of spin glasses: A brief review. In Festkörperprobleme 17; Plenary Lectures of the Divisions “Semiconductor Physics” “Metal Physics” “Low Temperature Physics” “Thermodynamics and Statistical Physics” “Crystallography” “Magnetism” “Surface Physics” of the German Physical Society Münster, 7–12 March 1977; Springer: Berlin/Heidelberg, Germany, 1977; pp. 55–84. [Google Scholar]
- Pilla, S.; Hamida, J.A.; Muttalib, K.A.; Sullivan, N.S. Generalized fluctuation-dissipation and thermal hysteresis of dielectric susceptibility in frustrated molecular orientational glasses. J. Phys. Conf. Ser. 2009, 50, 042192. [Google Scholar] [CrossRef]
- Sullivan, N.S.; Hamida, J.A.; Pilla, S.; Muttalib, K.A.; Genio, E. Molecular glasses: NMR and dielectric susceptibility measurements. J. Struct. Chem. 2016, 57, 301–307. [Google Scholar] [CrossRef]
- Ishimoto, H.; Nagamine, K.; Kimura, Y.; Kumagai, H. New Anomalous Phenomena in NMR Absorption and Spin Lattice Relaxation of Solid Hydrogen. J. Phys. Soc. Jpn. 1976, 40, 312–318. [Google Scholar] [CrossRef]
- Cochran, W.T.; Gaines, J.R.; McCall, R.P.; Sokol, P.E.; Patton, B.R. Study of the Quadrupolar-Glass Region in Solid D2 via Proton Magnetic Resonance. Phys. Rev. Lett. 1980, 45, 1576–1580. [Google Scholar] [CrossRef]
- Edwards, C.M.; Zhou, D.; Lin, Y.; Sullivan, N.S. Local ordering in dilute ortho-para-hydrogen mixtures at low temperatures. J. Low Temp. Phys. 1988, 72, 1–24. [Google Scholar] [CrossRef]
- Hamida, J.A.; Sullivan, N.S.; Evans, M.D. Orientational Ordering of Frustrated Molecular Quadrupoles: NMR Studies of N2-Ar Solid Mixtures. Phys. Rev. Lett. 1994, 73, 2720–2723. [Google Scholar] [CrossRef] [PubMed]
- Ward, L.G.; Saleh, A.M.; Haase, D.G. Specific heat of solid nitrogen-argon mixtures: 50 to 100 mol N2. Phys. Rev. B 1983, 27, 1832–1838. [Google Scholar] [CrossRef]
- Silvera, I.F. The solid molecular hydrogens in the condensed phase: Fundamentals and static properties. Rev. Mod. Phys. 1980, 52, 393–452. [Google Scholar] [CrossRef]
- Sullivan, N.S. Orientational order-disorder transitions in solid hydrogen. Can. J. Chem. 1988, 66, 908–914. [Google Scholar] [CrossRef]
- Hamida, J.A.; Genio, E.B.; Sullivan, N.S. NMR studies of the orientational ordering in dilute solid N2-Ar mixtures. J. Low Temp. Phys. 1996, 103, 49–70. [Google Scholar] [CrossRef]
- Scott, T.A. Solid and Liquid Nitrogen. Phys. Rep. 1976, 27, 89–157. [Google Scholar] [CrossRef]
- Ishol, L.; Scott, T. Anisotropy of the chemical shift tensor for solid nitrogen. J. Magn. Reson. (1969) 1977, 27, 23–28. [Google Scholar] [CrossRef]
- Barrett, C.S.; Meyer, L. Argon—Nitrogen Phase Diagram. J. Chem. Phys. 1965, 42, 107–112. [Google Scholar] [CrossRef]
- Sullivan, N.S. Orientational ordering in solid hydrogen. J. Phys. Fr. 1976, 37, 981–989. [Google Scholar] [CrossRef]
- Estève, D.; Sullivan, N.S.; Devoret, M. Orientational ordering in a dilute system of classical interacting quadrupoles : (N2-Ar) solid mixtures. J. Phys. Lett. 1982, 43, 793–799. [Google Scholar]
- Hamida, J.A.; Pilla, S.; Sullivan, N.S. The Orientational Ordering in Dilute Solid N2–Ar Mixtures. J. Low Temp. Phys. 1998, 111, 365–370. [Google Scholar] [CrossRef]
- Lin, Y.; Sullivan, N. Long-time relaxation behavior in orientational glasses. J. Mag. Reson. (1969) 1990, 86, 319–337. [Google Scholar] [CrossRef]
- Edwards, S.F.; Anderson, P.W. Theory of spin glasses. J. Phys. F Met. Phys. 1975, 5, 965. [Google Scholar] [CrossRef]
- Sullivan, N.S.; Edwards, C.M.; Brookeman, J.R. Orientational Ordering in Solid N2-Argon Mixtures: Collective Versus Non-Collective Behavior. Mol. Cryst. Liq. Cryst. 1986, 139, 365–375. [Google Scholar] [CrossRef]
- Kokshenev, V.B. On the quadrupole galss phase in solid hydrogen. Solid State Commun. 1982, 44, 1593–1595. [Google Scholar] [CrossRef]
- Kokshenev, V. On the theory of quadrupole glass. Model Hamiltonian of the classical analogue of ortho-para mixtures of hydrogen. Solid State Commun. 1985, 55, 143–146. [Google Scholar] [CrossRef]
- Kokshenev, V.B. Microscopic approach to the quadrupolar-glass problem. Phys. Rev. B 1996, 53, 2191–2194. [Google Scholar] [CrossRef]
- Lutchinskaia, E.A.; Ryzhov, V.N.; Tareyeva, E.E. Solvable model of a quadrupolar glass. J. Phys. C Solid State Phys. 1984, 17, L665. [Google Scholar] [CrossRef]
- Sullivan, N.S.; Devoret, M.; Estève, D. Correlation functions in the quadrupolar glass phase of solid hydrogen. Phys. Rev. B 1984, 30, 4935–4945. [Google Scholar] [CrossRef]
- Lin, Y.; Sullivan, N.S. Spectral inhomogeneity of nuclear spin-lattice relaxation in orientationally ordered solid hydrogen. J. Low Temp. Phys. 1986, 65, 1–11. [Google Scholar] [CrossRef]
- Sullivan, N.S.; Esteve, D. Critical slowing-down in spin glasses: Quadrupoalr glass phase of solid H2. Physica 1981, 107B, 189–190. [Google Scholar] [CrossRef]
- Sullivan, N.; Esteve, D.; Devoret, M. NMR Pulse Studies of Molecular Solids, 15N2 and H2; II. Stimulated Echoes and Slow Rotational Motions. J. Phys. C (Solid State) 1982, 15, 4895–4911. [Google Scholar] [CrossRef]
- Yu, I.; Washburn, S.; Calkins, M.; Meyer, H. Pulsed NMR studies in solid H2. II. Stimulated echoes and cross relaxation times. J. Low Temp. Phys. 1983, 51, 401–422. [Google Scholar] [CrossRef]
- Ricketson, B.W.A. Specific Heats and Entropies at Low Temperatures. unpublished Thesis, Oxford University, Clarendon, Oxford, UK, 1956. [Google Scholar]
- Jarvis, J.F.; Meyer, H.; Ramm, D. Measurement of ()V and Related Properties in Solidified Gases. II. Solid H2. Phys. Rev. 1969, 178, 1461–1471. [Google Scholar] [CrossRef]
- Haase, D.G.; Saleh, A. Measurement of (dP/dT)v in solid hydrogen. Physica B+C 1981, 107, 191–192. [Google Scholar] [CrossRef]
- Haase, D.G.; Perrell, L.R.; Saleh, A.M. Specific heat, pressure, and the Grüneisen relation in solid hydrogen. J. Low Temp. Phys. 1984, 55, 283–296. [Google Scholar] [CrossRef]
- Fisher, D.S.; Huse, D.A. Ordered Phase of Short-Range Ising Spin-Glasses. Phys. Rev. Lett. 1986, 56, 1601–1604. [Google Scholar] [CrossRef] [PubMed]
- Fisher, D.S.; Huse, D.A. Nonequilibrium dynamics of spin glasses. Phys. Rev. B 1988, 38, 373–385. [Google Scholar] [CrossRef]
- Pilla, S.; Hamida, J.A.; Mutalib, K.A.; Sullivan, N.S. Molecular solid glasses: New insights into frustrated systems. New J. Phys. 2001, 3, 17–30. [Google Scholar] [CrossRef]
- Pilla, S.; Hamida, J.; Muttalib, K.; Sullivan, N. Frustration-induced glass behavior in solid N2? Audio frequency dielectric measurements. Physica B 2000, 284–288, 1125–1126. [Google Scholar] [CrossRef]
- Pilla, S.; Hamida, J.A.; Sullivan, N.S. Very high sensitivity capacitance bridge for dielectric studies at low temperatures. Rev. Sci. Instrum. 1999, 70, 4055–4058. [Google Scholar] [CrossRef]
- Mydosh, J.A. Disordered magnetism and spin glasses. J. Magn. Magn. Mater. 1996, 157–158, 606–610. [Google Scholar] [CrossRef]
Figure 1.
Comparison of orientational glass with quadrupolar glasses. Reproduced with permission from [32]. Copyright Springer Nature, 1996. (a) Orientational glass; (b) quadrupolar glass.
Figure 1.
Comparison of orientational glass with quadrupolar glasses. Reproduced with permission from [32]. Copyright Springer Nature, 1996. (a) Orientational glass; (b) quadrupolar glass.

Figure 2.
Observed variation of the nuclear spin-lattice relaxation times of solid ortho-para hydrogen mixtures showing the sharp change in the temperature dependence attributed to the onset of quadrupolar glass formation. Figure 3b also shows the variation of the echo amplitudes S, indicating changes in the static order parameters below 0.55 K. In contrast to the variation of , S evolves smoothly with temperature. (a) Temperature dependence of relaxation times for 50% ortho H in solid ortho-para H mixtures. Reproduced with permission from Figure 6 of Ishimoto et al. [25]. (b) Temperature dependence of relaxation times for 33% (diamonds), 40% (pluses) and 50% (crosses) ortho H. Reproduced with permission from [26]. Copyright American Physical Society, 1980.

Figure 3.
Phase diagrams for orientational and quadrupolar ordering in solid ortho-para H mixtures [21,25,26] and solid N-Ar mixtures [28,37]. (a) Phase diagram of solid ortho-para H mixtures. Reproduced with permission from Figure 1 of Sullivan [31]. Copyright Canadian Science Publishing, 1998; (b) Phase diagram of solid N-Ar mixtures. Reproduced with permission from Figure 1 of Hamida et al. [38]. Copyright Springer Nature, 1998.

Figure 4.
Nuclear Zeeman energy levels for one ortho-H molecule calculated for total molecular nuclear spin I = 1 and angular momentum J = 1. Each molecule contributes a doublet with absorption frequency .
Figure 4.
Nuclear Zeeman energy levels for one ortho-H molecule calculated for total molecular nuclear spin I = 1 and angular momentum J = 1. Each molecule contributes a doublet with absorption frequency .

Figure 5.
Calculated Pake doublet line shape for the long-range ordered Pa3 structure of solid H for a fixed value of the order parameter and a distribution of angles for the the axes of a powdered sample.
Figure 5.
Calculated Pake doublet line shape for the long-range ordered Pa3 structure of solid H for a fixed value of the order parameter and a distribution of angles for the the axes of a powdered sample.

Figure 6.
Calculated NMR line shape for quadrupolar glass state of solid H for a broad distribution of order parameters . Reproduced with permission from [27]. Copyright Springer Nature, 1998.
Figure 6.
Calculated NMR line shape for quadrupolar glass state of solid H for a broad distribution of order parameters . Reproduced with permission from [27]. Copyright Springer Nature, 1998.
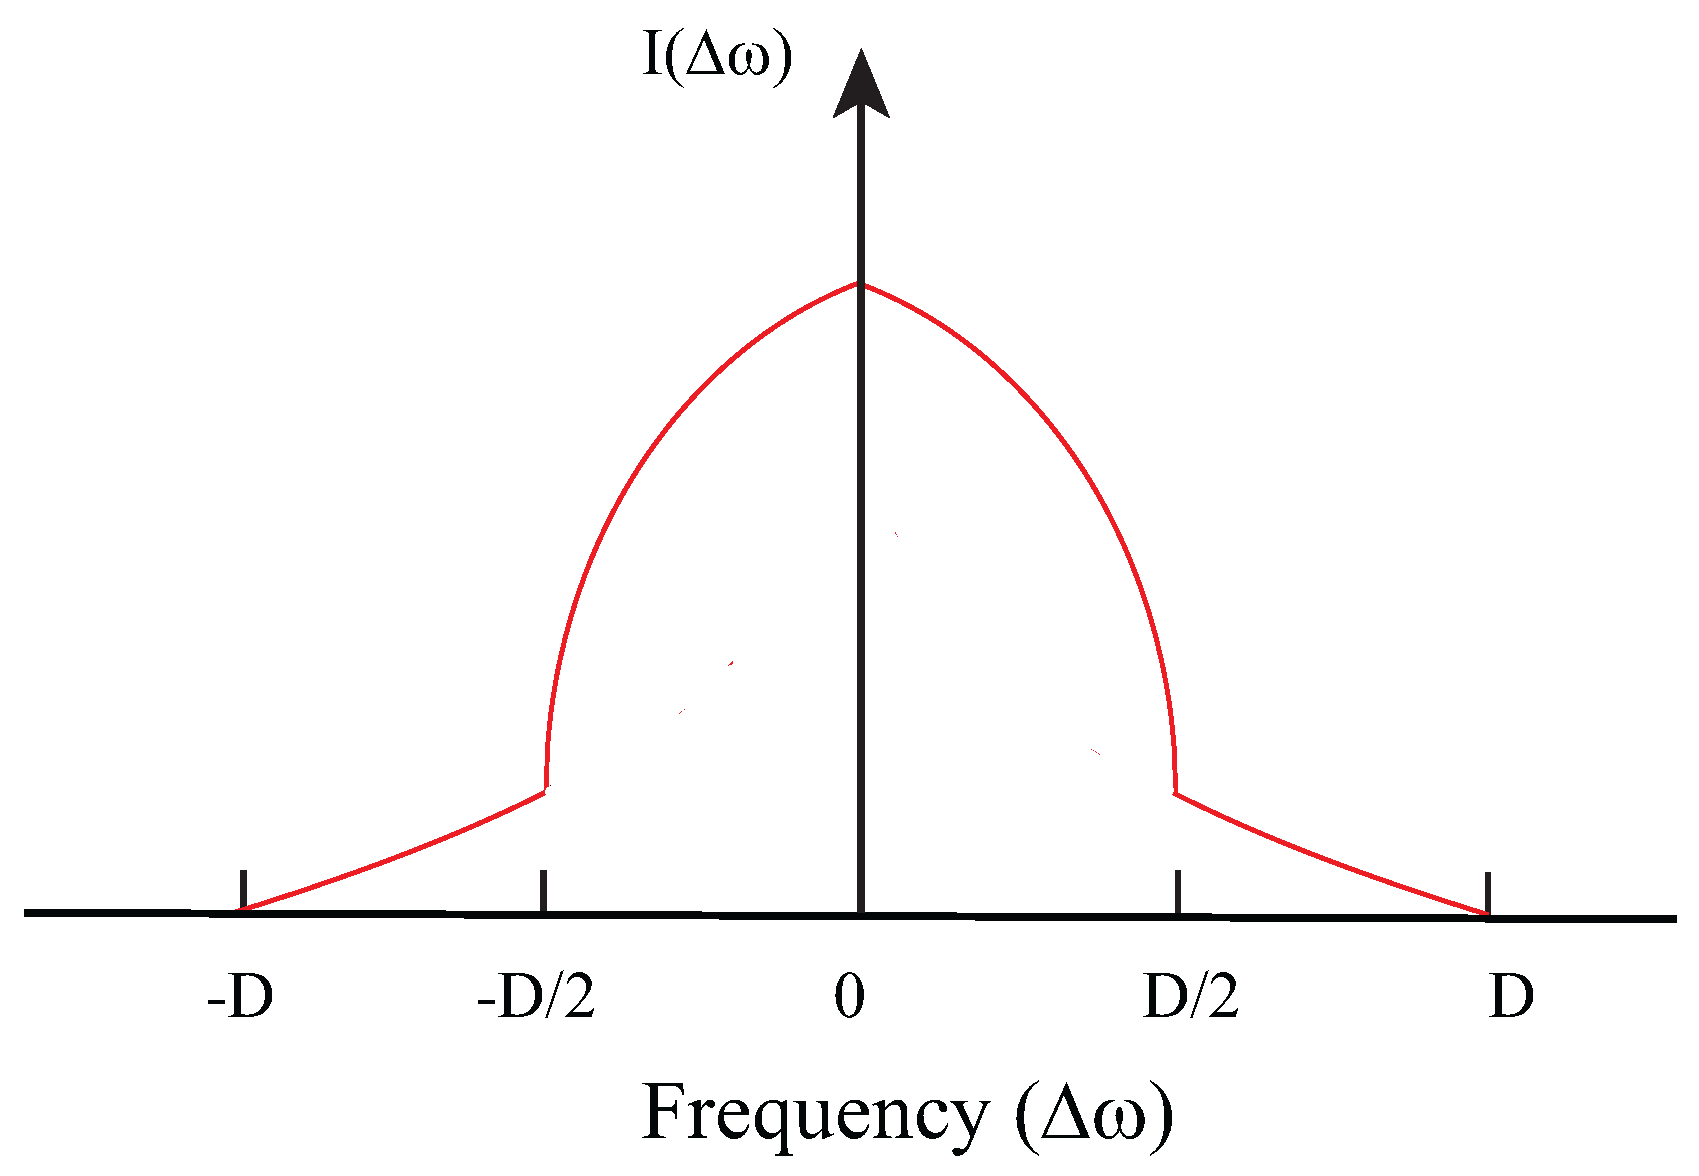
Figure 7.
Observed NMR line shape for the quadrupolar glass state of solid H for ortho-H concentration at a temperature of 85 mK. The experiments measured the derivative line shape using traditional lock-in methods, and the symmetrical dome shaped line is obtained by integration. Interestingly, a very small narrow peak is observed at the center that is the contribution from molecules with zero order parameter. Reproduced with permission from [21]. Copyright American Physical Society, 1978.

Figure 8.
Observed NMR line shape for quadrupolar glass state of solid H for ortho-H concentration at a temperature of 45 mK in a magnetic field of 5 T, showing asymmetry due to a finite nuclear spin polarization. Reproduced with permission from [27]. Copyright Springer Nature, 1998.
Figure 8.
Observed NMR line shape for quadrupolar glass state of solid H for ortho-H concentration at a temperature of 45 mK in a magnetic field of 5 T, showing asymmetry due to a finite nuclear spin polarization. Reproduced with permission from [27]. Copyright Springer Nature, 1998.
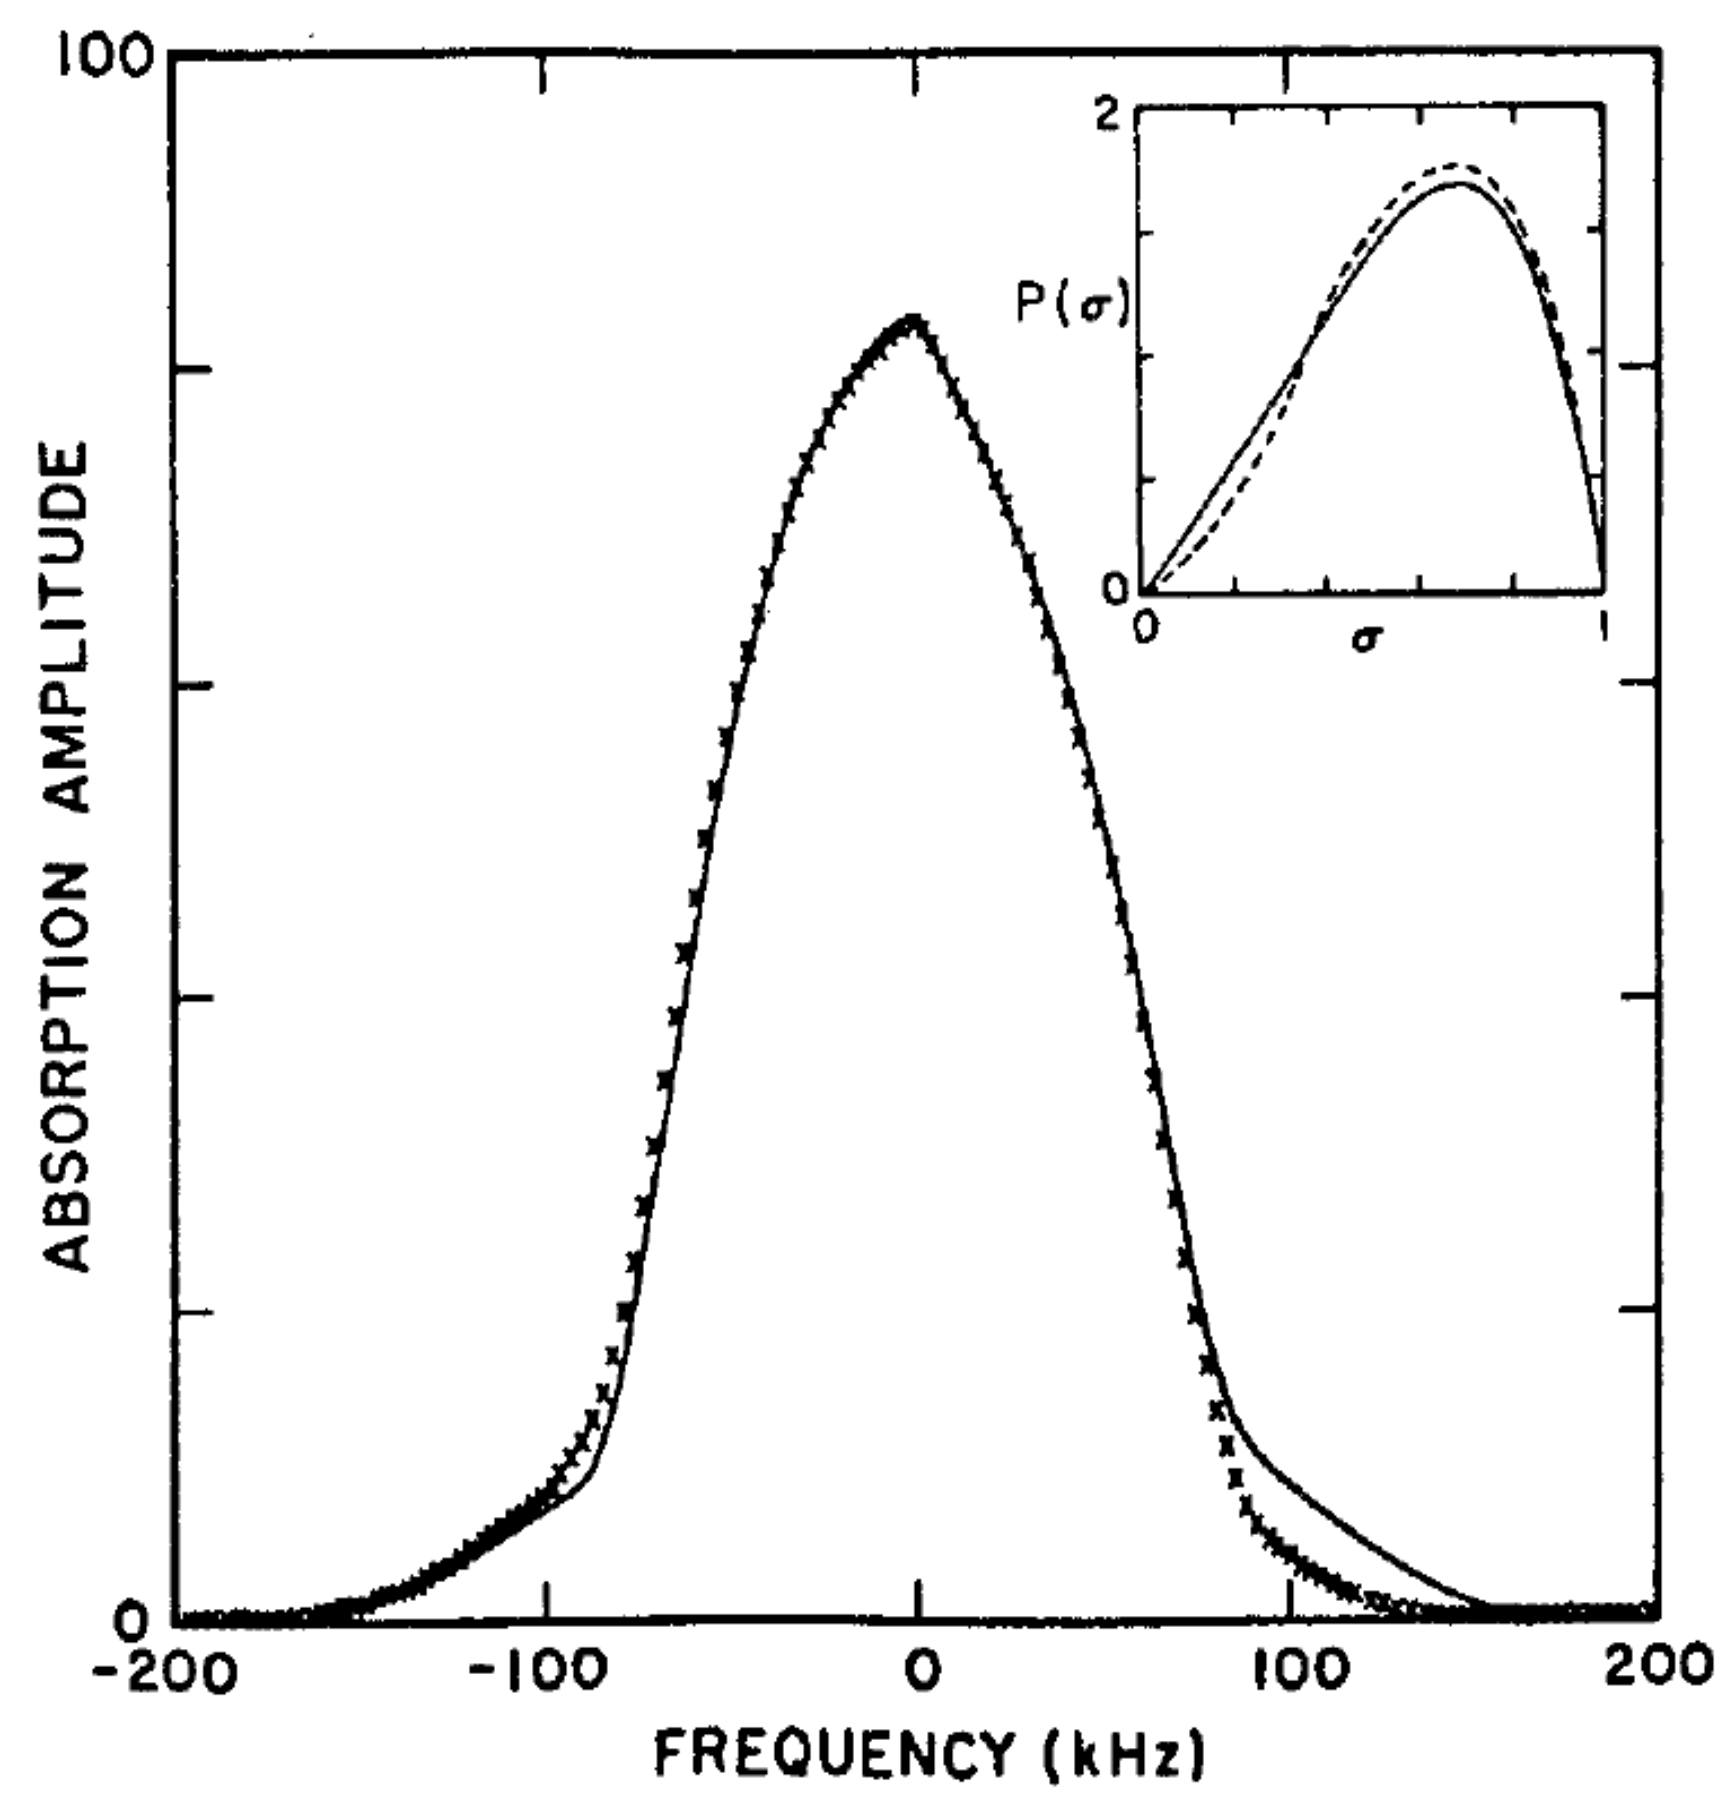
Figure 9.
Temperature dependence of the probability distribution for order parameters as deduced from observed NMR line shapes for solid hydrogen with ortho-H concentrations of 23%. Reproduced with permission from [27]. Copyright Springer Nature, 1998.
Figure 9.
Temperature dependence of the probability distribution for order parameters as deduced from observed NMR line shapes for solid hydrogen with ortho-H concentrations of 23%. Reproduced with permission from [27]. Copyright Springer Nature, 1998.
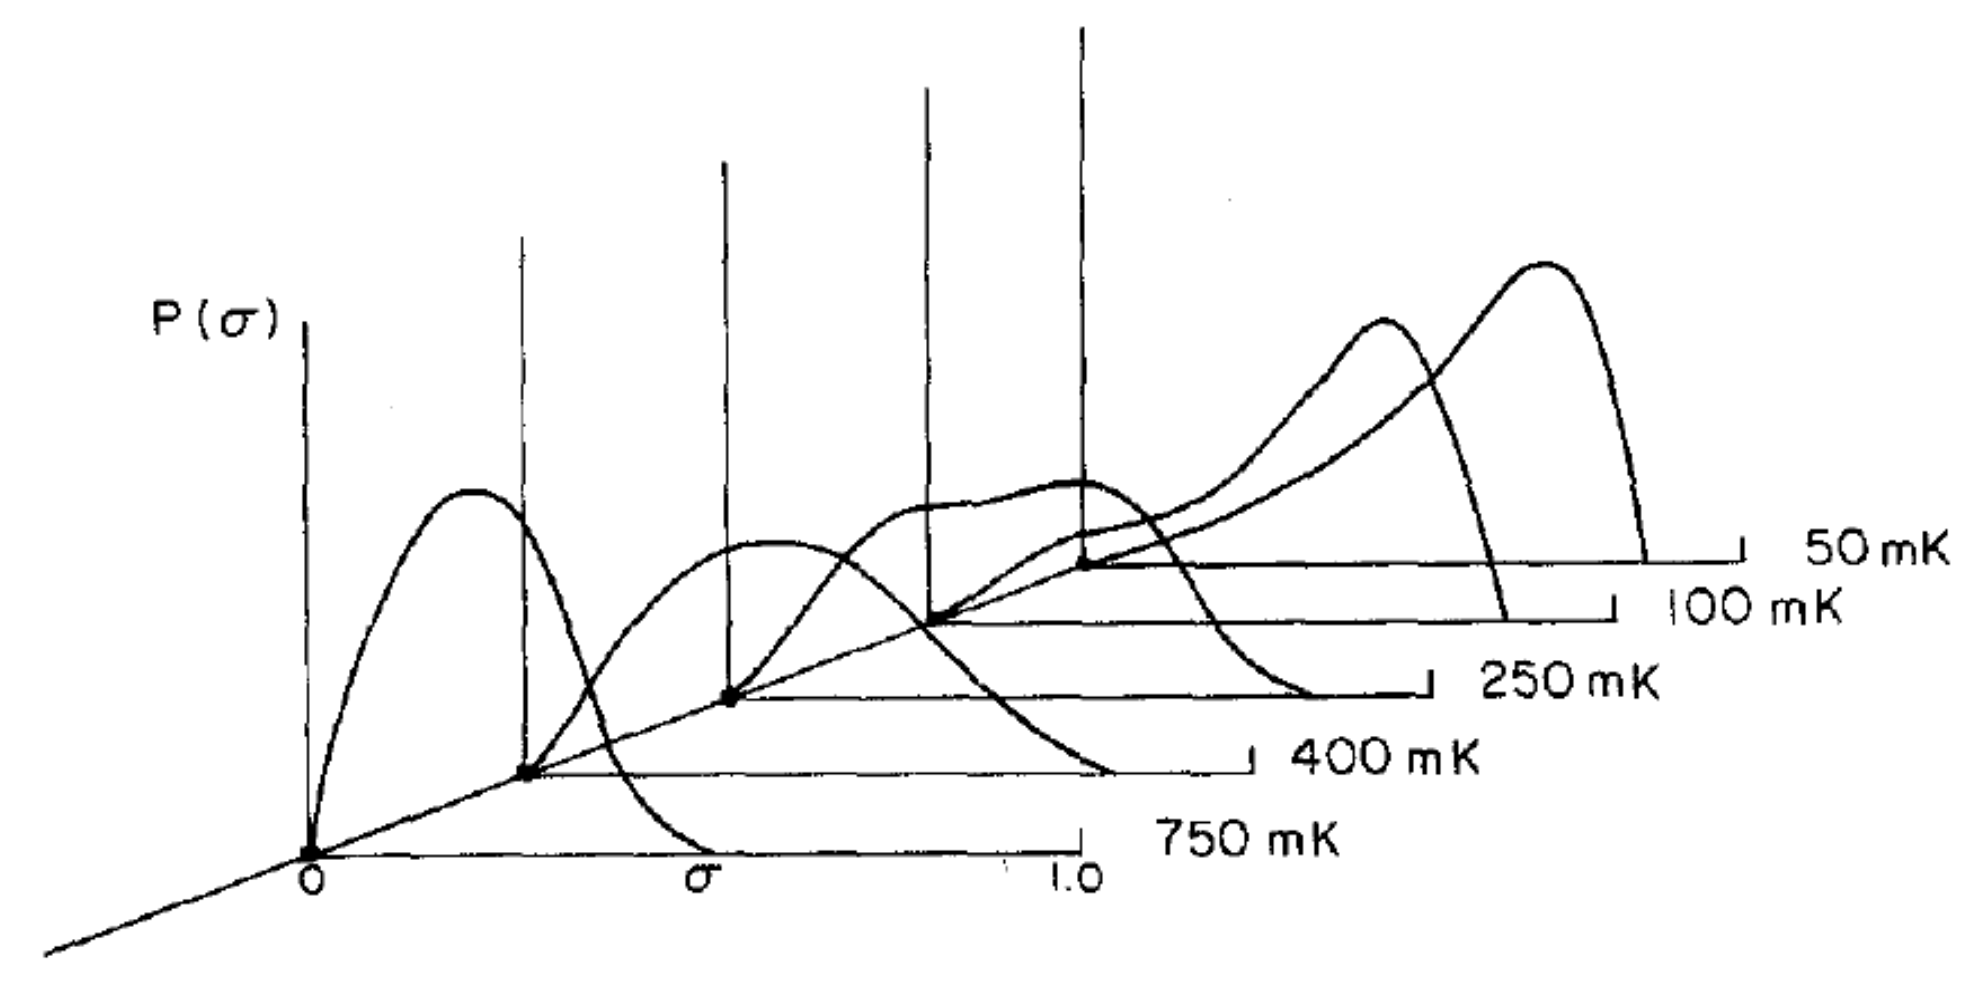
Figure 10.
Temperature dependence of the quadrupolar glass order parameter . Reproduced with permission from [41]. Copyright Taylor & Francis, 1986.
Figure 10.
Temperature dependence of the quadrupolar glass order parameter . Reproduced with permission from [41]. Copyright Taylor & Francis, 1986.
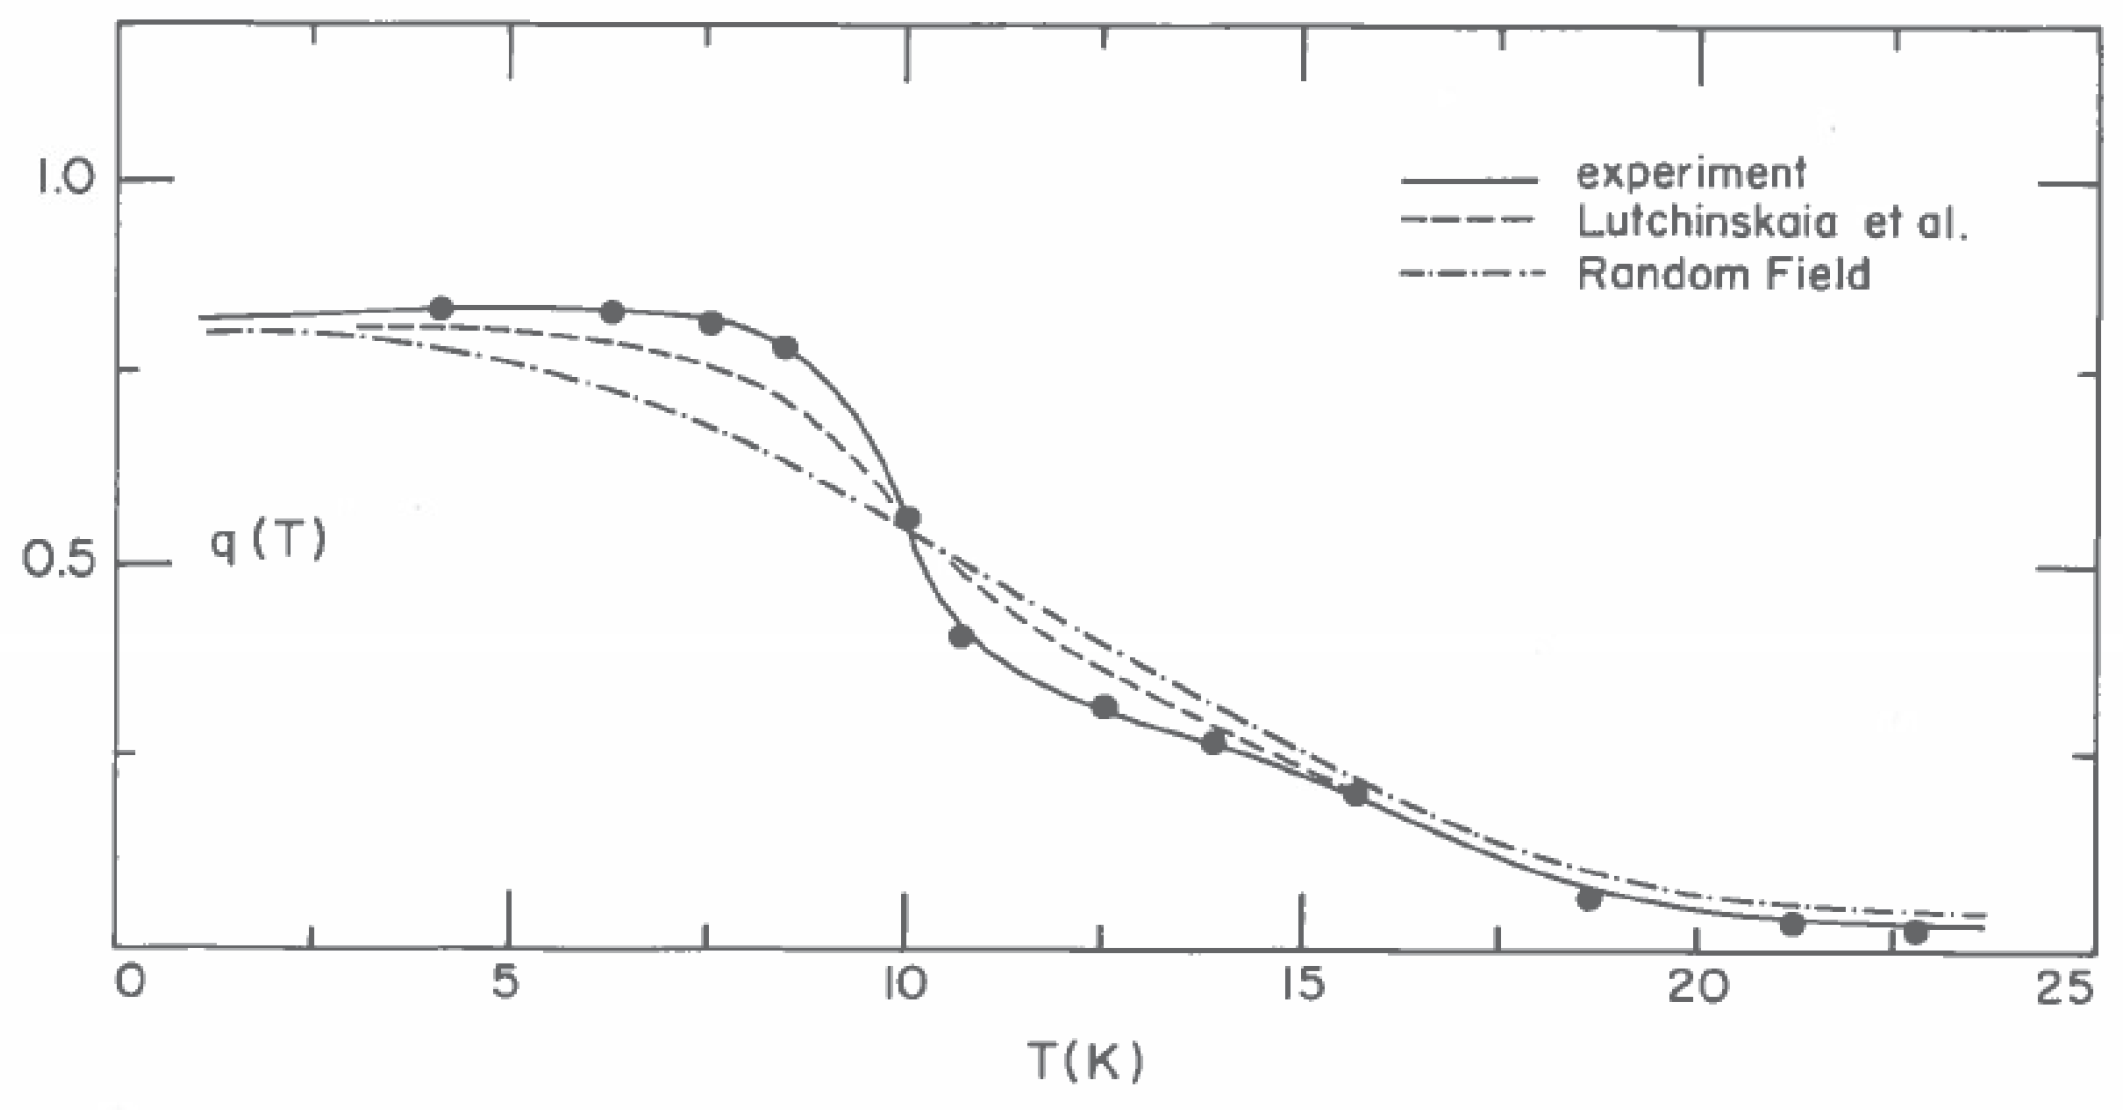
Figure 11.
Calculated NMR absorption line shape for long-range Pa3 ordering for pure solid N. The line consists of two asymmetric Pake doublets.
Figure 11.
Calculated NMR absorption line shape for long-range Pa3 ordering for pure solid N. The line consists of two asymmetric Pake doublets.

Figure 12.
Comparison of observed NMR absorption line shape at 4.2 K with the calculated NMR absorption line shape for long-range Pa3 ordering for pure solid N. The inset shows the order parameter distribution that was used. Reproduced with permission from [38]. Copyright Springer Nature, 1998.
Figure 12.
Comparison of observed NMR absorption line shape at 4.2 K with the calculated NMR absorption line shape for long-range Pa3 ordering for pure solid N. The inset shows the order parameter distribution that was used. Reproduced with permission from [38]. Copyright Springer Nature, 1998.

Figure 13.
Variation of observed low temperature NMR line shapes with nitrogen concentration in solid N-Ar mixtures, showing inferred distributions of order parameters . Reproduced with permission from [38]. Copyright Springer Nature, 1998.
Figure 13.
Variation of observed low temperature NMR line shapes with nitrogen concentration in solid N-Ar mixtures, showing inferred distributions of order parameters . Reproduced with permission from [38]. Copyright Springer Nature, 1998.
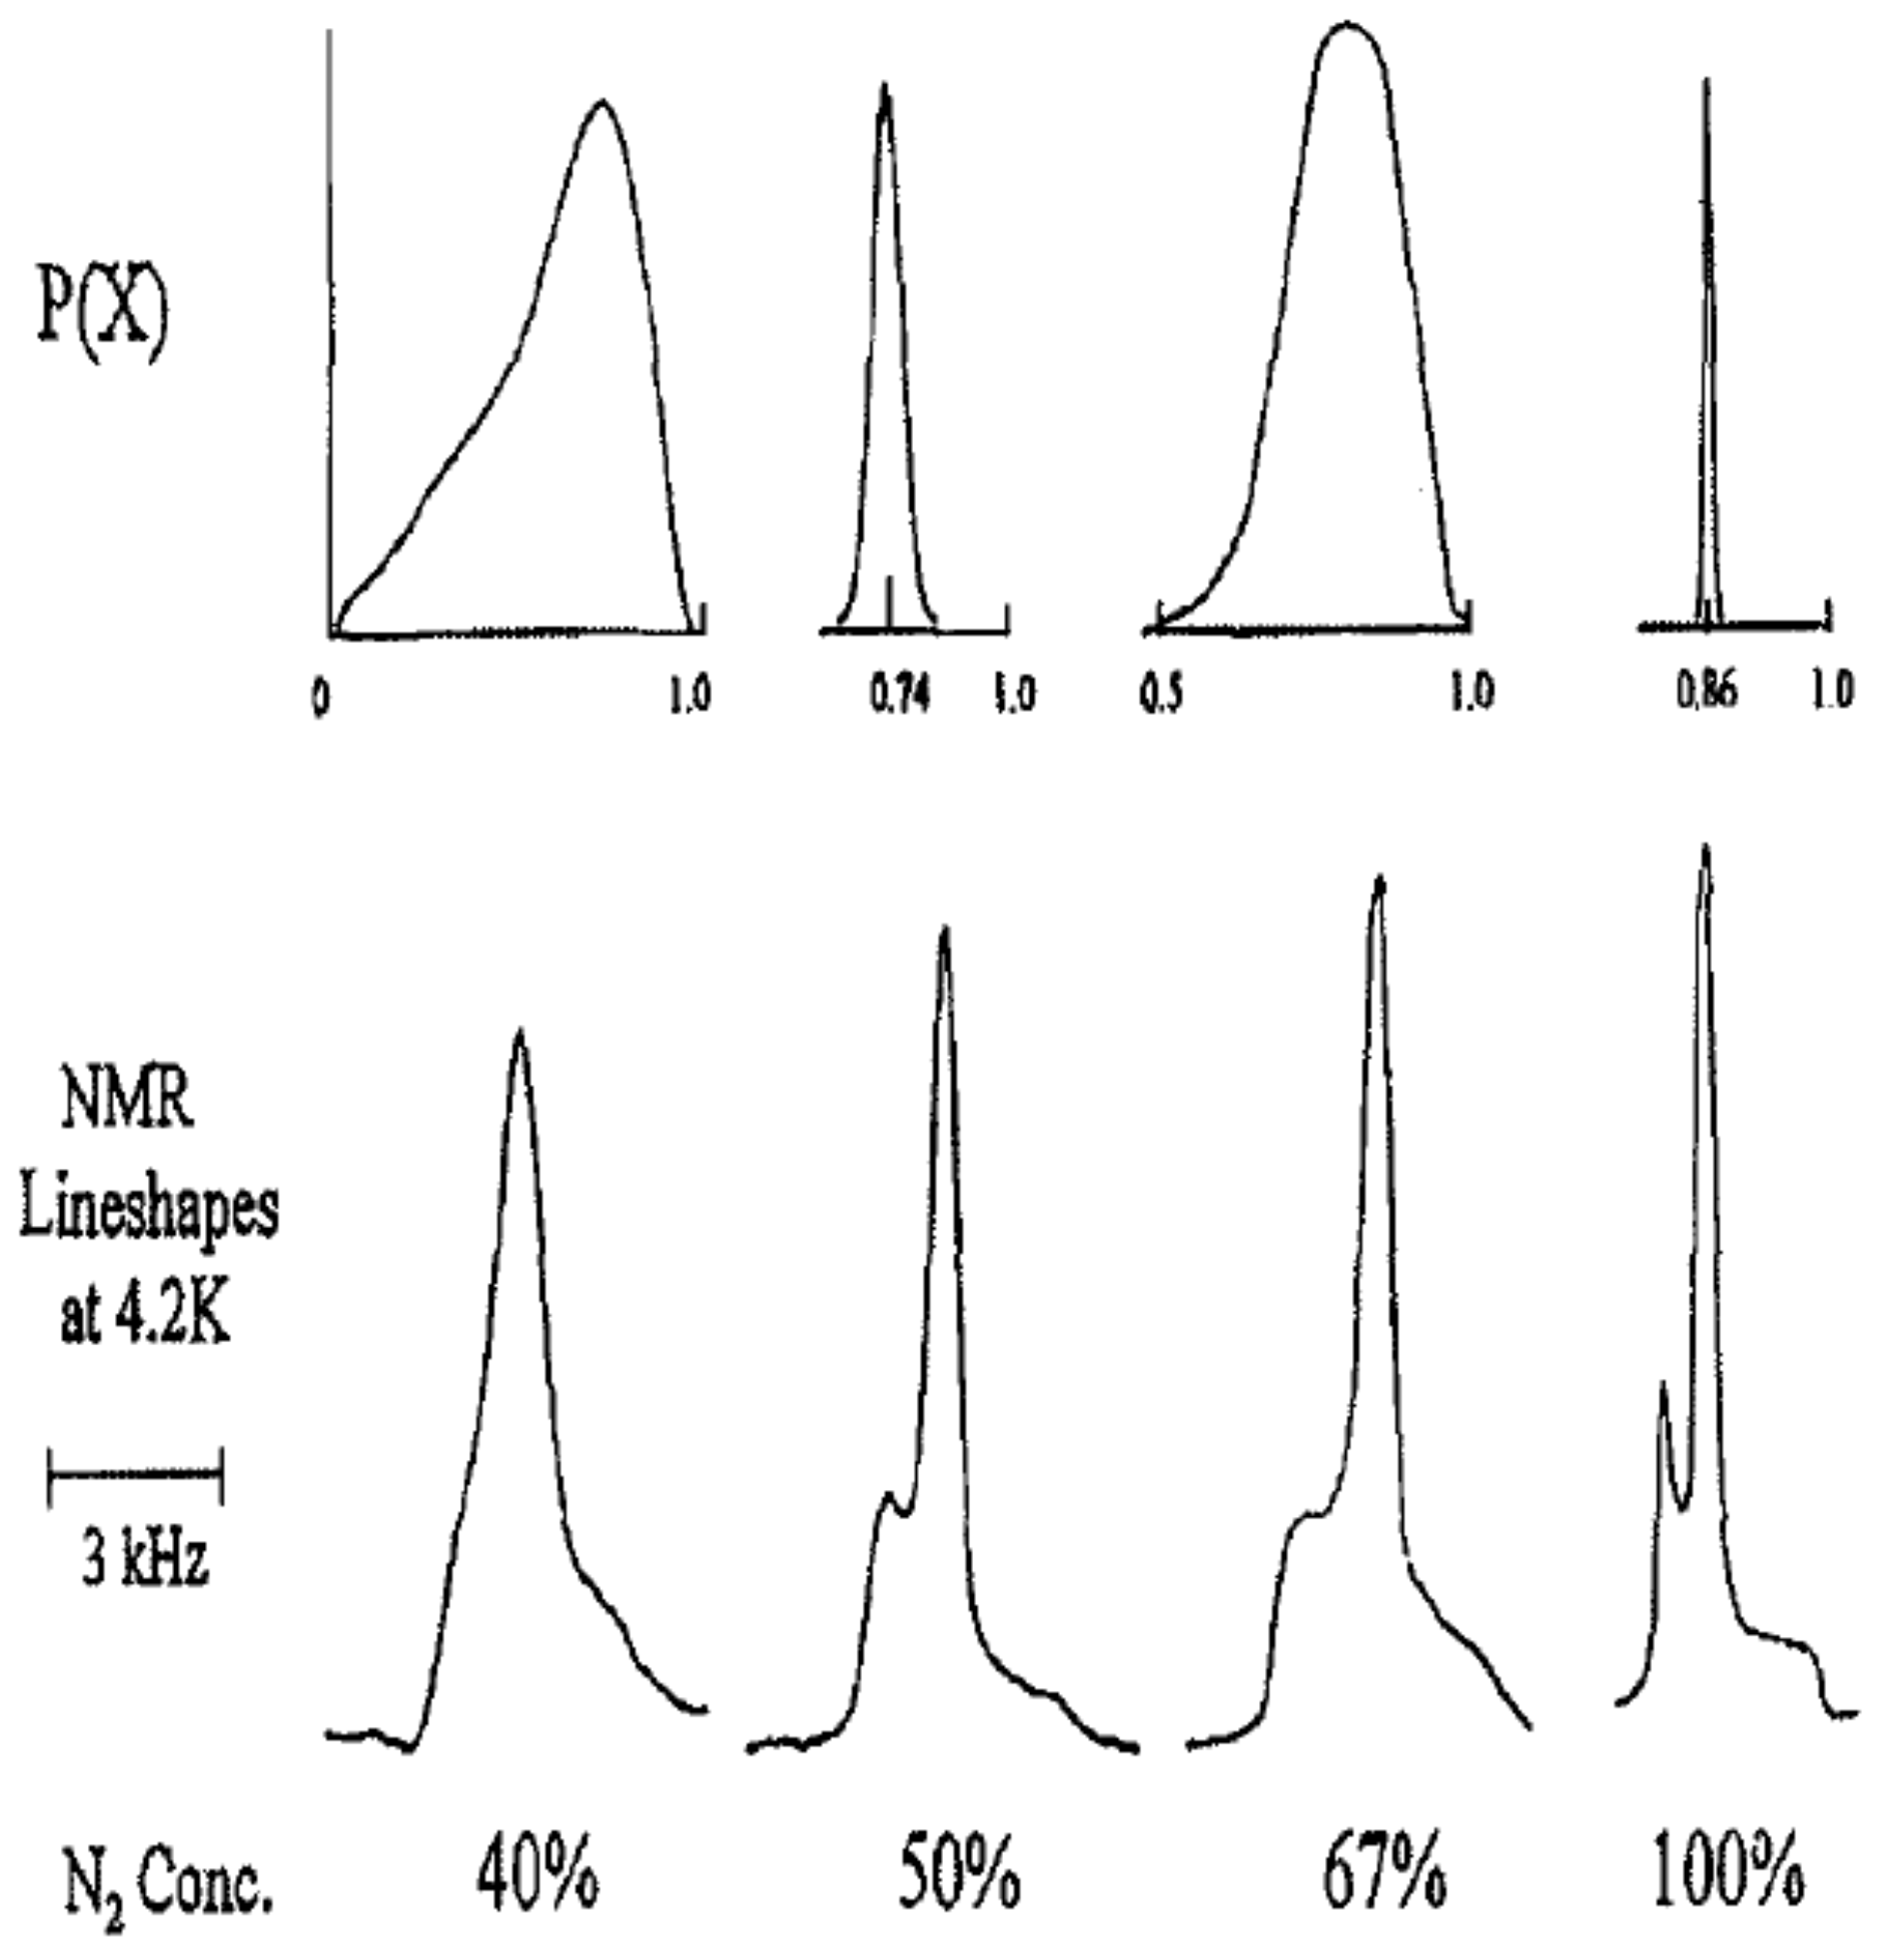
Figure 14.
Temperature dependence of the fluctuation rate in quadrupolar glass. Reproduced with permission from Fig. 1 of Ref. [48]. Copyright Elsevier, 1981.
Figure 14.
Temperature dependence of the fluctuation rate in quadrupolar glass. Reproduced with permission from Fig. 1 of Ref. [48]. Copyright Elsevier, 1981.

Figure 15.
Observed nuclear spin-lattice relaxation in the form of multi-exponentials in the glass state of solid ortho-para hydrogen mixtures. Reproduced with permission from [47]. Copyright Springer Nature, 1986.
Figure 15.
Observed nuclear spin-lattice relaxation in the form of multi-exponentials in the glass state of solid ortho-para hydrogen mixtures. Reproduced with permission from [47]. Copyright Springer Nature, 1986.
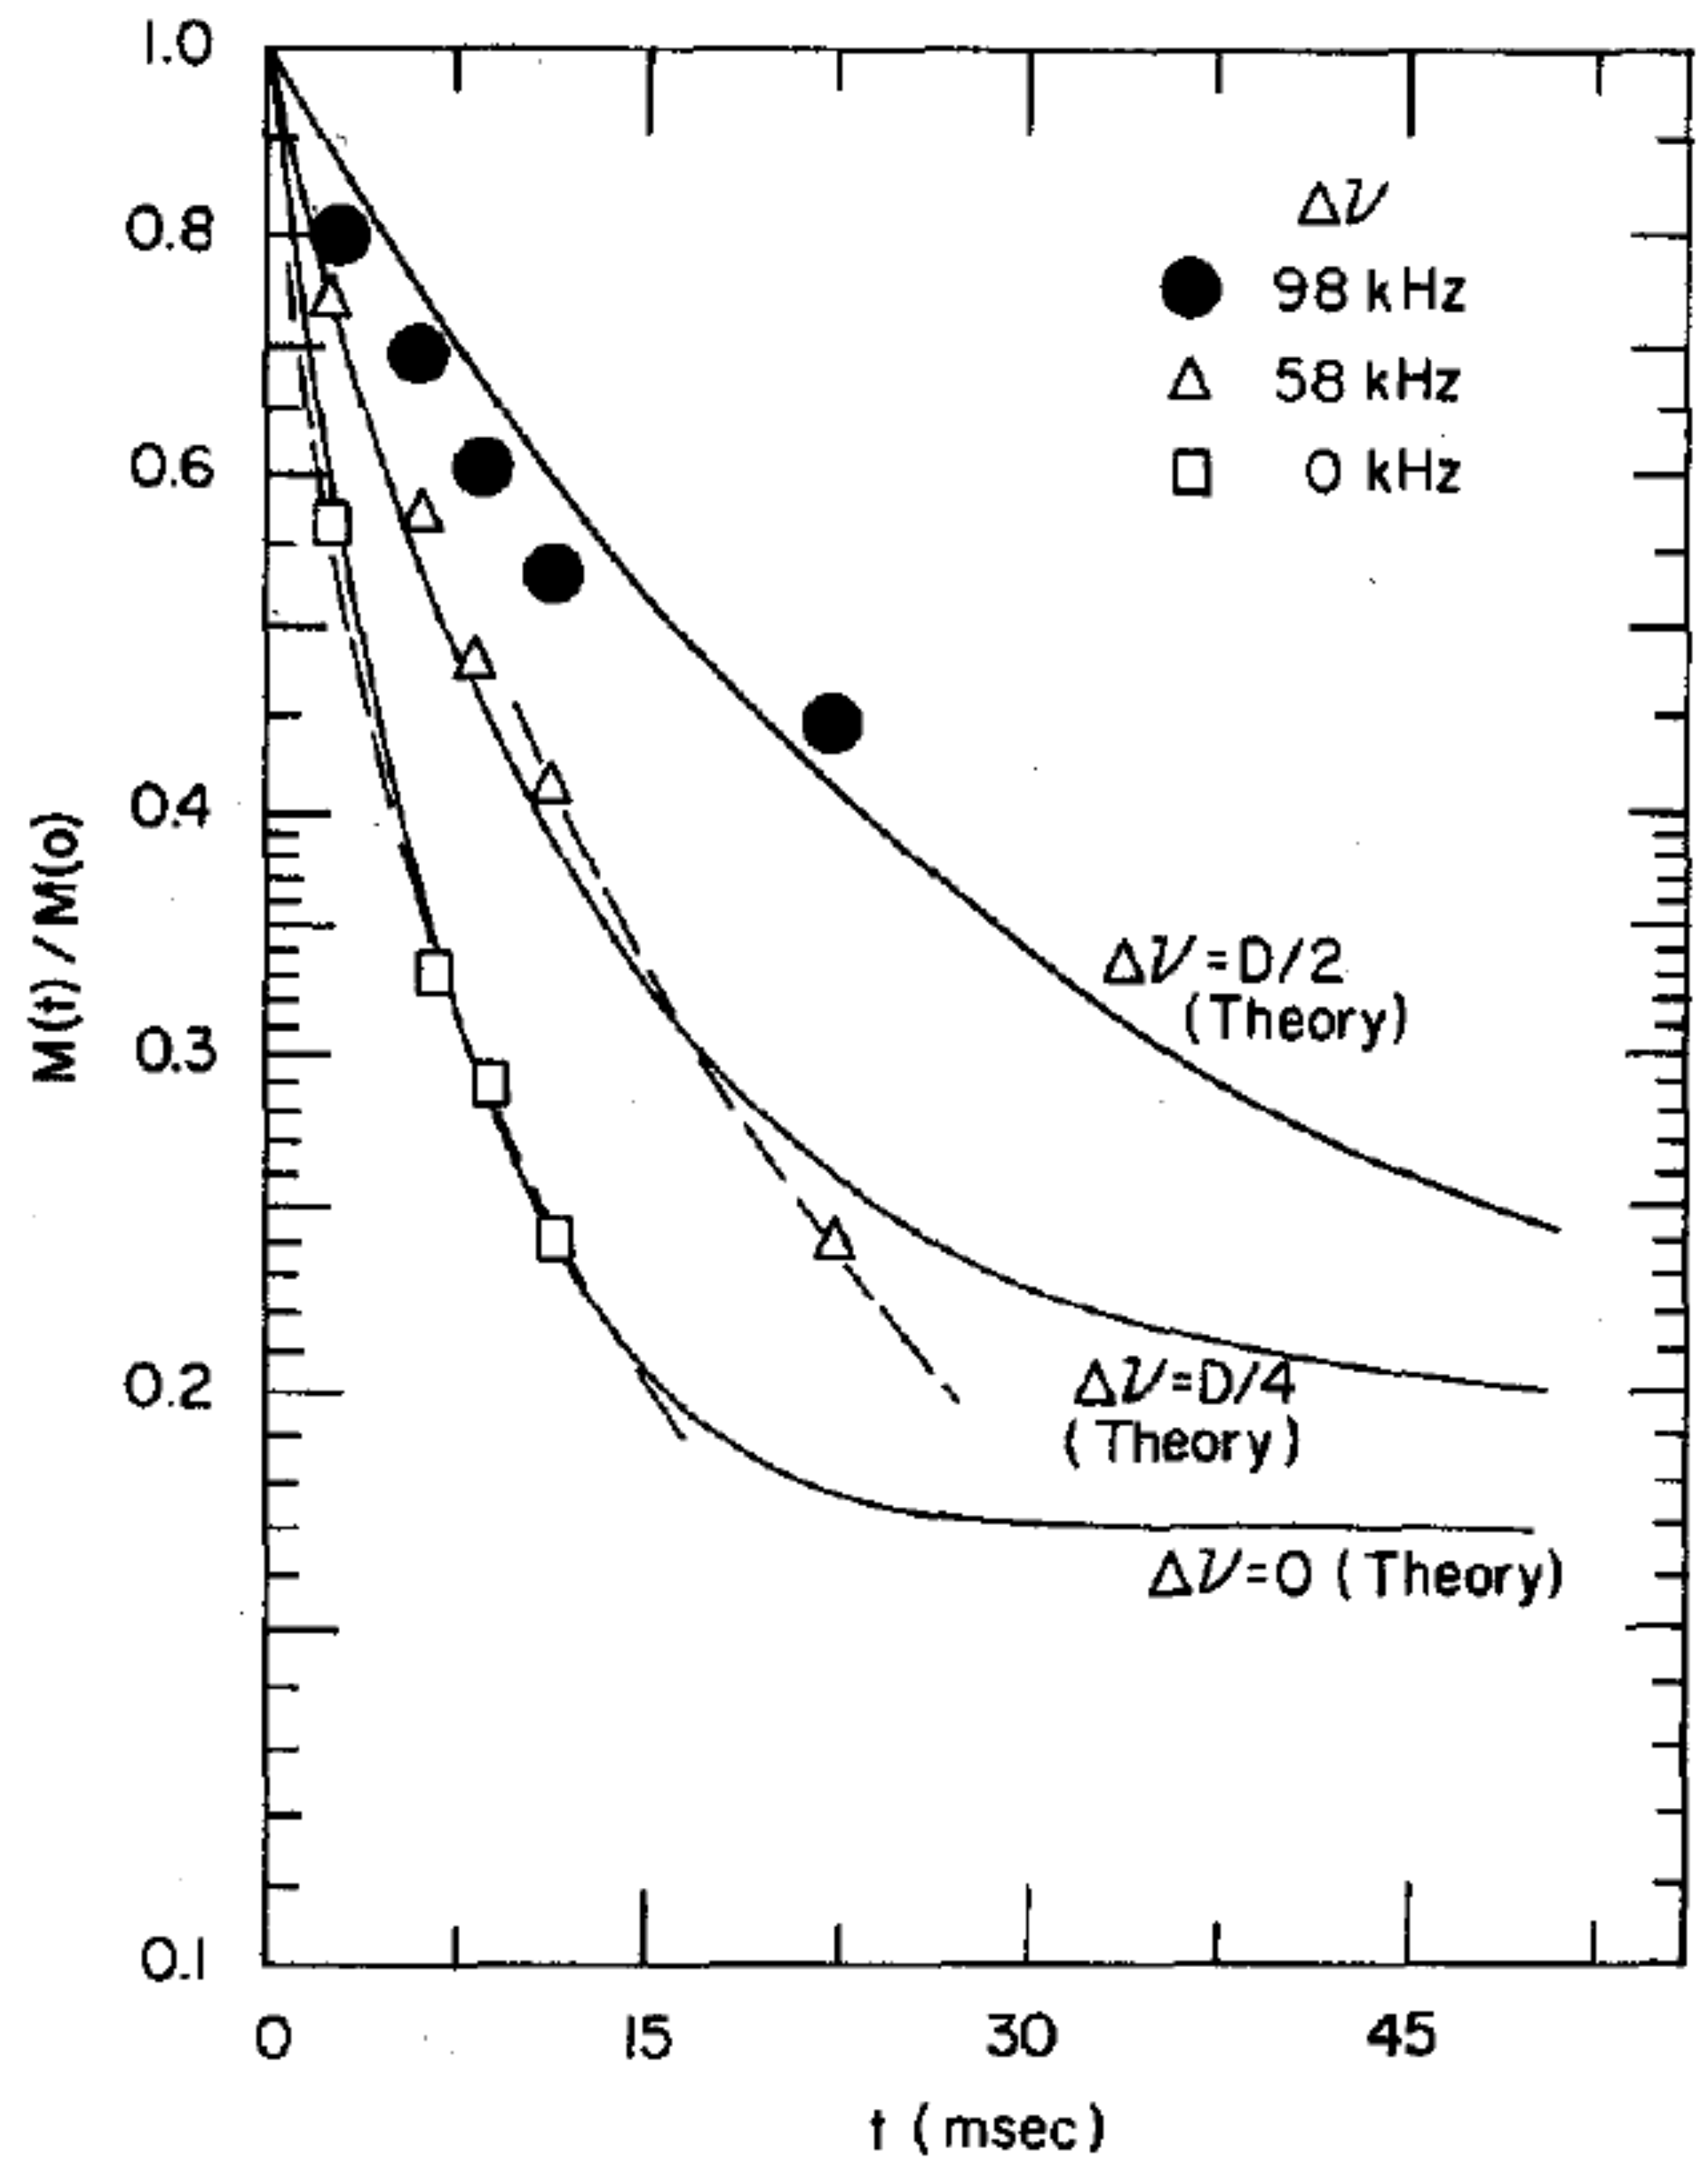
Figure 16.
Variation of the nuclear spin-lattice relaxation with frequency for a glass ordering in solid ortho-para hydrogen mixtures. Reproduced with permission from [47]. Copyright Springer Nature, 1986.
Figure 16.
Variation of the nuclear spin-lattice relaxation with frequency for a glass ordering in solid ortho-para hydrogen mixtures. Reproduced with permission from [47]. Copyright Springer Nature, 1986.

Figure 17.
Decay of NMR stimulated echos for the glass state of ortho-para hydrogen mixtures. Reproduced with permission from [39]. Copyright Elsevier, 1969.
Figure 17.
Decay of NMR stimulated echos for the glass state of ortho-para hydrogen mixtures. Reproduced with permission from [39]. Copyright Elsevier, 1969.
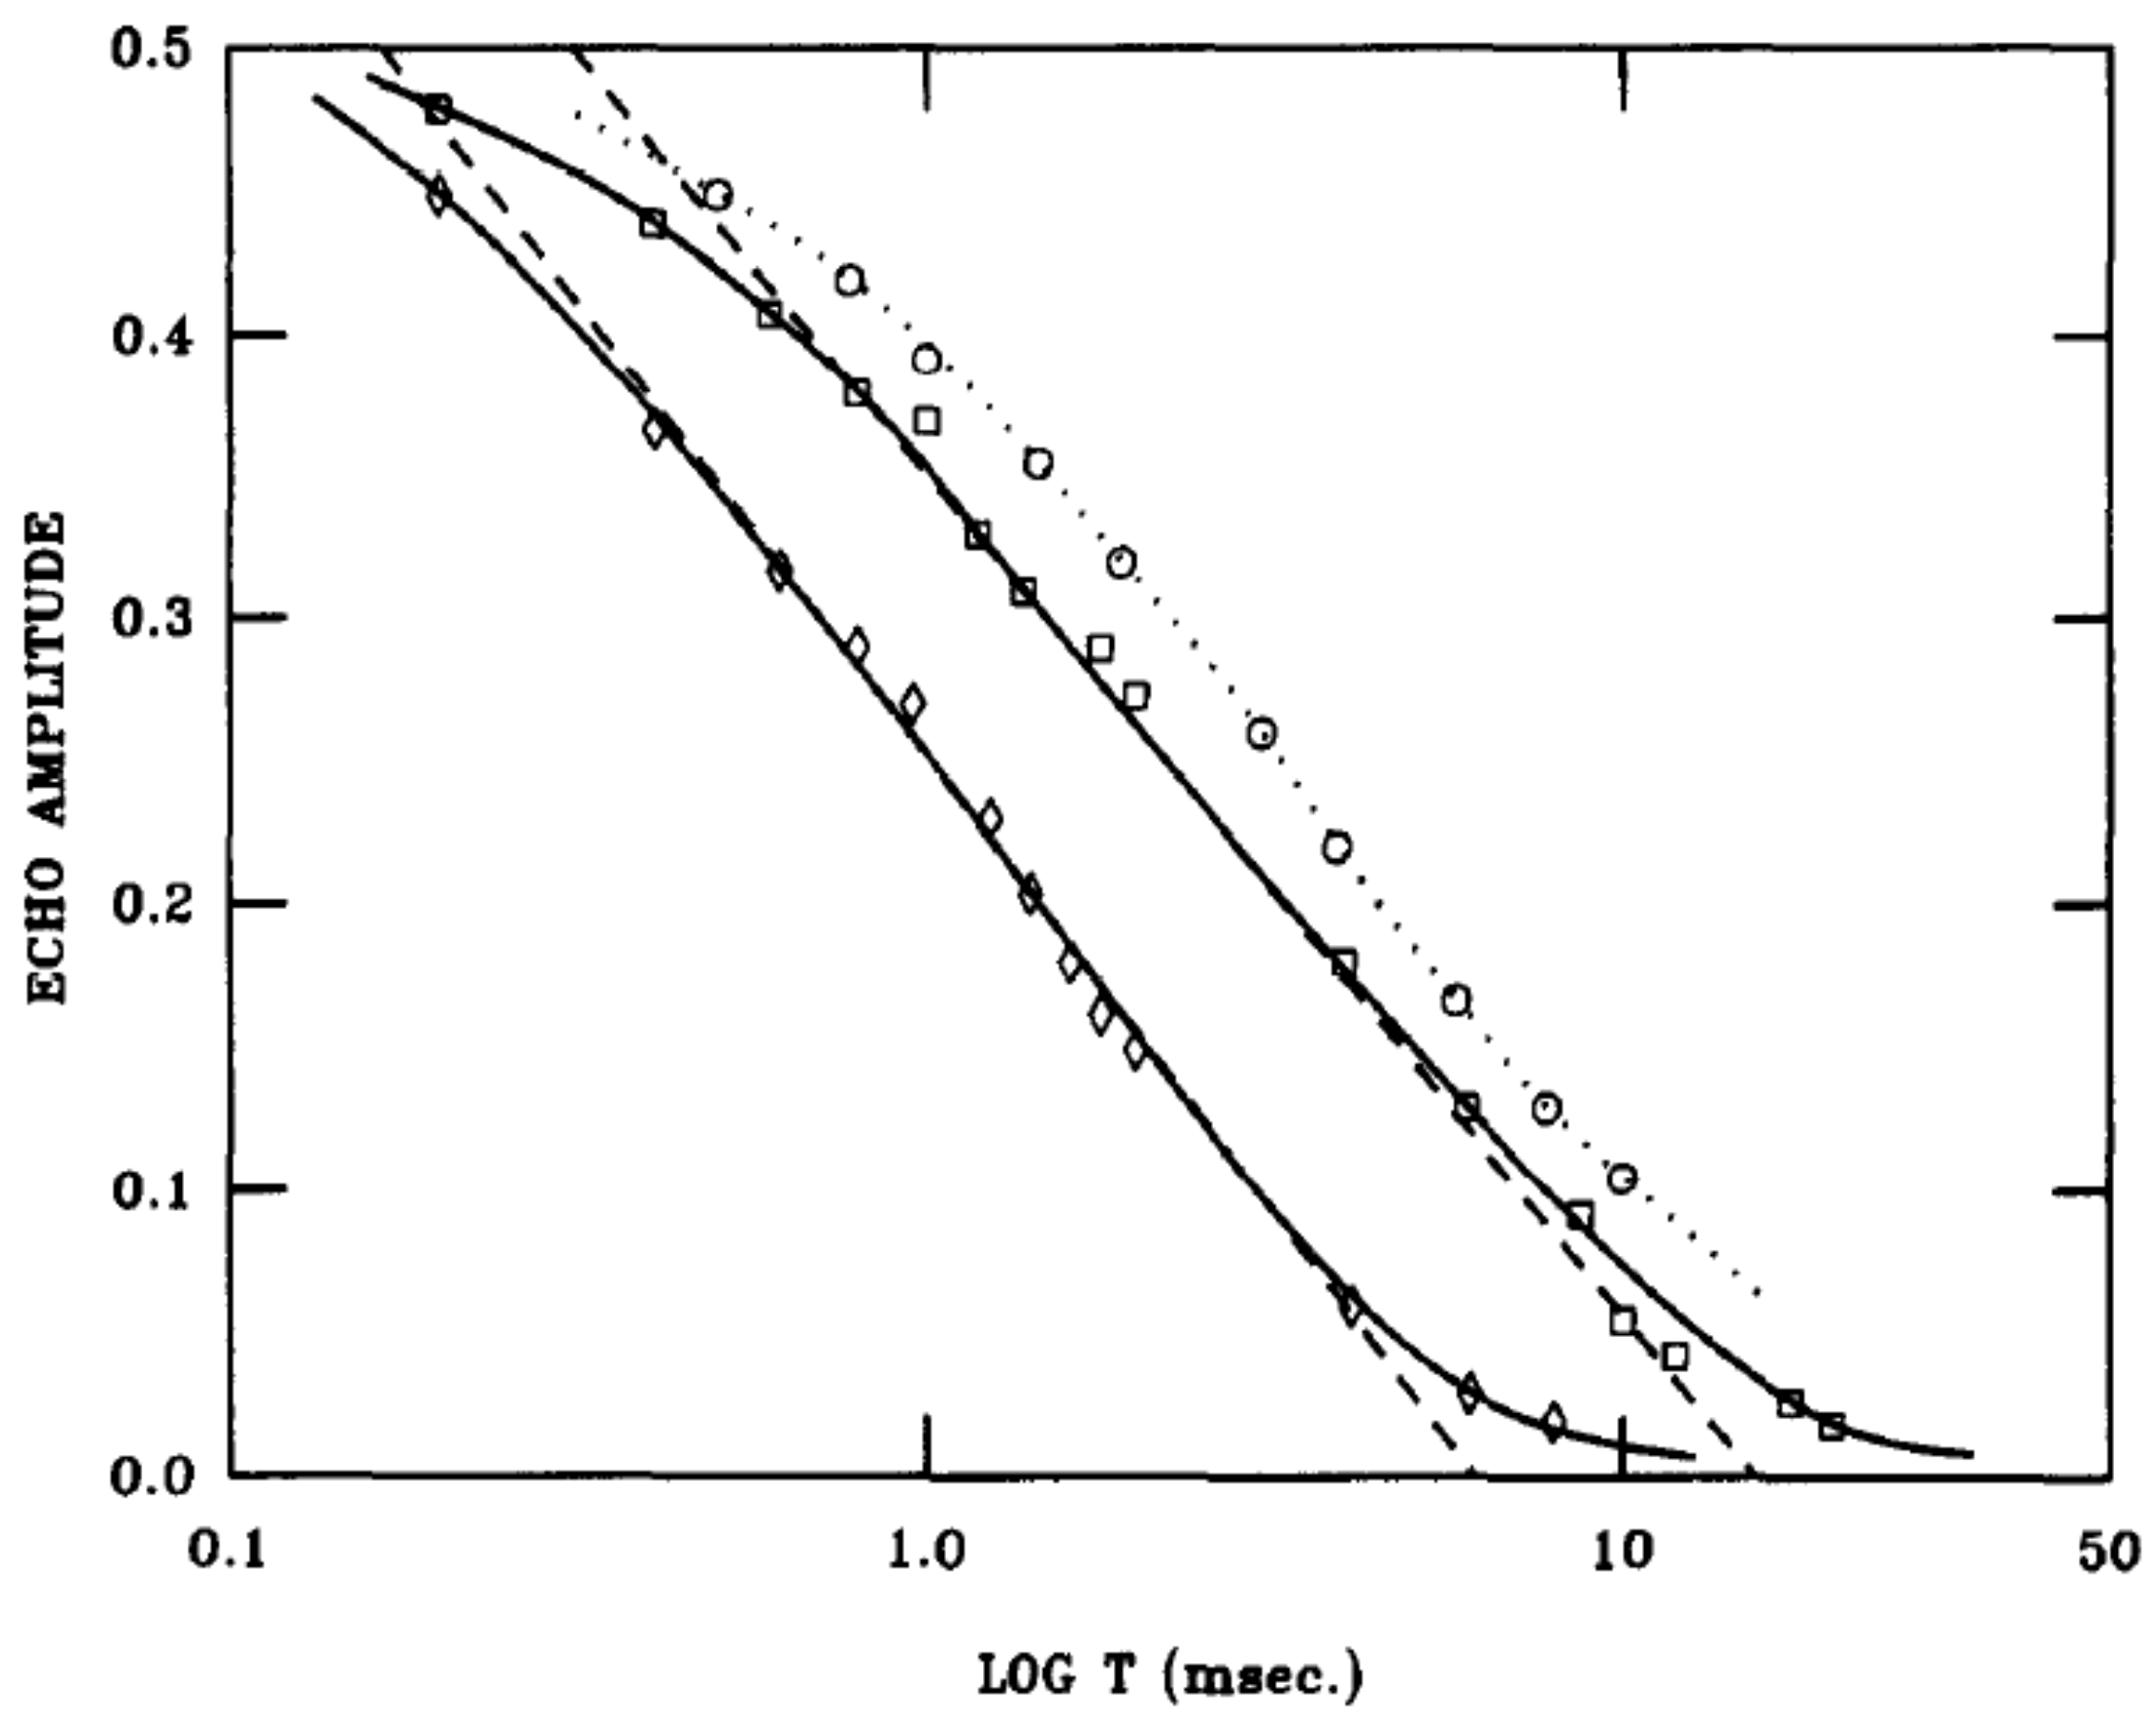
Figure 18.
Sketch of the energy levels of an individual ortho-H molecule with angular momentum with the degenerate states separated from the state by an energy gap . Reproduced with permission from [39]. Copyright Elsevier, 1969.
Figure 18.
Sketch of the energy levels of an individual ortho-H molecule with angular momentum with the degenerate states separated from the state by an energy gap . Reproduced with permission from [39]. Copyright Elsevier, 1969.

Figure 19.
Heat capacity of the glass state of solid ortho-para hydrogen mixtures calculated from density of energy levels . The diamonds represent the data of Ricketson [51] and the squares that of Haase et al. [54]. Reproduced with permission from [39]. Copyright Elsevier, 1969.

Figure 20.
Thermal cycling of dielectric susceptibility measurements of solid N-Ar mixtures by Pilla et al. [57]. Reproduced with permission from [57]. Copyright Institute of Physics, 2001.

Figure 21.
Comparison of the hysteresis observed for the frustrated sold N-Ar mixtures and solid O as a function of the temperature swing of the hysteresis. is the maximum variation of the hysteresis. Reproduced with permission from [23]. Copyright Institute of Physics, 2009.
Figure 21.
Comparison of the hysteresis observed for the frustrated sold N-Ar mixtures and solid O as a function of the temperature swing of the hysteresis. is the maximum variation of the hysteresis. Reproduced with permission from [23]. Copyright Institute of Physics, 2009.
© 2017 by the authors. Licensee MDPI, Basel, Switzerland. This article is an open access article distributed under the terms and conditions of the Creative Commons Attribution (CC BY) license (http://creativecommons.org/licenses/by/4.0/).
Share and Cite
MDPI and ACS Style
Sullivan, N.; Hamida, J.; Muttalib, K.; Pilla, S.; Genio, E. Orientational Glasses: NMR and Electric Susceptibility Studies. Magnetochemistry 2017, 3, 33. https://doi.org/10.3390/magnetochemistry3040033
AMA Style
Sullivan N, Hamida J, Muttalib K, Pilla S, Genio E. Orientational Glasses: NMR and Electric Susceptibility Studies. Magnetochemistry. 2017; 3(4):33. https://doi.org/10.3390/magnetochemistry3040033
Chicago/Turabian StyleSullivan, Neil, Jaha Hamida, Khandker Muttalib, Subrahmanyam Pilla, and Edgar Genio. 2017. "Orientational Glasses: NMR and Electric Susceptibility Studies" Magnetochemistry 3, no. 4: 33. https://doi.org/10.3390/magnetochemistry3040033
Note that from the first issue of 2016, this journal uses article numbers instead of page numbers. See further details here.