Review

Multi-Quanta Spin-Locking Nuclear Magnetic Resonance Relaxation Measurements: An Analysis of the Long-Time Dynamical Properties of Ions and Water Molecules Confined within Dense Clay Sediments

Interfaces, Confinement, Matériaux et Nanostructures (ICMN), UMR 7374, CNRS and Université d’Orléans, 45071 Orléans CEDEX 2, France
*
Authors to whom correspondence should be addressed.
Magnetochemistry 2017, 3(4), 35; https://doi.org/10.3390/magnetochemistry3040035
Submission received: 5 September 2017 / Revised: 27 October 2017 / Accepted: 31 October 2017 / Published: 14 November 2017
(This article belongs to the Special Issue Nuclear Magnetic Resonance Spectroscopy)

Abstract

:
Solid/liquid interfaces are exploited in various industrial applications because confinement strongly modifies the physico-chemical properties of bulk fluids. In that context, investigating the dynamical properties of confined fluids is crucial to identify and better understand the key factors responsible for their behavior and to optimize their structural and dynamical properties. For that purpose, we have developed multi-quanta spin-locking nuclear magnetic resonance relaxometry of quadrupolar nuclei in order to fill the gap between the time-scales accessible by classical procedures (like dielectric relaxation, inelastic and quasi-elastic neutron scattering) and obtain otherwise unattainable dynamical information. This work focuses on the use of quadrupolar nuclei (like 2H, 7Li and 133Cs), because quadrupolar isotopes are the most abundant NMR probes in the periodic table. Clay sediments are the confining media selected for this study because they are ubiquitous materials implied in numerous industrial applications (ionic exchange, pollutant absorption, drilling, waste storing, cracking and heterogeneous catalysis).

1. Introduction

In the last few decades, numerous experimental [1] and theoretical [2] studies have been devoted to solid/liquid interfaces in order to understand and predict the influence of confinement on the structural, thermodynamical and dynamical properties of fluids. In that context, clay-water solid/liquid interfaces [3,4,5,6,7,8,9] were frequently investigated for two reasons. First, from a theoretical point of view, clay platelets are flat and atomically smooth with a well-characterized structure and atomic composition, leading to ideal models of solid/liquid interfacial systems. Second, natural and synthetic clays are used in a large variety of industrial applications (drilling, heterogeneous catalysis [8], waste storing [9], food, paint and cosmetic industries), exploiting their various physico-chemical properties (gelling, thixotropy, surface acidity, high specific surface and ionic exchange capacity, water and polar solvent adsorption, swelling). Optimizing applications such as heterogeneous catalysis and waste storing requires quantifying the mobility of solvent molecules and neutralizing counterions inside the porous network of clay minerals. For that purpose, numerous experimental studies have been performed to determine the mobility of confined fluids over a broad range of diffusing time. At short time-scales (between pico-seconds and 100 nano-seconds), the mobility of confined water molecules was successfully investigated by classical Inelastic (INS) [10,11,12] and Quasi-Elastic Neutron Scattering (QENS) [13,14] experiments. By contrast, the long-time mobility of bulk fluids is generally investigated by pulsed gradient spin echo NMR spectroscopy [15] to probe time-scales larger than the millisecond. Unfortunately, the mobility of neutralizing counterions is difficult to measure by neutron scattering experiments, and the presence of paramagnetic impurities within the solid network significantly enhances the NMR relaxation rates of confined fluids, strongly limiting the use of pulsed gradient spin echo NMR spectroscopy. For that purpose, NMR relaxation measurements were frequently performed [16,17,18,19,20,21] to extract dynamical information on the mobility of the diffusing NMR probes.
A general trend of the NMR relaxation property of confined fluids is the large difference between the longitudinal ( R 1 ) and transversal ( R 2 ) relaxation rates. While the bulk fluids have generally the same NMR relaxation rates ( R 1 R 2 ), confinement drastically enhances their transverse relaxation rate leading to R 2 R 1 . Two different phenomena may be responsible for the above-mentioned difference between the longitudinal and transverse relaxation rates: either chemical exchange of the NMR probes between various environments under the so-called “moderately rapid exchange” condition [22] or a slow modulation of the NMR relaxation mechanisms [21,23,24] induced by the molecular motions of the confined fluids. One can differentiate between these two interpretations without modifying the sample’s environment (temperature, concentration, composition) by measuring both relaxation rates as a function of the static magnetic field B 0 : an increase of their difference ( R 2 R 1 ) as a function of the field’s strength is the fingerprint of an intermediate exchange [22,25], while the opposite trend results from the slow modulation of the NMR relaxation mechanisms. That condition is generally fulfilled by reducing the fluid temperature or after complexation of the NMR probe by a macromolecule [26,27,28].
In that framework, confinement was recently shown to induce, at room temperature, the slow modulation of the NMR relaxation mechanism of fluid [29,30,31]. As a consequence, numerous theoretical and experimental studies were devoted to that problem in order to quantify the influence of the geometrical and thermodynamical properties [31,32,33,34,35,36,37,38,39] of the porous media on the NMR relaxation mechanisms of their confined fluids. In addition to NMR relaxation measurements performed at a limited number of available magnetic fields [16,33], spin-locking relaxation measurements [16,33,40,41,42,43] were initially performed to extend the investigation of the dispersion curves to lower magnetic fields. These two complementary procedures lead however to a large gap within the dispersion curves that was successfully filled recently by field cycling NMR relaxometry [29,30,31,32,44,45,46,47,48]. Unfortunately, in the case of confined quadrupolar nuclei, the enhancement of the transverse relaxation rate of the confined quadrupolar probes prohibits the use of field cycling NMR relaxometry because of the time required to switch the magnetic field. In that context, we have developed multi-quanta spin-locking NMR relaxometry to probe the dynamical properties of confined quadrupolar nuclei that pertain to a large class of observable NMR isotopes within the periodic table [49]. To test the potentiality of that new approach, we selected the clay/water interface because natural and synthetic clays are well characterized and exploited in numerous industrial applications. In that context, we used multi-quanta NMR relaxometry to quantify the mobility of water molecules (heavy water D 2 O) [40,50,51,52,53] and neutralizing counterions (7Li [54], 133Cs [55]) diffusing within the porous network of clay sediments.
The swelling clays used in this study (montmorillonite, hectorite, beidellite and laponite) pertain to the class of smectites. Their elementary platelets result from the sandwiching of one layer of octahedral metallic oxides (AlIII or MgII) between two layers of tetrahedral silica. Atomic substitutions of some metals in these octahedral or tetrahedral layers by less charged metals lead to a net negative charge of the clay network neutralized by cations. These exchangeable cations are localized within the interlamellar space between individual clay platelets and are responsible for the water affinity of the clay network. Furthermore, the mechanical behavior (swelling versus setting) of the clay/water interface is monitored by the nature and valance of the neutralizing counterions, the number of substitution sites and their localization within the clay network.
As displayed in Figure 1, clay sediment exhibits a multiscale structure. At short distances, the sediment is composed of highly anisotropic platelets (thickness ∼7 Å, diameter ∼300–3000 Å). At intermediate distances, microscopic domains result from the stacking of numerous (10–100) parallel clay platelets. Depending on the hygrometry, the interlamellar space between these platelets is partially or totally filled by adsorbed water molecules [56,57,58] in addition to the neutralizing counterions. Finally, at the largest scale, clay sediment results from the juxtaposition of micro-domains with different orientations. We have used multi-quanta spin-locking NMR relaxometry measurements to determine the average residence time of the water molecules and some neutralizing counterions within the interlamellar space between the clay platelets inside each micro-domain. Furthermore, two-time stimulated echo NMR spectroscopy [59] was used to quantify the time-scale required by the water molecules to probe micro-domains with different orientations [52,53,60].
In addition to these experimental investigations, multi-scale numerical simulations were performed to determine the structure of the confined fluids and their mobility. Grand Canonical Monte Carlo (GCMC) simulations [56,57,58] were first performed to determine the number of confined water molecules as a function of the water partial pressure and the interlamellar distance. These numerical simulations also illustrate the organization of the water molecules and neutralizing counterions confined between the clay platelets (see Figure 2a,b). This organization of the confined water molecules significantly contributes to the X-ray and neutron scattering spectra [56,57,58] of oriented clay sediments. Nevertheless, the same confined water molecules exhibit a large mobility in the direction parallel to the clay surface, as detected by QENS [13,14]. This local mobility of the confined probes was determined by numerical simulations of molecular dynamics and directly compared to the QENS spectra [14]. Numerical simulations of Brownian dynamics [51] are then required to propagate at a larger time-scale the water mobility predicted by MD simulations in order to interpret the residence time determined by multi-quanta NMR relaxometry. Finally, a set of macroscopic differential equations [60] were solved to describe the exchange of the water molecules between differently-oriented micro-domains in order to interpret the echo attenuation detected by two-time stimulated echo NMR spectroscopy.

2. Sample Preparation and Experimental Setup

All natural clay samples used in this study were purified according to the classical procedure [61], and the neutralizing cations were exchanged leading predominantly to mono-ionic clay samples. The clay platelets were further selected according to their size by centrifugation [61]. Transmission Electronic Microscopy (TEM) was used to determine their size distribution [61]. Self-supporting clay films were obtained by ultrafiltration under nitrogen pressure of dilute clay dispersions. The clay films were further dried under nitrogen flux before equilibration with a reservoir of heavy water at fixed chemical potential by using saturated salt solutions. The partial pressure of D 2 O is selected to obtain hydrated clay samples with mainly one or two hydration layers in accordance with the water adsorption isotherm [56,57]. A lamella (30 × 5.5 mm 2 ) is cut into the clay film and inserted into a sealed glass cylinder, which fit the gap into a home-made solenoid coil [51] used for the NMR measurements (Figure 3). The sample holder can rotate into the coil in order to perform NMR experiments with different orientations of the clay film (denoted θ L F ) by reference to the static magnetic field B 0 . An important point is that a home-made detection coil is not required to perform multi-quanta spin-locking relaxometry measurements. The only requirement is the use of a solenoidal coil. Note however that spectra and relaxation measurements must be recorded at various orientations of the clay sample by reference to the static magnetic field. As a consequence, the detection coil must be modified to measure the sample orientation with good accuracy.
NMR measurements were performed on a DSX360 Bruker spectrometer operating at a field of 8.465 Tesla equipped with home-made detection coils. For this experimental setup, the typical duration for the inversion of the longitudinal magnetization varies between 15 and 30 microseconds depending on the nature of the NMR probes (2H, 7Li and 133Cs). Because of the efficiency of the NMR relaxation of these NMR quadrupolar probes, a fast detection mode was selected with a sampling time varying between 0.25 and one microsecond. Pulse sequences where selected to optimize the magnetization transfers required by multi-quanta NMR relaxation measurements. Details on the theory of NMR relaxation and multi-quanta spin-locking measurements are given in Appendix A, Appendix B, Appendix C and Appendix D.

3. Results and Discussion

3.1. NMR Spectra

Figure 4 and Figure 5 exhibit the variation of the NMR spectra as a function of the orientation of the clay film into the static magnetic film B 0 . The doublet detected by 2H NMR spectroscopy of the water molecules confined within hectorite [53] (Figure 4) results from two phenomena: a good alignment of the various clay platelets with respect to the lamella director and a specific orientation of the water molecules confined within the interlamellar space of the clay platelets. The principal component of the tensor quantifying the Electric Field Gradient (EFG) monitoring the quadrupolar Hamiltonian (see Appendix A, Equations (A1)–(A2b)) responsible for the NMR relaxation of the deuterium atoms of the water molecule is directed along the O D director [62]. If the water molecule reorients freely, this O D director samples uniformly all orientations with respect to the static magnetic field, canceling the average quadrupolar coupling felt by the deuterium atoms (Equations (A5)–(A6)). By contrast, confined water molecules are strongly structured with specific orientations (see Figure 2a,b) leading to a non-vanishing average of the order parameter quantifying the orientation of the O D director with respect to the clay director (see Equation (A6)). Furthermore, if the clay directors are randomly oriented into the static magnetic field, a powder spectrum should be detected [63], partially masking the doublets reported in Figure 4a. Since the order of magnitude of the quadrupolar coupling felt by the 2H atom within the water molecule is known (180–200 kHz) [62], the maximum splitting measured for an orientation of the clay director parallel to the static magnetic field may be used to evaluate the degree of alignment of the confined water molecules. Finally, the variation of the 2H doublet as a function of the orientation of the clay film in the static magnetic field (see Figure 4b) perfectly matches the expected relationship (Equation (A6)) with annulation of the doublet at the so-called magic-angle ( θ L F = 54.74 ).
7Li NMR spectra (Figure 5a) recorded for lithium counterions confined within Laponite sediment [64] exhibit the same behavior except that the previous doublet is replaced by a triplet, as expected for 3/2 spin nuclei [63]. As determined by numerical simulations [65], the principal axis of the tensor describing the EFG felt by the neutralizing counterions is oriented parallel to the clay director. As a consequence, the residual quadrupolar coupling is also monitored by the film orientation into the static magnetic field.
In the case of 133Cs, a sextuplet is expected to occur since this isotope is a 7/2 spin nucleus [63]. Unfortunately, only the first satellites [55] are detected (see Figure 5b) because the fast relaxation of this confined nuclei partially masks the theoretical quadrupolar structure.

3.2. Multi-Quanta NMR Relaxation Rates

Because of the presence of paramagnetic impurities within the clay network [18], two mechanisms are expected to monitor the NMR relaxation of confined quadrupolar probes, i.e., quadrupolar and heteronuclear dipolar couplings (see Appendix A). Theoretical details on the contributions of these two relaxation mechanisms are given in Appendix B. In that framework, a complete basis set [66,67,68] is required to fully understand the time evolution of the magnetization under the influence of the relaxation mechanisms, the pulse sequences and the static residual quadrupolar and heteronuclear dipolar couplings. For that purpose, we used the irreducible tensor operators [66,67,68] (see Appendix C) whose number increases as a function of the spin I of the nucleus. Nuclei with I = 1/2 spin are fully described by the identity (labeled T 00 ) and a row of first-order operators describing the three components of the magnetization (labeled T 1 1 , T 10 and T 11 see Figure A1). The well-known Pauli matrices are another irreducible representation of these four operators, also called coherences. Quadrupolar I = 1 spin nuclei (like 2H) require another set of five second-order coherences [68] (labeled T 2 2 , T 2 1 , T 20 , T 21 , T 22 ; see Figure A2) in order to describe the quadrupolar coupling. In the same manner, I = 3/2 spin nuclei (like 7Li) require another set of third-order coherences [68] (labeled T 3 3 , T 3 2 , T 3 1 , T 30 , T 31 , T 32 , T 33 ; see Figure A3) describing the octopolar coupling. In that framework, I = 7/2 spin nuclei (like 133Cs) require a basis set extending up to seventh-order coherences [67] (see Figure A4). Thanks to the completeness of these different basis sets, it becomes possible to describe the time evolution of the various coherences during each step of the pulse sequence by taking implicitly into account the influence of various relaxation mechanisms and residual static couplings (see Appendix D).
In the case of heavy water molecules confined within the clay sediments, we have measured by 2H NMR the time evolution of two independent coherences [52] (namely T 20 and T 22 ( a , s ) ) in addition to the classical longitudinal and transverse magnetizations corresponding respectively to the T 10 and T 11 ( a , s ) coherences (see Figure 6a). Let us call R i j the corresponding relaxation rates. The pulse sequence used to measure these different relaxation rates was detailed in previous publications [52]. A first general feature of these relaxation measurements of confined fluid is the large difference between the transverse and longitudinal relaxation rates (i.e., R 11 R 10 ; see Figure 6a).
As evidenced by numerical simulations [18], that difference results from the long time-scale necessary to obtain a complete decorrelation of the couplings monitoring the NMR relaxation. This phenomenon is characteristic of the slow modulation regime occurring when the corresponding time-scale becomes larger than the inverse of the resonance angular velocity ( ω 0 ) [23,63]. Under such conditions, the integral of the decorrelation function (i.e., J ( 0 ) ) becomes much larger than its Fourier transforms evaluated at the resonance angular velocity (i.e., J ( ω 0 ) and J ( 2 ω 0 ) ):
J ( 0 ) J ( ω 0 ) J ( 2 ω 0 )
As detailed in Appendix D, the detected difference ( R 11 R 10 ) becomes obvious since the longitudinal relaxation rate R 10 is a linear combination of J ( ω 0 ) and J ( 2 ω 0 ) (see Equations (A21) and (A22e)), while J ( 0 ) also contributes to the transverse relaxation rate R 11 (see Equations (A21) and (A22b)). The contributions of the quadrupolar and heteronuclear dipolar couplings to the various relaxation rates are detailed in Appendix D. By focusing our analysis on the dominant components (see Figure 6b), it becomes possible to distinguish the relative contributions of both the quadrupolar and heteronuclear dipolar relaxation mechanisms by simply performing four independent measurements of the R 10 , R 11 , R 20 and R 22 relaxation rates (see Equations (A21)–(A24)). As displayed in Figure 6b, the quadrupolar and heteronuclear dipolar couplings contribute significantly to the relaxation of confined water molecules. Figure 6b also exhibits a significant variation of the dominant contribution to the quadrupolar relaxation mechanism (denoted J 0 Q ( 0 ) ) as a function of the orientation of the clay lamella in the static magnetic field, with a large enhancement near the magic angle. As detailed by numerical simulations [64], this behavior results from the organization of the clay platelets within the self-supporting lamella. As explained in Appendix B, one can use the Wigner rotation matrices (Equation (A16a–c)) to extract the intrinsic contributions to both quadrupolar and heteronuclear dipolar relaxation mechanisms. These intrinsic contributions are evaluated in the frame of the clay lamella where molecular diffusion occurs. By this analysis, we can extract, for each relaxation mechanism, labeled X for X { Q , D } , three intrinsic components, called spectral densities and denoted J m X ( 0 ) for m { 0 , 1 , 2 } , respectively. The purpose of our multi-quanta spin locking relaxation measurements is to probe the low frequency variation of this set of six independent spectral densities to obtain dynamical information on the long-time mobility of the confined NMR probes. By contrast with the 2H [52] and 7Li [64] relaxation measurements, the heteronuclear dipolar coupling becomes negligible for confined 133Cs nuclei [55] because of the enhancement of its quadrupolar coupling (see Table A1).

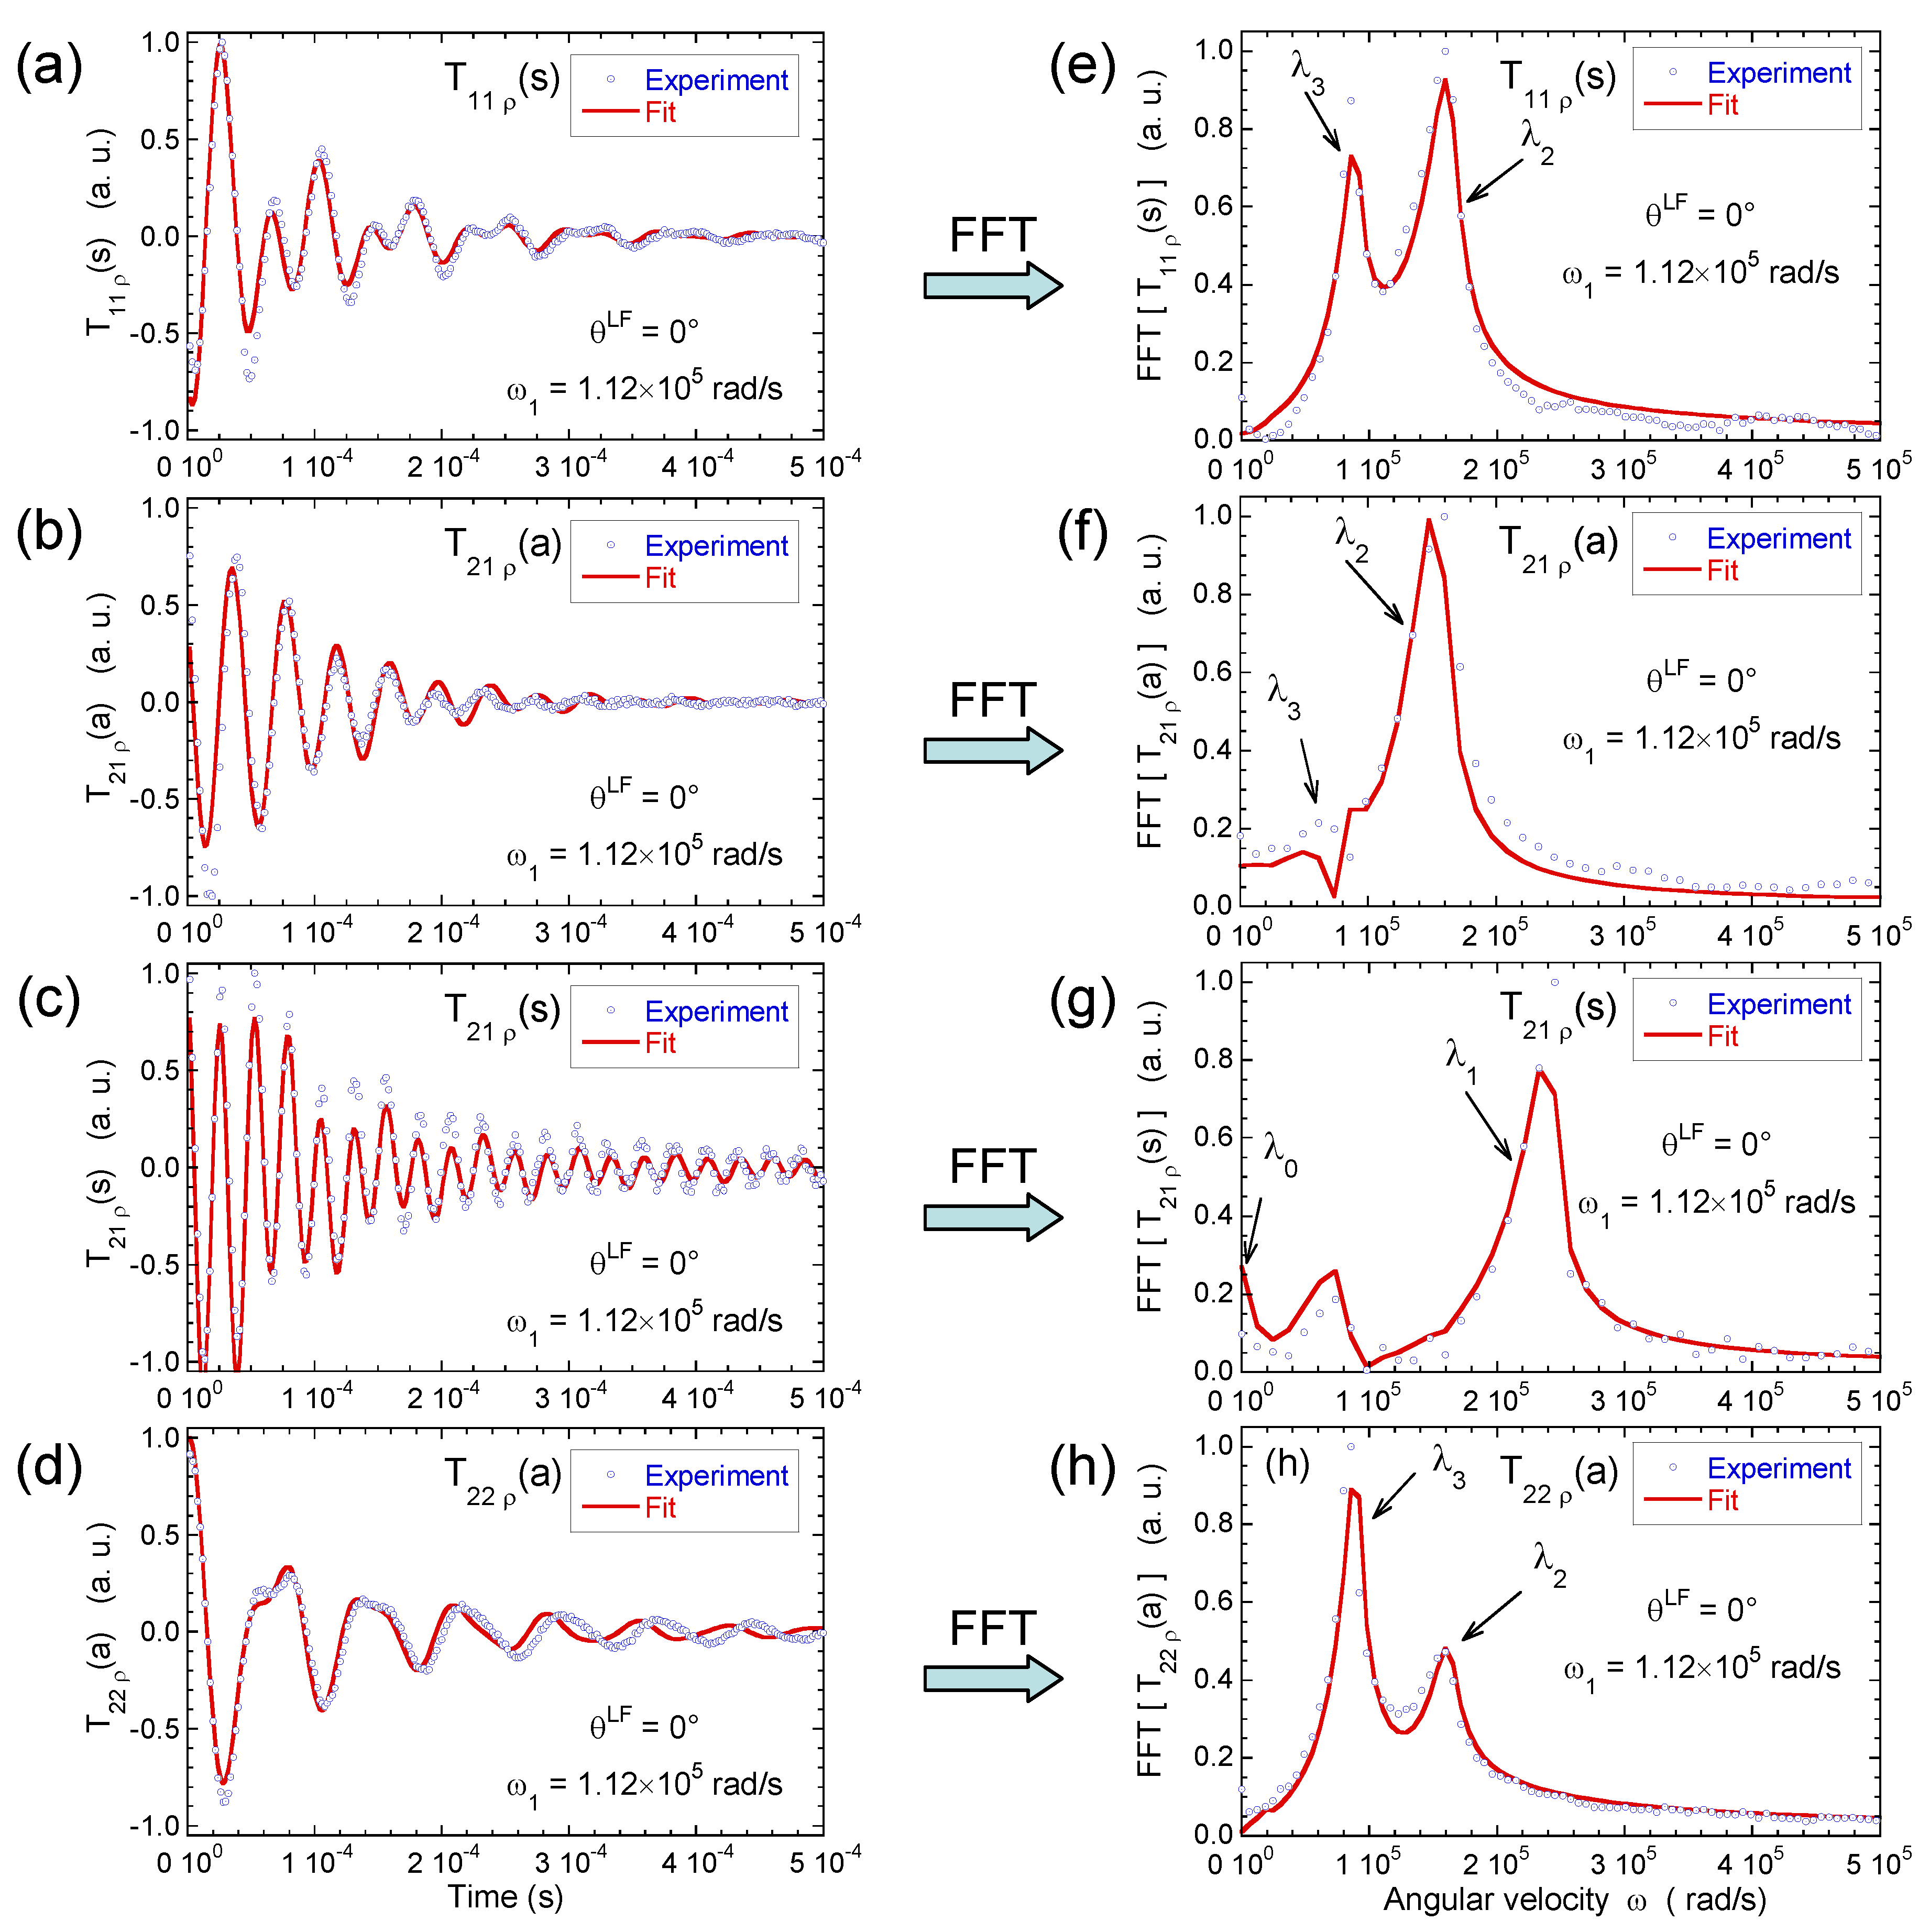
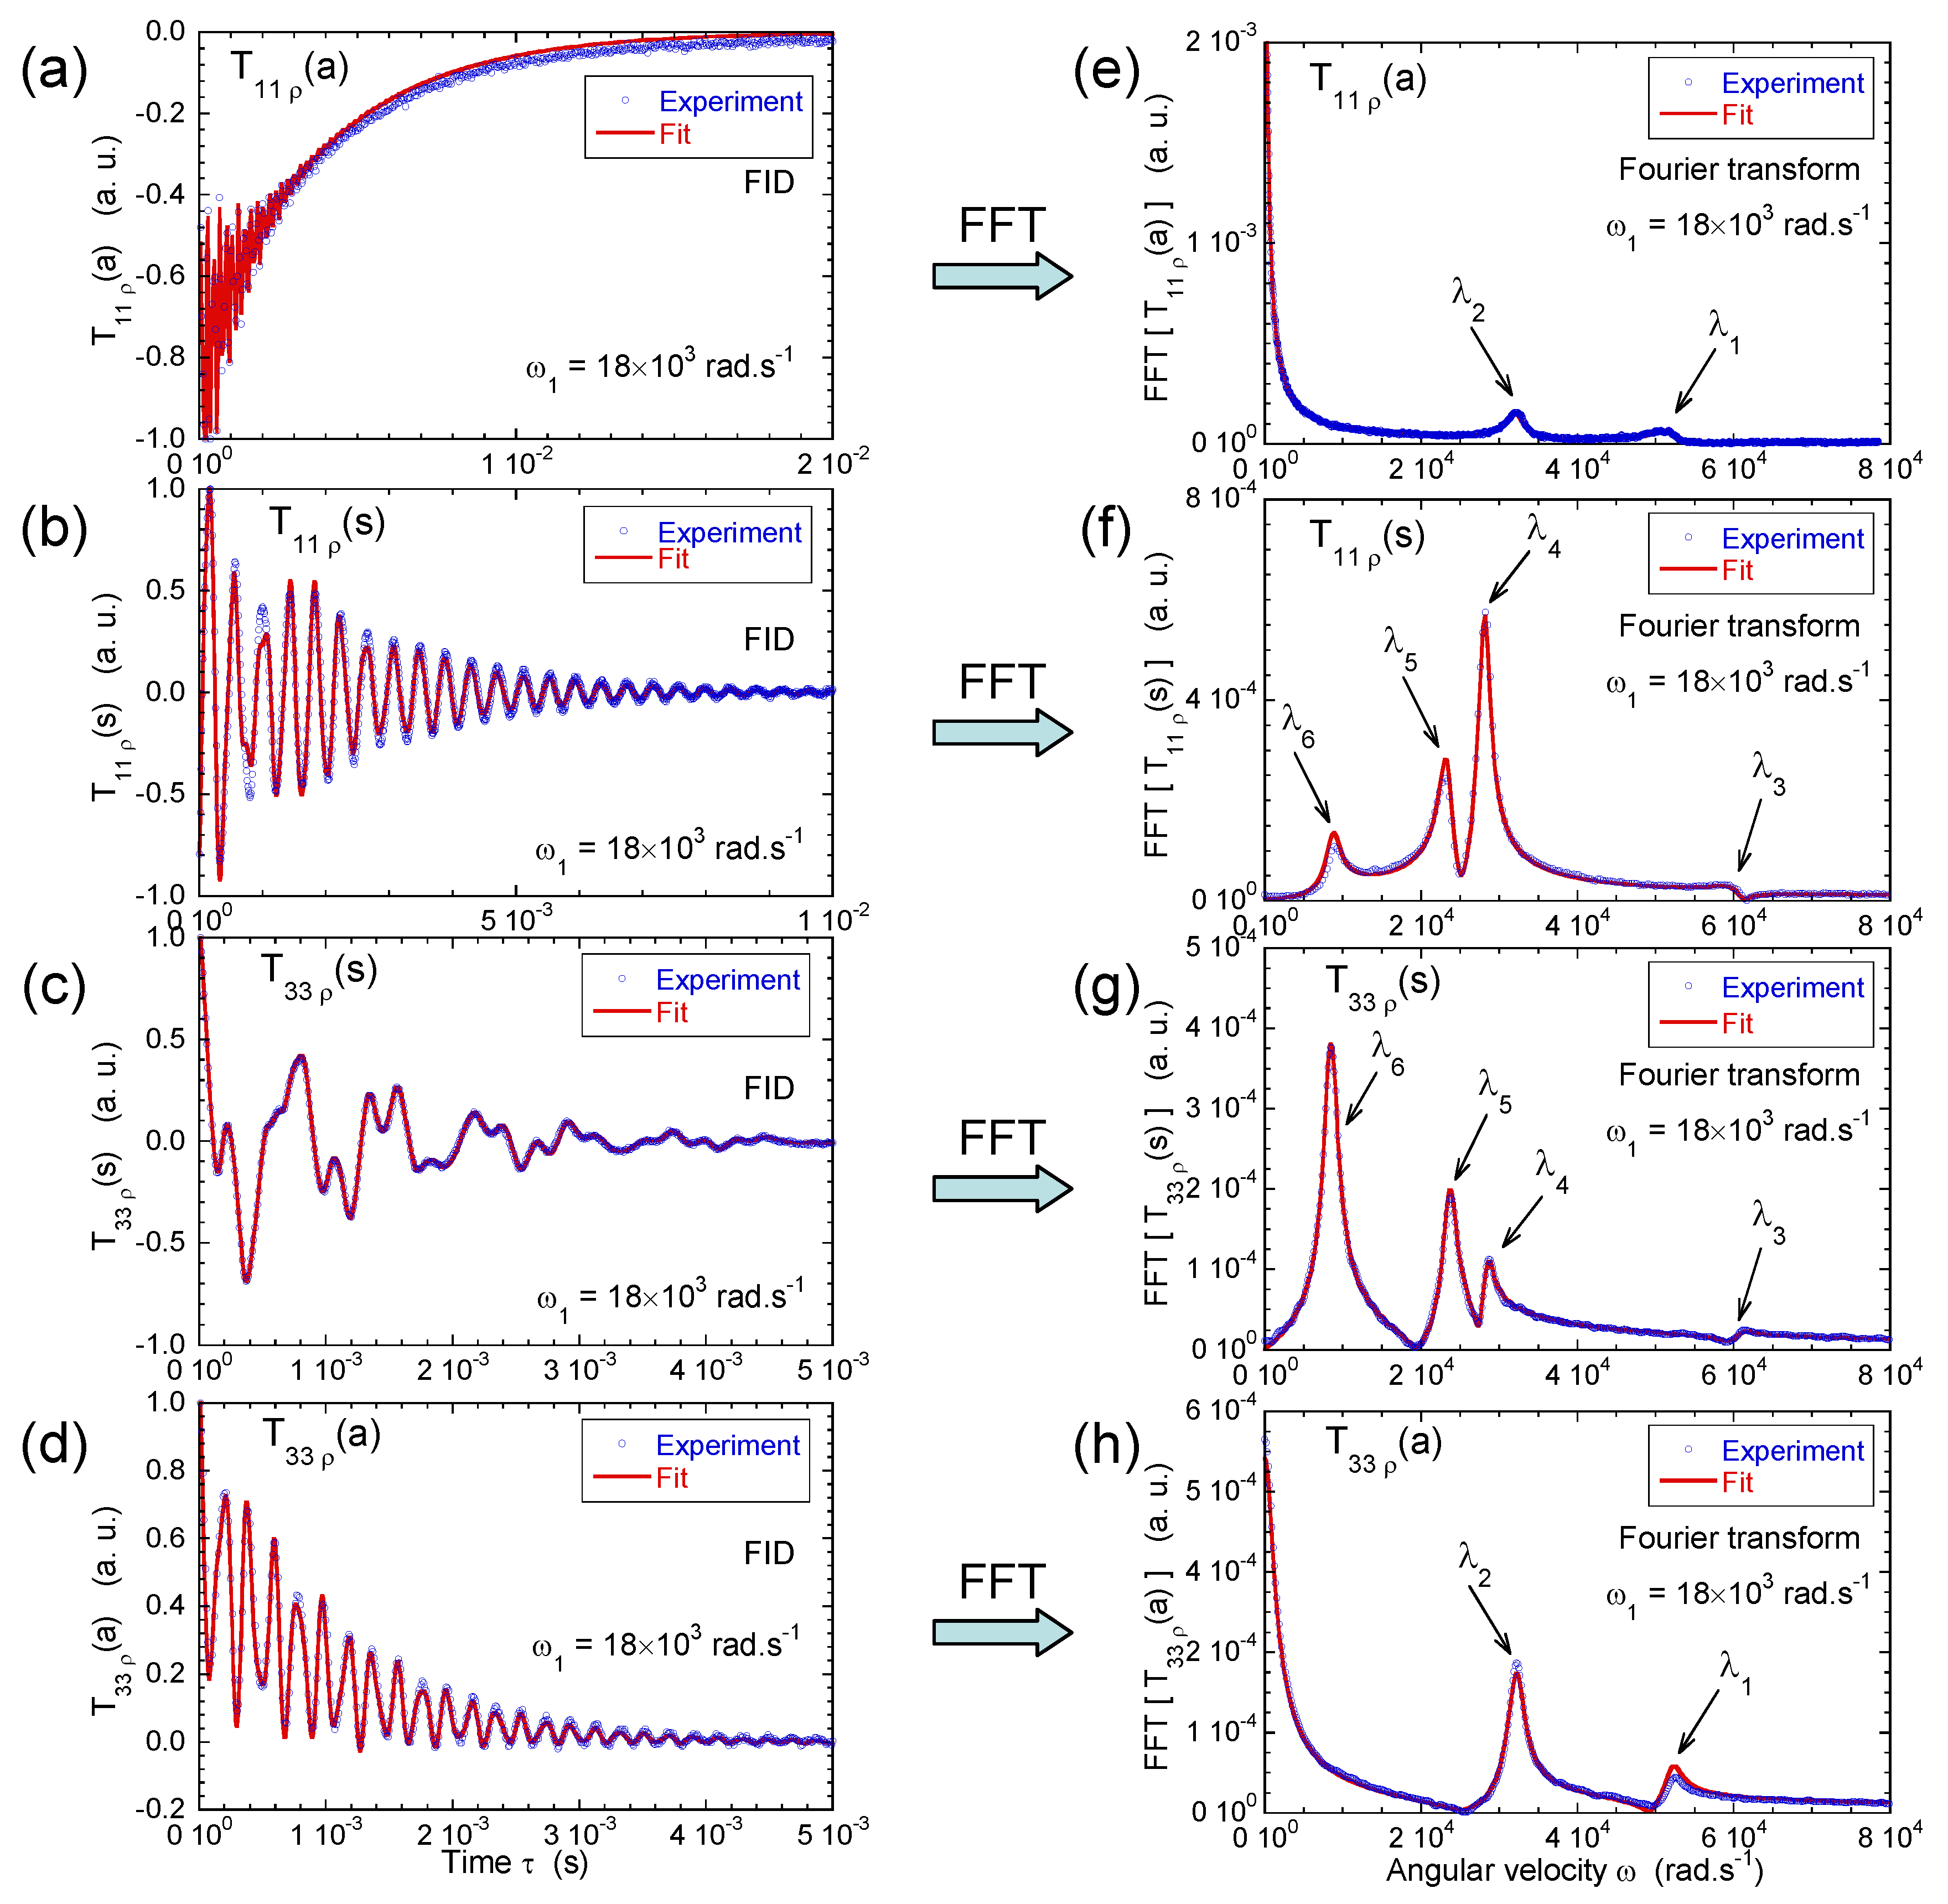
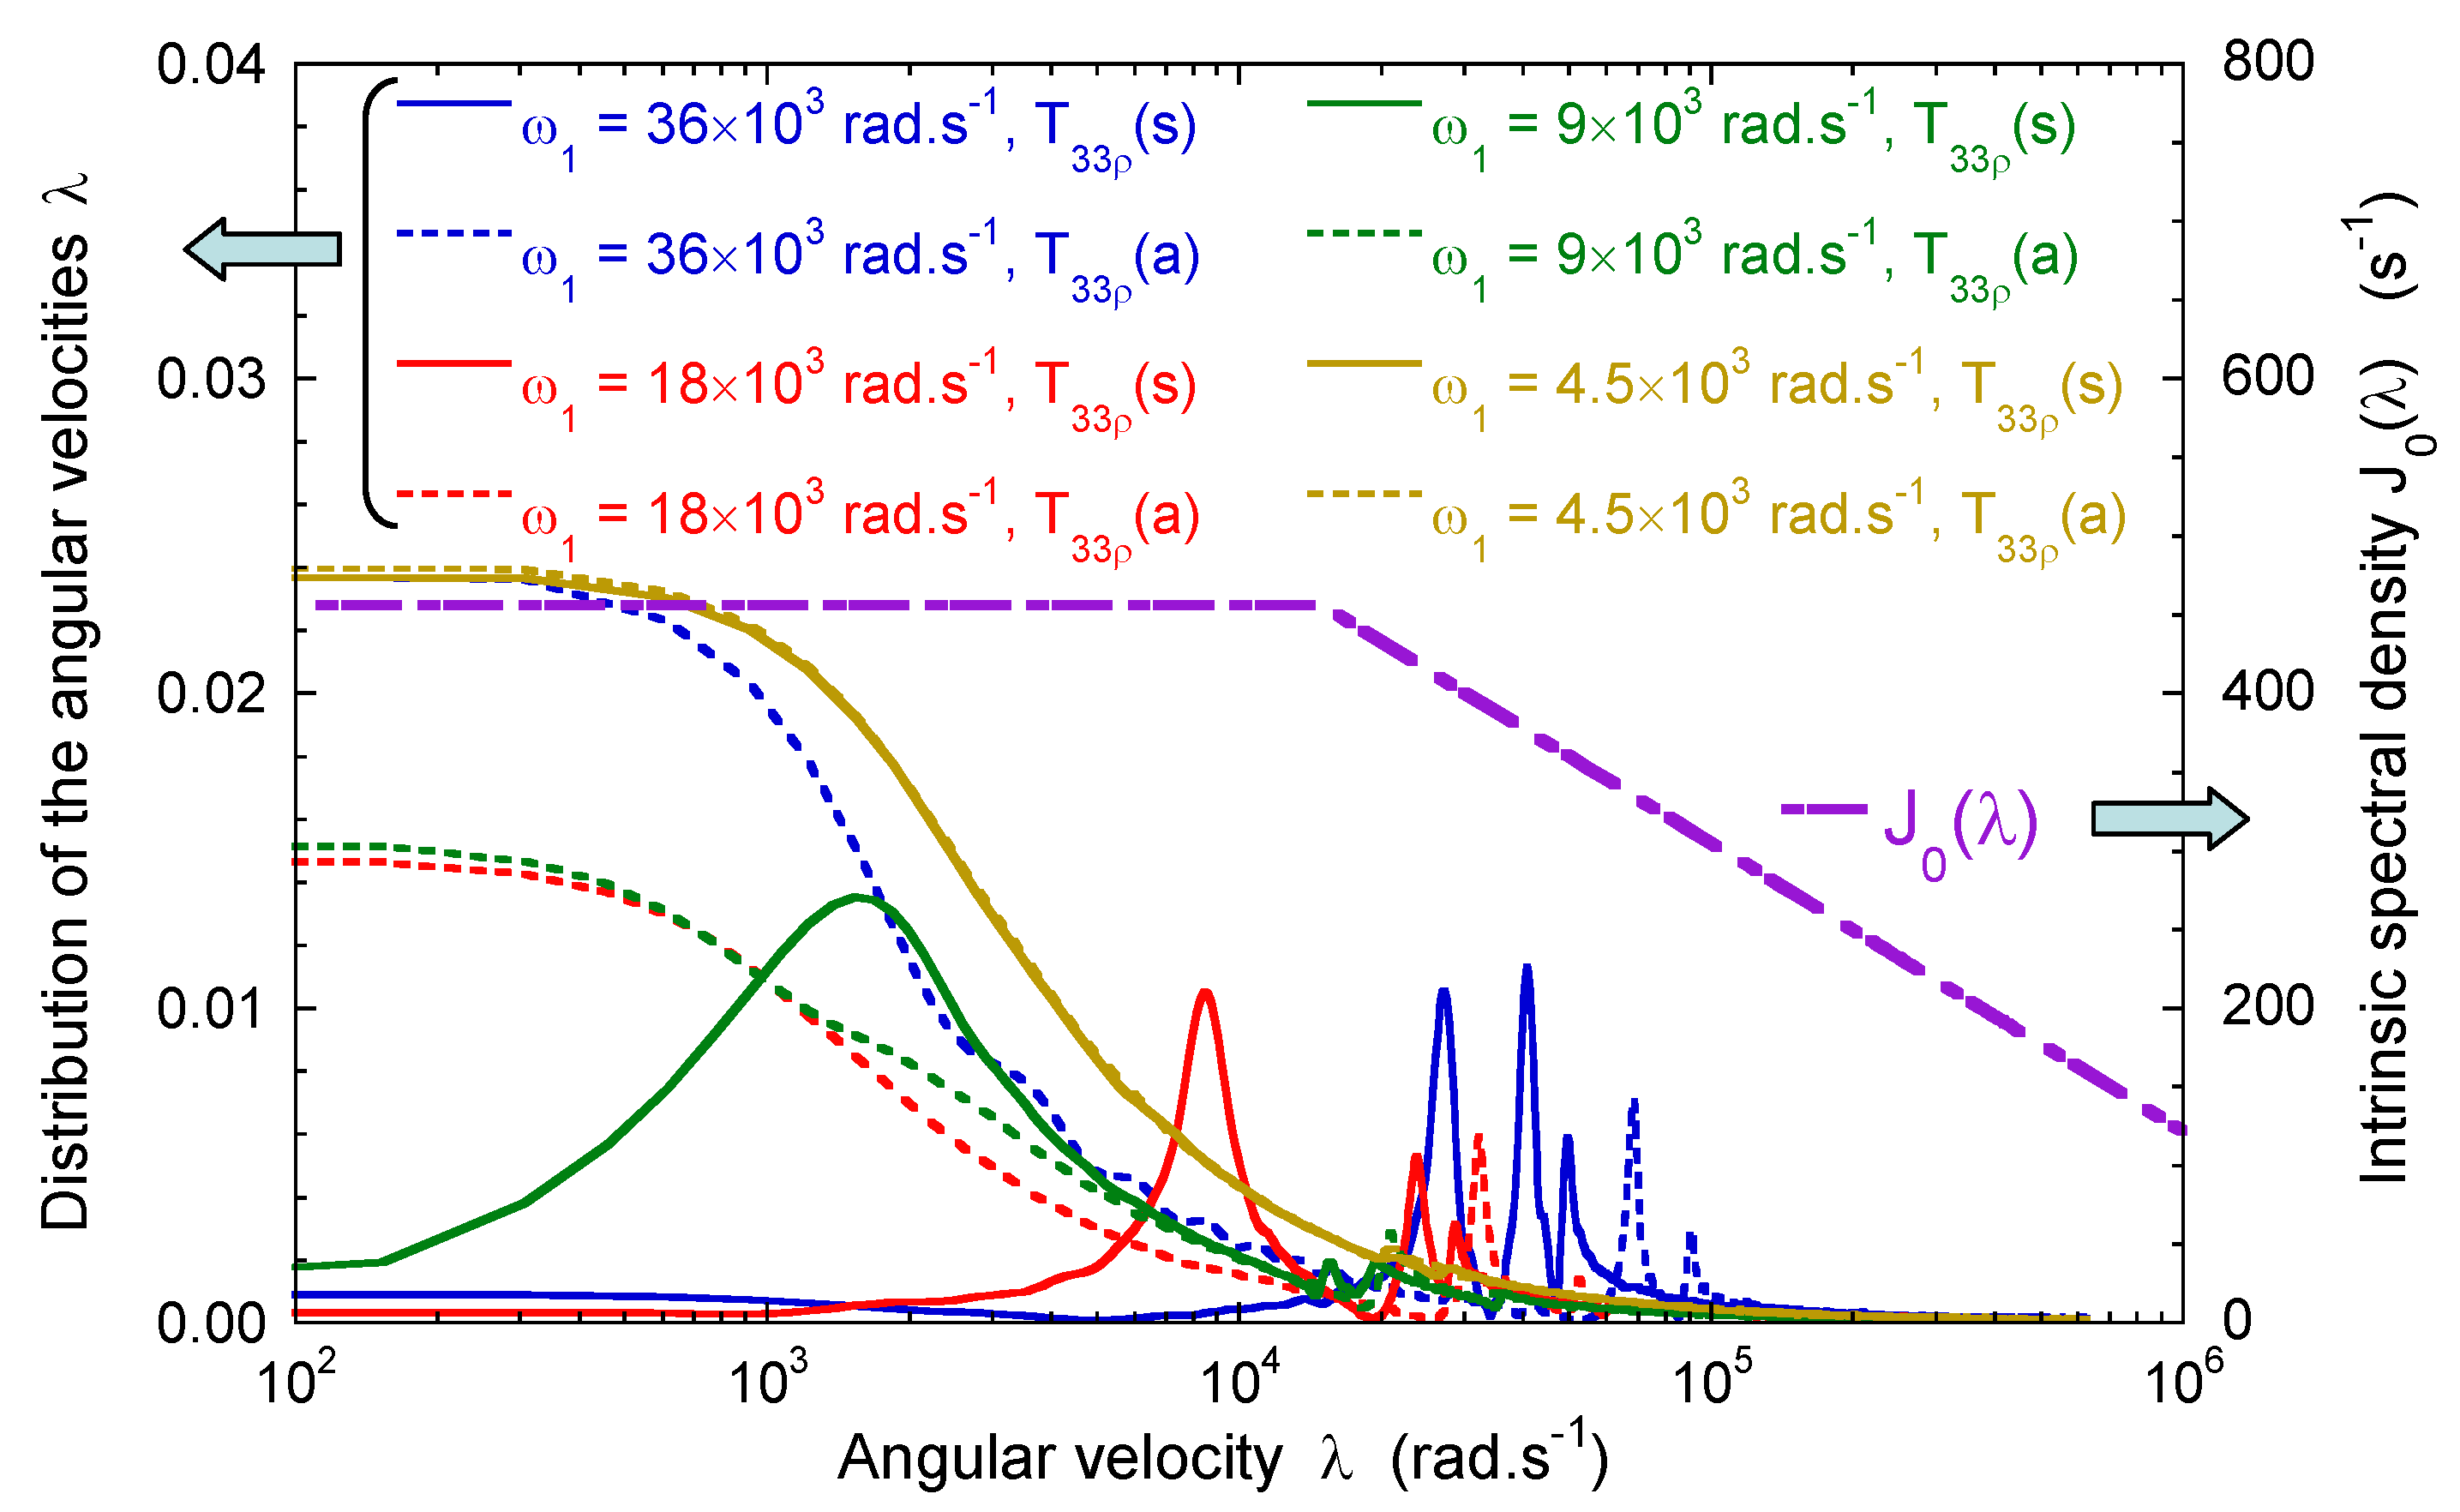
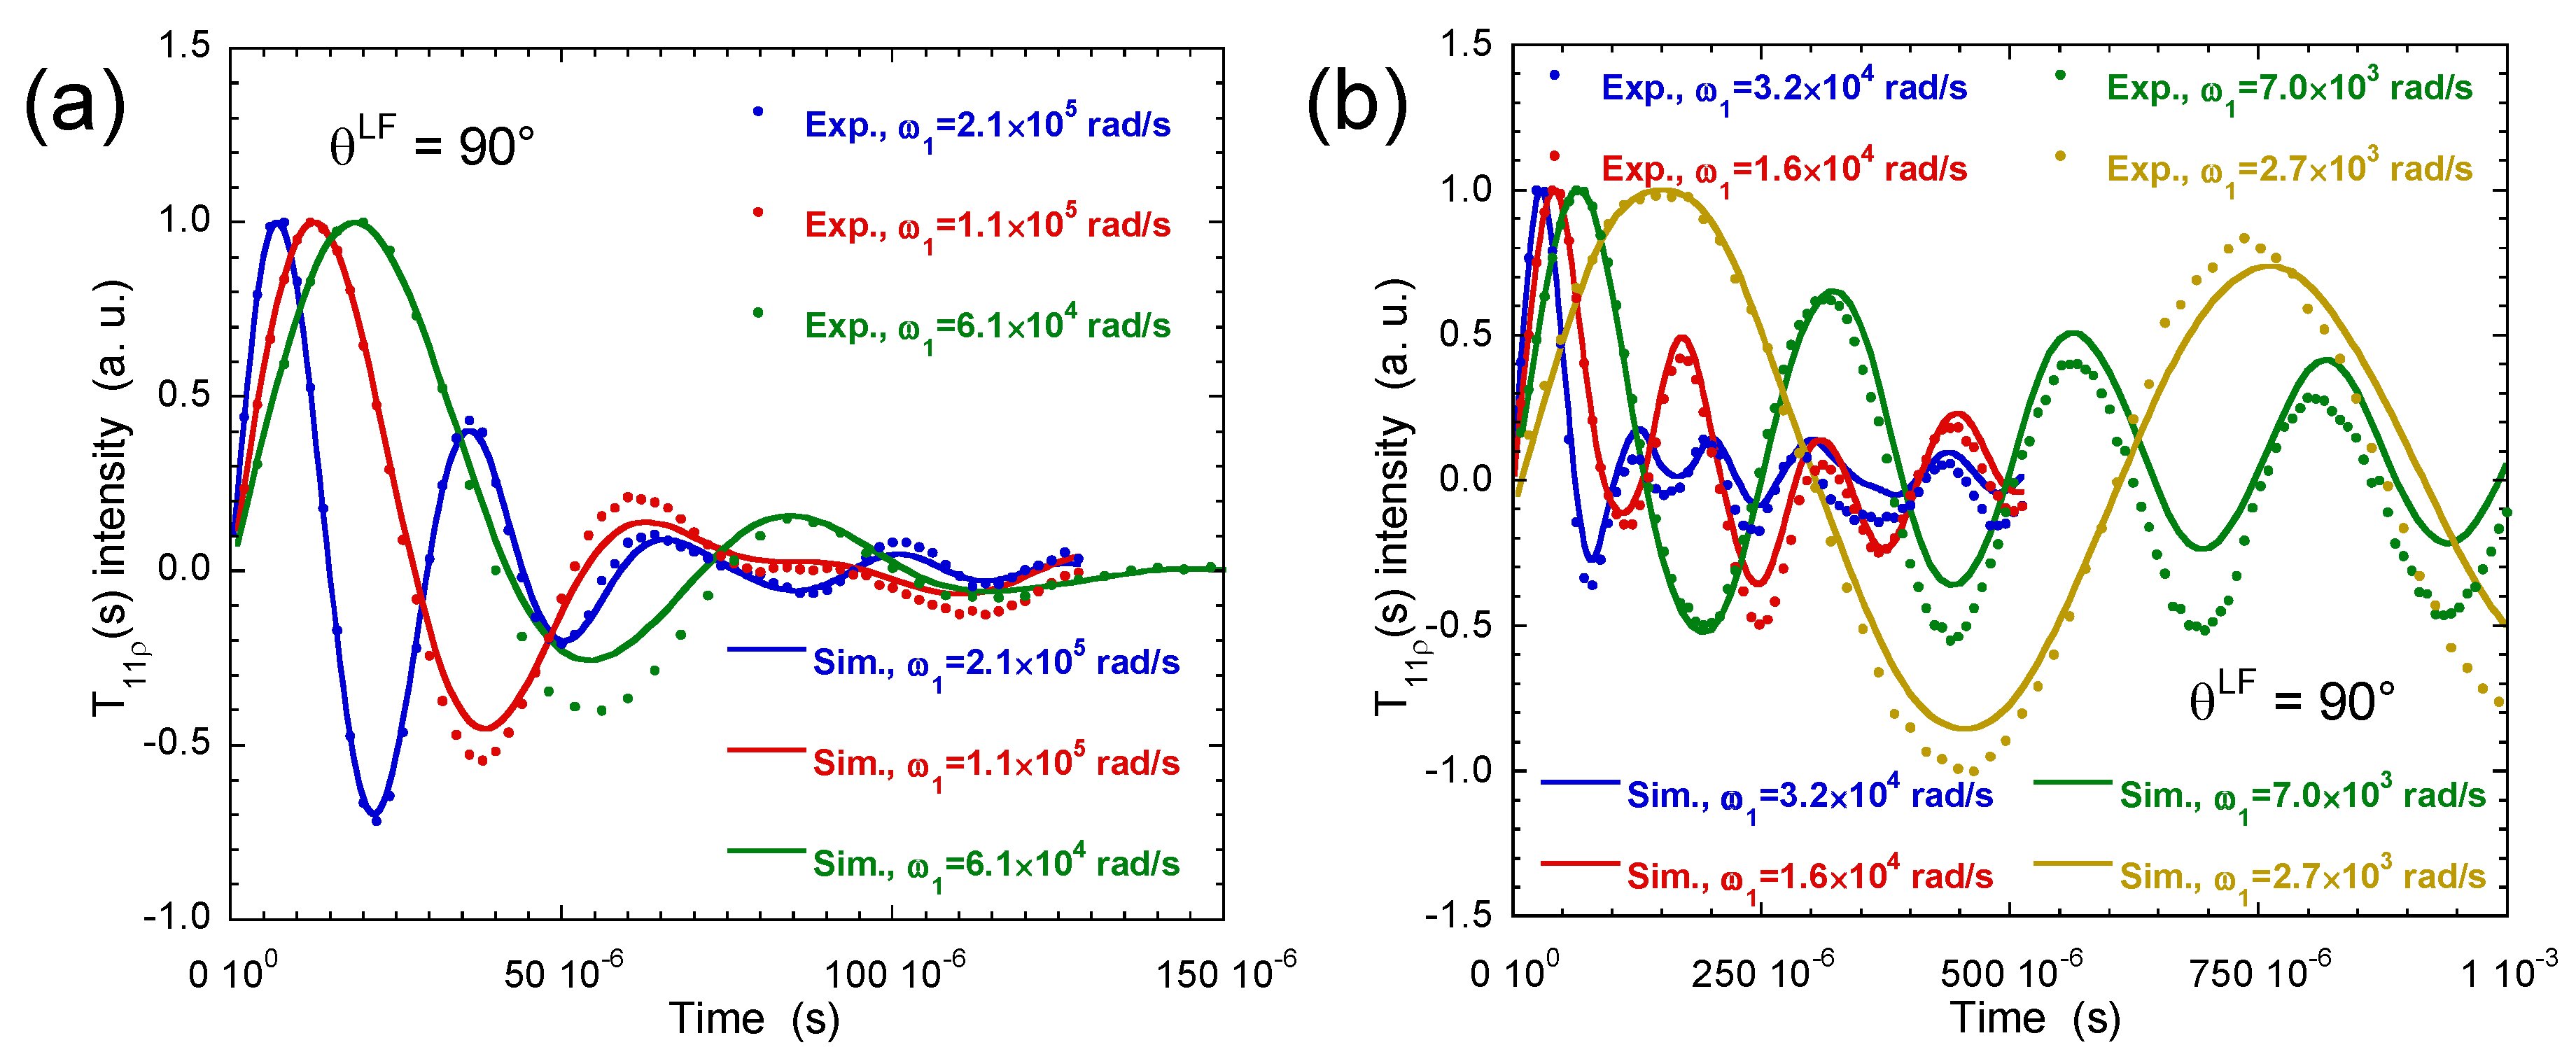
3.3. Multi-Quanta Spin-Locking NMR Relaxometry

The purpose of spin-locking relaxation measurements is to extract the dispersion curve of the spectral densities J m X ( ω ) in order to quantify the time-scale describing the decorrelation of the quadrupolar and heteronuclear dipolar couplings felt by the confined diffusing probes. This study focuses on the long-time motions responsible for the complete decorrelation of these nuclear couplings. As illustrated by numerical modeling of water diffusion [40], such complete decorrelation occurs only after desorption of the confined probes in order to lose the memory of their residual coupling that is not averaged to zero by the local motions. As a consequence, the dispersion curves are expected to exhibit a transition between a plateau [40], at low angular velocities, and a continuous decrease, at high angular velocities. The inverse of that characteristic angular velocity ( ω c ) is a measure of the average residence time ( τ c = 1 / ω c ) of the nuclear probes confined within the interlamellar spaces of the clay sediments. Furthermore, 2D diffusion within the interlamellar space of the clay platelets [40] is the dynamical process responsible for such long-time decorrelation of the nuclear couplings felt by the confined NMR probes. As a consequence, the dispersion curve is expected to exhibit a logarithmic decrease [33,36] at angular velocities larger than ω c .
Figure 7a–d exhibits the typical time evolution of the T 11 ( s ) , T 21 ( a ) , T 21 ( s ) and T 22 ( a ) coherences (see Appendix C) measured by 2H NMR under spin-locking conditions for heavy water confined within beidellite clay sediment [53]. The irradiation power used for these measurements is quantified by the angular velocity ( ω 1 = 1.12 × 10 5 rad/s) describing free nutation of 2H nuclei under such irradiation. As illustrated by a Fourier transform of the time evolutions (Figure 7e–h), we detect three non-zero characteristic angular velocities ( λ 1 = 2.5 × 10 5 rad/s, λ 2 = 1.6 × 10 5 rad/s and λ 3 = 0.9 × 10 5 rad/s) for a single irradiation power, extending significantly the dynamical range probed by this quadrupolar nucleus (see Table 1). As explained in Appendix D (see Equation A20), these three characteristic angular velocities vary not only as a function of the irradiation power, but also the residual quadrupolar coupling felt by the quadrupolar probes. As a consequence, by varying the film orientation into the static magnetic field (i.e., θ L F ), it becomes possible to probe a large dynamical range by using a limited number of irradiation powers (see Table 1). As displayed in Figure 8a, the resulting dispersion curve covers two decades, exhibiting a clear transition at the characteristic angular velocity ( ω c = ( 6 ± 1 ) × 10 4 rad/s), corresponding to an average residence time ( τ c = ( 17 ± 3 ) μ s) of the water molecules confined within the interlamellar space of beidellite. As illustrated in Figure 8b, this result is compatible with the average residence time obtained by simulations of Brownian dynamics exploiting the size of the clay platelets 500 ± 100 nm and the water mobility ( D = 7 × 10 10 m2/s) measured by QENS on equivalent samples [13,14].
In the case of 3/2 spin nuclei, six non-zero angular velocities (denoted λ i ) are expected to occur in the time evolution of the various coherences under the spin-locking condition (see Equation (A27)). Spin-locking measurements of the T 11 ( s ) , T 11 ( a ) , T 33 ( s ) and T 33 ( a ) coherences have been performed for 7Li counterions neutralizing laponite synthetic clay [54]. Figure 9a–d exhibits complex time evolutions of the various coherences under spin-locking because of the multiplicity of contributing modes. By contrast, their Fourier transform (see Figure 9e–h) clearly identifies the six expected modes, with a perfect matching between the experimental data and the theoretical analysis [54]. As displayed in Figure 10, a broad range of angular velocities ω is then probed by using only four irradiation powers sampling simply one decade.
In the case of 133Cs neutralizing a synthetic fluoro-hectorite [55], a complete numerical treatment of the time evolution of the coherences is required due to the large size of the basis-set required to describe all the quantum states of this 7/2 spin nucleus. Our analysis leads to a good agreement between the experimental and calculated data (Figure 11) by setting all sampled spectral densities equal to their high frequency [55] value by assuming:
J 0 Q ( λ p 0 ) = J 0 Q ( ω 0 )
Figure 12 illustrates the range of angular velocities that can be sampled by 133Cs spin-locking relaxation measurements induced by the quadrupolar relaxation mechanism that was shown to monitor the relaxation of 133Cs.
As a consequence, the transition between the low frequency plateau and the continuous decrease of the spectral density must occur at angular velocities ( ω c ) much smaller than the lowest eigenvalue λ p Q probed by these spin-locking measurements, i.e., 10 3 rad/s (see Figure 12). The corresponding average residence time of the confined cesium counterions must be larger than 1 ms [55]. By taking into account the average size of the hectorite platelets determined by TEM ( L 0.4 μ m), we obtain a self-diffusion coefficient ( D L 2 / 2 τ c ) smaller than 8 × 10 11 m 2 /s. That upper limit is fully compatible with the cesium mobility within clay sediments obtained by numerical simulations of molecular dynamics [55,69,70,71,72,73,74].

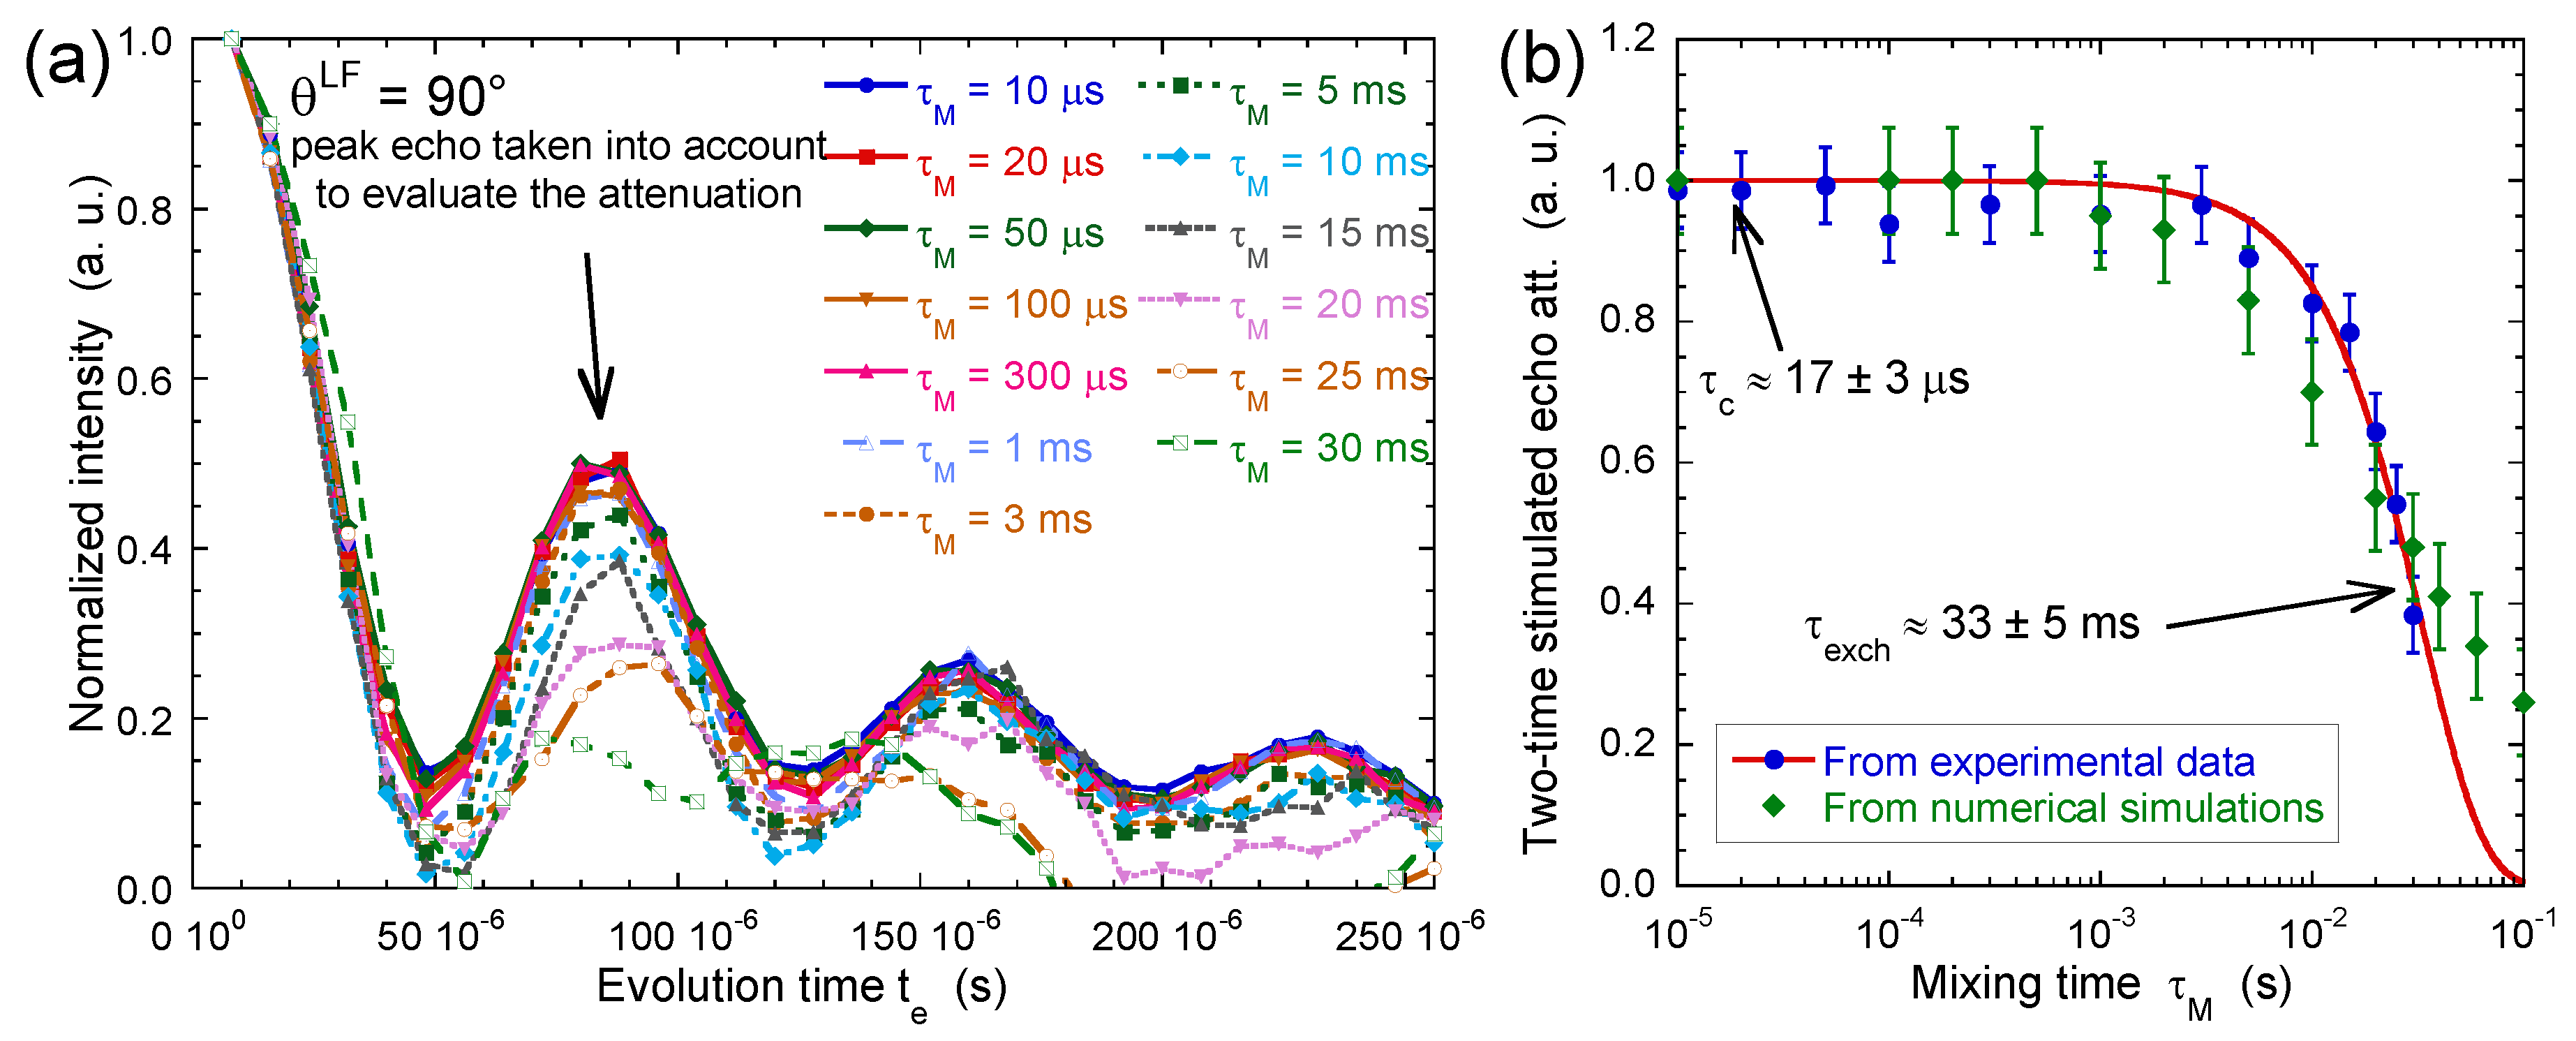
3.4. Two-Time Stimulated Echo Attenuation

Two-time stimulated echo NMR spectroscopy [59,60] exploits the heterogeneity of the micro-domain orientations within the clay sediment (see Figure 1). For 2H nuclei, these heterogeneities of the clay platelets’ orientation induce heterogeneities of the residual quadrupolar coupling felt by the confined water molecules (Equation (A6)). The pulse sequence displayed in Figure 13 illustrates the experimental procedure [60]: During the first evolution procedure, the transverse magnetization (corresponding to the T 1 ± 1 coherence) of all water molecules pertaining to the micro-domain labeled i oscillates at a specific angular velocity (denoted ω Q i ) corresponding to the orientation of their micro-domain. The total transverse magnetization is next transferred into the T 20 coherence and freely evolves during the mixing time τ M . The duration of the fourth pulse ( ψ ) is selected to optimize the double-quanta filtering, by optimizing the transfer of the T 20 coherence into the T 22 coherence and minimizing the transfer from the other zero-order coherence, i.e., the T 10 coherence, into the same T 22 coherence. During the second evolution period, the transverse magnetization of the confined water molecules again oscillates at the angular velocity (denoted now ω Q j ) corresponding to the specific orientation of their actual micro-domain, labeled j. As a consequence, the net magnetization satisfies [59,60]:
I ( t e , τ M ) = cos ω Q i ( 0 ) t e ) × cos ω Q j ( τ M ) t e ) × e ( R 20 τ M + 2 R 11 t e )
If the mixing time ( τ M ) is smaller than the time (denoted τ e x c h ) required by the confined water molecules to exchange between two micro-domains with different orientation, the statistical average of the product of the cosinus functions within the bracket in Equation (3) reaches its maximum value. By contrast, for mixing times larger than the same exchange time, the water molecules will now probe two micro-domains with different orientations, thus reducing the previous statistical average. Finally, the exponential law of Equation (3) describes the intrinsic attenuation of the magnetization during the evolution time t e and mixing time τ M .
Figure 14a illustrates the resulting attenuation of the two-time stimulated echo as a function of the mixing time [60]. A better illustration is given by simply noting the relative intensity of the first maximum (see Figure 14b), leading to an exchange time of 33 ms, i.e., three orders of magnitude larger than the water residence time is the interlamellar space. That interpretation is fully validated by a simple numerical model [60] describing the exchange of water molecules between neighboring cubic boxes labeled by a set of three indices ( i , j , k ):
d σ i , j , k d t = ( R i , j , k 6 k e x c h t ) σ i , j , k + k e x c h t [ σ i + 1 , j , k + σ i 1 , j , k + σ i , j + 1 , k + σ i , j 1 , k + σ i , j , k + 1 + σ i , j , k 1 ]
where R i , j , k contains the contributions from the pulses, the local residual quadrupolar couplings and the relaxation mechanisms (see Appendixes Appendix A and Appendix B), leading to a set of generalized Bloch equations [22,75].

4. Conclusions

Multi-quanta spin-locking NMR relaxometry of quadrupolar nuclei was shown to be a powerful tool to quantify the average residence time of molecular (D 2 O) and ionic (7Li, 133Cs) probes confined within the interlamellar space of clay lamellae inside dense sediments. Furthermore, two-time stimulated echo NMR attenuation leads to dynamical information on the long-time mobility of the water molecules exchanging between differently-oriented micro-domains constituting dense clay sediments. Multi-scale numerical simulations were performed to better understand the structural and dynamical properties of confined ions and water molecules, improving our analysis of the NMR experiments. These multi-quanta spin-locking NMR relaxometry measurements are expected to be easily extended to study other interfacial systems, including porous silicate, zeolites, cements, etc. A large number of diffusing probes may be used for such investigations since quadrupolar isotopes pertain to a large fraction of detectable NMR isotopes within the periodic table.

Acknowledgments

These works were partially supported by the CNRS Interdisciplinary Project “Nucléaire, Energie, Environnement, Déchets, Société (NEEDS)” through its “Milieux Poreux (MIPOR)” Program, which provided financial support (Projects MULTIDYN and TRANSREAC).

Conflicts of Interest

The authors declare no conflict of interest.

Abbreviations

The following abbreviations are used in this manuscript:
EFGElectric Field Gradient
GCMCGrand Canonical Monte Carlo
INSInelastic Neutron Scattering
NMRNuclear Magnetic Resonance
QENSQuasi-Elastic Neutron Scattering
TEMTransmission Electron Microscopy

Appendix A. Quadrupolar and Heteronuclear Dipolar Hamiltonian

The quadrupolar Hamiltonian [23,24,63] is defined by:
H Q = C Q p = 2 2 ( 1 ) p F 2 , p Q , L T 2 , p I R with C Q = 3 2 e Q ( 1 + γ ) I ( 2 I 1 )
where e is the electron charge, Q is the quadrupolar moment of the nuclei [76] and ( 1 + γ ) is the Steinhermer antishielding factor [76]. These three last parameters are detailed in Table A1 for different quadrupolar nuclei.
In the above equation,
F 2 , 0 Q , L = 1 2 V z z L , F 2 , ± 1 Q , L = 1 6 V x z L ± i V y z L , F 2 , ± 2 Q , L = 1 2 6 V x x L V y y L ± 2 i V x y L
and
T 2 , 0 Q , I R = 1 6 3 I z 2 I ( I + 1 ) , T 2 , ± 1 Q , I R = 1 2 I z I ± + I ± I z , T 2 , ± 2 Q , I R = 1 2 I ± 2
where V α β L are the components of the EFG evaluated in the laboratory frame (denoted L); T 2 , ± p Q , I R (for p = 2 to 2) are the second-order irreducible tensor operators; I x , I y and I z are the spin operators and I ± = I x ± i I y .
Table A1. Parameters monitoring the order of magnitude of the quadrupolar Hamiltonian of some alkali cations (see [76]).
IsotopeSpin IQ (10 24  cm 2 )1 + γ R 10 in Water (s 1 )
7 Li3/20.0420.740.03
23 Na3/20.115.116.2
39 K3/20.0918.324
85 Rb5/20.3148.2420
133 Cs7/20.0041110.08
In the presence of a static quadrupolar coupling, the equidistant Zeeman energy levels are modified by the residual quadrupolar coupling, leading to a quadrupolar splitting of the resonance lines according to:
ω m 1 , m = 3 8 C Q V z z L ( 1 2 m )
for m varying between I and I + 1 .
During a change of frame, the components of the EFG transform like the second-order spherical harmonics [24]:
F 2 , q Q , L = p = 2 2 F 2 , p Q , P D p , q L P ( θ , φ , ψ )
with D p , q L P ( θ , φ , ψ ) , the components of the Wigner rotation matrices [24] where the set of ( θ , φ , ψ ) Euler angles defines the orientation, into the static magnetic field, of the principal axis of the tensor describing the EFG felt by the quadrupolar nucleus. Three sets of frames are useful to describe the orientation of the principal component of the EFG: the laboratory frame (denoted L), a frame attached to the dense clay sediment (denoted F) and a frame attached to the individual quadrupolar nucleus (denoted P). The e z directors of these different frames are respectively the direction of the static magnetic field B 0 (laboratory frame L), the normal to the clay sediment n (sediment frame F) and the director of the principal component of the EFG, denoted V z z P (particle frame P).
The measured quadrupolar splitting is derived from Equations (A3) and (A4):
ω m 1 , m a p p = A m V z z P p = 2 2 D p , 0 L F ( θ L F , φ L F , ψ L F ) D 0 , p F P ( θ F P , φ F P , ψ F P ) with A m = 3 e Q ( 1 + γ ) ( 1 2 m ) 4 I ( 2 I 1 )
The angular average is evaluated in Equation (A5) over all the orientations of EFG principal component within the sediment. The first set of the Wigner rotation matrix describes the orientation of the macroscopic clay sample with respect to the magnetic field, and the Wigner rotation matrix in the bracket characterizes the average orientation of EFG principal component within the sediment. For clay sediments with cylindrical symmetry, only the component p = 0 contributes to Equation (A5), which reduces to:
ω m 1 , m a p p = A m V z z P 3 cos 2 θ L F 1 2 3 cos 2 θ F P 1 2
In addition to the quadrupolar coupling, the heteronuclear dipolar coupling may also be responsible for the NMR relaxation of the confined probes because of the presence of paramagnetic impurities. The corresponding heteronuclear dipolar Hamiltonian [23,24,63] becomes:
H D ( t ) = C D m = 2 2 ( 1 ) m T 2 , m D , I R F 2 , m D , L ( t ) with C D = μ 0 4 π γ I γ S
where the C D is the dipolar coupling constant, and the spin operators become [23,24,63]:
T 2 , 0 D , I R = 1 6 2 I z S z 1 2 ( I + S + I S + ) , T 2 , ± 1 D , I R = 1 2 ( I z S ± + I ± S z ) and T 2 , ± 2 D , I R = 1 2 I ± S
The functions F 2 , m D , L ( t ) in Equation (A7) are related to the second-order spherical harmonics describing the reorientation of the vector joining the two coupled spin (denoted r I S ( t ) ) by reference to the static magnetic field [23,24,63]:
F 2 , m D , L ( t ) = 24 π 5 Y 2 , m ( θ , φ ) r I S 3

Appendix B. NMR Relaxation Theory

In the framework of the Redfield theory [77], the time evolution of the spin quantum states, also called coherences, is described by the master equation [23,24,63]:
d σ * d t = i H S * , σ * + f ( σ * )
As denoted by the asterisk ( * ), all terms are evaluated in the Larmor frequency rotating frame. The commutator describes the contribution from the static Hamiltonians H S * , including the excitation pulses and the residual quadrupolar Hamiltonian. The second term describes the contribution from the fluctuating parts of the quadrupolar and dipolar Hamiltonians:
H X F * ( t ) = C X m = 2 2 ( 1 ) m T 2 , m X , I R e i m ω 0 t F 2 , m X , L ( t ) F 2 , m X , L ( t )
where the index X stands for the various relaxation mechanisms (i.e., Q or D). This last contribution to the master equation is given by [23,24,63,77]:
f ( σ * ) = 0 t s u p H X F * ( t ) , e i H S * τ H X F * + ( t τ ) e i H S * τ , σ * ( t ) d τ
If the time-scales characterizing the decorrelation of the various Hamiltonians are much smaller than the time-scale sampled by the evolution of the coherences, the upper limit of the integral t s u p in Equation (A12) may be set equal to infinity. This hypothesis restricts the validity of the Redfield theory applied to NMR relaxation [23,24,63].
Let us introduce the autocorrelation functions of the fluctuating components of the Hamiltonian:
G m X , L ( τ ) = F 2 , m X , L ( 0 ) < F 2 , m X , L > × F 2 , m X , L ( τ ) < F 2 , m X , L > + F 2 , m X , L ( 0 ) < F 2 , m X , L > × F 2 , m X , L ( τ ) < F 2 , m X , L > with m { 0 , 1 , 2 }
By neglecting the time evolution of the coherences during the irradiation pulses, Equation (A12) becomes then [23,24,63]:
f ( σ * ) = m = 0 2 T 2 , m X , I R , T 2 , m X , I R , σ * J m X , L ( m ω 0 )
where the so-called spectral densities J m X , L ( m ω 0 ) satisfy the relationship [23,24,63]:
J m X , L ( m ω 0 ) = C X 2 0 G m X , L ( t ) e i m ω 0 t d t
The above-mentioned approximation is generally valid for classical relaxation measurements because the duration of the detection pulses (typically a few μ s) is much shorter than the time evolution of the coherences. Finally, a complete basis set of coherences is required to translate Equation (A14) into a matrix form [18,64,78,79,80].
In the case of spin-locking relaxation measurements, one cannot neglect the time evolution of the coherences during the irradiation power since it is applied during the entire evolution period of the coherences. As a consequence, the time evolution of the dipolar and quadrupolar couplings under the influence of the static Hamiltonian H S * must be taken into account in Equation (A12) as described implicitly by the term e i H S * τ H X F * + ( t τ ) e i H S * τ in the double commutator (see Equation (A12)). For that purpose, the static Hamiltonian is also formulated in a matrix form by using the complete basis set of coherences [40,54,55]. After evaluating its eigenvalues (denoted ± i λ p ) and corresponding eigenvectors (denoted v p ), one obtains a new complete basis set. The problem is then easily solved by projecting, into this eigenvectors basis set, the initial basis set of the coherences used to describe the T 2 , m X , I R spin operators.
By using the Wigner rotation matrices [81] (cf. Equation (A4)), it is possible to relate the derivation of the apparent correlation functions G m X , L ( τ ) , evaluated in the laboratory frame (denoted L), with their intrinsic value evaluated in the frame attached to the clay sediment (denoted F) [82]:
G 0 X , L ( τ ) = ( 1 3 cos 2 θ L F ) 2 4 G 0 X , F ( τ ) + 3 cos 2 θ L F sin 2 θ L F G 1 X , F ( τ ) + 3 ( 1 3 cos 2 θ L F ) 2 4 G 2 X , F ( τ )
G 1 X , L ( τ ) = 3 cos 2 θ L F sin 2 θ L F 2 G 0 X , F ( τ ) + 1 3 cos 2 θ L F + 4 cos 4 θ L F 2 G 1 X , F ( τ ) + 1 cos 4 θ L F 2 G 2 X , F ( τ )
G 2 X , L ( τ ) = 3 ( 1 cos 2 θ L F ) 2 8 G 0 X , F ( τ ) + 1 cos 4 θ L F 2 G 1 X , F ( τ ) + 1 + 6 cos 2 θ L F + cos 4 θ L F 8 G 2 X , F ( τ )
Obviously, the same relationship may be deduced for the corresponding spectral densities thanks to the linearity of the Fourier transform (see Equation (A15)).

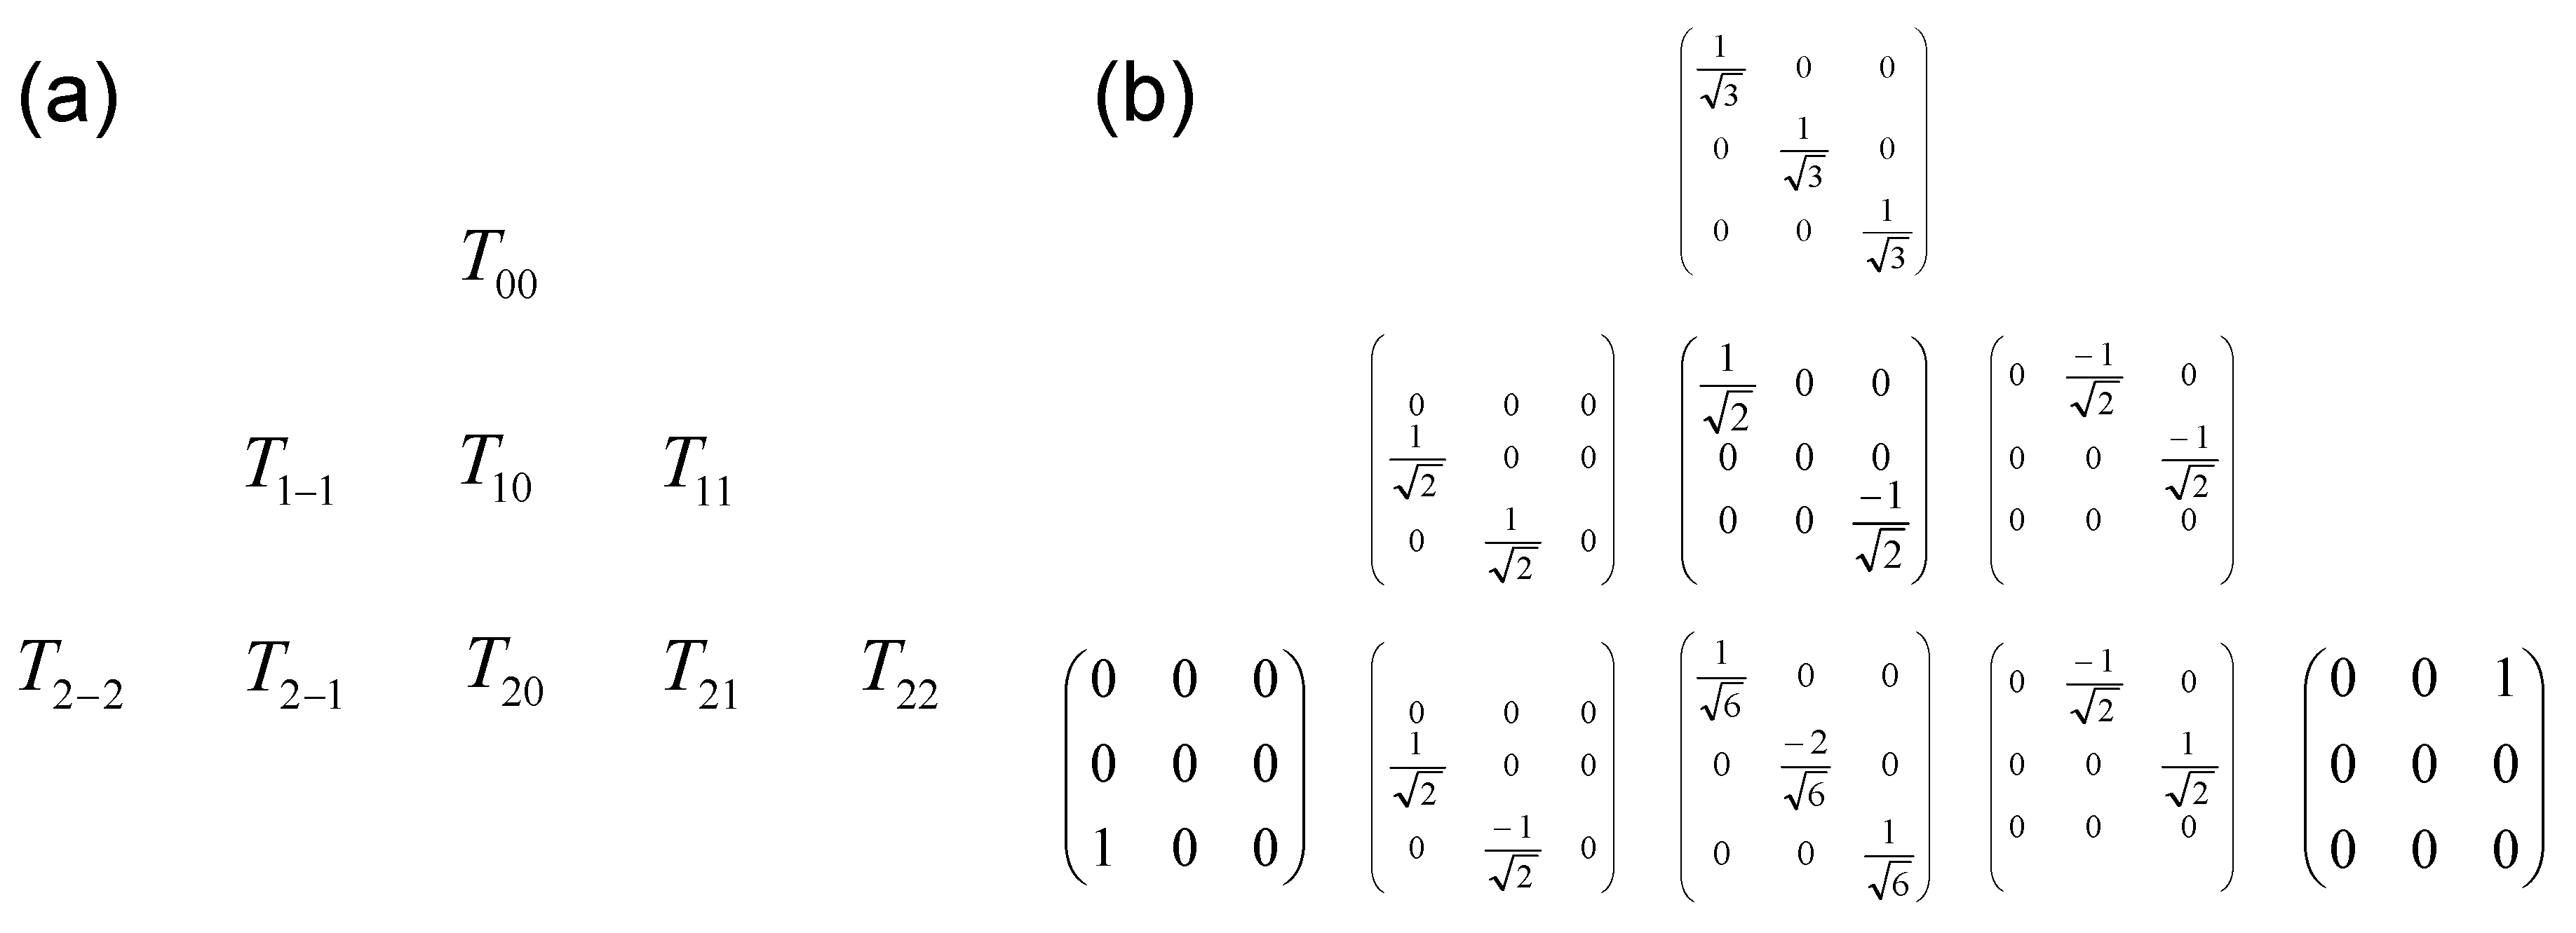
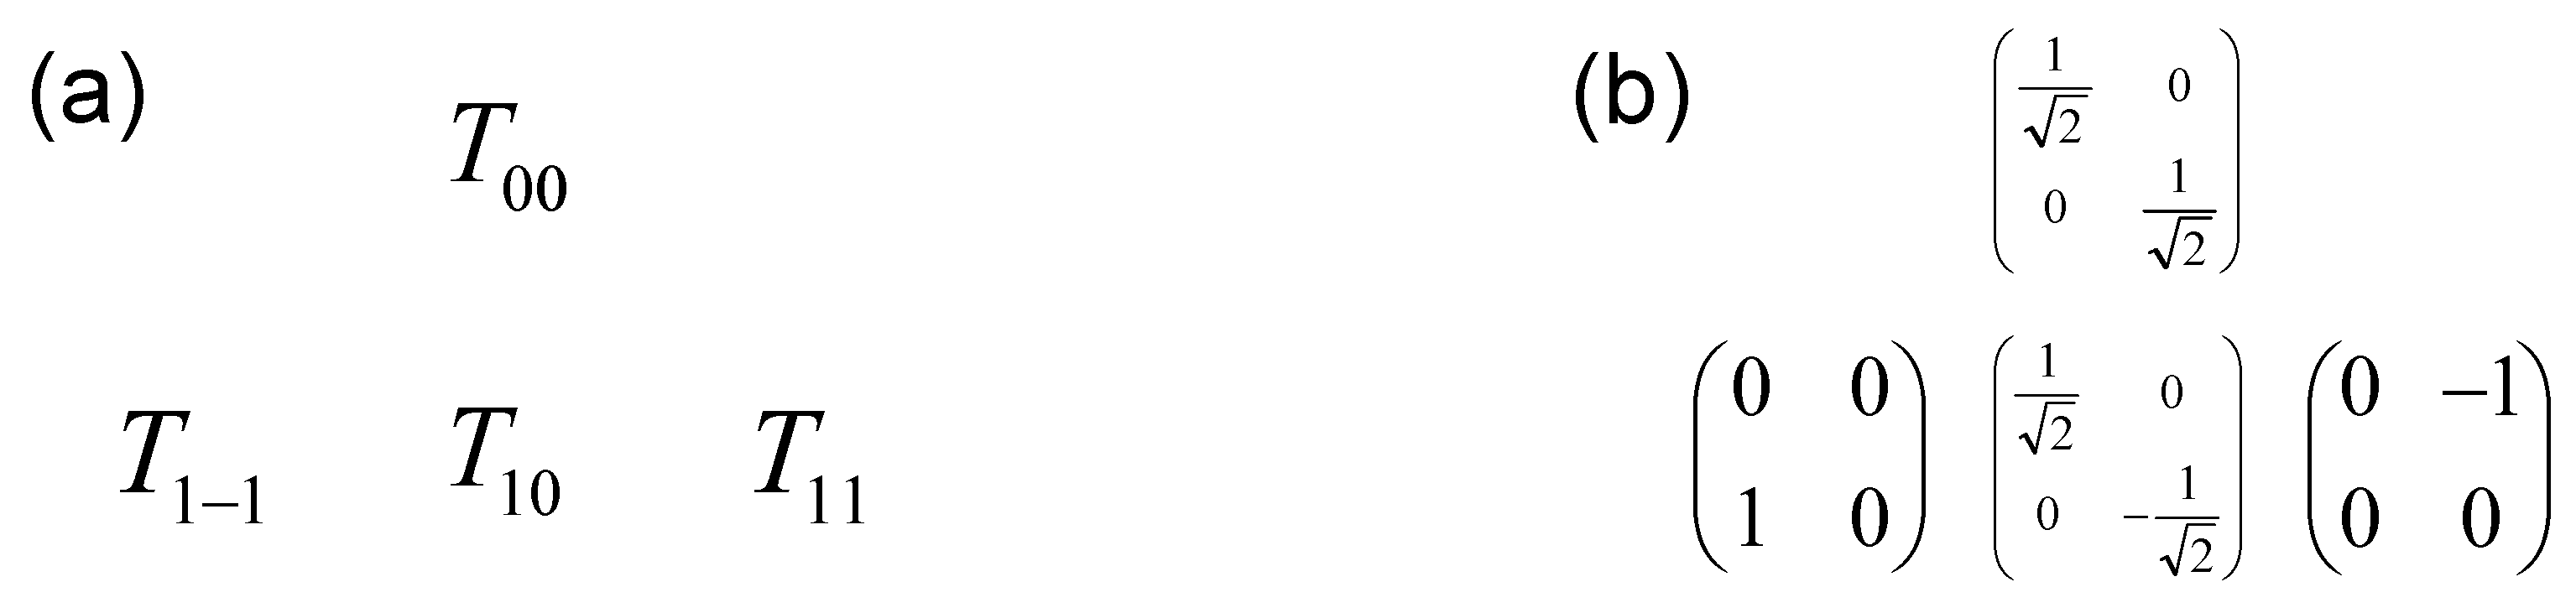
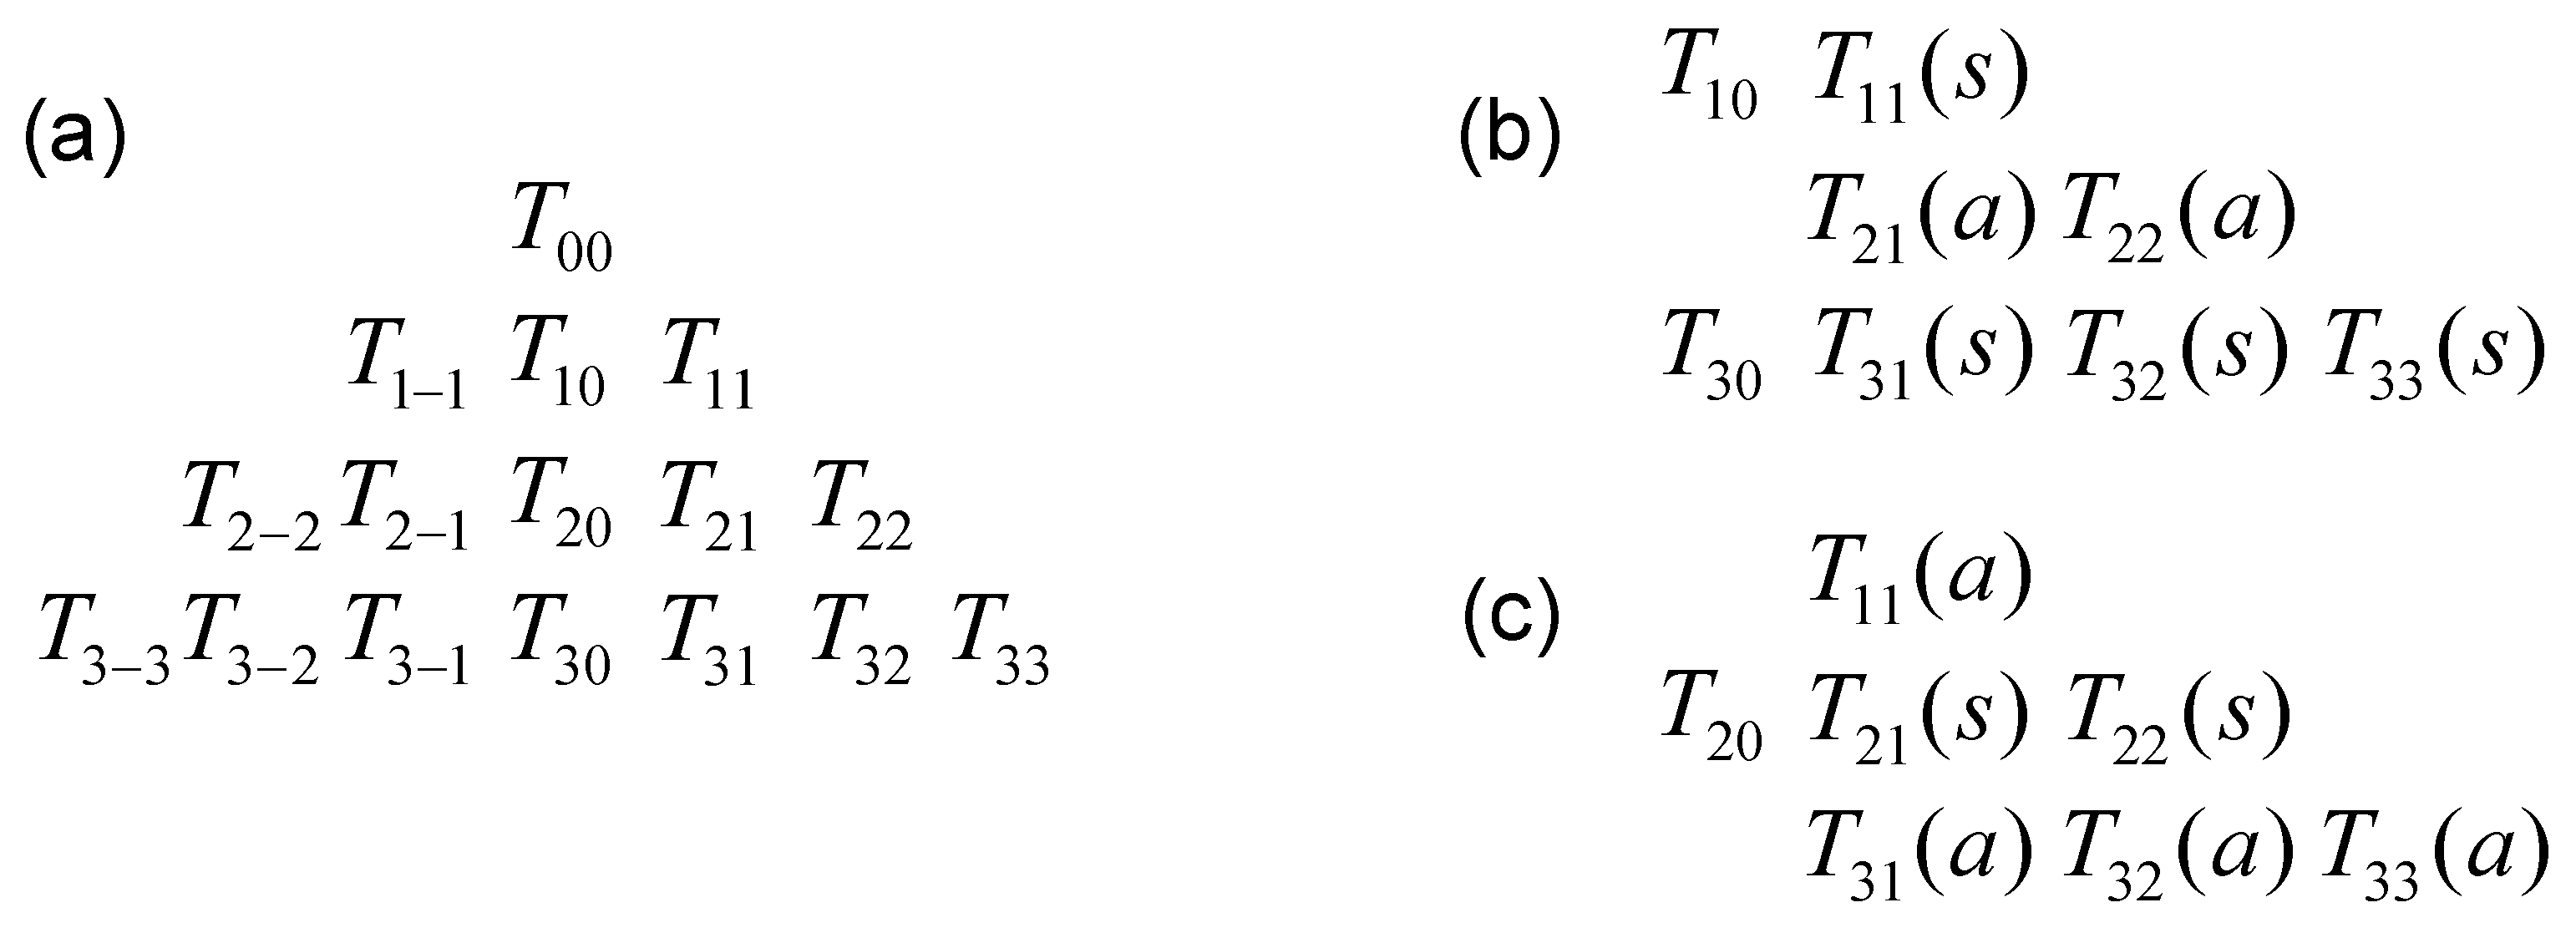
Appendix C. Matrix Representation of the Irreducible Tensor Operators

Depending on the spin state, complete orthonormal basis sets may be constructed by using the irreducible tensor operators, also called coherences [66,67,68]. Symmetric and antisymmetric combinations of the coherences [78,79,80] are also introduced:
T l p ( s ) = 1 2 ( T l p + T l p ) and T l p ( a ) = 1 2 ( T l p T l p )
By using these new coherences, the three spin operators, I x , I y and I z , become proportional to T 11 ( a ) , T 11 ( s ) and T 10 , respectively, simplifying the formulation of the Hamiltonians describing the irradiation pulse and the heteronuclear dipolar coupling (see Equation (A8)).
As displayed in Figure A1, Figure A2, Figure A3 and Figure A4, the size of the basis set increases significantly as a function of the spin of the nucleus.
Figure A1. Complete orthogonal basis set (four elements) describing the evolution of the spin I = 1/2 (Pauli matrices): (a) symbolic representation T i j ; (b) explicit matrix representation of irreducible tensor operators.
Magnetochemistry 03 00035 g0a1
Figure A2. Complete orthogonal basis set (nine elements) describing the evolution of the spin I = 1: (a) symbolic representation T i j ; (b) explicit matrix representation of irreducible tensor operators.
Magnetochemistry 03 00035 g0a2
Figure A3. Complete orthogonal basis set (16 elements) describing the evolution of the spin I = 3/2: (a) symbolic representation T i j ; (b) first subset of eight independent coherences T i j ( a , s ) including the T 10 coherence; and (c) second subset of seven independent coherences T i j ( a , s ) including the T 20 coherence.
Magnetochemistry 03 00035 g0a3
Figure A4. Orthogonal basis set (63 elements) describing the evolution of the spin I = 7/2: (a) first subset of 32 independent coherences T i j ( a , s ) including the T 10 coherence; and (b) second subset of 31 independent coherences T i j ( a , s ) including the T 20 coherence.
Magnetochemistry 03 00035 g0a4

Appendix D. Application to the Relaxation of Quadrupolar Nuclei

The differential equation describing the time evolution of the coherences (Equations (A10)–(A15)) may be written in a matrix form. To simplify the derivations of these matrices, we selected symmetric and antisymmetric combinations of the coherences [78,79,80]; see Equation (A17). By using these coherences, the three spin operators, I x , I y and I z , become proportional to T 11 ( a ) , T 11 ( s ) and T 10 , respectively, simplifying the formulation of the Hamiltonians describing the irradiation pulse and the heteronuclear dipolar coupling (see Equations (A7)–(A9)).
For spin I = 1 nuclei, the time evolution of the coherences under the influence of the static Hamiltonian (denoted H S * in Equation (A10)) including the residual quadrupolar coupling ( ω Q ) and the irradiation pulse ( ω 1 ) becomes [18,78]:
d d t T 20 T 11 ( a ) T 21 ( s ) T 22 ( s ) T 10 T 11 ( s ) T 21 ( a ) T 22 ( a ) = i 0 0 3 ω 1 0 0 0 0 0 0 0 ω Q 0 0 0 0 0 3 ω 1 ω Q 0 ω 1 0 0 0 0 0 0 ω 1 0 0 0 0 0 0 0 0 0 0 ω 1 0 0 0 0 0 0 ω 1 0 ω Q 0 0 0 0 0 0 ω Q 0 ω 1 0 0 0 0 0 0 ω 1 0 × T 20 T 11 ( a ) T 21 ( s ) T 22 ( s ) T 10 T 11 ( s ) T 21 ( a ) T 22 ( a )
leading to two independent sub-sets of coherences. Analytical derivation of the eigenvalues ± i λ p with p { 0 , , 3 } and their corresponding eigenvectors v p are used to derive the general solutions of Equation (A18) [40,78]. Among others, two coherences are of practical interest for the interpretation of spin-locking relaxation measurements:
e i H S * τ T 20 e i H S * τ = 3 ω 1 ω Q 1 cos ( λ 1 τ ) λ 1 2 T 11 ( a ) + ω Q 2 + ω 1 2 ( 1 3 cos ( λ 1 τ ) ) λ 1 2 T 20 i 3 ω 1 sin ( λ 1 τ ) λ 1 T 21 ( s ) + 3 ω 1 2 cos ( λ 1 τ ) 1 λ 1 2 T 22 ( s )
and
e i H S * τ T 10 e i H S * τ = λ 2 cos ( λ 3 τ ) + λ 3 cos ( λ 2 τ ) λ 1 T 10 i ω 1 sin ( λ 3 τ ) + sin ( λ 2 τ ) λ 1 T 11 ( s ) + ω 1 cos ( λ 3 τ ) cos ( λ 2 τ ) λ 1 T 21 ( a ) i λ 2 sin ( λ 3 τ ) λ 3 sin ( λ 2 τ ) λ 1 T 22 ( a )
where the characteristic angular velocities λ 0 , λ 1 , λ 2 and λ 3 are defined by:
λ 0 = 0 , λ 1 = ω Q 2 + 4 ω 1 2 , λ 2 = λ 1 + ω Q 2 , and λ 3 = λ 1 ω Q 2 respectively .
As a consequence, under the simultaneous influences of the residual quadrupolar coupling ( ω Q ) and the irradiation pulse ( ω 1 ), the T 20 coherence oscillates according to the angular velocity λ 1 , while two angular velocities ( λ 2 and λ 3 ) drive the oscillations of the T 10 coherence.
Straightforward calculations of the set of Equations (A14) and (A15) lead to the contributions of the quadrupolar [78] and heteronuclear dipolar [18] relaxation mechanisms to the time evolution of the coherences.
d d t T 20 T 11 ( a ) T 21 ( s ) T 22 ( s ) T 10 T 11 ( s ) T 21 ( a ) T 22 ( a ) = diag ( A , B , C , D , E , B , C , D ) × T 20 T 11 ( a ) T 21 ( s ) T 22 ( s ) T 10 T 11 ( s ) T 21 ( a ) T 22 ( a )
with:
A Q = 3 J 1 Q ( ω 1 ) and A D = J 0 D ( ω 0 ω S ) 3 + J 1 D ( ω 0 ) + 2 J 2 D ( ω 0 + ω S )
B Q = 3 J 0 Q ( 0 ) 2 + 5 J 1 Q ( ω 0 ) 2 + J 2 Q ( 2 ω 0 ) and B D = 2 J 0 D ( 0 ) 9 + J 0 D ( ω 0 ω S ) 18 + J 1 D ( ω 0 ) 6 + J 1 D ( ω S ) 3 + J 2 D ( ω 0 + ω S ) 3
C Q = 3 J 0 Q ( 0 ) 2 + J 1 Q ( ω 0 ) 2 + J 2 Q ( 2 ω 0 ) and C D = 2 J 0 D ( 0 ) 9 + 5 J 0 D ( ω 0 ω S ) 18 + 5 J 1 D ( ω 0 ) 6 + J 1 D ( ω S ) 3 + 5 J 2 D ( ω 0 + ω S ) 3
D Q = J 1 Q ( ω 0 ) + 2 J 2 Q ( 2 ω 0 ) and D D = 8 J 0 D ( 0 ) 9 + J 0 D ( ω 0 ω S ) 9 + J 1 D ( ω 0 ) 3 + 4 J 1 D ( ω S ) 3 + 2 J 2 D ( ω 0 + ω S ) 3
E Q = J 1 Q ( ω 0 ) + 4 J 2 Q ( 2 ω 0 ) and E D = J 0 D ( ω 0 ω S ) 9 + J 1 D ( ω 0 ) 3 + 2 J 2 D ( ω 0 + ω S ) 3
Under the slow modulation of the quadrupolar and heteronuclear dipolar couplings, i.e., when:
J 0 X ( 0 ) > > J m X ( ω 0 ) > > J m X ( ω S ) with m { 1 , 2 } and X { Q , D }
the set of equations in Equation (A22a–e) reduces to [51,52]:
A = 3 U Q + U D B = C = 3 J 0 Q ( 0 ) 2 + 5 U Q 2 + 2 J 0 D ( 0 ) 9 + U D 2 D = 3 U Q + 8 J 0 D ( 0 ) 9 + U D E = 5 U Q + U D 3 where U Q = J 1 Q ( ω 0 ) J 2 Q ( 2 ω 0 ) and : U D = J 0 D ( ω S ω 0 ) 3 + J 1 D ( ω 0 ) + 2 J 1 D ( ω S + ω 0 )
Four independent measurements of the relaxation of the T 20 , T 11 , T 22 and T 10 coherences lead then to the four dominant contributions ( U Q , J 0 Q ( 0 ) , U D and J 0 D ( 0 ) ) quantifying the quadrupolar and heteronuclear dipolar relaxation mechanisms [51,52].
The derivation of the time evolution of the coherences under the spin-locking condition requires taking into account the evolution of the fluctuating part of the quadrupolar [78] and dipolar [40] Hamiltonians under the influence of the static Hamiltonians as described by the term e i H S * τ H X F * + ( t τ ) e i H S * τ in Equation (A12). In the next approximation, we focus only on the m = 0 component of the fluctuating Hamiltonians because their m = 1 and m = 2 components oscillate at angular velocities ( ω 0 and 2 ω 0 ) (cf. Equation (A14)) much larger than the characteristic angular velocities ( λ i ) (cf. Equations (A19a)–(A20)). By using Equation (A19a,b), that approximation leads to:
d d t T 20 T 11 ( a ) T 21 ( s ) T 22 ( s ) T 10 T 11 ( s ) T 21 ( a ) T 22 ( a ) = A 3 K 0 0 0 0 0 0 0 B 0 2 K D 0 0 0 0 0 0 C 0 0 0 0 0 0 K Q + K D 0 D 0 0 0 0 0 0 0 0 E 0 0 K 0 0 0 0 0 L 0 2 K D 0 0 0 0 0 0 M 0 0 0 0 0 0 K Q + K D 0 D × T 20 T 11 ( a ) T 21 ( s ) T 22 ( s ) T 10 T 11 ( s ) T 21 ( a ) T 22 ( a )
with:
A Q = 3 J 1 Q ( ω 0 ) and A D = J 0 D ( ω 0 ω S ) 3 + J 1 D ( ω 0 ) + 2 J 2 D ( ω 0 + ω S )
B Q = 3 ω Q 2 J 0 Q ( 0 ) + 4 ω 1 2 J 0 Q ( λ 1 ) 2 λ 1 2 + 5 J 1 Q ( ω 0 ) 2 + J 2 Q ( 2 ω 0 ) and B D = 2 λ 2 J 0 D ( λ 3 ) + λ 3 J 0 D ( λ 2 ) 9 λ 1 + J 0 D ( ω 0 ω S ) 18 + J 1 D ( ω 0 ) 6 + J 1 D ( ω S ) 3 + J 2 D ( ω 0 + ω S ) 3
C Q = 3 ω Q 2 J 0 Q ( 0 ) + 4 ω 1 2 J 0 Q ( λ 1 ) 2 λ 1 2 + J 1 Q ( ω 0 ) 2 + J 2 Q ( 2 ω 0 ) and C D = 2 λ 2 J 0 D ( λ 3 ) + λ 3 J 0 D ( λ 2 ) 9 λ 1 + 5 J 0 D ( ω 0 ω S ) 18 + 5 J 1 D ( ω 0 ) 6 + J 1 D ( ω S ) 3 + 5 J 2 D ( ω 0 + ω S ) 3
D Q = J 1 Q ( ω 0 ) + 2 J 2 Q ( 2 ω 0 ) and D D = 8 J 0 D ( 0 ) 9 + J 0 D ( ω 0 ω S ) 9 + J 1 D ( ω 0 ) 3 + 4 J 1 D ( ω S ) 3 + 2 J 2 D ( ω 0 + ω S ) 3
E Q = J 1 Q ( ω 0 ) + 4 J 2 Q ( 2 ω 0 ) and E D = J 0 D ( ω 0 ω S ) 9 + J 1 D ( ω 0 ) 3 + 2 J 2 D ( ω 0 + ω S ) 3
L Q = 3 ω Q 2 J 0 Q ( 0 ) + 6 ω 1 2 J 0 Q ( 0 ) + J 0 Q ( λ 1 ) 2 λ 1 2 + 5 J 1 Q ( ω 0 ) 2 + 2 J 2 Q ( 2 ω 0 ) and L D = 2 λ 2 J 0 D ( λ 3 ) + λ 3 J 0 D ( λ 2 ) 9 λ 1 + J 0 D ( ω 0 ω S ) 18 + J 1 D ( ω 0 ) 6 + J 1 D ( ω S ) 3 + J 2 D ( ω 0 + ω S ) 3
M Q = 3 ω Q 2 J 0 Q ( 0 ) + 2 ω 1 2 J 0 Q ( 0 ) + J 0 Q ( λ 1 ) 2 λ 1 2 + J 1 Q ( ω 0 ) 2 + J 2 Q ( 2 ω 0 ) and M D = 2 λ 2 J 0 D ( λ 3 ) + λ 3 J 0 D ( λ 2 ) 9 λ 1 + 5 J 0 D ( ω 0 ω S ) 18 + 5 J 1 D ( ω 0 ) 6 + J 1 D ( ω S ) 3 + 5 J 2 D ( ω 0 + ω S ) 3
K Q = 3 ω 1 ω Q ( J 0 Q ( 0 ) J 0 Q ( λ 1 ) ) 2 λ 1 2 and K D = 2 ω 1 J 0 D ( λ 3 ) J 0 D ( λ 2 ) 9 λ 1
As mentioned above, the quadrupolar relaxation mechanism (implying the T 20 coherence) samples the spectral densities at the angular velocity λ 1 , while the heteronuclear dipolar relaxation mechanism (implying the T 10 coherence) samples the two other angular velocities ( λ 2 and λ 3 ), extending notably the dynamical range probed by spin-locking relaxation measurements.
For spin I = 3/2 nuclei, the whole set of coherences splits again into two independent sub-sets [79,80], namely { T 11 ( a ) , T 20 , T 21 ( s ) , T 22 ( s ) , T 31 ( a ) , T 32 ( a ) , T 33 ( a ) } and { T 10 , T 11 ( s ) , T 21 ( a ) ), T 22 ( a ) , T 30 , T 31 ( s ) , T 32 ( s ) , T 33 ( s ) }; see Figure A3. The eigenvalues ± i λ p with p { 0 , , 6 } describing their time evolution under the influence of the static quadrupolar Hamiltonian and irradiation pulse [64,79,80] are given by:
λ 0 = 0 λ 1 = ω Q 2 + 2 ω 1 ω Q + 4 ω 1 2 λ 2 = ω Q 2 2 ω 1 ω Q + 4 ω 1 2 λ 3 = ω 1 + ω Q 2 + 4 ω 1 2 + λ 1 λ 2 2 λ 4 = ω 1 + ω Q 2 + 4 ω 1 2 λ 1 λ 2 2 λ 5 = ω 1 ω Q 2 + 4 ω 1 2 + λ 1 λ 2 2 λ 6 = ω 1 ω Q 2 + 4 ω 1 2 λ 1 λ 2 2
By contrast, the corresponding eigenvectors must be calculated numerically [83].
For spin I = 7/2 nuclei, no analytical solutions are available, and the eigenvalues and eigenvectors describing the time evolution of the 63 coherences must be solved numerically [55].

References

  1. Israelachvili, J.N. Intermolecular and Surface Forces; Academic Press: New York, NY, USA, 1985. [Google Scholar]
  2. Henderson, D. Fundamentals of Inhomogeneous Fluids; M. Dekker: New York, NY, USA, 1992. [Google Scholar]
  3. Jobbagy, M.; Iyi, N. Interplay of charge density and relative humidity on the structure of nitrate layered double hydroxides. J. Phys. Chem. C 2010, 114, 18153–18158. [Google Scholar] [CrossRef]
  4. Lee, S.S.; Fenter, P.; Park, C.; Sturchio, N.C.; Nagy, K.L. Hydrated cation speciation at the Muscovite (001)-water interface. Langmuir 2010, 26, 16647–16651. [Google Scholar] [CrossRef] [PubMed]
  5. Boily, J.F. Water structure and hydrogen bonding at Goethite/water interfaces: Implications for proton affinities. J. Phys. Chem. C 2012, 116, 4714–4724. [Google Scholar] [CrossRef]
  6. Ho, T.A.; Argyris, D.; Cole, D.R.; Striolo, A. Aqueous NaCl and CsCl solutions confined in crystalline slit-shaped silica nanopores of varying degree of protonation. Langmuir 2012, 28, 1256–1266. [Google Scholar] [CrossRef] [PubMed]
  7. Malani, A.; Ayappa, K.G. Relaxation and jump dynamics of water at the mica interface. J. Chem. Phys. 2012, 136, 194701. [Google Scholar] [CrossRef] [PubMed]
  8. Buyukdagli, S.; Blossey, R. Dipolar correlations in structured solvents under nanoconfinement. J. Chem. Phys. 2014, 140, 234903. [Google Scholar] [CrossRef] [PubMed]
  9. Sato, K.; Fujimoto, K.; Dai, W.; Hunger, M. Molecular mechanism of heavily adhesive Cs: Why radioactive Cs is not decontaminated from soil. J. Phys. Chem. C 2013, 117, 14075–14080. [Google Scholar] [CrossRef]
  10. Jiménez-Ruiz, M.; Ferrage, E.; Delville, A.; Michot, L.J. Anisotropy on the collective dynamics of water confined in swelling clay minerals. J. Phys. Chem. A 2012, 116, 2379–2387. [Google Scholar] [CrossRef] [PubMed]
  11. Michot, L.J.; Ferrage, E.; Delville, A.; Jiménez-Ruiz, M. Influence of layer charge, hydration state and cation nature on the collective dynamics of interlayer water in synthetic swelling clay minerals. Appl. Clay Sci. 2016, 119, 375–384. [Google Scholar] [CrossRef]
  12. Jiménez-Ruiz, M.; Ferrage, E.; Blanchard, M.; Fernandez-Castanon, J.; Delville, A.; Johnson, M.R.; Michot, L.J. Combination of inelastic neutron scattering experiments and ab Initio quantum calculations for the study of the hydration properties of oriented Saponites. J. Phys. Chem. C 2017, 121, 5029–5040. [Google Scholar] [CrossRef]
  13. Michot, L.J.; Delville, A.; Humbert, B.; Plazanet, M.; Levitz, P. Diffusion of water in a synthetic clay with tetrahedral charges by combined neutron time-of-flight measurements and molecular dynamics simulations. J. Phys. Chem. C 2007, 111, 9818–9831. [Google Scholar] [CrossRef]
  14. Michot, L.J.; Ferrage, E.; Jiménez-Ruiz, M.; Boehm, M.; Delville, A. Anisotropic features of water and ion dynamics in synthetic Na- and Ca-smectites with tetrahedral layer charge. A combined Quasi-Elastic Neutron-Scattering and Molecular Dynamics simulations study. J. Phys. Chem. C 2012, 116, 16619–16633. [Google Scholar] [CrossRef]
  15. Callaghan, P.T. Principles of Nuclear Magnetic Resonance Microscopy; Clarendon Press: Oxford, UK, 1991. [Google Scholar]
  16. Delville, A.; Porion, P.; Faugère, A.M. Ion diffusion within charged porous network as probed by nuclear quadrupolar relaxation. J. Phys. Chem. B 2000, 104, 1546–1551. [Google Scholar] [CrossRef]
  17. Bryar, T.R.; Daughney, C.J.; Knight, R.J. Paramagnetic effects of iron(III) species on nuclear magnetic relaxation of fluid protons in porous media. J. Magn. Reson. 2000, 142, 74–85. [Google Scholar] [CrossRef] [PubMed]
  18. Porion, P.; Michot, L.J.; Faugère, A.M.; Delville, A. Structural and dynamical properties of the water molecules confined in dense clay sediments: A study combining 2H NMR spectroscopy and multiscale numerical modeling. J. Phys. Chem. C 2007, 111, 5441–5453. [Google Scholar] [CrossRef]
  19. Gao, Y.; Zhang, R.; Lv, W.; Liu, Q.; Wang, X.; Sun, P.; Winter, H.H.; Xue, G. Critical effect of segmental dynamics in polybutadiene/clay nanocomposites characterized by solid state 1H NMR spectroscopy. J. Phys. Chem. C 2014, 118, 5606–5614. [Google Scholar] [CrossRef]
  20. Bortolotti, V.; Brizi, L.; Brown, R.J.S.; Fantazzini, P.; Mariani, M. Nano and sub-nano multiscale porosity formation and other features revealed by 1H NMR relaxometry during cement hydration. Langmuir 2014, 30, 10871–10877. [Google Scholar] [CrossRef] [PubMed]
  21. Halle, B. Spin dynamics of exchanging quadrupolar nuclei in locally anisotropic systems. Prog. Nucl. Magn. Reson. Spectrosc. 1996, 28, 137–159. [Google Scholar] [CrossRef]
  22. Woessner, D.E. Nuclear transfer effects in Nuclear Magnetic Resonance pulse experiments. J. Chem. Phys. 1961, 35, 41–48. [Google Scholar] [CrossRef]
  23. Abragam, A. The Principles of Nuclear Magnetism; Clarendon Press: Oxford, UK, 1961. [Google Scholar]
  24. Kimmich, R. NMR: Tomography, Diffusometry, Relaxometry; Springer: Berlin, Germany, 1997. [Google Scholar]
  25. Delville, A.; Stöver, H.D.H.; Detellier, C. Crown-ether cation decomplexation mechanics. 23Na NMR studies of the sodium cation complexes with dibenzo-24-crown-8 and dibenzo-18-crown-6 in nitromethane and acetonitrile. J. Am. Chem. Soc. 1987, 109, 7293–7301. [Google Scholar] [CrossRef]
  26. Delville, A.; Detellier, C.; Laszlo, P. Determination of the correlation time for a slowly reorienting spin-3/2 nucleus: Binding of Na+ with the 5’-GMP supramolecular assembly. J. Magn. Reson. 1979, 34, 301–315. [Google Scholar]
  27. Delville, A.; Grandjean, J.; Laszlo, P.; Gerday, C.; Grabarek, Z.; Drabikowski, W. Sodium-23 nuclear magnetic resonance as an indicator of sodium binding to Troponin C and tryptic fragments, in relation to calcium content and attendant conformational changes. Eur. J. Biochem. 1980, 105, 289–295. [Google Scholar] [CrossRef] [PubMed]
  28. Delville, A.; Laszlo, P.; Schyns, R. Displacement of sodium ions by surfactant ions from DNA: A 23Na NMR investigation. Biophys. Chem. 1986, 24, 121–133. [Google Scholar] [CrossRef]
  29. Liu, G.; Li, Y.; Jonas, J. Confined geometry effects on reorientational dynamics of molecular liquids in porous silica glasses. J. Chem. Phys. 1991, 95, 6892–6901. [Google Scholar] [CrossRef]
  30. Korb, J.P.; Whaley-Hodges, M.; Bryant, R.G. Translational diffusion of liquids at surfaces of microporous materials: Theoretical analysis of field-cycling magnetic relaxation measurements. Phys. Rev. E 1997, 56, 1934–1945. [Google Scholar] [CrossRef]
  31. Levitz, P.E. Confined dynamics, forms and transitions in colloidal systems: From clay to DNA. Magn. Reson. Imaging 2005, 23, 147–152. [Google Scholar] [CrossRef] [PubMed]
  32. Korb, J.P. Nuclear magnetic relaxation of liquids in porous media. New J. Phys. 2011, 13, 035016. [Google Scholar] [CrossRef]
  33. Delville, A.; Letellier, M. Structure and dynamics of simple liquids in heterogeneous condition: An NMR study of the clay water interface. Langmuir 1995, 11, 1361–1367. [Google Scholar] [CrossRef]
  34. Avogadro, A.; Villa, M. Nuclear magnetic resonance in a two-dimensional system. J. Chem. Phys. 1977, 66, 2359–2367. [Google Scholar] [CrossRef]
  35. Korb, J.P.; Ahadi, M.; McConnell, H.M. Paramagnetically enhanced nuclear relaxation in lamellar phases. J. Phys. Chem. 1987, 91, 1255–1259. [Google Scholar] [CrossRef]
  36. Korb, J.P.; Delville, A.; Xu, S.; Demeulenaere, G.; Costa, P.; Jonas, J. Relative Role of Surface Interactions and Topological Effects in Nuclear-Magnetic-Resonance of Confined Liquids. J. Chem. Phys. 1994, 101, 7074–7081. [Google Scholar] [CrossRef]
  37. Pasquier, V.; Levitz, P.; Delville, A. 129Xe NMR as a probe of gas diffusion and relaxation in disordered porous media: An application to Vycor. J. Phys. Chem. 1996, 100, 10249–10256. [Google Scholar] [CrossRef]
  38. Korb, J.P.; Malier, L.; Cros, F.; Xu, S.; Jonas, J. Surface dynamics of liquids in nanopores. Phys. Rev. Lett. 1996, 77, 2312–2315. [Google Scholar] [CrossRef] [PubMed]
  39. Faux, D.A.; McDonald, P.J.; Howlett, N.C. Nuclear-magnetic-resonance relaxation due to the translational diffusion of fluid confined to quasi-two-dimensional pores. Phys. Rev. E 2017, 95, 033116. [Google Scholar] [CrossRef] [PubMed]
  40. Porion, P.; Michot, L.J.; Faugère, A.M.; Delville, A. Influence of confinement on the long-range mobility of water molecules within clay aggregates: A 2H NMR analysis using spin-locking relaxation rates. J. Phys. Chem. C 2007, 111, 13117–13128. [Google Scholar] [CrossRef]
  41. Trausch, G.; Canet, D.; Cadène, A.; Turq, P. Separation of components of a 1H NMR composite signal by nutation experiments under low amplitude radio-frequency fields. Application to the water signal in clays. Chem. Phys. Lett. 2006, 433, 228–233. [Google Scholar] [CrossRef]
  42. Fleury, M.; Canet, D. Water orientation in smectites using NMR nutation experiments. J. Phys. Chem. C 2014, 118, 4733–4740. [Google Scholar] [CrossRef]
  43. Volgmann, K.; Epp, V.; Langer, J.; Stanje, B.; Heine, J.; Nakhal, S.; Lerch, M.; Wilkening, M.; Heitjans, P. Solid-state NMR to study translational Li ion dynamics in solids with low-dimensional diffusion pathways. Z. Phys. Chem. 2017, 231, 1215–1241. [Google Scholar] [CrossRef]
  44. Godefroy, S.; Fleury, M.; Deflandre, F.; Korb, J.P. Temperature effect on NMR surface relaxation in rocks for well logging applications. J. Phys. Chem. B 2002, 106, 11183–11190. [Google Scholar] [CrossRef]
  45. Leon, N.; Korb, J.P.; Bonalde, I.; Levitz, P. Universal nuclear spin relaxation and long-range order in nematics strongly confined in mass fractal silica gels. Phys. Rev. Lett. 2004, 92, 195504. [Google Scholar] [CrossRef] [PubMed]
  46. Kruk, D.; Meier, R.; Rössler, E.A. Nuclear magnetic resonance relaxometry as a method of measuring translational diffusion coefficients in liquids. Phys. Rev. E 2012, 85, 020201(R). [Google Scholar] [CrossRef] [PubMed]
  47. Muncaci, S.; Mattea, C.; Stapf, S.; Ardelean, I. Frequency-dependent NMR relaxation of liquids confined inside porous media containing an increased amount of magnetic impurities. Magn. Reson. Chem. 2013, 51, 123–128. [Google Scholar] [CrossRef] [PubMed]
  48. Kimmich, R.; Fatkullin, N. Self-diffusion studies by intra- and inter-molecular spin-lattice relaxometry using field-cycling: Liquids, plastic crystals, porous media, and polymer segments. Prog. Nucl. Magn. Reson. Spectrosc. 2017, 101, 18–50. [Google Scholar] [CrossRef] [PubMed]
  49. Harris, R.K.; Mann, B.E. NMR and the Periodic Table; Academic Press: London, UK, 1978. [Google Scholar]
  50. Porion, P.; Delville, A. Multinuclear NMR study of the structure and micro-dynamics of counterions and water molecules within clay colloids. Curr. Opin. Colloid Interface Sci. 2009, 14, 216–222. [Google Scholar] [CrossRef]
  51. Porion, P.; Michot, L.J.; Warmont, F.; Faugère, A.M.; Delville, A. Long-time dynamics of confined water molecules probed by 2H NMR multiquanta relaxometry: An application to dense clay sediments. J. Phys. Chem. C 2012, 116, 17682–17697. [Google Scholar] [CrossRef]
  52. Porion, P.; Faugère, A.M.; Delville, A. Multiscale water dynamics within dense clay sediments probed by 2H multiquanta NMR relaxometry and two-time stimulated echo NMR spectroscopy. J. Phys. Chem. C 2013, 117, 26119–26134. [Google Scholar] [CrossRef]
  53. Porion, P.; Faugère, A.M.; Delville, A. Structural and dynamical properties of water molecules confined within clay sediments probed by deuterium NMR spectroscopy, multiquanta relaxometry, and two-time stimulated echo attenuation. J. Phys. Chem. C 2014, 118, 20429–20444. [Google Scholar] [CrossRef]
  54. Porion, P.; Faugère, A.M.; Delville, A. Long-time scale ionic dynamics in dense clay sediments measured by the frequency variation of the 7Li multiple-quantum NMR relaxation rates in relation with a multiscale modeling. J. Phys. Chem. C 2009, 113, 10580–10597. [Google Scholar] [CrossRef]
  55. Porion, P.; Warmont, F.; Faugère, A.M.; Rollet, A.L.; Dubois, E.; Marry, V.; Michot, L.J.; Delville, A. 133Cs Nuclear Magnetic Resonance relaxometry as a probe of the mobility of cesium cations confined within dense clay sediments. J. Phys. Chem. C 2015, 119, 15360–15372. [Google Scholar] [CrossRef]
  56. Rinnert, E.; Carteret, C.; Humbert, B.; Fragneto-Cusani, G.; Ramsay, J.D.F.; Delville, A.; Robert, J.L.; Bihannic, I.; Pelletier, M.; Michot, L.J. Hydration of a synthetic clay with tetrahedral charges: A multidisciplinary experimental and numerical study. J. Phys. Chem. B 2005, 109, 23745–23759. [Google Scholar] [CrossRef] [PubMed]
  57. Ferrage, E.; Sakharov, B.A.; Michot, L.J.; Delville, A.; Bauer, A.; Lanson, B.; Grangeon, S.; Frapper, G.; Jiménez-Ruiz, M.; Cuello, G.J. Hydration properties and interlayer organization of water and ions in synthetic Na-smectite with tetrahedral layer charge. Part 2. Toward a precise coupling between molecular simulations and diffraction data. J. Phys. Chem. C 2011, 115, 1867–1881. [Google Scholar] [CrossRef]
  58. Dazas, B.; Lanson, B.; Delville, A.; Robert, J.L.; Komarneni, S.; Michot, L.J.; Ferrage, E. Influence of tetrahedral layer charge on the organization of interlayer water and ions in synthetic Na-saturated smectites. J. Phys. Chem. C 2015, 119, 4158–4172. [Google Scholar] [CrossRef]
  59. Böhmer, R.; Qi, F. Spin relaxation and ultra-slow Li motion in an aluminosilicate glass ceramic. Solid State Nucl. Magn. Reson. 2007, 31, 28–34. [Google Scholar] [CrossRef] [PubMed]
  60. Porion, P.; Faugère, A.M.; Delville, A. Long-distance water exchange within dense clay sediments probed by two-time 2H stimulated echo NMR spectroscopy. J. Phys. Chem. C 2013, 117, 9920–9931. [Google Scholar] [CrossRef]
  61. Michot, L.J.; Bihannic, I.; Porsch, K.; Maddi, S.; Baravian, C.; Mougel, J.; Levitz, P. Phase diagrams of Wyoming Na-Montmorillonite clay. Influence of particle anisotropy. Langmuir 2004, 20, 10829–10837. [Google Scholar] [CrossRef] [PubMed]
  62. Edmonds, D.T.; Hunt, M.J.; Mackay, A.L. Deuteron interactions in pure quadrupole-resonance. J. Magn. Reson. 1975, 20, 505–514. [Google Scholar] [CrossRef]
  63. Mehring, M. Principles of High Resolution NMR in Solids, 2nd ed.; Springer: Berlin, Germany, 1983. [Google Scholar]
  64. Porion, P.; Faugère, A.M.; Delville, A. 7Li NMR spectroscopy and multiquantum relaxation as a probe of the microstructure and dynamics of confined Li+ cations: An application to dense clay sediments. J. Phys. Chem. C 2008, 112, 9808–9821. [Google Scholar] [CrossRef]
  65. Porion, P.; Faugère, A.M.; Lécolier, E.; Gherardi, B.; Delville, A. 23Na Nuclear quadripolar relaxation as a probe of the microstructure and dynamics of aqueous clay dispersions: An application to Laponite gels. J. Phys. Chem. B 1998, 102, 3477–3485. [Google Scholar] [CrossRef]
  66. Bowden, G.J.; Hutchison, W.D. Tensor operator formalism for multiple-quantum NMR. 1. Spin-1 nuclei. J. Magn. Reson. 1986, 67, 403–414. [Google Scholar] [CrossRef]
  67. Bowden, G.J.; Hutchison, W.D.; Khachan, J. Tensor operator formalism for multiple-quantum NMR. 2. Spins-3/2, spin-2, and spin-5/2 and general I. J. Magn. Reson. 1986, 67, 415–437. [Google Scholar]
  68. Müller, N.; Bodenhausen, G.; Ernst, R.R. Relaxation-induced violations of coherence transfer selection rules in Nuclear Magnetic Resonance. J. Magn. Reson. 1987, 75, 297–334. [Google Scholar] [CrossRef]
  69. Ngouana, W.B.F.; Kalinichev, A.G. Structural arrangements of isomorphic substitutions in smectites: Molecular simulation of the swelling properties, interlayer structure, and dynamics of hydrated Cs-Montmorillonite revisited with new clay models. J. Phys. Chem. C 2014, 118, 12758–12773. [Google Scholar]
  70. Marry, V.; Turq, P.; Cartailler, T.; Levesque, D. Microscopic simulation of structure and dynamics of water and counterions in a monohydrated Montmorillonite. J. Chem. Phys. 2002, 117, 3454–3463. [Google Scholar] [CrossRef]
  71. Kosakowski, G.; Churakov, S.V.; Thoenen, T. Diffusion of Na and Cs in Montmorillonite. Clays Clay Miner. 2008, 56, 190–206. [Google Scholar] [CrossRef]
  72. Liu, X.; Lu, X.; Wang, R.; Zhou, H. Effects of layer-charge distribution on the thermodynamic and microscopic properties of Cs-smectite. Geochim. Cosmochim. Acta 2008, 72, 1837–1847. [Google Scholar] [CrossRef]
  73. Bourg, I.C.; Sposito, G. Connecting the molecular scale to the continuum scale for diffusion processes in smectite-rich porous media. Environ. Sci. Technol. 2010, 44, 2085–2091. [Google Scholar] [CrossRef] [PubMed]
  74. Zheng, Y.; Zaoui, A. How water and counterions diffuse into the hydrated Montmorillonite. Solid State Ion. 2011, 203, 80–85. [Google Scholar]
  75. Cuperlovic, M.; Meresi, G.H.; Palke, W.E.; Gerig, J.T. Spin relaxation and chemical exchange in NMR simulations. J. Magn. Reson. 2000, 142, 11–23. [Google Scholar] [CrossRef] [PubMed]
  76. Hertz, H.G. Magnetic relaxation by quadrupole interaction of ionic nuclei in electrolyte solutions. Part I: Limiting values for infinite dilution. Ber. Bunsenges. Phys. Chem. 1973, 77, 531–540. [Google Scholar] [CrossRef]
  77. Redfield, A.G. On the theory of relaxation processes. IBM J. Res. Dev. 1957, 1, 19–31. [Google Scholar]
  78. Van der Maarel, J.R.C. The relaxation dynamics of spin I=1 nuclei with a static quadrupolar coupling and a radio-frequency field. J. Chem. Phys. 1993, 99, 5646–5653. [Google Scholar] [CrossRef]
  79. Van der Maarel, J.R.C. Thermal relaxation and coherence dynamics of spin 3/2. I. Static and fluctuating quadrupolar interactions in the multipole basis. Concepts Magn. Reson. Part A 2003, 19A, 97–116. [Google Scholar] [CrossRef]
  80. Van der Maarel, J.R.C. Thermal relaxation and coherence dynamics of spin 3/2. II. Strong radio-frequency field. Concepts Magn. Reson. Part A 2003, 19A, 117–133. [Google Scholar] [CrossRef]
  81. Kimmich, R.; Anoardo, E. Field-cycling NMR relaxometry. Prog. Nucl. Magn. Reson. Spectrosc. 2004, 44, 257–320. [Google Scholar] [CrossRef]
  82. Barbara, T.M.; Vold, R.R.; Vold, R.L. A determination of individual spectral densities in a smectic liquid-crystal from angle dependent nuclear spin relaxation measurements. J. Chem. Phys. 1983, 79, 6338–6340. [Google Scholar] [CrossRef]
  83. Porion, P.; Al-Mukhtar, M.; Meyer, S.; Faugère, A.M.; Van der Maarel, J.R.C.; Delville, A. Nematic ordering of suspensions of charged anisotropic colloids detected by 23Na Nuclear Quadrupolar Spectroscopy. J. Phys. Chem. B 2001, 105, 10505–10514. [Google Scholar] [CrossRef]
Figure 1. Schematic view of multiscale organization of the clay sediment resulting from the coexistence of clay aggregates with various orientations of the platelet directors. Reprinted with permission from [53]. Copyright (2014) American Chemical Society.
Magnetochemistry 03 00035 g001
Figure 2. (a) Snapshot illustrating one Grand Canonical Monte Carlo (GCMC) equilibrium configuration of confined water molecules and neutralizing sodium counterions; (b) concentration profiles of sodium counterions and oxygen and hydrogen atoms pertaining to water molecules confined between two beidellite clay lamellae. Reprinted with permission from [53]. Copyright (2014) American Chemical Society.
Magnetochemistry 03 00035 g002
Figure 3. Schematic view of: (a) the film orientation within the NMR tube used to insert the clay film sample into the detection coil (see the text); and (b) the different Euler angles characterizing the orientation of the clay film by reference to the static magnetic field B 0 . Reprinted with permission from [53]. Copyright (2014) American Chemical Society.
Magnetochemistry 03 00035 g003
Figure 4. (a) 2H NMR spectra as a function of the film orientation θ L F into the static magnetic field B 0 ; (b) variation of the residual quadrupolar coupling ν Q extracted from the 2H NMR spectra as a function of the film orientation θ L F into the static magnetic field B 0 . Reprinted with permission from [53]. Copyright (2014) American Chemical Society.
Magnetochemistry 03 00035 g004
Figure 5. NMR spectra recorded as a function of the film orientation θ L F of the clay sediment into the static magnetic field B 0 : (a) 7Li NMR spectra measured within laponite concentrated clay dispersions; (b) 133Cs NMR spectra measured within hectorite clay sediment. Reprinted with permission from [55]. Copyright (2015) American Chemical Society.
Magnetochemistry 03 00035 g005
Figure 6. Variations as a function of the film orientation θ L F into the static magnetic field B 0 of: (a) the apparent multi-quantum relaxation rates of the T 10 , T 11 ( a , s ) , T 20 and T 22 ( a , s ) coherences, denoted R 10 , R 11 ( a , s ) , R 20 and R 22 ( a , s ) , respectively; and (b) the apparent spectral densities J 0 Q ( 0 ) , J 0 D ( 0 ) , U Q and U D extracted from these R i j values (see Equation (A24)). Reprinted with permission from [52]. Copyright (2013) American Chemical Society.
Magnetochemistry 03 00035 g006
Figure 7. Time evolution of (a) T 11 ( s ) ; (b) T 21 ( a ) ; (c) T 21 ( s ) and (d) T 22 ( a ) coherences measured under spin-lock conditions, denoted T 11 ρ ( s ) , T 21 ρ ( a ) , T 21 ρ ( s ) and T 22 ρ ( a ) , respectively, and their Fourier transforms for (e) T 11 ( s ) ; (f) T 21 ( a ) ; (g) T 21 ( s ) and (h) T 22 ( a ) coherences (2H NMR). Reprinted with permission from [53]. Copyright (2014) American Chemical Society.
Magnetochemistry 03 00035 g007
Figure 8. (a) Variation of the intrinsic spectral densities J m Q , i n t r ( λ 1 ) with m { 0 , 1 } , describing quadrupolar coupling, and J m D , i n t r ( λ i ) with m { 0 , 1 } and i { 2 , 3 } , describing the heteronuclear dipolar coupling, as a function of the corresponding averaged angular velocities < λ i > (2H NMR); (b) average residence time of the confined water molecules obtained by numerical simulations of Brownian dynamics. Reprinted with permission from [51,53]. Copyright (2014 and 2012) American Chemical Society.
Magnetochemistry 03 00035 g008
Figure 9. For Li + ions in concentrated laponite dispersion, the comparison between the experimental and fitted time evolution of the coherences: (a) T 11 ( a ) ; (b) T 11 ( s ) ; (c) T 33 ( s ) and (d) T 33 ( a ) coherences measured under spin-lock conditions, denoted T 11 ρ ( a ) , T 11 ρ ( s ) , T 33 ρ ( s ) and T 33 ρ ( a ) , respectively, and their Fourier transforms for (e) T 11 ( a ) ; (f) T 11 ( s ) ; (g) T 33 ( s ) and (h) T 33 ( a ) coherences (7Li NMR). Reprinted with permission from [54]. Copyright (2009) American Chemical Society.
Magnetochemistry 03 00035 g009
Figure 10. Distribution of the complete set of resonance angular velocities probed by the triple-quantum filtered relaxation measurements under the spin-locking condition performed at four irradiating fields ω 1 , evaluated from the intrinsic spectral density J 0 ( λ ) (7Li NMR). Reprinted with permission from [54]. Copyright (2009) American Chemical Society.
Magnetochemistry 03 00035 g010
Figure 11. Time evolutions of the spin-locking relaxation measurements (133Cs NMR) for seven irradiation powers corresponding to various angular velocities ω 1 : (a) decreasing from 2.1 × 10 5 to 6.1 × 10 4 rad·s 1 ; and (b) decreasing from 3.2 × 10 4 to 2.7 × 10 3 rad·s 1 (see the text). Reprinted with permission from [55]. Copyright (2015) American Chemical Society.
Magnetochemistry 03 00035 g011
Figure 12. Histograms of the distribution of the angular velocities λ p Q corresponding to the quadrupolar relaxation mechanism that may be probed by the spin-locking experiments of I = 7/2 spin for irradiation powers ω 1 varying between 2.7 × 10 3 and 2.1 × 10 5 rad·s 1 (133Cs NMR). Reprinted with permission from [55]. Copyright (2015) American Chemical Society.
Magnetochemistry 03 00035 g012
Figure 13. (a) Pulse sequence and (b) coherence pathway used to measure the attenuation of the two-time 2H NMR stimulated echo I ( t e , τ M ) as a function of the evolution period t e and the mixing time τ M . Reprinted with permission from [53]. Copyright (2014) American Chemical Society.
Magnetochemistry 03 00035 g013
Figure 14. (a) Variation of the two-time stimulated echo attenuation I ( t e , τ M ) as a function of mixing time τ M (2H NMR). The data are normalized to take into account the relaxation of the T 20 coherence during the mixing time τ M (see Equation (3)). (b) Two-time correlation function extracted from the normalized stimulated echo attenuation as a function of the mixing time τ M . The red line corresponds to the best fit of a stretched exponential function, f ( t ) = A exp ( t / τ e x c h ) α , to determine the exchange time τ e x c h ( τ e x c h = 33 ± 5 ms with an exponent α set equal to 1.5), and the green line dots are obtained by numerical modeling (see the text). Reprinted with permission from [53]. Copyright (2014) American Chemical Society.
Magnetochemistry 03 00035 g014
Table 1. Set of characteristic angular velocities ( λ 1 , λ 2 , λ 3 ) detected by multi-quanta spin-locking relaxometry for 2H NMR experiments, varying the irradiation power ω 1 and the angle θ L F (see the text).
θ LF 0 30 90 0 30 90 0 30 90
ω 1 (10 5  rad/s) λ 1 (10 5  rad/s) λ 2 (10 5  rad/s) λ 3 (10 5  rad/s)
1.122 2.462.282.22 1.601.361.23 0.860.860.86
0.561 1.481.291.36 1.110.860.86 0.370.370.43
0.280 1.050.800.80 0.920.680.62 0.180.180.09
0.140 0.860.550.55 0.800.620.49 0.060.060.09
0.070 0.800.550.43 0.800.550.43 0.060.060.03

