Early Stages of Biomineral Formation—A Solid-State NMR Investigation of the Mandibles of Minipigs
by
 ,
,
Anastasia Vyalikh
1,2,*, 
Cindy Elschner
2,
Matthias C. Schulz
3,
Ronald Mai
3,4 and
Ulrich Scheler
2,* 1
Institute of Experimental Physics, Technische Universität Bergakademie Freiberg, D-09599 Freiberg, Germany
2
Leibniz-Institut für Polymerforschung Dresden, e.V., D-01069 Dresden, Germany
3
Department of Oral and Maxillofacial Surgery, University Hospital “Carl Gustav Carus”, Technische Universität Dresden, D-01307 Dresden, Germany
4
Mund-Kiefer- und Gesichtschirurgie Dr. Dr. Ronald Mai, SN D-01561 Großenhain, Germany
*
Authors to whom correspondence should be addressed.
Magnetochemistry 2017, 3(4), 39; https://doi.org/10.3390/magnetochemistry3040039
Submission received: 27 October 2017
/
Revised: 15 November 2017
/
Accepted: 17 November 2017
/
Published: 22 November 2017
(This article belongs to the Special Issue Nuclear Magnetic Resonance Spectroscopy)
Abstract
:Solid-state nuclear magnetic resonance (NMR) spectroscopy allows for the identification of inorganic species during the biomineral formation, when crystallite particles visible in direct imaging techniques have not yet been formed. The bone blocks surrounding dental implants in minipigs were dissected after the healing periods of two, four, and eight weeks, and newly formed tissues formed around the implants were investigated ex vivo. Two-dimensional 31P-1H heteronuclear correlation (HETCOR) spectroscopy is based on the distance-dependent heteronuclear dipolar coupling between phosphate- and hydrogen-containing species and provides sufficient spectral resolution for the identification of different phosphate minerals. The nature of inorganic species present at different mineralization stages has been determined based on the 31P chemical shift information. After a healing time of two weeks, pre-stages of mineralization with a rather unstructured distribution of structural motives were found. After four weeks, different structures, which can be described as nanocrystals exhibiting a high surface-to-volume ratio were detected. They grew and, after eight weeks, showed chemical structures similar to those of matured bone. In addition to hydroxyapatite, amorphous calcium phosphate, and octacalcium phosphate, observed in a reference sample of mature bone, signatures of ß-tricalcium phosphate and brushite-like structures were determined at the earlier stages of bone healing.
1. Introduction
As the main component of vertebrates’ hard tissues in bones and teeth, calcium phosphate is the most common biomineral. Unravelling the process of calcium phosphate formation in the biological environment during bone healing or remodeling is a prerequisite for an understanding of the mechanisms of biomineralization and pathological mineralization. This knowledge might lead to novel bioinspired strategies for developing advanced materials as well as preventing and treatment of calcified tissue diseases.
The mechanisms of biomineralization and pathological mineralization still remain a subject of debate. The classical physico-chemical view on nucleation and crystallization based on the association of ions from a supersaturated solution has been revised. In mineralized tissues, a key factor for the control of the nucleation, growth, and organization of hierarchical structures at different length scales is the presence of the organic matrix, which can either localize crystallization or stabilize the otherwise metastable or unstable amorphous phases [1]. It has been demonstrated that calcium-based biominerals can be formed through a complex multistage process that involves stable pre-nucleation clusters with aggregation and densification into an amorphous precursor phase and subsequent transition into a crystal [2,3]. This formation mechanism for biomineralization has been supported by in vitro studies using a combination of cryo-transmission electron microscopy and molecular modeling [4,5]. Dey et al. demonstrated heterogeneous surface-induced crystallization of hydroxyapatite (HAp) in the presence of a nucleating surface using a model system of simulated body fluid as a mineral source [5]. In the model system, the crystals were never observed together with aggregates of clusters. The in vitro mineralization studies are in agreement with in vivo experiments that have also suggested the involvement of an initial amorphous calcium phosphate phase (ACP) followed by transformation to the final HAp in forming fin bone of zebra fish [6] and in tooth enamel [7]. The degree and the time sequence of mineralization have been studied in human [8] and animal [9] bone tissues. It has been reported that the formation of new bone is a multistep process, within which the new matrix begins to mineralize after about 5–10 days from the time of deposition. The process is followed by increases in the crystal size and the number of crystals, as well as remodeling, and then stops after a period of 30 months, having reached the physiological limit of the mineral content at the tissue level. However, for a detailed understanding of the biomineralization processes, characterization on the molecular scale at all stages, including initial, intermediate, and mature mineralization phases, is required. It has been postulated long ago that ACP is formed from nanometer-sized clusters—so-called Posner’s CaP clusters—with a chemical composition Ca9(PO4)6, which are the basic units of the final apatite crystals [10]. The identification of the initial mineral phase proved to be a challenging task due to its poor crystallinity, its highly substituted nature, and a very small size of mineral clusters for visualization by microscopy techniques. In contrast to the systems studied in vitro, in organisms, other transient calcium phosphate phases such as brushite (DCPD) and octacalcium phosphate (OCP) have been implicated as phases that are intermediate to the formation of hydroxyapatite (HAp). Indeed, evidence for brushite and OCP has been reported in bone using Raman spectroscopy [11]. This demonstrates that in vivo bone formation may show different behavior compared to biomimic and in vitro grown model systems. Therefore, a detailed study on a molecular level on how biominerals are formed in organisms can shed light on the natural mineralization mechanisms. However, implementation of in vivo experiments tracing various stages of mineralization is difficult to achieve, because any non-destructive method based on real-space imaging such as magnetic resonance imaging (MRI) and computed tomography (CT) will only find structures exceeding a minimal size in space due to their inherent detection limits caused by the limits of the spatial resolution of the particular method.
Solid-state nuclear magnetic resonance (NMR) spectroscopy is ideally suited for the characterization of disordered or nanoscale materials and has been shown to provide important structural information in natural dentine [12,13], cartilage [14], and bone minerals [15,16,17,18] and their model compounds [19,20,21,22,23]. The presence of certain moieties known to exist in calcified tissues such as calcium phosphates, hydroxide groups, and water molecules as well as their arrangement and order, can be examined using 31P and 1H solid-state NMR. Two-dimensional 1H-31P heteronuclear correlation (HETCOR) spectroscopy utilizes the distance-dependent heteronuclear dipolar coupling and thus emphasizes spatial proximity between phosphate- and hydrogen-containing species. Therefore it allows for the determination of the nature of inorganic species present at different mineralization stages based on the 31P chemical shift information.
In the present study, we present a molecular-level ex vivo NMR characterization of in vivo grown tissues. Therefore, screw-type dental implants were inserted into the mandibles of minipigs. For ex vivo analysis by solid-state NMR, the bone blocks surrounding the dental implants were dissected after healing periods of two, four, and eight weeks in order to study how biominerals develop in organisms. The NMR spectra of newly formed tissues were compared to mature bone obtained from the same organism.
2. Results
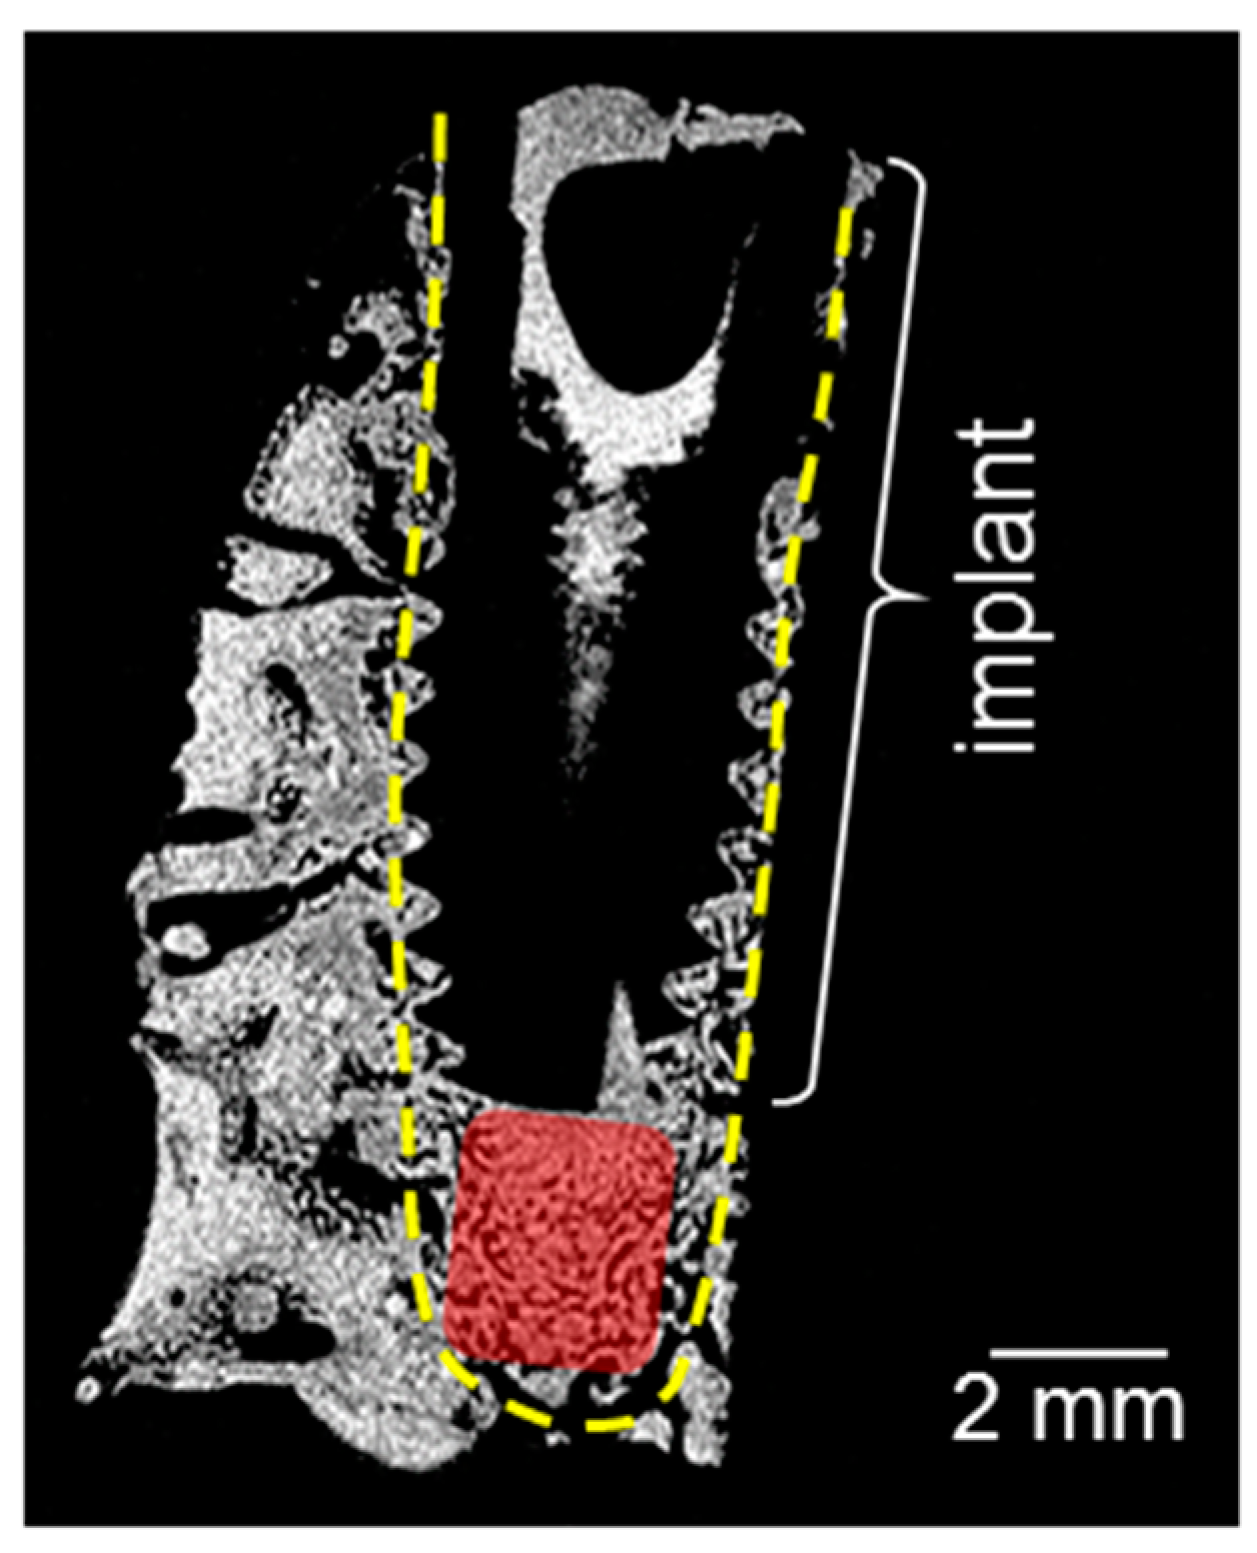
Figure 1 shows a magnetic resonance (MR) proton density slice image of the bone block of a 20 × 10 × 10 mm3 size extracted after the healing period of two weeks. The dental implant inserted into the mandibular block and dense mineralized tissue appears dark due to the lack of signal. The adjacent connective tissue is depicted in different gray scales. The red rectangle in Figure 1 indicates the area in a cavity beneath the implant apex, where tissue has grown after the healing period without direct contact to the implant. The proton density and the tissue structure in this region deviate from the surrounding tissues and thus reveal the formation of a new tissue. The morphology and quality of the newly formed tissue has been studied by MRI in the same time steps and published elsewhere [24]. Using solid-state NMR, the composition of newly formed tissue and its promotion with increasing healing time has been investigated in this work.
Figure 2 shows the 31P magic angle spinning (MAS) NMR spectra of a series of the samples after two, four, and eight weeks of healing, measured by direct polarization (DP) (Figure 2a) and cross-polarization (CP) from 1H (Figure 2b). All 31P MAS NMR spectra from newly formed tissues are very similar irrespective of the healing time, and reproduce the spectrum of the mature bone presented for comparison in Figure 2c (bottom). The DP spectra are characterized by a single, featureless, and almost symmetric line centered at 3.0 ppm with a rather large linewidth of 3.5 ppm. In the literature, the peak at 3 ppm is attributed to ACP, which is known to compose the bone mineral structure [25,26]. The reference spectrum of crystalline HAp shown in Figure 2c is significantly narrower and demonstrates an intrinsic peak at 2.7 ppm.
For selectivity, CP experiments in which signals of the sites in the vicinity of protons were enhanced were subsequently performed. The 31P{1H} CP MAS NMR spectra based on the magnetization transfer from 1H to 31P sites strongly indicated that the 31P species strongly coupled to protons. The CP MAS NMR spectra of newly formed tissues (Figure 2b) demonstrated similar featureless signals centered at ca. 3 ppm. They were characterized by even larger linewidths when compared to the DP spectra. Inhomogeneous broadening of the latter resulted from the distribution in the local environment of 31P sites in close proximity to 1H. The CP spectrum of the 2w sample demonstrated a much weaker intensity compared to other CP spectra, as shown in Figure S3. This is explained by a very low concentration of the phosphorous-containing species due to a nearly complete absence of mineralized tissue. This is supported by the fact that the newly formed tissue after two weeks appeared as soft rather than hard tissue.
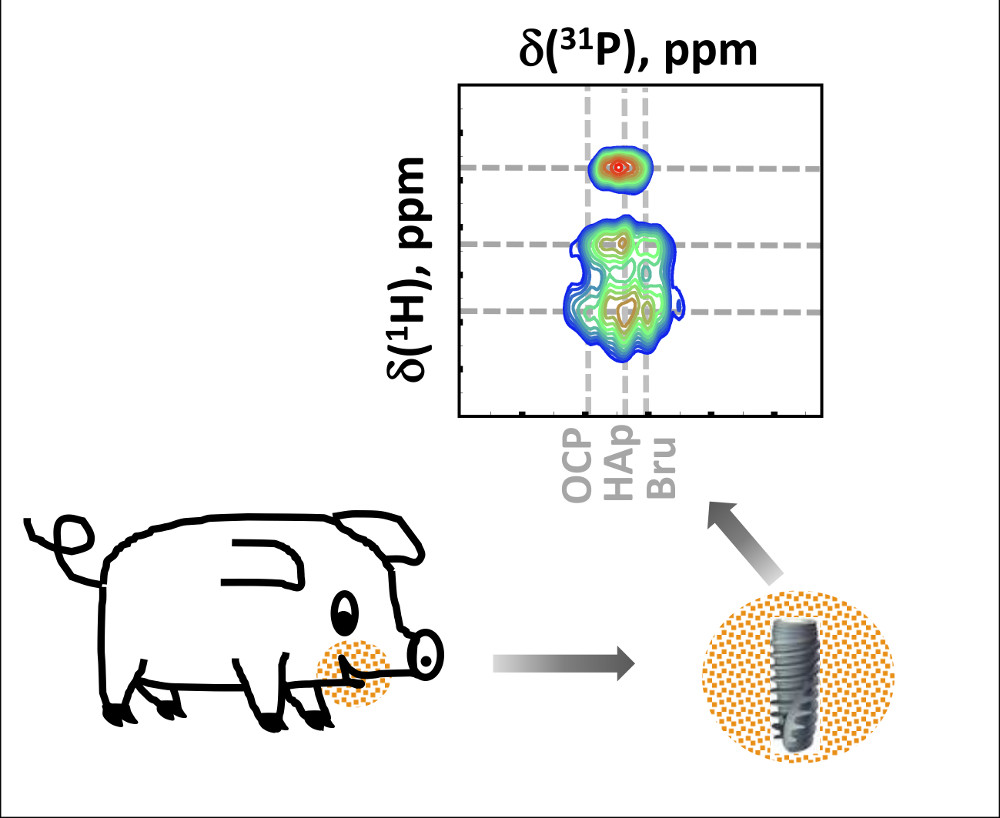
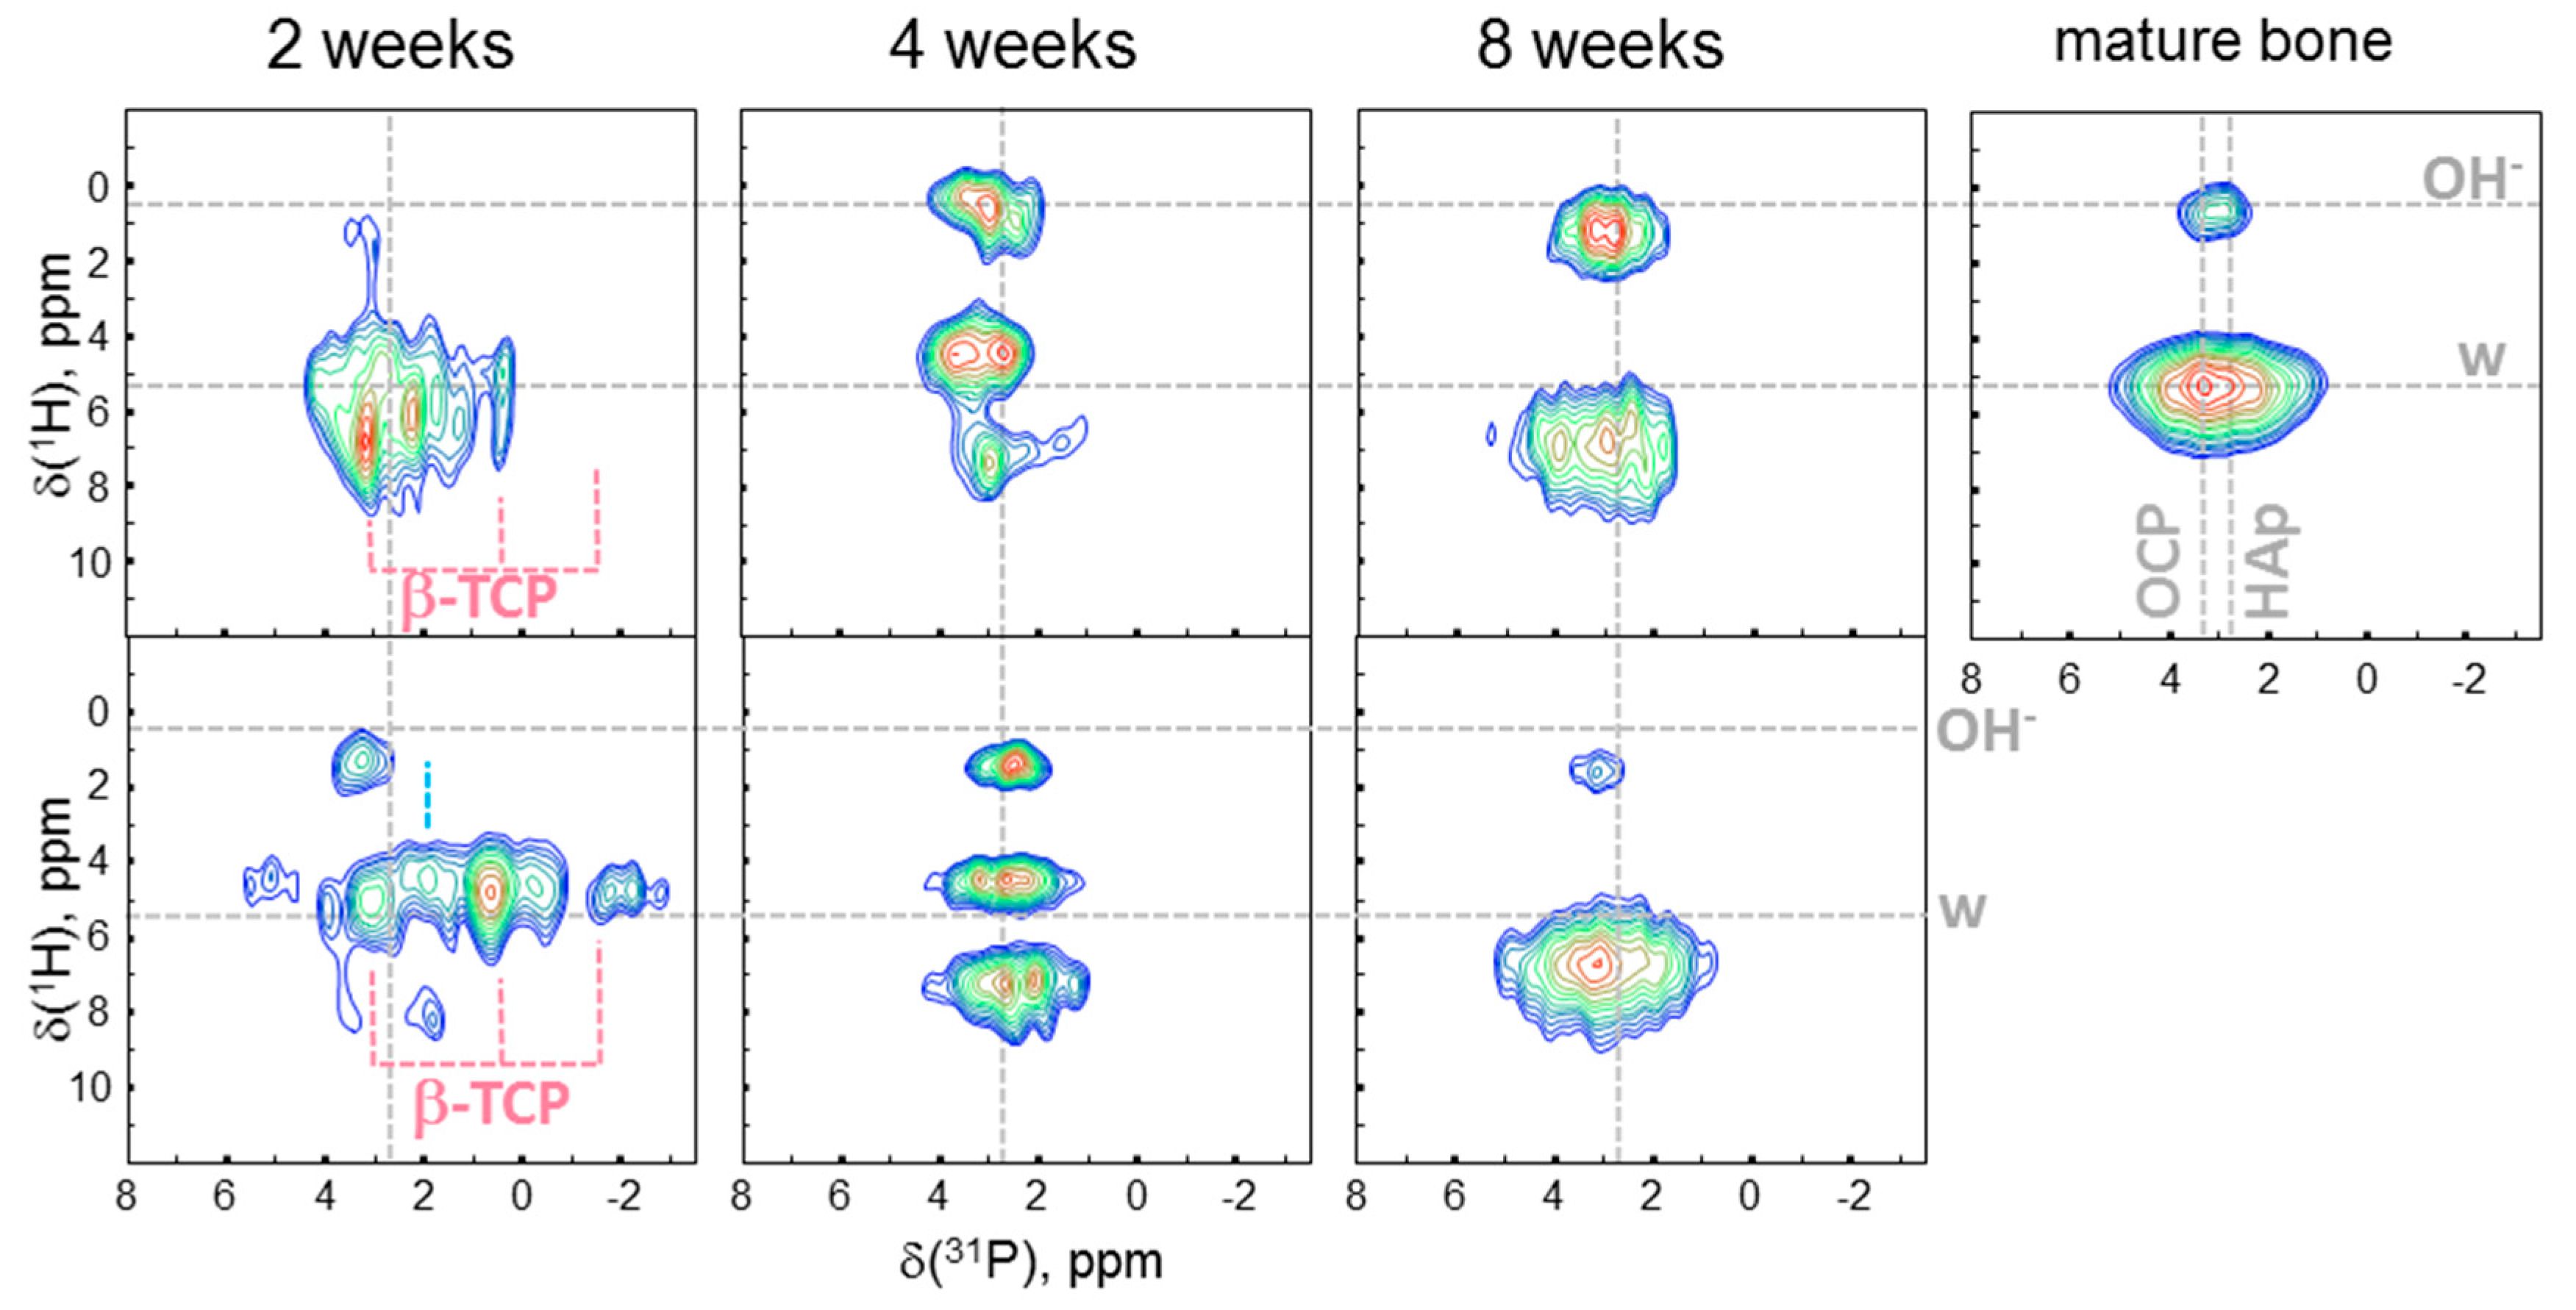
Two-dimensional 1H-31P heteronuclear correlation (HETCOR) spectra of tissues formed after different healing periods as well as the spectrum of mature mandibular bone of a minipig are shown in Figure 3. For assignment, we summarized the data on 31P and 1H chemical shifts previously reported in the literature for various calcium phosphate minerals suggested to be present in bone mineral tissues. This data is shown in Table 1. In the spectrum of bone, two characteristic correlation signals at ca. 0 ppm and 5 ppm in the 1H dimension are assigned, respectively, to PO43−/OH− groups in the apatite structure and to structural/surface water protons spatially related to the mineral phase, according to Yesinowski and Eckert [27]. Similar correlation signals have been observed in synthetic biomimetic nanocomposites [22,28] as well as in biominerals such as animal bone [17,29], joint mineralized cartilage [14], and rat dentine [12].
Based on the correlation signals in the 31P dimension, the dominating contribution at 3.3 ppm in mature bone is attributed to octacalcium phosphate (OCP). The presence of HAp at 2.7 ppm and ACP at 3.0 ppm has also been found. The spectra of newly formed tissues show distinct differences to that of mature bone, particularly, at the earlier stages. The two-week (2w) spectra from two different animals represent a complex superposition of low intensity signals, whose maxima are spread from 4 to −2 ppm. After four weeks, the lines become narrower in the 31P direction and split into three distinct contributions in the 1H direction. After eight weeks, the spectra of both samples become more similar to the spectrum of the reference bone yielding only two correlation peaks, well separated in the 1H dimension. The mineral components identified in the 2D spectra at different healing stages and in the mature bone in our work are summarized in Table 2 and discussed in the section below. In the work of Wu et al. [36], the presence of phosphorylated proteins at the very early stages of bone mineralization in chick embryos aged 8–14 days was shown using solid-state NMR. However, by Day 19 of embryonic development, no phosphoproteins could be detected because their signals were overwhelmed by large amounts of inorganic mineral phases. In our study, we performed the 31P slow MAS NMR measurements at −20 °C (see Figure S4), as the phospholipids were expected to show lower shift anisotropy and specific chemical shifts. These additional measurements did not reveal phospholipid signals.
3. Discussion
Our results show that solid mineral phosphate species were present in the defect zone around the dental implant in the mandibular bone of minipigs two weeks after implant insertion, although hard tissue had not yet been formed at this stage. The quantitative information available from the DP NMR spectra allowed us to estimate the fractions of mineral and organic components in the tissues after different healing times and to compare it to mature bone. Therefore, we integrated 1H and 31P MAS NMR spectra and calculated the ratio of hydrogen and phosphorous atoms. A spectrum of hydroxyapatite was used for calibration of the respective signal ratios from proton and phosphorous spectra. The contribution from water in the 1H spectra identified by the chemical shift was ignored. The results show a 10-fold increase in the ratio of phosphorous atoms to hydrogen atoms in the organic phase in the four-week (4w) and eight-week (8w) samples when compared to the 2w sample. Moreover, the mineral/organic component ratio remained unchanged after four weeks of healing and was similar to that of the mature bone. This observation is in agreement with the work of Bala et al., who reported that the majority of newly formed tissue within two weeks must be organic soft tissue [9].
In order to follow changes in the mineral phase upon new tissue formation and maturation, 2D HETCOR spectroscopy, which provides spatial correlations between 1H spins (from organic component and water) and 31P spins (primarily phosphate species in the mineral component), was applied. The signal separation available in the 2D spectra provided a higher resolution in the 31P dimension as compared to the 1D 31P spectra and thus allowed local mineral structures to be analyzed based on their chemical shifts. To note, the decreased linewidth in the 2D spectra as compared to the 1D CP spectra is related to the longer mixing time in the former, which results in a narrower distribution of the emphasized components.
The HETCOR spectra in Figure 3 demonstrate the development of the newly formed tissue with healing time. All the 2D correlation peaks in our work were centered within the range from −3 ppm to ca. 5 ppm, corresponding to phosphate groups in various calcium phosphate minerals. The HETCOR spectra of both 2w samples were slightly different. This can be explained by the variation in the concentration and location of the surrounding calcium atoms, because the 31P chemical shift of a phosphate unit is very sensitive to calcium content [37]. Moreover, protonation of the phosphate is also known to lead to an upfield 31P shift [30]. Nevertheless, signatures of ACP, OCP, and brushite (Bru) were found in both 2w samples, and the presence of β-TCP was revealed in only one of them. Such differences might be associated with in vivo interindividual variability and might be explained by the way different animals respond to implant insertion in various ways. Whereas ACP and OCP are known to constitute biological minerals, brushite has been only proposed as an intermediate in biomineralization processes such as bone formation [38] and the dissolution of enamel in acids (dental caries) [39,40,41]. Hence, we term it here as a brushite-like component. It is worth noting that, although it is a major component of most vertebrate hard tissues, HAp was not found in either 2w sample. Thus, we can conclude that, rather than the formation of biominerals, the pre-stages of biomineralization were observed here. After four weeks, the presence of ACP, OCP, the brushite-like component, and HAp was found in both 4w samples. Finally, at the last stage of healing, ACP, HAp, and OCP were visible in the 8w spectra. This composition is close to that of the mature bone serving as reference, except for the presence of Bru phase in one of two 8w samples. However, this phase could be stabilized by an environment before conversion to hydroxyapatite. To sum up, the general trend in the formation of biomineral tissue with time evolution is clearly observed.
The 1H signals from newly formed tissues strongly deviated from those of mature bone, where the protons related to apatitic OH− groups and water molecules were found. An absence or undetectable amount of apatitic OH− groups expected at ca. 0 ppm was observed at all early stages in all samples, except for one 4w sample. This supports reports of a strong deficiency of hydroxide groups in mature bone and dental tissues [12,42,43]. In our previous studies on water absorbance on silica surfaces [44] and on hydroxyapatite-gelatin nanocomposites [22,28], we demonstrated the variation in the 1H chemical shift depending on (1) the dimensionality of the water structures formed on the surface and related to the strength of hydrogen bonds, and (2) the chemical groups donating hydrogen atoms for hydrogen bond formation. As a fast exchange of hydrogen bonded protons is known to occur at ambient temperatures, the exchanging protons appear in the 1H spectrum at the chemical shift, which is the weighted average of the chemical shifts from the individual structures. Thus, the 1H values discussed here can result from OH groups participating in hydrogen bonding between hydrogenated phosphates, bulk water, isolated water molecules, and organic molecules present in bone (e.g., collagen and non-collagen proteins), giving rise to variability in the 1H shifts of natural bone tissues. Actually, three 1H signals, similar to the 4w samples, have been observed in the biomimetic mesocrystal system of fluoroapatite and the organic matrix at the early growth stage [28]. In the latter, the signals have been attributed to three different water states associated with (i) isolated water molecules, being structural defects in the crystalline mineral domains, (ii) bound water on the mineral surface, and (iii) mobile water included in the amorphous organic layer, where it strongly interacts with organic molecules and inorganic species. The change to two 1H signals in the 8w samples can be associated with the re-organization of complexes between water and protein molecules always present in the organic matrix, and/or crystallite growth, which results in diminishing the contribution from surface bound water due to reduction in the specific surface area. This scenario corroborates the recent biomineralization mechanism that manifests clustering and densification into an amorphous precursor phase [2,3,5]. Our results demonstrate that different calcium phosphate minerals are present in the newly formed tissues at various healing stages, and that hydroxyapatite has not been formed in the tissue after two weeks. This observation supports the next stage in the recent biomineralization mechanism, which involves the final crystallization to hydroxyapatite and agrees well with other studies suggesting a duration of primary mineralization of up to 3 months [8,9].
4. Materials and Methods
4.1. Sample Preparation
Six titanium coated polyetheretherketone (PEEK) implants of a special design—to create a defined area between the implant surface and the round drill hole reported in [24,45]—were inserted in the mandibular bone of minipigs. The mandibles were resected after healing periods of two, four, and eight weeks. The details of the animal model are given in Supplementary Materials. The specimens were stored in a phosphate buffer solution containing penicillin, streptomycin, gentamycin, and amphotericin B at 8 °C. Due to tight fixing of the dental screws, contact of the tissues investigated and phosphate solution was avoided. For the solid-state NMR measurements, species of newly formed tissues were isolated from the host bone, placed into MAS zirconia rotors with an o.d. of 4 mm, tightly capped, and immediately measured. Thus, two samples from different animals were examined after each healing period. The bone serving as reference was obtained from mature pristine mandibular bone and ground in a freezer mill. The reference sample of hydroxyapatite was purchased from Merck KGaA (Darmstadt, Germany) and used without purification. Control measurements of both untreated bone blocks and ground bone after extraction and after storage for 4 weeks—a period during which some samples had to be stored before the solid-state NMR following the MRI experiments—were performed to verify that the storage conditions and grinding did not affect the mineral structure. The results of the control experiments are presented in Figures S1 and S2.
4.2. NMR Imaging Measurements
The NMR Imaging was performed on a 7 T Bruker Avance 300 nonclinical NMR spectrometer (Bruker BioSpin, Rheinstetten, Germany) using a linear polarized rf coil of a 15 mm inner diameter and a BrukerBioSpin Micro 2.5 gradient system generating a maximum magnetic field gradient strength of up to 1 T/m on three axes. For the experiment, the whole bone block was immersed into an NMR tube filled with a perfluorinated fluid (Fluorinert FC 77®, 3M Belgium NV/SA, Zwijndrecht, Belgium) preventing dehydration and providing a signal-free background. For a proton-density image, a spin-echo multi-slice sequence with a repetition time of 2.5 s, an echo time of 4 ms, a matrix size of 512 × 256 pixel, a slice thickness of 125 µm, and 32 scans was used.
4.3. Solid State NMR
All NMR spectra were obtained on a 7 T Bruker Avance 300 spectrometer operating at resonance frequencies of 300.1 MHz for 1H and 121.5 MHz for 31P. The 31P NMR experiments were acquired at a spinning frequency of 10 kHz employing a BL4 HXY 4 mm MAS probe head. For 31P MAS NMR spectra, a single 90° pulse with a 3.8 μs pulse duration, a recycle delay of 50 s, a proton decoupling of 50 kHz, and up to 512 repetitions were applied. For 31P{1H} CP measurements, a contact time of 0.1 ms, a 1H decoupling (XiX) of 50 kHz, 4096 repetitions, and a recycle delay of 3 s were used. The spectra were fitted using Dmfit [46]. Two-dimensional 1H-31P HETCOR experiments were performed using frequency-switched Lee-Goldburg (FSLG) CP with a contact time of 0.5 ms and 1.5 ms and an LG frequency of 75 kHz. A recycle delay of 3 s and 256 scans per t1 time increment were used. A total of 128 t1 slices with a 25.2 μs time increment were acquired. Prior to Fourier transform, exponential multiplication with 20 Hz and 30 Hz line broadenings was used in 31P and 1H dimensions, respectively. The 1H chemical shifts were referenced to tetramethylsilane (TMS) at 0 ppm using poly (vinylidene fluoride) as an external reference at 2.9 ppm; powdered ammonium dihydrogen phosphate was used to reference the 31P spectra at 0.72 ppm relative to 85% phosphoric acid.
5. Conclusions
In the present work, the changes in the mineral phase upon new tissue formation and maturation were investigated on the molecular level by applying solid-state NMR. The tissues grown in the cavity beneath the dental implants inserted into the mandibles of minipigs were investigated after three different healing periods of two, four, and eight weeks. While one-dimensional 31P MAS NMR proved the presence of mineralized tissue, two-dimensional heteronuclear correlation HETCOR spectroscopy enabled the detection and identification of various calcium phosphate minerals and water stages during the bone formation. The increase in mineral content was shown by the ratio between the 31P and 1H signal intensities during the healing period. Thus, after two weeks, we observed pre-stages of biomineralization (rather than a formation of biocrystals, which grow in a straightforward manner) with a broad distribution in structural environment. The chemical composition in the newly formed calcium phosphate species varies with healing time until it achieves a composition close to that of mature bone, at approximately eight weeks after healing starts. Besides ACP and OCP phases, revealed in the reference bone spectrum, brushite-like and β-TCP were observed at early stages of mineralization. At the intermediate stage, hydroxyapatite was formed. Our results provide in vivo confirmation of a recently proposed biomineralization mechanism based on the formation of nanometer-sized calcium phosphate clusters, with subsequent aggregation into an amorphous phase and, finally, crystallization to hydroxyapatite. We proved here that solid-state NMR spectroscopy allows for the identification of inorganic species during the biomineral formation at very early stages, when crystallite particles visible in direct imaging techniques have not yet been formed.
Supplementary Materials
The following materials are available online at www.mdpi.com/2312-7481/3/4/39/s1, Figure S1: 1H-31P heteronuclear correlation (HETCOR) spectra of the bone (a) in block after extraction, (b) cryogenically ground after extraction, (c) in block after storage for 4 weeks in phosphate solution in a fridge and (d) cryogenically ground after storage for 4 weeks in phosphate solution in a fridge. Figure S2: (A) 1H magic angle spinning nuclear magnetic resonance (MAS NMR) spectra, and (B) 31P MAS NMR spectra of the bone in block after extraction, cryogenically ground after extraction, in block after storage for 4 weeks in phosphate solution in a fridge and cryogenically ground after storage for 4 weeks in phosphate solution in a fridge. Figure S3: 31P{1H} CP MAS (10 kHz) spectra of newly formed tissues in the second animal (2w- after two, 4w-four and 8w-eight weeks healing time). The spectra were measured at a contact time of 0.1 ms. Normalization on the sample weight and no line broadening were applied here to demonstrate the sensitivity of the spectra. Figure S4: 31P{1H} CP MAS (2.6 kHz) spectrum of the 2w sample measured at −20 °C.
Acknowledgments
This work has been supported by the German Research Foundation (DFG) in the frame of Transregio TRR67 and the European Social Fund through the Sächsische Aufbaubank. The authors gratefully acknowledge Dirk Zimmerhäckel and the IPF machine shop for manufacturing the dental PEEK implants, Ricardo Bernhardt and Steffen Howitz for sputter coating of dental implants, as well as Bernd Stadlinger and Uwe Eckelt for their support in the preclinical experiments.
Author Contributions
U.S. and R.M. conceived and designed the experiments; M.S. performed the preclinical experiments, C.E. contributed to the sample preparation and performed the MRI experiments, A.V. performed the NMR experiments, analyzed the data, and wrote the paper. All authors contributed to the text.
Conflicts of Interest
The authors declare no conflict of interest.
References
- Wang, L.; Nancollas, G.H. Pathways to biomineralization and biodemineralization of calcium phosphates: The thermodynamic and kinetic controls. Dalton Trans. 2009, 2665–2672. [Google Scholar] [CrossRef] [PubMed]
- Gebauer, D.; Völkel, A.; Cölfen, H. Stable prenucleation calcium carbonate clusters. Science 2008, 322, 1819–1822. [Google Scholar] [CrossRef] [PubMed]
- Pouget, E.M.; Bomans, P.H.H.; Goos, J.A.C.M.; Frederik, P.M.; de With, G.; Sommerdijk, N.A.J.M. The initial stages of template-controlled CaCO3 formation revealed by cryo-TEM. Science 2009, 323, 1455–1458. [Google Scholar] [CrossRef] [PubMed] [Green Version]
- Nudelman, F.; Pieterse, K.; George, A.; Bomans, P.H.H.; Friedrich, H.; Brylka, L.J.; Hilbers, P.A.J.; de With, G.; Sommerdijk, N.A.J.M. The role of collagen in bone apatite formation in the presence of hydroxyapatite nucleation inhibitors. Nat. Mater. 2010, 9, 1004–1009. [Google Scholar] [CrossRef] [PubMed]
- Dey, A.; Bomans, P.H.H.; Müller, F.A.; Will, J.; Frederik, P.M.; de With, G.; Sommerdijk, N.A.J.M. The role of prenucleation clusters in surface-induced calcium phosphate crystallization. Nat. Mater. 2010, 9, 1010–1014. [Google Scholar] [CrossRef] [PubMed]
- Mahamid, J.; Sharir, A.; Addadi, L.; Weiner, S. Amorphous calcium phosphate is a major component of the forming fin bones of zebrafish: Indications for an amorphous precursor phase. Proc. Natl. Acad. Sci. USA 2008, 105, 12748–12753. [Google Scholar] [CrossRef] [PubMed]
- Beniash, E.; Metzler, R.A.; Lam, R.S.; Gilbert, P.U. Transient amorphous calcium phosphate in forming enamel. J. Struct. Biol. 2009, 166, 133–143. [Google Scholar] [CrossRef] [PubMed]
- Boivin, G.; Meunier, P.J. The degree of mineralization of bone tissue measured by computerized quantitative contact microradiography. Calcif. Tissue Int. 2002, 70, 503–511. [Google Scholar] [CrossRef] [PubMed]
- Bala, Y.; Farlay, D.; Delmas, P.D.; Meunier, P.J.; Boivin, G. Time sequence of secondary mineralization and microhardness in cortical and cancellous bone from ewes. Bone 2010, 46, 1204–1212. [Google Scholar] [CrossRef] [PubMed]
- Posner, A.S.; Betts, F. Synthetic amorphous calcium phosphate and its relation to bone mineral structure. Acc. Chem. Res. 2002, 8, 273–281. [Google Scholar] [CrossRef]
- Crane, N.J.; Popescu, V.; Morris, M.D.; Steenhuis, P.; Ignelzi, M.A. Raman spectroscopic evidence for octacalcium phosphate and other transient mineral species deposited during intramembranous mineralization. Bone 2006, 39, 434–442. [Google Scholar] [CrossRef] [PubMed]
- Tseng, Y.-H.; Tsai, Y.-L.; Tsai, T.W.T.; Chao, J.C.H.; Lin, C.-P.; Huang, S.-H.; Mou, C.-Y.; Chan, J.C.C. Characterization of the Phosphate Units in Rat Dentin by Solid-State NMR Spectroscopy. Chem. Mater. 2007, 19, 6088–6094. [Google Scholar] [CrossRef]
- Huang, S.-J.; Tsai, Y.-L.; Lee, Y.-L.; Lin, C.-P.; Chan, J.C.C. Structural Model of Rat Dentin Revisited. Chem. Mater. 2009, 21, 2583–2585. [Google Scholar] [CrossRef]
- Duer, M.J.; Friscić, T.; Murray, R.C.; Reid, D.G.; Wise, E.R. The mineral phase of calcified cartilage: Its molecular structure and interface with the organic matrix. Biophys. J. 2009, 96, 3372–3378. [Google Scholar] [CrossRef] [PubMed]
- Cho, G.; Wu, Y.; Ackerman, J.L. Detection of hydroxyl ions in bone mineral by solid-state NMR spectroscopy. Science 2003, 300, 1123–1127. [Google Scholar] [CrossRef] [PubMed]
- Kolodziejski, W. Solid-state NMR studies of bone. Top. Curr. Chem. 2005, 246, 235–270. [Google Scholar] [CrossRef] [PubMed]
- Wilson, E.E.; Awonusi, A.; Morris, M.D.; Kohn, D.H.; Tecklenburg, M.M.J.; Beck, L.W. Three structural roles for water in bone observed by solid-state NMR. Biophys. J. 2006, 90, 3722–3731. [Google Scholar] [CrossRef] [PubMed]
- Jaeger, C.; Groom, N.S.; Bowe, E.A.; Horner, A.; Davies, M.E.; Murray, R.C.; Duer, M.J. Investigation of the Nature of the Protein−Mineral Interface in Bone by Solid-State NMR. Chem. Mater. 2005, 17, 3059–3061. [Google Scholar] [CrossRef]
- Tseng, Y.-H.; Mou, C.-Y.; Chan, J.C.C. Solid-state NMR study of the transformation of octacalcium phosphate to hydroxyapatite: A mechanistic model for central dark line formation. J. Am. Chem. Soc. 2006, 128, 6909–6918. [Google Scholar] [CrossRef] [PubMed]
- Nassif, N.; Martineau, F.; Syzgantseva, O.; Gobeaux, F.; Willinger, M.; Coradin, T.; Cassaignon, S.; Azaïs, T.; Giraud-Guille, M.M. In Vivo Inspired Conditions to Synthesize Biomimetic Hydroxyapatite. Chem. Mater. 2010, 22, 3653–3663. [Google Scholar] [CrossRef]
- Ndao, M.; Ash, J.T.; Stayton, P.S.; Drobny, G.P. The Role of Basic Amino Acids in the Molecular Recognition of Hydroxyapatite by Statherin using Solid State NMR. Surf. Sci. 2010, 604, L39–L42. [Google Scholar] [CrossRef] [PubMed]
- Vyalikh, A.; Simon, P.; Kollmann, T.; Kniep, R.; Scheler, U. Local Environment in Biomimetic Hydroxyapatite−Gelatin Nanocomposites As Probed by NMR Spectroscopy. J. Phys. Chem. C 2011, 115, 1513–1519. [Google Scholar] [CrossRef]
- Vyalikh, A.; Simon, P.; Rosseeva, E.; Buder, J.; Kniep, R.; Scheler, U. Intergrowth and interfacial structure of biomimetic fluorapatite-gelatin nanocomposite: A solid-state NMR study. J. Phys. Chem. B 2014, 118, 724–730. [Google Scholar] [CrossRef] [PubMed]
- Korn, P.; Elschner, C.; Schulz, M.C.; Range, U.; Mai, R.; Scheler, U. MRI and dental implantology: Two which do not exclude each other. Biomaterials 2015, 53, 634–645. [Google Scholar] [CrossRef] [PubMed]
- Aue, W.P.; Roufosse, A.H.; Glimcher, M.J.; Griffin, R.G. Solid-state phosphorus-31 nuclear magnetic resonance studies of synthetic solid phases of calcium phosphate: Potential models of bone mineral. Biochemistry 2002, 23, 6110–6114. [Google Scholar] [CrossRef]
- Combes, C.; Rey, C. Amorphous calcium phosphates: Synthesis, properties and uses in biomaterials. Acta Biomater. 2010, 6, 3362–3378. [Google Scholar] [CrossRef] [PubMed] [Green Version]
- Yesinowski, J.P.; Eckert, H. Hydrogen environments in calcium phosphates: Proton MAS NMR at high spinning speeds. J. Am. Chem. Soc. 1987, 109, 6274–6282. [Google Scholar] [CrossRef]
- Vyalikh, A.; Simon, P.; Rosseeva, E.; Buder, J.; Scheler, U.; Kniep, R. An NMR Study of Biomimetic Fluorapatite—Gelatine Mesocrystals. Sci. Rep. 2015, 5, 15797. [Google Scholar] [CrossRef] [PubMed]
- Santos, R.A.; Wind, R.A.; Bronnimann, C.E. 1H CRAMPS and 1H-31P HetCor Experiments on Bone, Bone Mineral, and Model Calcium Phosphate Phases. J. Magn. Reson. Ser. B 1994, 105, 183–187. [Google Scholar] [CrossRef]
- Rothwell, W.P.; Waugh, J.S.; Yesinowski, J.P. High-resolution variable-temperature phosphorus-31 NMR of solid calcium phosphates. J. Am. Chem. Soc. 1980, 102, 2637–2643. [Google Scholar] [CrossRef]
- Bak, M.; Thomsen, J.K.; Jakobsen, H.J.; Petersen, S.E.; Petersen, T.E.; Nielsen, N.C. Solid-state 13C and 31P NMR analysis of urinary stones. J. Urol. 2000, 164, 856–863. [Google Scholar] [CrossRef]
- Kaflak-Hachulska, A.; Samoson, A.; Kolodziejski, W. 1H MAS and 1H→31P CP/MAS NMR study of human bone mineral. Calcif. Tissue Int. 2003, 73, 476–486. [Google Scholar] [CrossRef] [PubMed]
- Legrand, A.P.; Sfihi, H.; Lequeux, N.; Lemaître, J. 31P Solid-State NMR study of the chemical setting process of a dual-paste injectable brushite cements. J. Biomed. Mater. Res. B 2009, 91, 46–54. [Google Scholar] [CrossRef] [PubMed]
- Davies, E.; Duer, M.J.; Ashbrook, S.E.; Griffin, J.M. Applications of NMR crystallography to problems in biomineralization: Refinement of the crystal structure and 31P solid-state NMR spectral assignment of octacalcium phosphate. J. Am. Chem. Soc. 2012, 134, 12508–12515. [Google Scholar] [CrossRef] [PubMed]
- Obadia, L.; Deniard, P.; Alonso, B.; Rouillon, T.; Jobic, S.; Guicheux, J.; Julien, M.; Massiot, D.; Bujoli, B.; Bouler, J.-M. Effect of Sodium Doping in β-Tricalcium Phosphate on Its Structure and Properties. Chem. Mater. 2006, 18, 1425–1433. [Google Scholar] [CrossRef]
- Wu, Y.; Ackerman, J.L.; Strawich, E.S.; Rey, C.; Kim, H.-M.; Glimcher, M.J. Phosphate ions in bone: Identification of a calcium-organic phosphate complex by 31P solid-state NMR spectroscopy at early stages of mineralization. Calcif. Tissue Int. 2003, 72, 610–626. [Google Scholar] [CrossRef] [PubMed]
- Fletcher, J.P.; Kirkpatrick, R.J.; Howell, D.; Risbud, S.H. 31P Magic-angle spinning nuclear magnetic resonance spectroscopy of calcium phosphate glasses. J. Chem. Soc. Faraday Trans. 1993, 89, 3297. [Google Scholar] [CrossRef]
- Neuman, W.F.; Bareham, B.J. Evidence for the presence of secondary calcium phosphate in bone and its stabilization by acid production. Calcif. Tissue Res. 1975, 18, 161–172. [Google Scholar] [CrossRef] [PubMed]
- Kodaka, T.; Ohohara, Y.; Debari, K. Scanning electron microscopy and energy-dispersive X-ray microanalysis studies of early dental calculus on resin plates exposed to human oral cavities. Scanning Microsc. 1992, 6, 475–486. [Google Scholar] [PubMed]
- LeGeros, R.Z.; Orly, I.; LeGeros, J.P.; Gomez, C.; Kazimiroff, J.; Tarpley, T.; Kerebel, B. Scanning electron microscopy and electron probe microanalyses of the crystalline components of human and animal dental calculi. Scanning Microsc. 1988, 2, 345–356. [Google Scholar] [PubMed]
- Jin, Y.; Yip, H.-K. Supragingival Calculus: Formation and Control. Crit. Rev. Oral Biol. Med. 2002, 13, 426–441. [Google Scholar] [CrossRef] [PubMed]
- Loong, C.-K.; Rey, C.; Kuhn, L.T.; Combes, C.; Wu, Y.; Chen, S.-H.; Glimcher, M.J. Evidence of hydroxyl-ion deficiency in bone apatites: An inelastic neutron-scattering study. Bone 2000, 26, 599–602. [Google Scholar] [CrossRef]
- Vyalikh, A.; Mai, R.; Scheler, U. OH− deficiency in dental enamel, crown and root dentine as studied by 1H CRAMPS. Bio-Med. Mater. Eng. 2013, 23, 507–512. [Google Scholar] [CrossRef]
- Vyalikh, A.; Emmler, T.; Grünberg, B.; Xu, Y.; Shenderovich, I.; Findenegg, G.H.; Limbach, H.-H.; Buntkowsky, G. Hydrogen Bonding of Water Confined in Controlled-Pore Glass 10–75 Studied by 1H-Solid State NMR. Z. Phys. Chem. 2007, 221, 155–168. [Google Scholar] [CrossRef]
- Stadlinger, B.; Hintze, V.; Bierbaum, S.; Möller, S.; Schulz, M.C.; Mai, R.; Kuhlisch, E.; Heinemann, S.; Scharnweber, D.; Schnabelrauch, M.; et al. Biological functionalization of dental implants with collagen and glycosaminoglycans-A comparative study. J. Biomed. Mater. Res. B 2012, 100, 331–341. [Google Scholar] [CrossRef] [PubMed]
- Massiot, D.; Fayon, F.; Capron, M.; King, I.; Le Calvé, S.; Alonso, B.; Durand, J.-O.; Bujoli, B.; Gan, Z.; Hoatson, G. Modelling one- and two-dimensional solid-state NMR spectra. Magn. Reson. Chem. 2002, 40, 70–76. [Google Scholar] [CrossRef]
Figure 1.
Magnetic resonance (MR) proton density slice image of the bone block containing the implant after a healing time of two weeks. The yellow dotted lines indicate the implant cavity, and the red rectangle shows the region with newly formed tissues, extracted for NMR measurements. The highest proton density is indicated by light gray, the lowest one by black.

Figure 2.
31P magic angle spinning nuclear magnetic resonance (MAS NMR) spectra of newly formed tissues after two, four, and eight weeks healing time, measured by (a) direct polarization (DP), and (b) using cross-polarization (CP) from 1H at a contact time of 0.1 ms. (c) The 31P MAS NMR spectra of the mature bone (bottom) and hydroxyapatite (top). The spectra are normalized to maximal intensity.
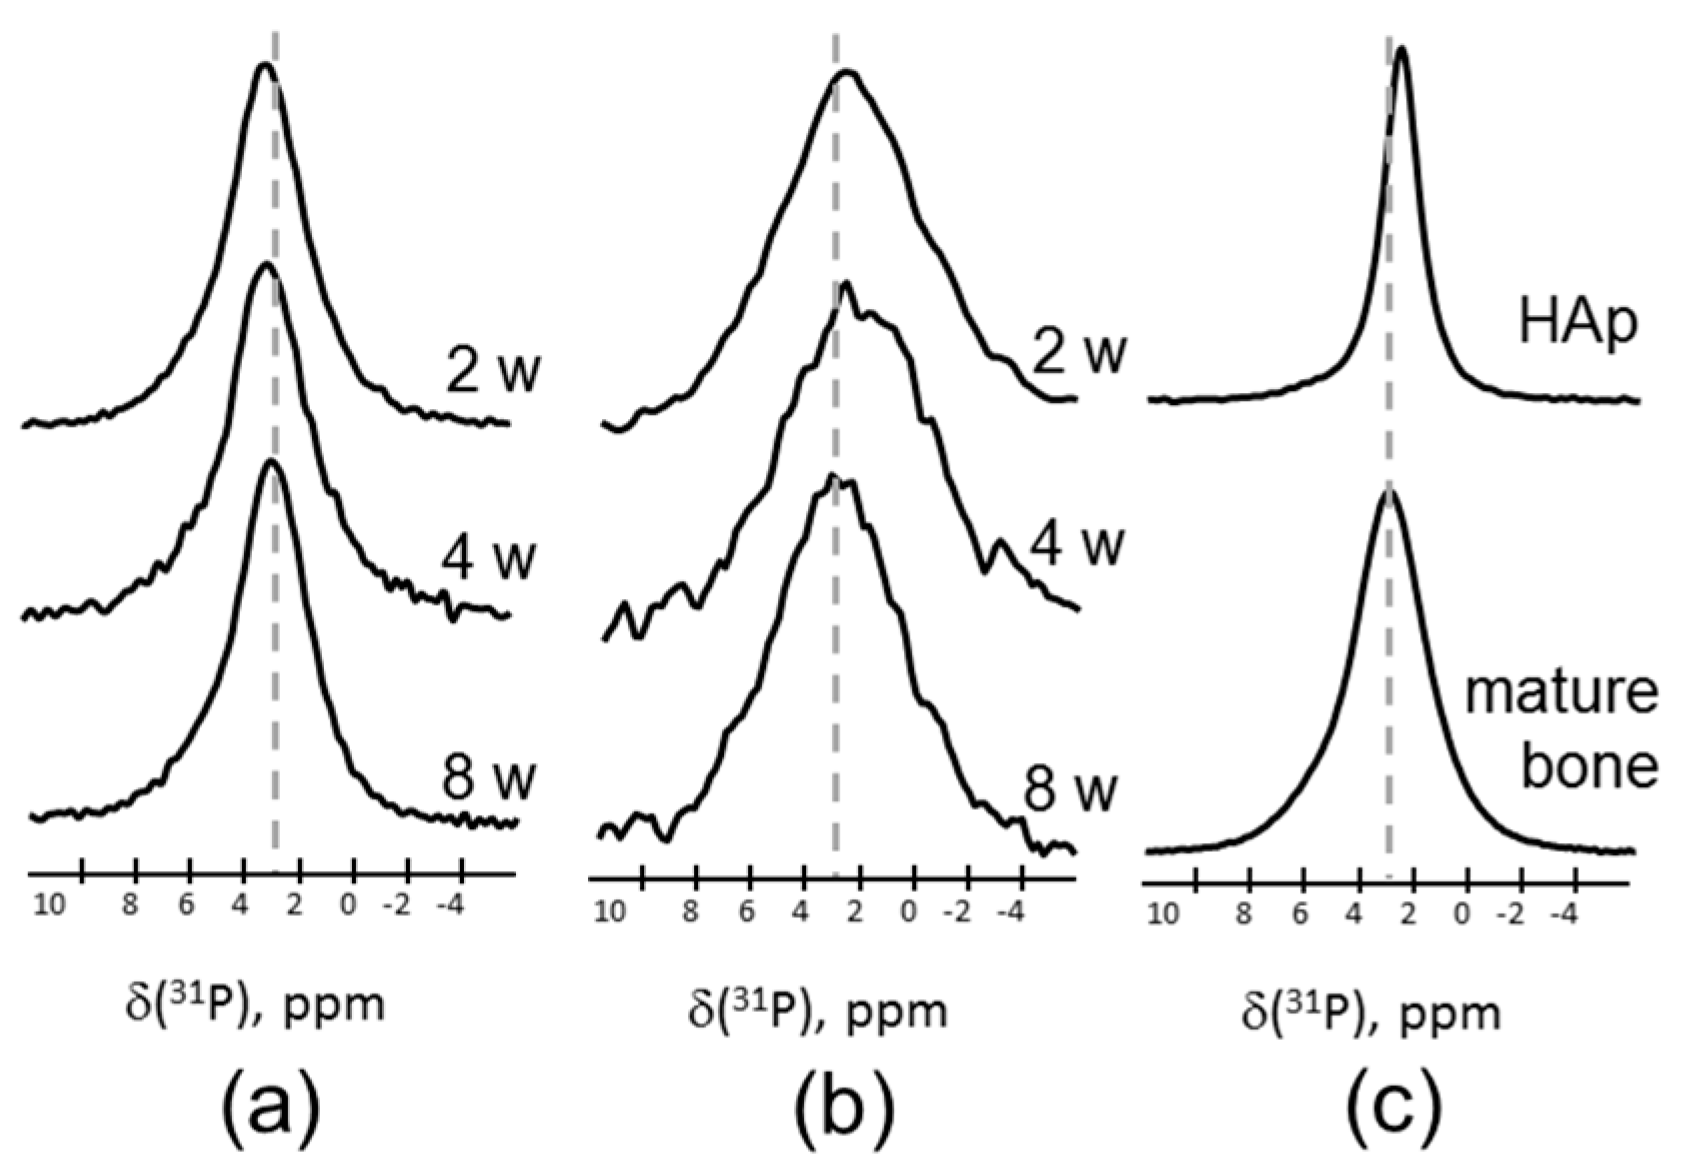
Figure 3.
1H-31P heteronuclear correlation (HETCOR) spectra of the newly formed tissues after two, four, and eight weeks of healing time and of mature bone. For each healing period samples from two animals (top and bottom) were measured. Guidelines at the 1H chemical shifts of 0.2 ppm and 5.4 ppm characteristic of apatitic hydroxides and water, respectively, are shown. In the 31P direction, the guideline at 2.7 ppm characteristic of hydroxyapatite is indicated in all samples. In addition, in the spectrum of mature bone, the guideline at 3.3 ppm, characteristic of octacalcium phosphate (OCP), is shown.


Table 1.
31P and 1H chemical shift parameters for calcium phosphate structures reported in the literature.
Table 1.
31P and 1H chemical shift parameters for calcium phosphate structures reported in the literature.
| Mineral | Chemical Shift | References | |
|---|---|---|---|
| 31P, ppm | 1H, ±0.05 ppm | ||
| HAp, hydroxyapatite | 2.8 ± 0.2 | 0.2 | [25,30,31] |
| 5.5 | |||
| Bru, brushite (dicalcium phosphate, dehydrate) | 1.7 ± 0.3 | 4.1 | [25,30,31,32,33] |
| 6.4 | |||
| 10.4 | |||
| Monetite (dicalcium phosphate, anhydrous) | 0.0 ± 0.4 | [25,30,31,33] | |
| −1.5 ± 0.4 | |||
| ACP, amorphous calcium phosphate | 3.0 | 5.5 | [25,26] |
| OCP, octacalcium phosphate | −0.2 ± 0.4 | 0.18 | [30,31,34] |
| 1.9 | 5.5 | ||
| 3.3 ± 0.3 | 13.6 | ||
| 3.7 | |||
| β-TCP, tricalcium phosphate | −1.6 | [31,35] | |
| 0.2 | |||
| 2.9 | |||
Table 2.
The presence of calcium phosphate minerals in the samples under study at different healing stages (ACP = amorphous calcium phosphate; OCP = octacalcium phosphate; Bru = brushite; TCP = tricalcium phosphate; Hap = hydroxiapaptite).
Table 2.
The presence of calcium phosphate minerals in the samples under study at different healing stages (ACP = amorphous calcium phosphate; OCP = octacalcium phosphate; Bru = brushite; TCP = tricalcium phosphate; Hap = hydroxiapaptite).
| Sample | Mineral Components | ||||
|---|---|---|---|---|---|
| ACP | OCP | Bru | β-TCP | HAp | |
| 2 w | x | x | x | ||
| x | x | x | x | ||
| 4 w | x | x | x | x | |
| x | x | x | x | ||
| 8 w | x | x | x | ||
| x | x | x | x | ||
| Mature bone (reference) | x | x | x | ||
© 2017 by the authors. Licensee MDPI, Basel, Switzerland. This article is an open access article distributed under the terms and conditions of the Creative Commons Attribution (CC BY) license (http://creativecommons.org/licenses/by/4.0/).
Share and Cite
MDPI and ACS Style
Vyalikh, A.; Elschner, C.; Schulz, M.C.; Mai, R.; Scheler, U. Early Stages of Biomineral Formation—A Solid-State NMR Investigation of the Mandibles of Minipigs. Magnetochemistry 2017, 3, 39. https://doi.org/10.3390/magnetochemistry3040039
AMA Style
Vyalikh A, Elschner C, Schulz MC, Mai R, Scheler U. Early Stages of Biomineral Formation—A Solid-State NMR Investigation of the Mandibles of Minipigs. Magnetochemistry. 2017; 3(4):39. https://doi.org/10.3390/magnetochemistry3040039
Chicago/Turabian StyleVyalikh, Anastasia, Cindy Elschner, Matthias C. Schulz, Ronald Mai, and Ulrich Scheler. 2017. "Early Stages of Biomineral Formation—A Solid-State NMR Investigation of the Mandibles of Minipigs" Magnetochemistry 3, no. 4: 39. https://doi.org/10.3390/magnetochemistry3040039
Note that from the first issue of 2016, this journal uses article numbers instead of page numbers. See further details here.