Spatially Resolved Measurements of Crosslinking in UV-Curable Coatings Using Single-Sided NMR


1
Department of Chemistry, The College of William & Mary, Williamsburg, VA 23185, USA
2
Department of Chemistry, University of Pittsburgh, Pittsburgh, PA 15260, USA
*
Author to whom correspondence should be addressed.
Magnetochemistry 2018, 4(1), 8; https://doi.org/10.3390/magnetochemistry4010008
Submission received: 21 November 2017
/
Revised: 18 December 2017
/
Accepted: 22 December 2017
/
Published: 9 January 2018
(This article belongs to the Special Issue Nuclear Magnetic Resonance Spectroscopy)
Abstract
:The UV-driven photocuring of coatings results in a crosslinked polymeric network. The degree of crosslinking in these coatings is typically assessed via optical spectroscopy; unfortunately, optical methods are typically limited in their maximum depth access. Alternatively, single-sided nuclear magnetic resonance (NMR) can be used to probe the crosslinking of UV-curable coatings in a spatially sensitive manner. Relaxation measurements, which correlate with crosslinking, can be done with a spatial resolution on the order of microns throughout the depth dimension of the coating, regardless of optical transparency of the material. These results can be visualized via a relaxation cross-section that shows the depth at which a particular relaxation value is observed. These measurements are used to probe the effect of a scavenger molecule that is added to the coating mixture, allowing for efficient crosslinking despite the presence of atmospheric oxygen. This method may find purchase in evaluating systems whose crosslinking properties are intentionally varied throughout its thickness; using NMR, these systems, up to approximately one hundred microns thick, can be measured without repositioning or rastering.
1. Introduction
Coatings that are cured using ultraviolet light (“UV-curables”) find use in a wide range of applications as they can be rapidly cured without the evolution of unpleasant or noxious gases. UV-curables contain a certain amount of photoinitiator that strongly absorbs in the UV range. When this photoinitiator absorbs UV light, radicals are formed that drive the formation of crosslinks between monomers to form a polymeric coating [1]. Greater UV absorbance, either from more efficient photoinitiators or by more intense UV light, results in more radicals that, in turn, promote curing of the coating [2,3]. One aspect of these reactions must frequently be addressed: atmospheric oxygen can interfere with radical-driven crosslinking reactions at the coating surface. In our experiments, oxygen reacts rapidly with radicals produced during photoinitiation to produce peroxyl radicals that are slow to react with double bonds in monomers, thus retarding the rate of polymerization [4]. Sometimes curing can be performed in an oxygen-free atmosphere, minimizing this interference. Alternatively, when atmospheric regulation is impractical, antioxidant scavengers can be added to the coating mixture to mitigate the effects of (atmospheric) oxygen radicals, allowing the main crosslinking reaction to proceed [5]. One efficient scavenger is triphenylphosphine (PPh3) which, in our experiments, reacts with a peroxyl radical to form triphenylphosphine oxide and a reactive radical monomer than can participate in chain propagation [4]. Details of these curing processes are described elsewhere [6].
The extent of crosslinking in UV-curable coatings can be quantified in several ways. Fourier-transform infrared spectroscopy (FTIR) can show the conversion of chemical bonds from monomer to polymer, indicating the extent of crosslinking [1]. Although widely used, surface FTIR (attenuated total reflection, or ATR-FTIR) is typically limited to a very shallow depth of the coating—the exact depth is quantitatively dependent on indices of refraction and on the incident angle of the IR light, but typical experimental values range from 0.6 to 2 μm [7]. (Certain research applications may use infrared spectroscopy in a transmission mode, but that approach is inappropriate for coatings applied to IR-opaque substrates.) Depending on the sample, the penetration depth of ATR-FTIR may be appropriate to measure curing at the surface of the coating, but may not represent the curing throughout the entire thickness of the coating. Other spectroscopic techniques, including Raman spectroscopy, ultimately face the same question of penetration depth. Penetration depth is, of course, also affected by the opacity of the sample at the particular wavelength of light used in the experiment.
For many applications, nuclear magnetic resonance (NMR) offers an attractive alternative to traditional optical spectroscopy for quantifying crosslinking in polymeric films, including UV-curable coatings. While traditional, high-field NMR typically requires samples to be in a 5-mm diameter NMR tube that is inserted into the bore of the superconducting magnet, single-sided NMR devices can directly probe materials at surfaces without sampling or sample preparation [8,9]. These devices, while unable to record chemical-shift–resolved spectra, can measure relaxation of nuclear spin states, which is directly affected by the degree of crosslinking [10]. In this regard, single-sided magnets perform similarly to optical spectroscopy, albeit with much lower sensitivity. However, the design of these magnets imparts a fixed and strong magnetic field gradient that, in analogy to clinical MRI, can be used in an imaging modality via Fourier transformation. In this way, the extent of curing can be probed in a spatially selective manner throughout the entire thickness of the sample, even for samples over 100 μm thick, with a spatial resolution on the order of a few microns [11].
In this report, we describe the use of single-sided magnets to investigate the extent of crosslinking in a UV-curable polymer system comprising poly(ethylene glycol) diacrylate (PEGDA), in a spatially sensitive manner. The effects of the scavenger molecule PPh3, the UV intensity, and the thickness of the coating on the extent of curing are reported. In addition, we report the use of sequential Fourier and inverse Laplace transformations to visualize the relaxation cross-section of a sample that describes the extent of crosslinking throughout the sample thickness. Spatially selective NMR measurements of coatings have only been lightly reported in the literature [12], and those reports have not leveraged Fourier transformations of the NMR data to optimize spatial resolution. These steps improve the utility of single-sided NMR in investigating (polymeric) films via their spatially variant relaxation times.
2. Results
NMR data collected using single-sided magnets cannot capture chemical shift information. When using these devices, typical experiments are made with a single excitation pulse followed by a train of refocusing pulses; interleaved between refocusing pulses are acquisition windows that each capture the refocused magnetization “echo”: a record of the signal intensity that no longer contains chemical shift information. This Carr–Purcell–Meiboom–Gill (CPMG) pulse sequence is crucial to the success of single-sided NMR, as its refocusing sustains measurable signals long enough to be successfully recorded in a highly inhomogeneous magnetic field [13,14]. Consequently, the CPMG pulse sequence can be used to evaluate time-dependent signal attenuation that is ultimately related to physical properties of materials. In a CPMG measurement, each echo, like traditional free-induction decay (FID) signals, is made of some number of complex data points each measured over some dwell time. In our data processing, each echo is individually subjected to Fourier transformation, converting the time domain echo signal to a frequency domain signal that, because of the permanent magnetic field gradient, is proportional to a spatial domain signal. Once every echo has been transformed into the spatial domain, the signal decay (over the many successive echoes) at each position is subjected to an inverse Laplace transformation (ILT), the result of which is a relaxation “spectrum” at each position. An ILT produces a spectrum showing the intensity of various relaxation rates that, when added, best represent the overall signal attenuation in the signal: smaller T2 relaxation times (to the left of the ILT spectrum) indicate greater relaxation which, in turn, suggests more crosslinking [15]. The final product of this data processing approach is a relaxation cross-section (position, z, vs. T2) that shows differences in local crosslinking at different depths in the sample. The details of ILTs are described in detail elsewhere [16], and the entire data processing procedure is outlined in Figure 1.
The relaxation cross-section (or z-T2 map) highlights the T2 relaxation values at different positions within the sample. As an example, Figure 2 shows a z-T2 map of a PEGDA sample that was not spun, and remains relatively thick (~80 μm). The UV light penetrates only the top ~20 μm of this thick sample (the top of the sample is in the negative z direction), which becomes crosslinked (smaller T2, around 10−3 s), while the lower ~60 μm of the coating (away from the UV light, towards the positive z direction) remain less crosslinked (larger T2, around 10−2 s). This method of data presentation highlights spatial variations in relaxation times and is used throughout this report.
Figure 3 highlights the correspondence between ATR-FTIR and T2 measurements of crosslinking in the PEGDA network. The IR spectra are normalized to the peak at 1726 cm−1, corresponding to the acrylic carbonyl group; these carbonyl groups are largely unaffected during curing and their IR intensities should remain fixed. In contrast, the terminal CH=CH2 bonds on the PEGDA monomers produce a peak at 1410 cm−1 [17,18,19,20]. A decrease in the intensity of the 1410 cm−1 peak when the sample is exposed to UV light indicates curing. Simultaneously, the measured T2 value decreases after the sample has been exposed to UV irradiation. Crosslinking is associated with reduced T2 values, as reported elsewhere [15].
When radical-driven curing of PEGDA polymers is performed in the presence of atmospheric oxygen, the oxygen can form radicals that interfere with crosslinking in the polymer network [4]. Several methods can be employed to circumvent this, including curing in an anaerobic environment (requiring engineering controls) or adding a scavenger molecule (PPh3 in our samples) that mitigates the deleterious effects of oxygen [4,5]. Figure 4 shows z-T2 maps of several samples that are cured in (an oxygen-containing) lab atmosphere. The leftmost column of Figure 4 (Figure 4a–f) lacks PPh3. Their z-T2 maps highlight that there is no change in T2 (i.e., no crosslinking) in the samples regardless of the UV power deposited into the sample. Furthermore, there is little evidence of a curing gradient throughout the thickness of the sample (a spatially dependent T2), suggesting that the oxygen-driven inhibition effect takes place, as expected, at the sample/air interface. Possible exceptions to this are in Figure 4e,f, in which “tails” with shorter T2s appear near the bottom (positive z direction, near the glass interface) of the sample. In these samples, exposed to the highest UV power, it is possible that some curing occurs ~15 μm below the sample surface. This suggests that, although atmospheric oxygen inhibits curing at the coating surface, some crosslinking may still occur in regions of the sample inaccessible to oxygen provided there is sufficient UV power.
The second column of Figure 4 (Figure 4g–l) shows the effect of increasing amounts of the scavenger PPh3, from 0–5% w/w, on crosslinking in the PEGDA sample. At low concentrations of PPh3, the sample retains a large T2 value (less crosslinking), and as PPh3 increases, T2 decreases, indicating more crosslinking. Using these data, we elected to use 1% PPh3 (Figure 4j) as a standard sample to evaluate the extent of crosslinking as a function of UV power. This power-dependent series (0–100% UV power, 1% PPh3) are shown in the rightmost column of Figure 4 (Figure 4m–r). As expected, measured T2 values decrease with increasing UV power; again, this is consistent with increased crosslinking in the sample.
3. Discussion
Single-sided NMR is highly conducive to in situ measurements of coatings on surfaces. Along with optical methods (e.g., ATR-FTIR and Raman), NMR can probe the extent of crosslinking within a sample; in magnetic resonance contexts, this is most easily measured as a change in the spin-spin relaxation time T2. However, NMR offers a much larger spatial range (in the depth dimension) for measurements than do non-confocal optical techniques. In this regard, we observe a crosslinking “gradient” throughout the thickness of a particularly thick UV-cured coating sample (see Figure 2). NMR is successful in evaluating crosslinking differences that are due to both different UV intensities and to different chemical compositions (different amounts of scavenger PPh3 in our case). In other words, single-sided NMR is insensitive to the cause of differences in crosslinking, which may prove useful where in situ analyses are intended only to measure the extent of crosslinking.
Despite its ability to probe thick samples, single-sided NMR measurements show poor spatial resolution relative to many optical techniques, both laterally and in the depth dimension. Single-sided NMR devices use surface coils that are typically several square centimeters in area, meaning that relaxation measurements reflect a lateral spatial average over that area. This is less problematic for homogeneous materials (such as coatings), but needs to be considered during experimental design. The spatial resolution in the depth dimension is fundamentally related to the magnetic field gradient and the acquisition parameters: strong field gradients and large acquisition times (both possible with single-sided devices) result in high spatial resolution. Practically, the coplanarity of the sample with the magnet’s “sweet spot” restricts the resolution in the depth dimension: less-than-perfect coplanarity between the sample and the sweet spot will blur the resolution of the measurement. Generally, the depth resolution of single-sided NMR measurements is on the order of 10 μm, though careful calibration and experimental setup can improve this several-fold [11].
Simple future experiments with single-sided NMR extends this work to coatings of other compositions, including different effective molecular weights of PEGDA. A more sophisticated approach may be to exploit dipolar coupling in crosslinked materials to more quantitatively probe crosslinking in a material. This method has been demonstrated elsewhere on elastomers [22,23] and may circumvent some of the limitations of T2 determinations from CPMG data, in particular a strong dependence on both equipment-specific and user-selected experimental parameters. Furthermore, single-sided NMR may be particularly well suited to evaluating the extent of crosslinking within interpenetrating polymer networks (IPNs) [24]; these coatings consist of two or more phases that in tandem produce specific material properties.
4. Materials and Methods
4.1. Samples
Samples comprised different ratios of poly(ethylene glycol) diacrylate (Mn = 700 g mol−1), photoinitiator 1-hydroxycyclohexyl phenyl ketone (HPCK, 2% w/w), and triphenylphosphine (PPh3). All chemicals were used as received without further purification (Sigma-Aldrich, St. Louis, MO, USA). HCPK and PPh3 were dissolved into acetone prior to being added to the sample. The amount of PPh3 varied per experiment from 0% to 5% by weight with the total amount of acetone fixed at 7% w/v. Slides were prepared with a piece of labeling tape in the middle with a ~1 cm diameter circle cut out in the tape; this tape was designed to contain the sample in a region that could be uniformly cured by the UV gun and that would fit in the sensitive region of the NMR magnet. Ten microliters of the sample were placed on a glass slide in the center of the circle. Most slides were spun at a rate of ~3000 rpm for 30 s using a 3D-printed spin coater driven by a computer hard drive motor. (One sample slide was intentionally left thick and was not spun.) While spinning, the sample, at a distance of ~1.4 cm from the UV source, was cured using a ThorLabs CS2010 LED UV curing system (ThorLabs, Inc., Ann Arbor, MI, USA). At 100%, the UV system outputs 185 mW cm−2 at 365 nm (instrument-internal calibration). The power of the UV system was adjusted to 20%, 40%, 60%, 80%, and 100% of the maximum power—the output varied linearly with nominal power. After spinning and curing, samples had a thickness of ~20 μm, determined using a Profilm3D surface profiler (Filmetrics, Inc.; San Diego, CA, USA).
4.2. NMR Measurements
All NMR measurements were made with a PM5 NMR-MOUSE (B0 = 0.4 T) operated by a Kea2 spectrometer (Magritek, Ltd., Wellington, New Zealand). An initial CPMG [13,14] sequence was run on each slide to center the magnet to find the most signal. The B1 frequency was adjusted by a maximum of 50 kHz (~50 μm) to center the maximum signal in the acquisition window. (The rf coil has a bandwidth of ~350 kHz, so these adjustments do not substantially affect the coil sensitivity). This short CPMG had 512 scans, a 1 μs dwell time and 128 complex points. Subsequently, a final CPMG was run for data collection with 4096 scans, 10 μs dwell time, and 32 complex points with all other parameters staying constant between slides. NMR measurements were taken directly after curing to minimize outside factors, such as extra exposure to UV light.
4.3. FTIR Measurements
FTIR data were collected using a Digital Labs FTS 7000 ATR-FTIR (Varian, Inc., Palo Alto, CA, USA). The samples were made of PEGDA with 2% HCPK and 2% PPh3 (w/w) and were prepared in the same manner as those for NMR data collection. A blank microscope slide was used for the background scan; all measurements were made from 600 cm−1 to 2000 cm−1 with 1 cm−1 resolution for 64 scans.
4.4. Data Processing
All data processing was performed in Matlab (Mathworks, Inc., Natick, MA, USA) using custom processing scripts. These scripts for importing and Fourier transforming the NMR data were made in house and are available at the institutional repository of the corresponding author. Inverse Laplace transformation was also performed in Matlab using scripts provided by Petrik Galvosas (University of Wellington, New Zealand) [25].
Acknowledgments
Acknowledgment is made to the Donors of the American Chemical Society Petroleum Research Fund for support of this research.
Author Contributions
All authors conceived and designed the experiments; M.B. and F.M. conducted experiments and analyzed the data; and M.B. and T.M. wrote the paper.
Conflicts of Interest
The authors declare no conflict of interest.
References
- Young, R.J.; Lovell, P.A. Introduction to Polymers, 3rd ed.; CRC Press: Boca Raton, FL, USA, 2011; ISBN 9780849339295. [Google Scholar]
- Decker, C. Kinetic Study and New Applications of UV Radiation Curing. Macromol. Rapid Commun. 2002, 23, 1067–1093. [Google Scholar] [CrossRef]
- Scherzer, T. Depth Profiling of the Degree of Cure during the Photopolymerization of Acrylates Studied by Real-Time FT-IR Attenuated Total Reflection Spectroscopy. Appl. Spectrosc. 2002, 56, 1403–1412. [Google Scholar] [CrossRef]
- Ligon, S.C.; Husár, B.; Wutzel, H.; Holman, R.; Liska, R. Strategies to reduce oxygen inhibition in photoinduced polymerization. Chem. Rev. 2014, 114, 557–589. [Google Scholar] [CrossRef] [PubMed]
- Husár, B.; Ligon, S.C.; Wutzel, H.; Hoffmann, H.; Liska, R. The formulator’s guide to anti-oxygen inhibition additives. Prog. Org. Coat. 2014, 77, 1789–1798. [Google Scholar] [CrossRef]
- Hoyle, C.E. Photocurable Coatings. In Radiation Curing of Polymeric Materials; ACS Symposium Series; American Chemical Society: Washington, DC, USA, 1990; Volume 417, pp. 1–16. ISBN 9780841217300. [Google Scholar]
- Urbaniak-Domagala, W. The use of the spectrometric technique FTIR-ATR to examine the polymers surface. In Advanced Aspects of Spectroscopy; InTech: Rijeka, Croatia, 2012. [Google Scholar]
- Blümich, B.; Perlo, J.; Casanova, F. Mobile single-sided NMR. Prog. Nucl. Magn. Reson. Spectrosc. 2008, 52, 197–269. [Google Scholar] [CrossRef]
- Single-Sided NMR; Casanova, F.; Perlo, J.; Blümich, B. (Eds.) Springer: Berlin/Heidelberg, Germany, 2011; p. 244. ISBN 9783642163067. [Google Scholar]
- Litvinov, V.M. Characterisation of Chemical and Physical Networks in Rubbery Materials Using Proton NMR Magnetisation Relaxation. In Spectroscopy of Rubber and Rubbery Materials; Litvinov, V.M., De, P.P., Eds.; Rapra Technology Limited: Shropshire, UK, 2002; pp. 353–400. ISBN 9781859572801. [Google Scholar]
- Perlo, J.; Casanova, F.; Blümich, B. Profiles with microscopic resolution by single-sided NMR. J. Magn. Reson. 2005, 176, 64–70. [Google Scholar] [CrossRef] [PubMed]
- Küchel, J. NMR Probing of the Polymer Structure in UV Curable Acrylate Coatings; Eindhoven University of Technology: Eindhoven, The Netherlands, 2006. [Google Scholar]
- Carr, H.Y.; Purcell, E.M. Effects of Diffusion on Free Precession in Nuclear Magnetic Resonance Experiments. Phys. Rev. 1954, 94, 630–638. [Google Scholar] [CrossRef]
- Meiboom, S.; Gill, D. Modified Spin-Echo Method for Measuring Nuclear Relaxation Times. Rev. Sci. Instrum. 1958, 29, 688. [Google Scholar] [CrossRef]
- Herrmann, V.; Unseld, K.; Fuchs, H.B.; Blümich, B. Molecular dynamics of elastomers investigated by DMTA and the NMR-MOUSE®. Colloid Polym. Sci. 2002, 280, 758–764. [Google Scholar] [CrossRef]
- Venkataramanan, L.; Song, Y.-Q.; Hürlimann, M.D. Solving Fredholm integrals of the first kind with tensor product structure in 2 and 2.5 dimensions. IEEE Trans. Signal Process. 2002, 50, 1017–1026. [Google Scholar] [CrossRef]
- Witte, R.P.; Blake, A.J.; Palmer, C.; Kao, W.J. Analysis of poly(ethylene glycol)-diacrylate macromer polymerization within a multicomponent semi-interpenetrating polymer network system. J. Biomed. Mater. Res. A 2004, 71, 508–518. [Google Scholar] [CrossRef] [PubMed]
- Lin, H.; Kai, T.; Freeman, B.D.; Kalakkunnath, S.; Kalika, D.S. The Effect of Cross-Linking on Gas Permeability in Cross-Linked Poly(Ethylene Glycol Diacrylate). Macromolecules 2005, 38, 8381–8393. [Google Scholar] [CrossRef]
- Lin, H.; Wagner, E.V.; Swinnea, J.S.; Freeman, B.D.; Pas, S.J.; Hill, A.J.; Kalakkunnath, S.; Kalika, D.S. Transport and structural characteristics of crosslinked poly(ethylene oxide) rubbers. J. Membr. Sci. 2006, 276, 145–161. [Google Scholar] [CrossRef]
- Sagle, A.C.; Ju, H.; Freeman, B.D.; Sharma, M.M. PEG-based hydrogel membrane coatings. Polymer 2009, 50, 756–766. [Google Scholar] [CrossRef]
- Oligschläger, D.; Glöggler, S.; Watzlaw, J.; Brendel, K.; Jaschtschuk, D.; Colell, J.; Zia, W.; Vossel, M.; Schnakenberg, U.; Blümich, B. A Miniaturized NMR-MOUSE with a High Magnetic Field Gradient (Mini-MOUSE). Appl. Magn. Reson. 2015, 46, 181–202. [Google Scholar] [CrossRef]
- Wiesmath, A.; Filip, C.; Demco, D.E.; Blümich, B. Double-Quantum-Filtered NMR Signals in Inhomogeneous Magnetic Fields. J. Magn. Reson. 2001, 149, 258–263. [Google Scholar] [CrossRef] [PubMed]
- Wiesmath, A.; Filip, C.; Demco, D.E.; Blümich, B. NMR of Multipolar Spin States Excitated in Strongly Inhomogeneous Magnetic Fields. J. Magn. Reson. 2002, 154, 60–72. [Google Scholar] [CrossRef] [PubMed]
- Fouassier, J.P.; Lalevée, J. Photochemical Production of Interpenetrating Polymer Networks; Simultaneous Initiation of Radical and Cationic Polymerization Reactions. Polymers 2014, 6, 2588–2610. [Google Scholar] [CrossRef]
- Callaghan, P.T.; Arns, C.H.; Galvosas, P.; Hunter, M.W.; Qiao, Y.; Washburn, K.E. Recent Fourier and Laplace perspectives for multidimensional NMR in porous media. Magn. Reson. Imaging 2007, 25, 441–444. [Google Scholar] [CrossRef] [PubMed]
Figure 1.
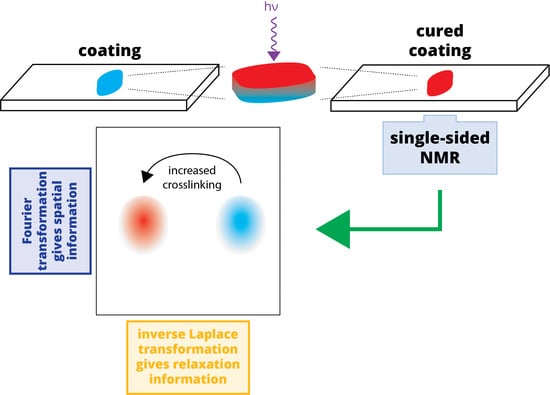
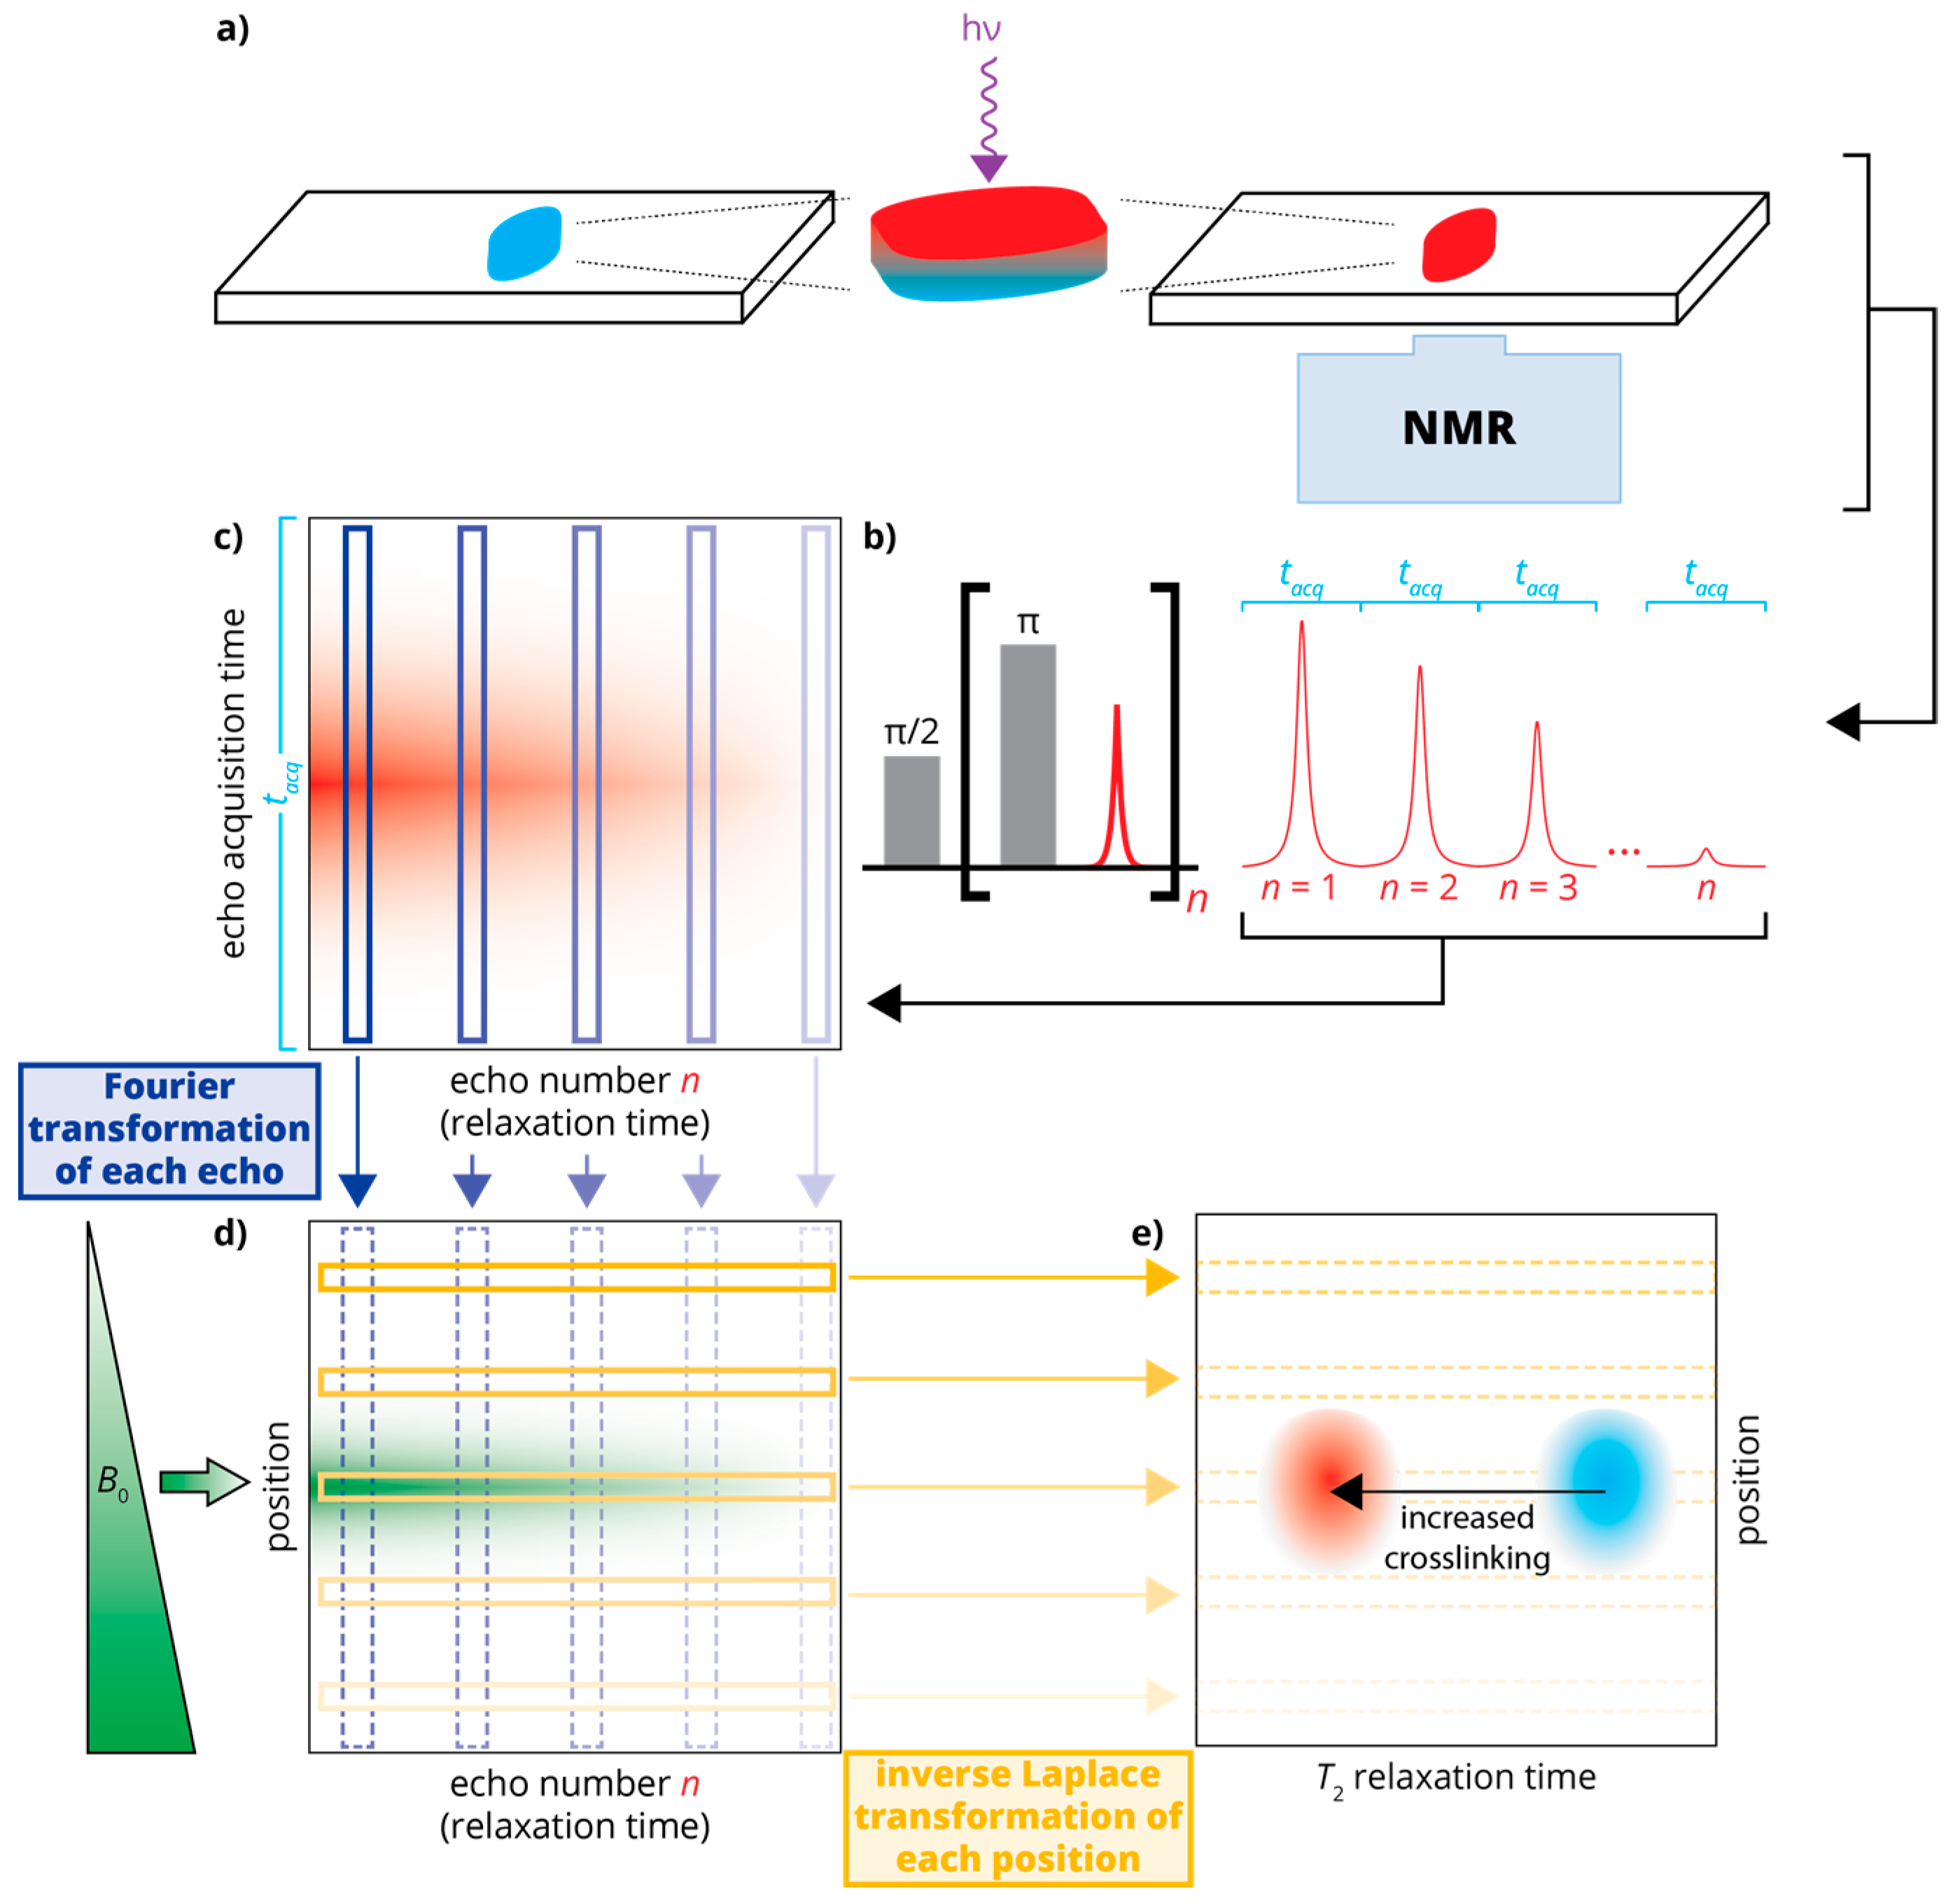
Schematic of the experimental setup and data processing: (a) An uncured sample of poly(ethylene glycol) diacrylate (PEGDA)/photoinitiator is applied to a glass slide and cured using UV irradiation. This sample is placed atop the single-sided NMR for measurements; (b) The NMR relaxation data is recorded using a Carr-Purcell-Meiboom-Gill (CPMG) pulse sequence [13,14] as a series of echoes, each recorded over an acquisition window of length tacq; (c) The echoes are arranged in a 2D data set that is subject to Fourier transformation (d); producing a spatially dependent signal that decays in time; (e) This spatially dependent signal is subject to inverse Laplace transformation, changing the time domain (signal decay) to a relaxation domain. This produces a “relaxation cross-section” or z-T2 map, in which crosslinking can be monitored (via T2) in a spatially sensitive manner.
Figure 1.
Schematic of the experimental setup and data processing: (a) An uncured sample of poly(ethylene glycol) diacrylate (PEGDA)/photoinitiator is applied to a glass slide and cured using UV irradiation. This sample is placed atop the single-sided NMR for measurements; (b) The NMR relaxation data is recorded using a Carr-Purcell-Meiboom-Gill (CPMG) pulse sequence [13,14] as a series of echoes, each recorded over an acquisition window of length tacq; (c) The echoes are arranged in a 2D data set that is subject to Fourier transformation (d); producing a spatially dependent signal that decays in time; (e) This spatially dependent signal is subject to inverse Laplace transformation, changing the time domain (signal decay) to a relaxation domain. This produces a “relaxation cross-section” or z-T2 map, in which crosslinking can be monitored (via T2) in a spatially sensitive manner.

Figure 2.
A z-T2 map of a thick (~100 μm) coating sample containing 1% triphenylphosphine (PPh3). The top surface, exposed to the most intense UV irradiation, is more completely cured and shows greater crosslinking (smaller T2 values). UV does not penetrate well into the lower regions of the sample (towards the positive z direction), as indicated by the larger T2 relaxation times.
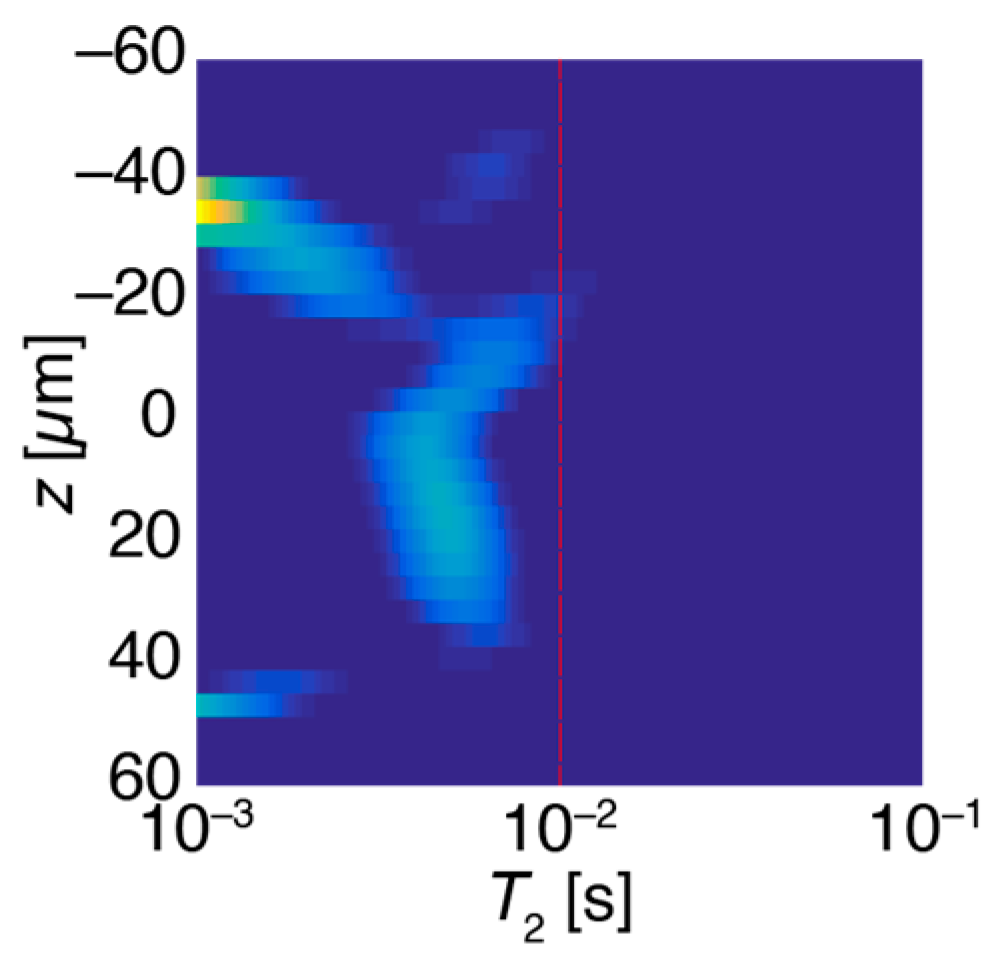
Figure 3.
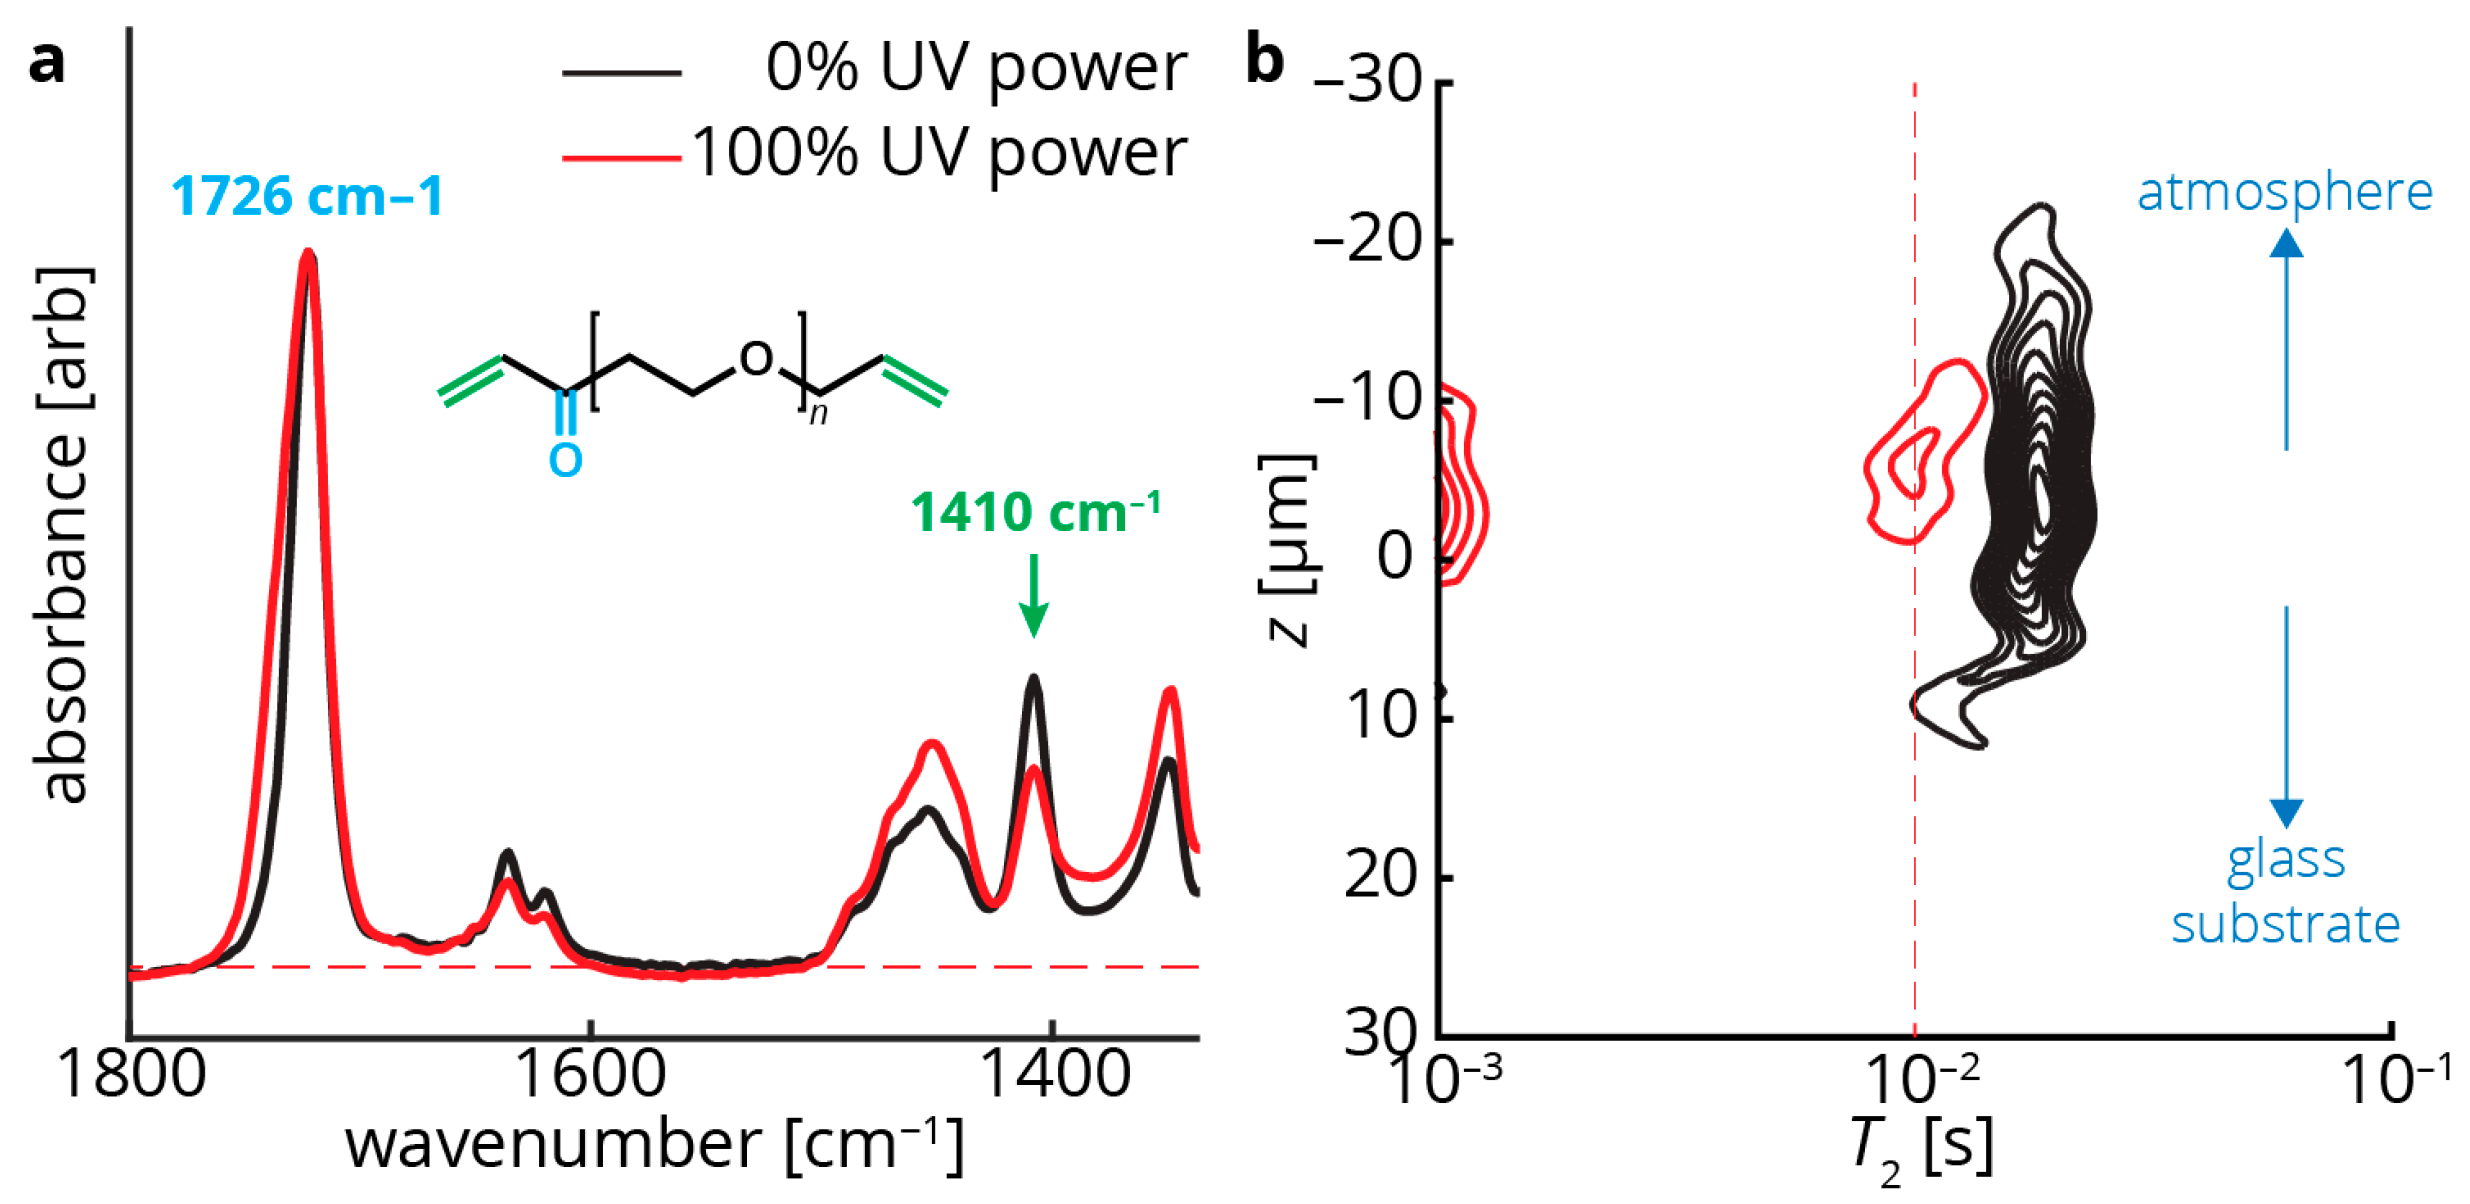
ATR-FTIR (attenuated total reflection–Fourier transform infrared spectroscopy) and single-sided NMR measurements of coating samples both uncured (black) and cured (red). (a) ATR-FTIR measurements indicate a peak at 1726 cm−1, matching the acrylate carbonyl (cyan in the poly(ethylene glycol) diacrylate (PEDGA) structure) stretch. This peak is expected to remain constant throughout curing as the carbonyl is mostly unaffected by polymerization. The signals are normalized to this peak. In contrast, the peak at 1410 cm−1, matching the terminal CH=CH2 groups (green in the PEGDA structure), diminish with increased crosslinking; (b) z–T2 map showing that increased crosslinking also correlates with a decrease in the measured T2 values (the peak range shifts to the left). In addition, an additional peak appears in the 100% UV power film (red) at T2 ~10−3 s. This may indicate a second T2 component in the material that exhibits rapid relaxation, often due to extensive crosslinking. This peak could not be accurately probed with our instrumentation, but other single-sided NMR devices may be able to access this information [21]. In addition to differences in T2, the two films in (b) are of different thicknesses—the uncured sample is ~30 μm thick, while the cured sample is ~10 μm thick.
Figure 3.
ATR-FTIR (attenuated total reflection–Fourier transform infrared spectroscopy) and single-sided NMR measurements of coating samples both uncured (black) and cured (red). (a) ATR-FTIR measurements indicate a peak at 1726 cm−1, matching the acrylate carbonyl (cyan in the poly(ethylene glycol) diacrylate (PEDGA) structure) stretch. This peak is expected to remain constant throughout curing as the carbonyl is mostly unaffected by polymerization. The signals are normalized to this peak. In contrast, the peak at 1410 cm−1, matching the terminal CH=CH2 groups (green in the PEGDA structure), diminish with increased crosslinking; (b) z–T2 map showing that increased crosslinking also correlates with a decrease in the measured T2 values (the peak range shifts to the left). In addition, an additional peak appears in the 100% UV power film (red) at T2 ~10−3 s. This may indicate a second T2 component in the material that exhibits rapid relaxation, often due to extensive crosslinking. This peak could not be accurately probed with our instrumentation, but other single-sided NMR devices may be able to access this information [21]. In addition to differences in T2, the two films in (b) are of different thicknesses—the uncured sample is ~30 μm thick, while the cured sample is ~10 μm thick.

Figure 4.
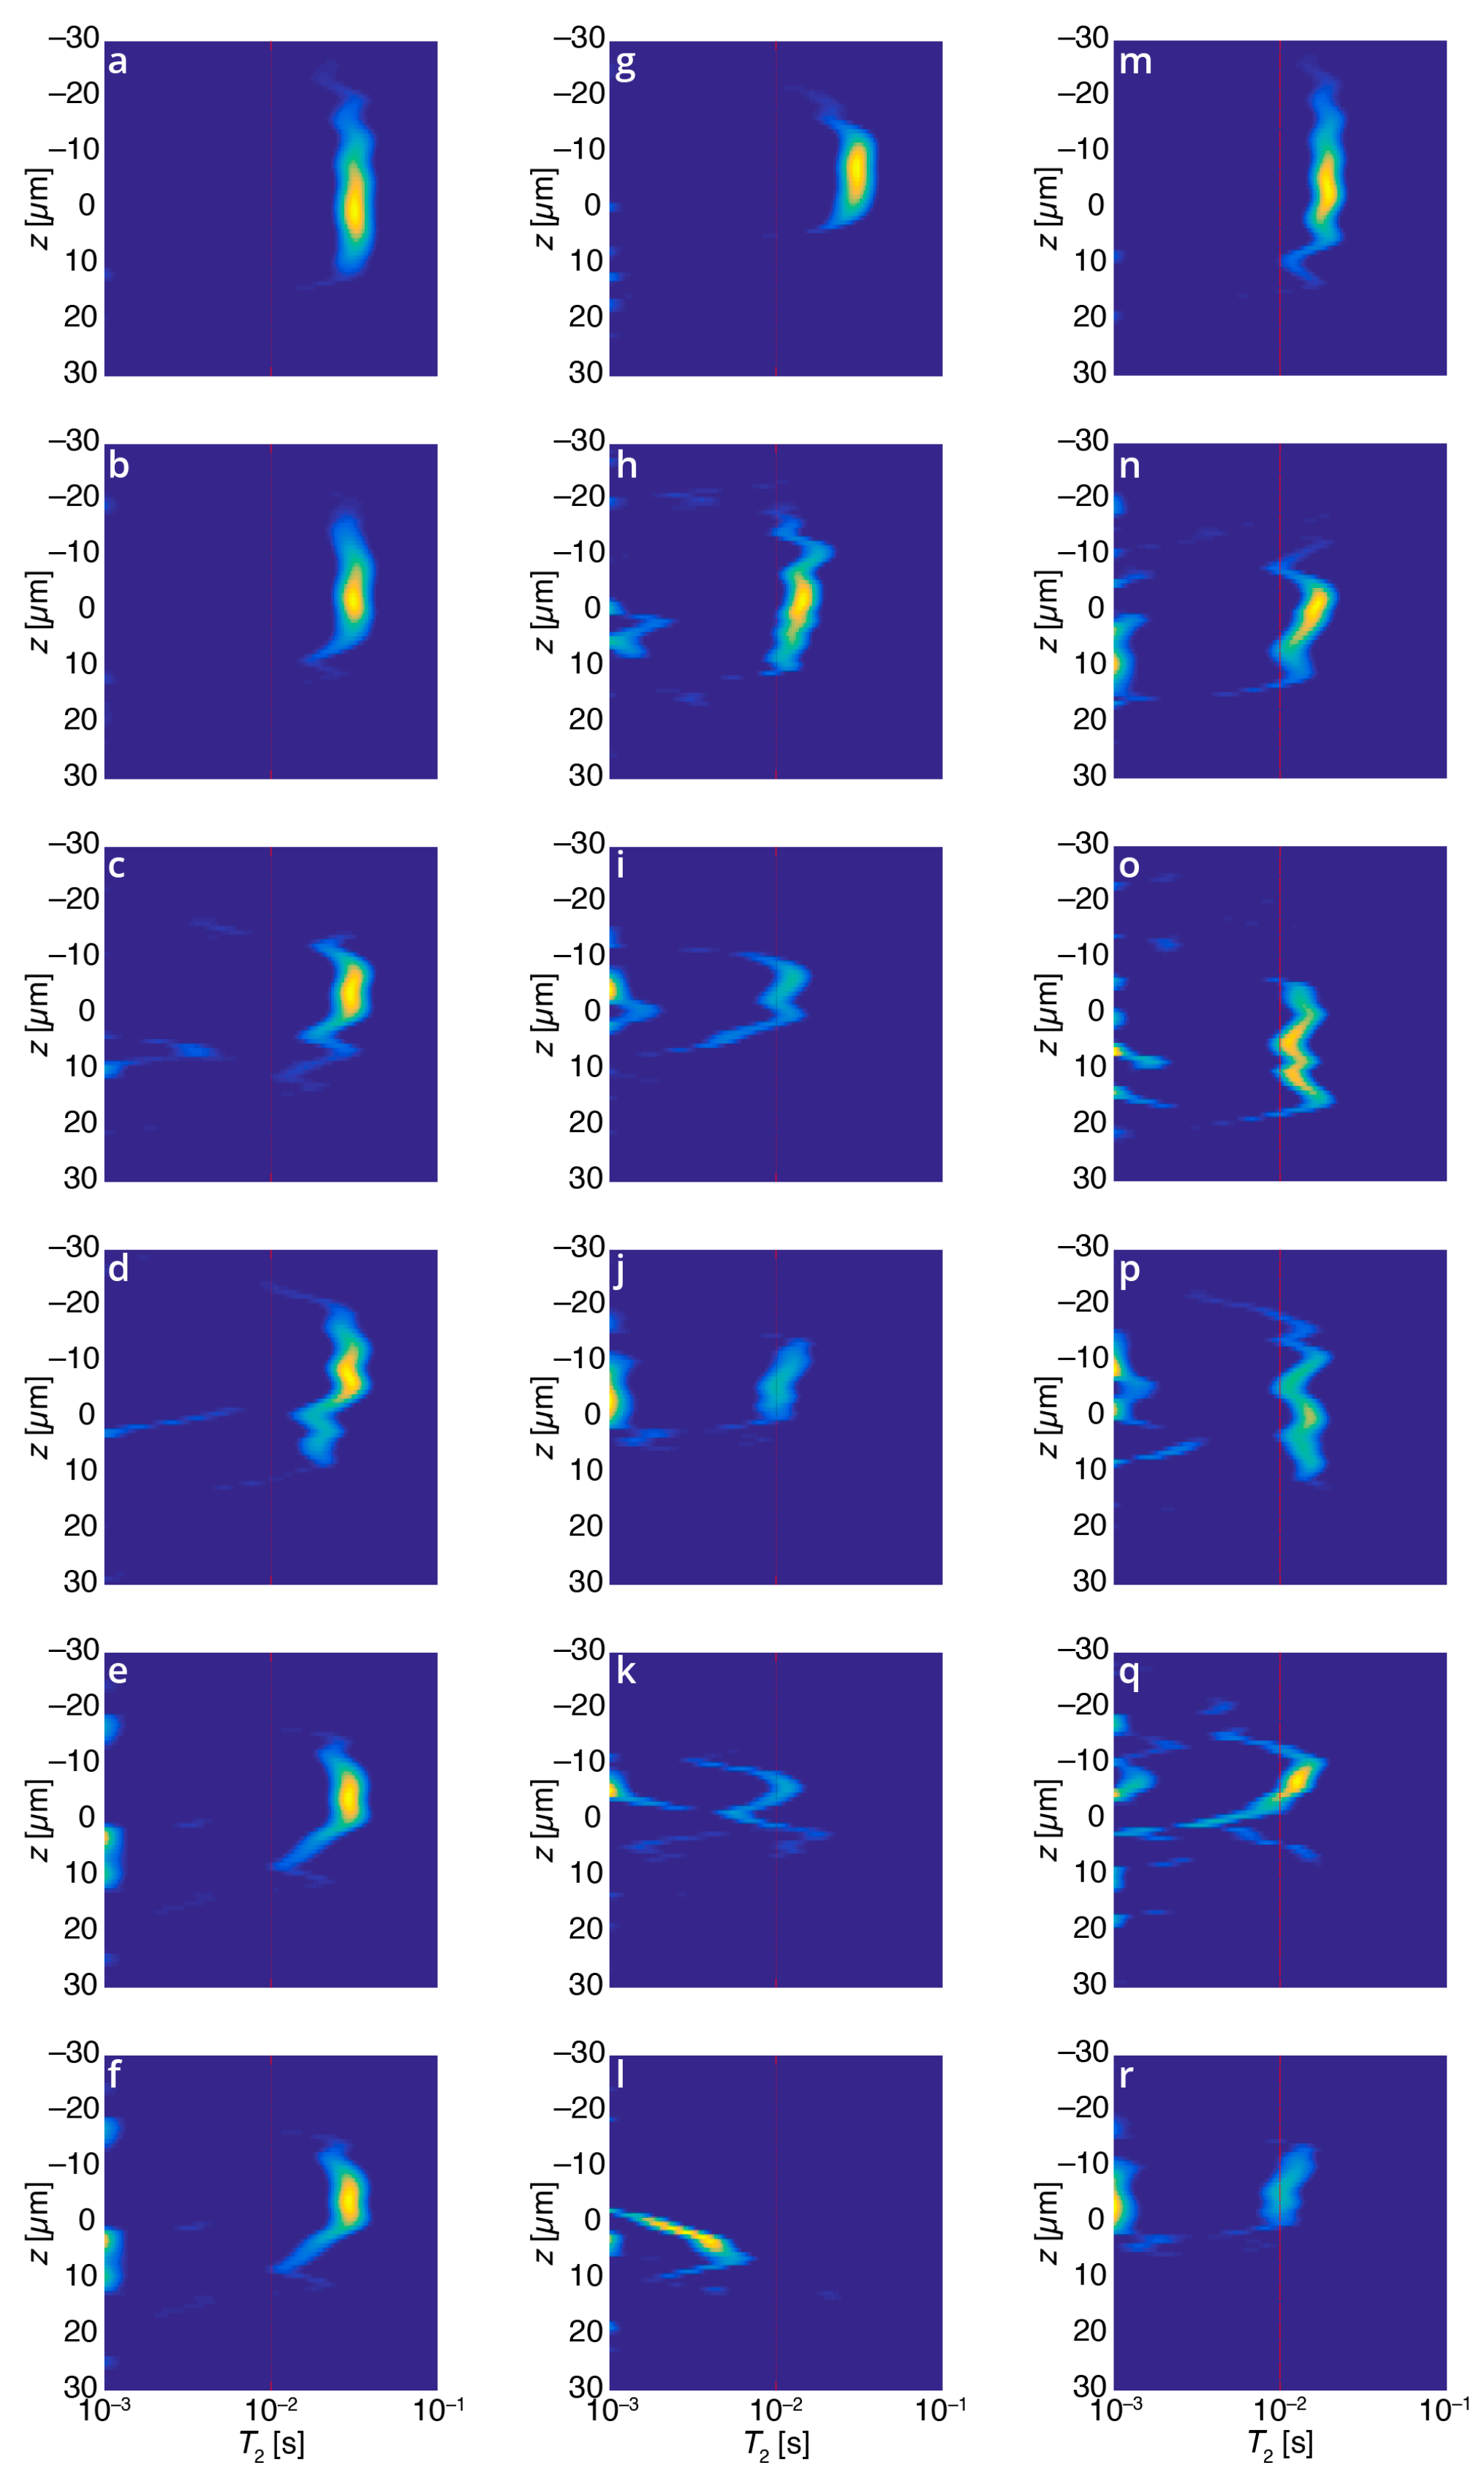
Relaxation cross-linking (or z–T2) maps for various coating samples, all with identical horizontal and vertical axes: (a–f) 0% triphenylphosphine (PPh3), UV powers of (top to bottom) 0%, 20%, 40%, 60% 80%, and 100% for 30 s curing. The T2 values are unaffected by UV intensity, suggesting that without the scavenger PPh3, no measurable curing of the sample occurs due to interferences from atmospheric oxygen; (g–l) Varying concentrations of scavenger PPh3 (top to bottom: 0%, 0.2%, 0.5%, 1%, 2%, 5% w/w) with constant (100%) UV intensity. The measured T2 values decrease with increasing PPh3 content, showing the scavenger’s ability to facilitate curing despite atmospheric interference from oxygen; (m–r) One percent PPh3, UV powers of (top to bottom) 0%, 20%, 40%, 60% 80%, and 100% for 30 s curing. In contrast to the leftmost column, when 1% PPh3 is added to the sample as a radical scavenger, increased UV intensity effects greater crosslinking in the sample, as manifest by a decrease in the measured T2 values.
Figure 4.
Relaxation cross-linking (or z–T2) maps for various coating samples, all with identical horizontal and vertical axes: (a–f) 0% triphenylphosphine (PPh3), UV powers of (top to bottom) 0%, 20%, 40%, 60% 80%, and 100% for 30 s curing. The T2 values are unaffected by UV intensity, suggesting that without the scavenger PPh3, no measurable curing of the sample occurs due to interferences from atmospheric oxygen; (g–l) Varying concentrations of scavenger PPh3 (top to bottom: 0%, 0.2%, 0.5%, 1%, 2%, 5% w/w) with constant (100%) UV intensity. The measured T2 values decrease with increasing PPh3 content, showing the scavenger’s ability to facilitate curing despite atmospheric interference from oxygen; (m–r) One percent PPh3, UV powers of (top to bottom) 0%, 20%, 40%, 60% 80%, and 100% for 30 s curing. In contrast to the leftmost column, when 1% PPh3 is added to the sample as a radical scavenger, increased UV intensity effects greater crosslinking in the sample, as manifest by a decrease in the measured T2 values.

© 2018 by the authors. Licensee MDPI, Basel, Switzerland. This article is an open access article distributed under the terms and conditions of the Creative Commons Attribution (CC BY) license (http://creativecommons.org/licenses/by/4.0/).
Share and Cite
MDPI and ACS Style
Brass, M.; Morin, F.; Meldrum, T. Spatially Resolved Measurements of Crosslinking in UV-Curable Coatings Using Single-Sided NMR. Magnetochemistry 2018, 4, 8. https://doi.org/10.3390/magnetochemistry4010008
AMA Style
Brass M, Morin F, Meldrum T. Spatially Resolved Measurements of Crosslinking in UV-Curable Coatings Using Single-Sided NMR. Magnetochemistry. 2018; 4(1):8. https://doi.org/10.3390/magnetochemistry4010008
Chicago/Turabian StyleBrass, Madeline, Frances Morin, and Tyler Meldrum. 2018. "Spatially Resolved Measurements of Crosslinking in UV-Curable Coatings Using Single-Sided NMR" Magnetochemistry 4, no. 1: 8. https://doi.org/10.3390/magnetochemistry4010008
Note that from the first issue of 2016, this journal uses article numbers instead of page numbers. See further details here.