Article

Adjusting the Magnetic Properties of ZrO2:Mn Nanocrystals by Changing Hydrothermal Synthesis Conditions

by
Izabela Kuryliszyn-Kudelska
1,*,
Witold Dobrowolski
1,
Monika Arciszewska
1,
Artur Małolepszy
2,
Leszek Stobinski
2 and
Roman Minikayev
1
1
Institute of Physics, Polish Academy of Sciences, Al. Lotników 32/46, 02-668 Warsaw, Poland
2
Faculty of Chemical and Process Engineering, Warsaw University of Technology, Waryńskiego 1, 00-645 Warsaw, Poland
*
Author to whom correspondence should be addressed.
Magnetochemistry 2018, 4(2), 28; https://doi.org/10.3390/magnetochemistry4020028
Submission received: 27 April 2018 / Revised: 8 June 2018 / Accepted: 11 June 2018 / Published: 13 June 2018

Abstract

:
The aim of the present work was to study the magnetic properties of ZrO2(Mn) nanocrystals prepared by microwave-assisted hydrothermal synthesis using three different precursors: KMnO4, MnCl2, and Mn(NO3)2. The structural characterization was performed by means of X-ray diffraction. The morphology of the samples was studied by using STEM microscopy. The magnetic properties were studied by means of alternating current (AC) susceptibility (at a small AC magnetic field with amplitude not exceeding 5 Oe) and direct current (DC) magnetization (up to 9 T). All of the samples demonstrated Curie–Weiss behavior at higher temperatures with negative values of the Curie–Weiss temperature θ. It was shown that the conditions of the synthesis, e.g., pH and the type of precursor, can be adjusted to decrease the value of the Curie–Weiss temperature and reduce antiferromagnetic interactions.

Graphical Abstract

1. Introduction

Zirconia (ZrO2) has attracted great interest for its unique physical properties and potential applications in electronics and optoelectronics. Zirconia is an important material used in industry in solid fuel cells, catalytic agents, ceramics, and gas sensors [1,2,3,4]. ZrO2 is a p-type semiconductor with a large and indirect band gap (6.1 eV in the cubic ground state phase, 5.87 and 5.83 eV in the tetragonal and monoclinic ones, respectively) [5]. Pure zirconia has a monoclinic structure at room temperature. It exhibits structural transformations when the temperature increases: first transforming to tetragonal form at approximately 1170 °C and then to a cubic fluorite structure at around 2370 °C [6]. Thus, depending on the synthesis method and thermal treatment, monoclinic, tetragonal, cubic, or a mixture of these phases might be present in zirconia-based crystals. In view of their applications, the cubic and tetragonal phases are important. The two high-temperature phases (cubic and tetragonal) have excellent mechanical, thermal, and dielectric properties, which make ZrO2 an ideal candidate for protective coatings, high-k dielectric materials, and chemically inert refractory materials [7]. The room temperature stabilization of these polymorphs is commonly achieved by the addition of another cation, such as Ca2+, Y3+, Ce4+, Ga3+, or Mg2+ [7,8,9,10]. It was shown that Mn2+ cations stabilize either the tetragonal or cubic form at increasing content [11,12,13,14].
In the context of commercial applications, doped magnetic oxides are of particular interest. As a typical semiconducting host, metal oxides, such as ZnO, TiO2, SnO2, or Cu2O, are usually considered [15,16,17]. In particular, many interesting reports exist in the area of transition metal (TM)-doped nanosized zirconia (ZrO2); (see, e.g., [14,18]) and references therein. In many cases, it was shown that TM doping does not play a crucial role and defects vacancies are responsible for the observed magnetism [19,20]. It was theoretically predicted by the use of ab initio electronic structure calculations that cubic Mn-stabilized ZrO2 should be ferromagnetic above 500 K [21]. Boujnah et al. calculated using the density functional theory (DFT) with the generalized gradient approximation (GGA) and the modified Becke–Johnson (mBJ) approach that a ferromagnetically ordered configuration is the ground state in Mn-doped cubic ZrO2 [22].
There are several experimental studies on ZrO2 doped with Mn. However, the magnetic properties of Mn-doped ZrO2 are not fully understood. The solubility of TM ions in ZrO2 host material is fairly low and the magnetic cluster formation is very often responsible for the observed magnetic properties [14,23,24]. No evidence of long-range ferromagnetic ordering was reported in nanoparticles of ZrO2 doped with Mn prepared either by the coprecipitation method [23] or by the nonaqueous sol-gel approach in benzyl alcohol [14]. Yu et al. found the presence of Mn2O3 secondary phase for nanosized samples with Mn content above x = 0.25 [23]. They observed paramagnetic behavior for samples below this Mn content. Pucci et al. observed two types of magnetic behavior: paramagnetic behavior for pristine nanocrystals and ferromagnetic behavior due to the presence of Mn3O4 phase after calcination [14]. Clavel et al. reported paramagnetic behavior for nanosized ZrO2:Mn samples prepared by the benzyl alcohol route [24]. Paramagnetic behavior was reported for polycrystalline Y-stabilized tetragonal zirconia with up to 10% of Mn prepared by the solid state method by equilibrium [25]. For samples doped with higher Mn content (15% and 20% of Mn), local ferrimagnetic ordering was observed due to the Mn3O4 secondary phase. Zippel et al. observed defect-induced room temperature ferromagnetism (RTFM) for both undoped and Mn-doped ZrO2 films grown by pulsed-laser deposition [26]. For cubic ZrO2:Mn film, a noticeable ferromagnetic saturation magnetization at 5 K was observed. The authors correlated the observed ferromagnetism with a high density of dislocations. Hong et al. [27] found that cubic Mn-doped ZrO2 films are ferromagnetic with TC above 400 K. The observed ferromagnetism was mainly due to the ferromagnetic (FM) Mn–Mn interactions via oxygen intermediates. The authors revealed that differently from the cubic case, FM in monoclinic Mn-doped ZrO2 films does not come only via exchange interactions, but also from defects. Kumar et al. synthesized nanostructures of tetragonal Mn-doped ZrO2 and the observed room temperature ferromagnetism originated from the oxygen vacancies [28].
Despite a number of available reports and experimentally observed evidence for the ferromagnetism of magnetic oxides, there is still an open question about the origin of magnetism in these compounds. The aim of the present study is to examine the influence of the preparation conditions on the structural and magnetic properties of the resultant nanosized materials. In particular, from the point of view of future applications, we aim to stabilize high temperature ZrO2 phases (tetragonal or cubic). We used a wet chemical microwave-assisted hydrothermal method to synthesize nanosized samples. The advantage of this technique is the really low temperature treatment, short processing time, use of simple equipment, and, additionally, the method is environmentally friendly. To the best of our knowledge, this method has not yet been used to synthesize ZrO2 with Mn. In the previous paper, we studied the magnetic and structural properties of ZrO2 doped with Fe [29]. We complete our experimental research about the effect of doping with TM on the magnetic properties of nanosized ZrO2.

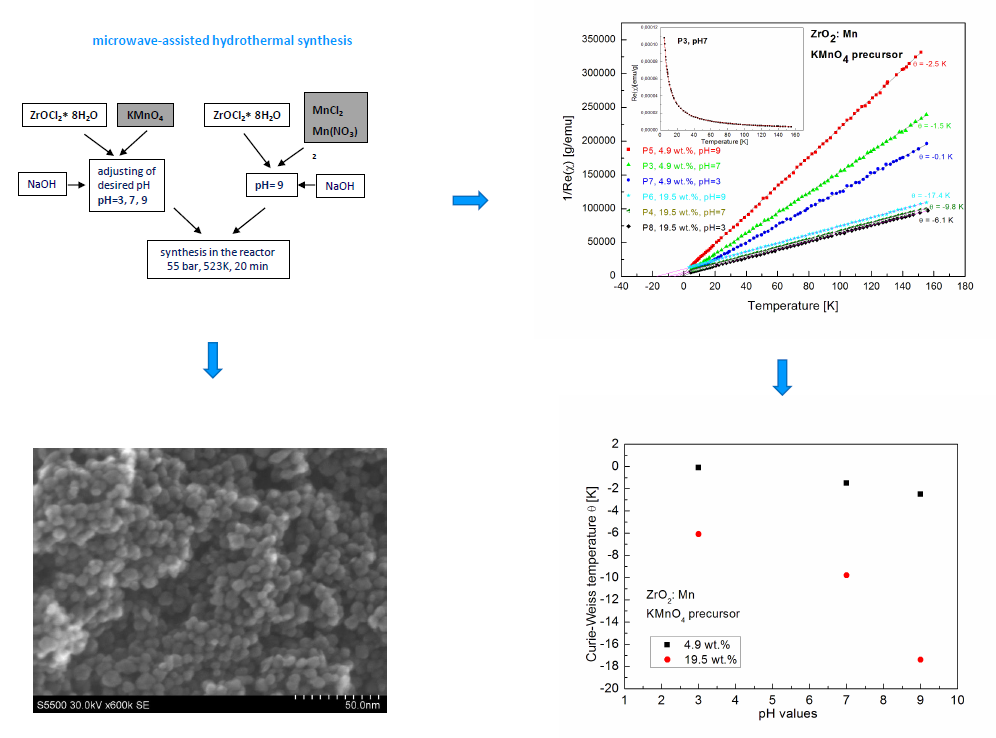
2. Sample Preparation and Experimental Methods

The nanocrystalline samples of ZrO2 doped with Mn were obtained by using the microwave-assisted hydrothermal method (Magnum II microwave reactor, ERTEC, Wroclaw, Poland). Two series of the samples were prepared. In the first series, the appropriate amounts of ZrOCl2·8H2O (puriss. p.a. ≥99.5%, Merck, Saint Louis, MO, USA) and KMnO4 (puriss p.a. ≥99.5%, Chempur, Piekary Slaskie, Poland) were dissolved in distilled water. Seventy-three milliliters (73 mL) of 0.05 M ZrOCl2 was used and 8 mL of KMnO4 with different concentrations was added. An amount of 0.05 M KMnO4 corresponded to 4.9 wt % Mn nominal concentration in the sample, and 0.2 M KMnO4 corresponded to 19.5 wt % Mn nominal concentration in the sample. The obtained solution was put in an ultrasonic bath. The desired pH of the mixture (pH = 3, 7, 9) was adjusted by using 1 M NaOH (puriss p.a. ≥98.8%, Chempur, Piekary Slaskie, Poland). The microwave-assisted synthesis was conducted during 20 min in a reactor under a pressure of 55 bar. The reaction temperature was equal to 523 K. In the second series of the samples, we used two different precursors: MnCl2 (puriss. p.a. ≥98.0%, Merck, Saint Louis, MO, USA) and Mn(NO3)2 (purum p.a. ≥97.0%, Merck, Saint Louis, MO, USA). In this case, we used 0.05 M MnCl2/Mn(NO3)2, which corresponded to 4.9 wt % Mn nominal concentration in the sample, and 0.1 M MnCl2/Mn(NO3)2, which corresponded to 9.8 wt % Mn nominal concentration in the sample. Seventy-three milliliters (73 mL) of 0.05 M ZrOCl2 and 8 mL of MnCl2/Mn(NO3)2 (with the two different concentrations given above) were used. The pH = 9 was adjusted in the second method of synthesis. The microwave assisted synthesis was conducted during 20 min in the reactor under a pressure of 55 bar. The reaction temperature was equal to 523 K. Two undoped reference samples were synthesized with 0.05 M ZrOCl2 precursor for pH = 3 and pH = 7. The procedure of synthesis used allowed us to study the influence of various precursors as well as the pH of the mixture on structural and magnetic properties of the resultant samples. The details of the synthesis procedure are collected in Table 1.
The high resolution X-ray diffraction measurements were performed by using a Philips X’Pert Pro MPD Alpha1 Bragg–Brentano powder diffractometer (Cu Kα radiation was used, Malvern Panalytical, Eindhoven, the Netherlands). The morphology of the samples was studied by using a Hitachi s5500 scanning-transmission electron microscope (STEM, HITACHI, Tokyo, Japan). The magnetic properties were studied by using an AC/DC Lake Shore 7000 magnetometer (Lake Shore Cryotronics, Inc., Westerville, OH, USA). Alternating current (AC) magnetic susceptibility χ measurements in the temperature range 4.2–160 K were performed. The real, Re(χ), as well as the imaginary, Im(χ), parts of the magnetic susceptibility were collected in an AC magnetic field of frequency (f) range 7–10,000 Hz and amplitude not exceeding 5 Oe. Magnetization (M) was measured using the extraction technique in a magnetic field of up to 9 T.

3. Results and Discussion

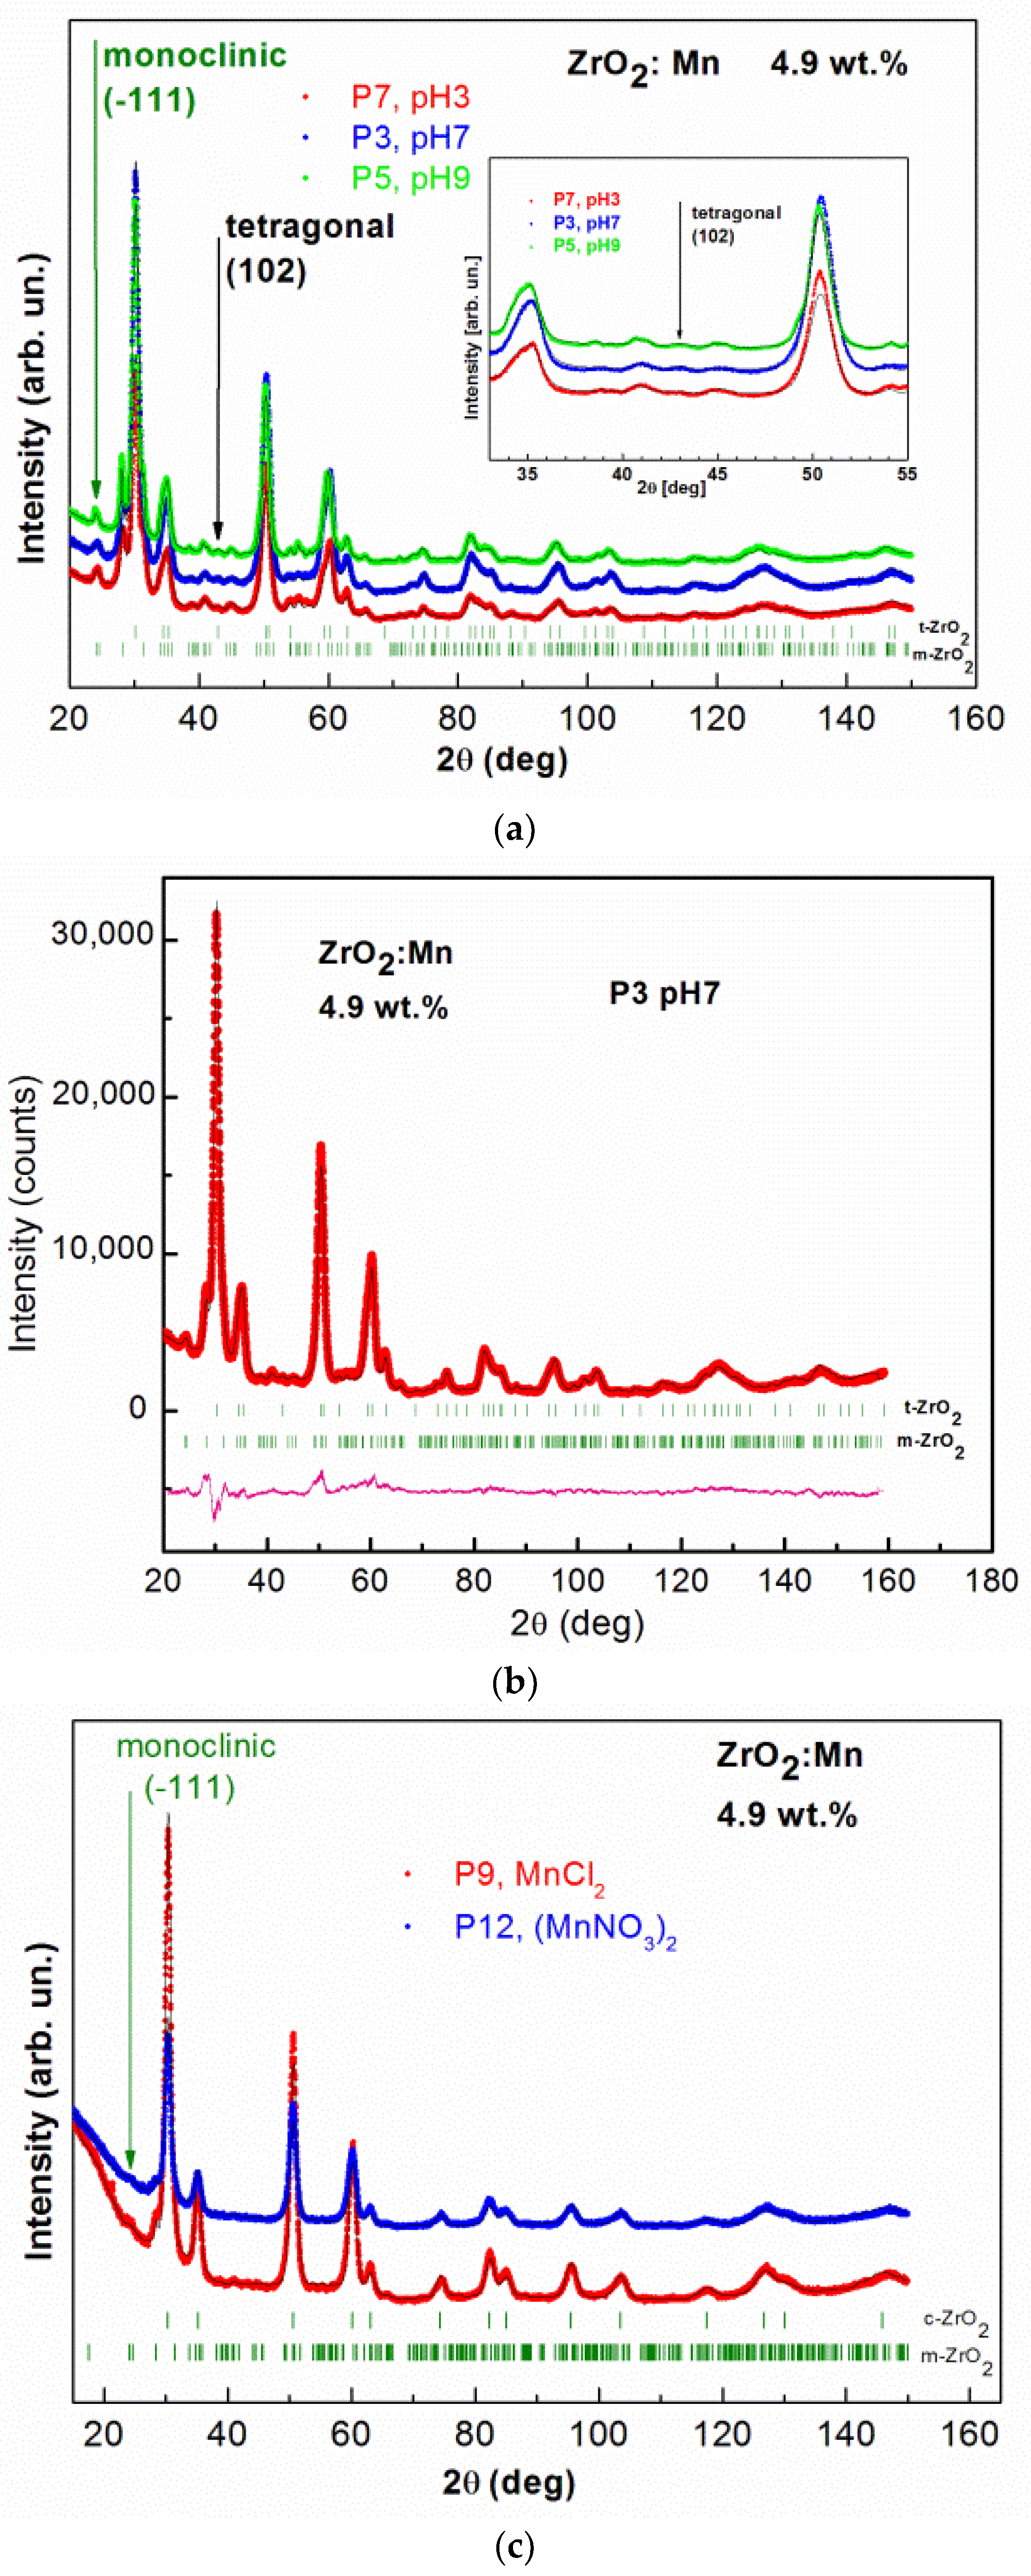
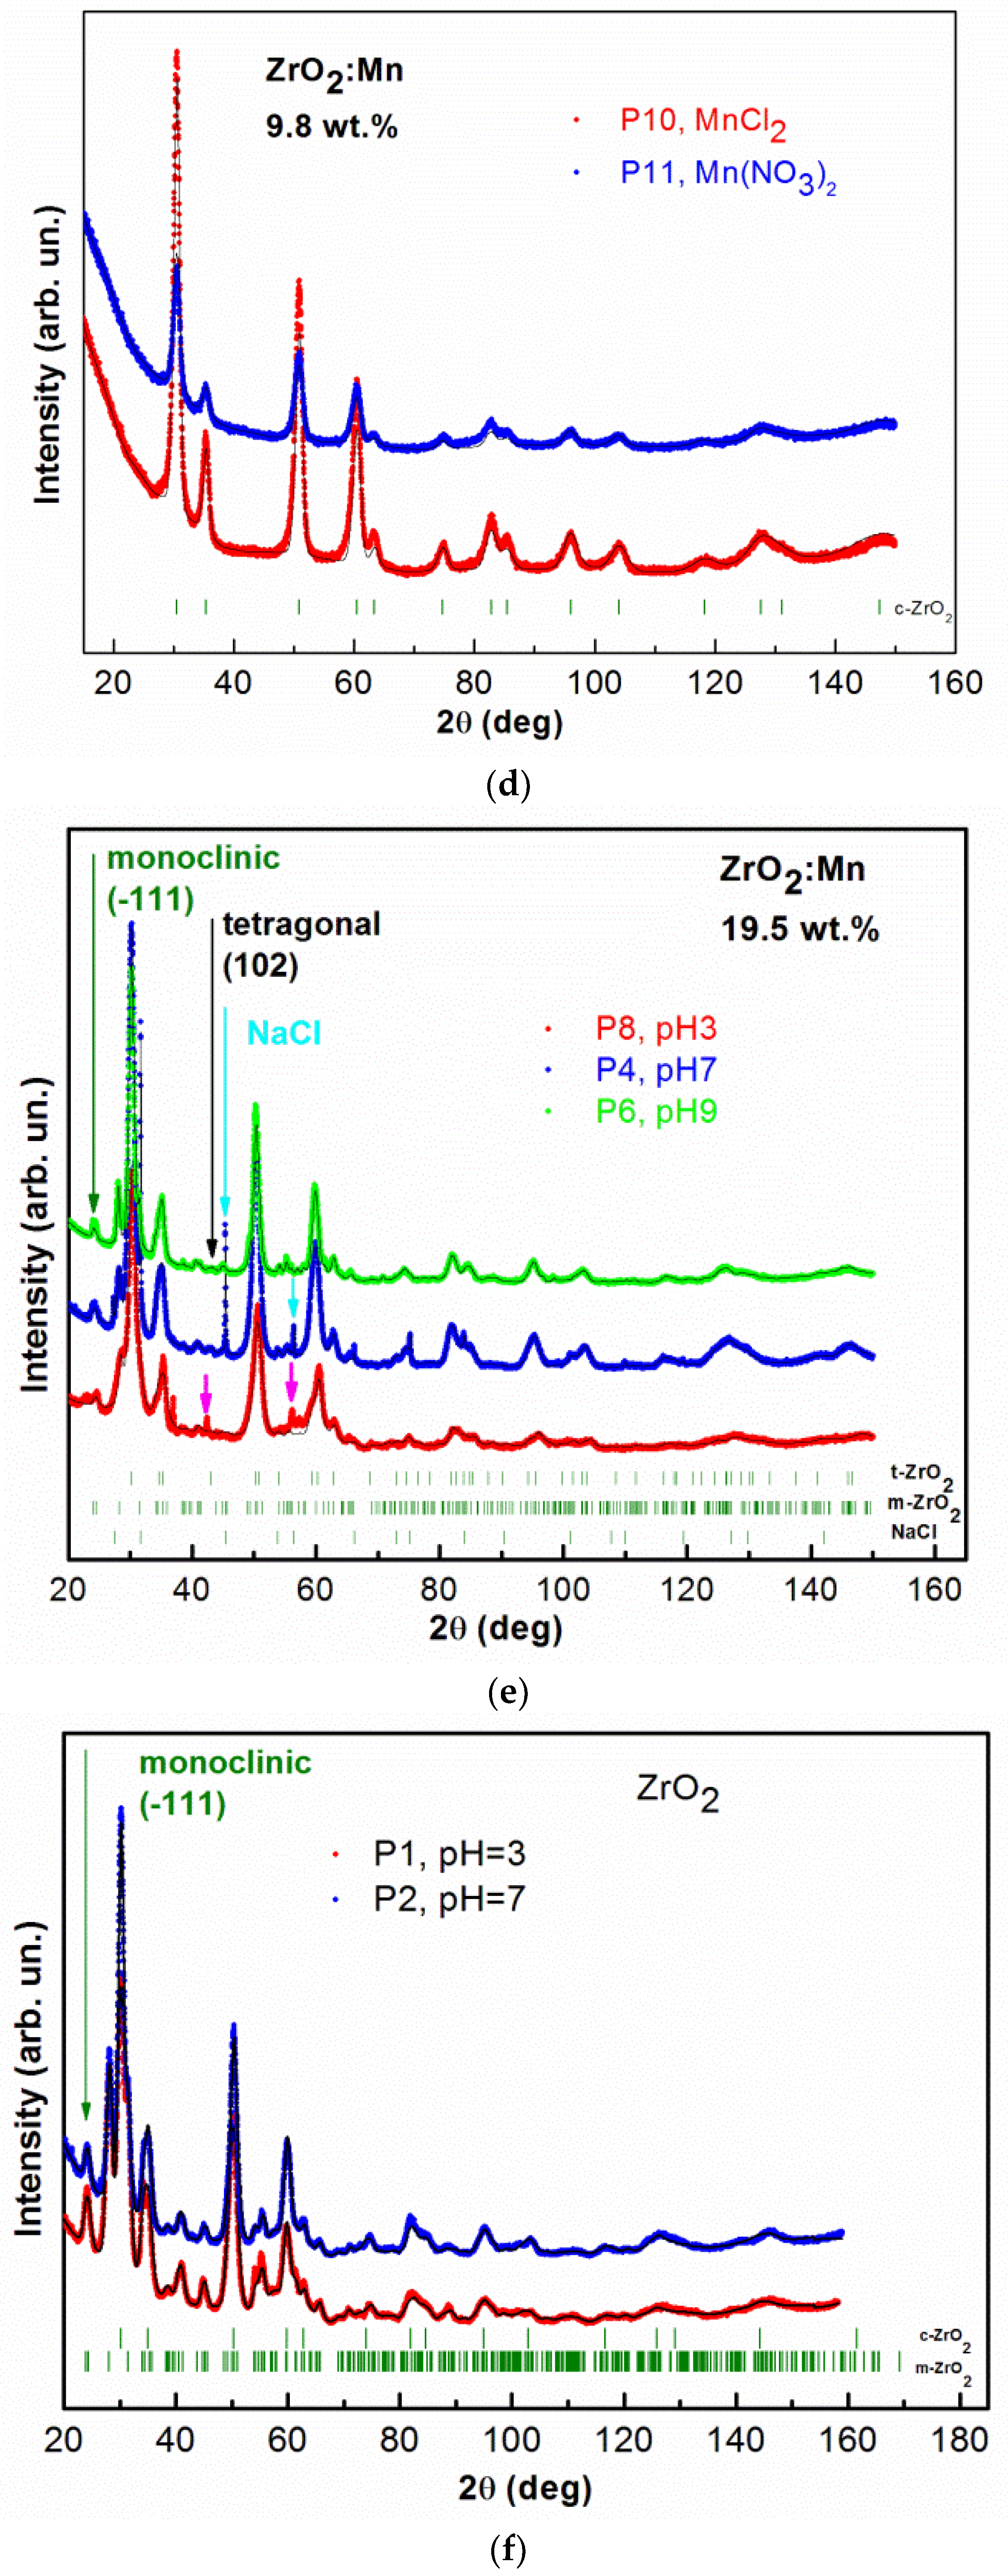
3.1. XRD and STEM Characterization

STEM images for four representative samples for low (P5, P12) and high Mn concentration (P11, P6), prepared with pH = 9, are presented in Figure 1a–d. In the sample P5 with 4.9 wt % of Mn synthesized with the use of KMnO4 precursor (Figure 1a), one can distinguish an agglomerated oval with a size between around 5 nm and 15 nm as well as cube nanograins with a size not exceeding 20 nm. For the P12 sample, prepared using Mn(NO3)2 precursor with 4.9 wt % of Mn, oval agglomerated nanocrystals are visible with a size between around 5 nm and 15 nm (Figure 1b). For the P11 ZrO2 sample with 9.8 wt % of Mn prepared with the use of Mn(NO3)2 precursor, smaller (a size at around 5–7 nm) and agglomerated nanocrystals are visible. For this sample, only oval nanograins are observed (Figure 1c). The degree of agglomeration is lower than that in the P12 sample. The results for a higher content of Mn are presented in Figure 1d. The highest degree of agglomeration is observed for the P6 sample with higher doping, e.g., 19.5 wt % of Mn (Figure 1d). The sample was prepared by the use of KMnO4 precursor. In this case, small oval nanograins (not exceeding 10 nm) and larger non-oval agglomerates (in size around 20 nm and above) are observed. In the samples prepared by use of Mn(NO3)2 precursor (P11 and P12), only oval nanograins are observed. For samples prepared with KMnO4 precursor, oval and non-oval nanograins are visible.
X-ray diffraction patterns for all of the studied samples are shown in Figure 2a–e. For samples doped with 4.9 wt % of Mn and 9.8 wt % of Mn, no additional reflections due to the secondary phases are observed. The figures show broad diffraction peaks due to the nanometric size of zirconia crystals. Since the diffraction peaks are broad, the separation of monoclinic (m), tetragonal (t), and cubic (c) phases in nanosized ZrO2 is a difficult task. The experimental strategy was based on the detection of a single, well-isolated peak belonging to one phase only. In Figure 2a, the results of measurements performed for samples with 4.9 wt % of Mn prepared with the use of KMnO4 precursor for different pH values (P7 with pH = 3, P3 with pH = 7, P5 with pH = 9) are shown. Two ZrO2 crystal phases, tetragonal and monoclinic, are detected. The well-isolated peak belonging to the monoclinic phase m(−111) and the peak belonging to the tetragonal phase t(102) are clearly visible. Figure 2b shows, as an example, the refinement results of the XRD pattern obtained for the sample P3. XRD data allowed us to determine a mean crystalline size, d, in the prepared samples by the use of Scherrer’s formula [30]. The results of XRD analysis are gathered in Table 1. The tetragonal ZrO2 crystal phase is dominant. The size of nanocrystals, determined from XRD, is smaller for the tetragonal crystal phase. For this crystal phase, nanocrystals with sizes of ~7 nm are observed. For monoclinic phase, larger values were determined, between ~10 nm and 17 nm.
For two samples doped with 4.9 wt % of Mn and prepared with MnCl2 and Mn(NO3)2 precursors, cubic and monoclinic ZrO2 crystal phases are observed. The results of XRD studies are shown in Figure 2c. For these two precursors, tetragonal ZrO2 was not detected. The isolated peak belonging to the monoclinic phase m(−111) is clearly visible. The results of the analysis are gathered in Table 1. For MnCl2 and Mn(NO3)2 precursors, the amount of monoclinic ZrO2 phase is much lower (only up to 6%) in comparison with the synthesis conducted with the KMnO4 precursor. The cubic ZrO2 crystal phase is dominant for the MnCl2 and Mn(NO3)2 precursors. The size of nanocrystals for cubic crystal phase is equal to ~7 nm. The obtained data did not allow us to determine the size of crystallites for monoclinic phase.
Figure 2d shows XRD patterns and Rietveld refinement for samples doped with 9.8 wt % of Mn (MnCl2 and Mn(NO3)2). In this case, we observed only cubic ZrO2 crystal phase. The mean size of nanocrystals is at around 6 nm. STEM studies also revealed that smaller nanocrystallites for the P11 sample (9.8 wt % of Mn) are observed than for the P12 sample (4.9 wt % of Mn).
In the case of the KMnO4 precursors, the samples were also doped with a higher Mn content: 19.5 wt % of Mn. The samples were prepared for three different pH values (pH = 3, 7, 9) as in the case of 4.9 wt % of Mn. Figure 2e shows the results of XRD measurements and Rietveld refinement for the P8 (pH = 3), P4 (pH = 7), and P6 (pH = 9) samples. Tetragonal ZrO2 crystal phase and monoclinic ZrO2 crystal phase are present. For sample P4 (pH = 7), an additional, undesirable NaCl structure was detectable. The formation of the small amount of this nonmagnetic phase can be a result of the conducted synthesis procedure with the used precursors. An additional undesired phase was also observed for sample P8 (pH = 3). However, the obtained XRD data did not allow us to identify it. Nevertheless, we excluded here the formation of manganese oxide phases. The analysis of the obtained data shows that in the case of the KMnO4 precursor, the increase of Mn doping did not allow us to reduce the monoclinic ZrO2 crystal phase. For the tetragonal crystal phase, nanocrystallites in the size of ~7–8 nm are observed; for the monoclinic crystal phase, the size of nanocrystallites is between 11 and 17 nm.
Figure 2f shows XRD patterns and Rietvield refinement for undoped ZrO2 samples prepared with two different pH values, pH = 3 and pH = 7. In this case, monoclinic and cubic crystal phases were determined.
It was already reported that Mn doping leads to the stabilization of tetragonal and cubic phases of ZrO2. We demonstrated that the formation of high-temperature crystal phases strongly depends on the synthesis conditions, e.g., the type of the precursor. Our results showed that using KMnO4 precursor leads to the formation of tetragonal crystal phase. It should be noticed that the assignment of cubic and tetragonal zirconia structures, based only on the X-ray diffraction analysis, can be misleading because these two structures are very similar. The analysis of the experimental patterns is also complicated in this case due to the intrinsic broadening of ZrO2 peaks. Nevertheless, our experimental results suggest that using KMnO4 precursor does not lead to the formation of cubic phase of ZrO2. We observed that, for KMnO4 precursor, the increase of the nominal concentration of Mn (from 4.9 wt % of Mn to 19.5 wt % of Mn) does not lead to a decrease in the amount of monoclinic phase and an increase of tetragonal phase. However, we noticed that the increase of pH values decreases the amount of the monoclinic phase and increases the amount of the tetragonal phase. For example, in the case of a nominal concentration of Mn equal to 4.9 wt %, the increase of pH from 3 to 9 leads to an increase in the amount of the tetragonal form from 77.2% to 87.4%. Using MnCl2 and Mn(NO3)2 allows us to obtain the cubic phase of ZrO2. For a nominal concentration of Mn equal to 9.8 wt %, we obtained pure cubic ZrO2 phase. For a sample with a lower nominal concentration of Mn, equal to 4.9 wt %, and pH = 9, we obtained 12.6% of monoclinic phase for the KMnO4 precursor, 4.6% for the MnCl2 precursor, and 5.8% for the Mn(NO3)2 precursor. In the case of the MnCl2 and Mn(NO3)2 precursors, we observed a much lower amount of monoclinic phase in comparison to the synthesis with the KMnO4 precursor.

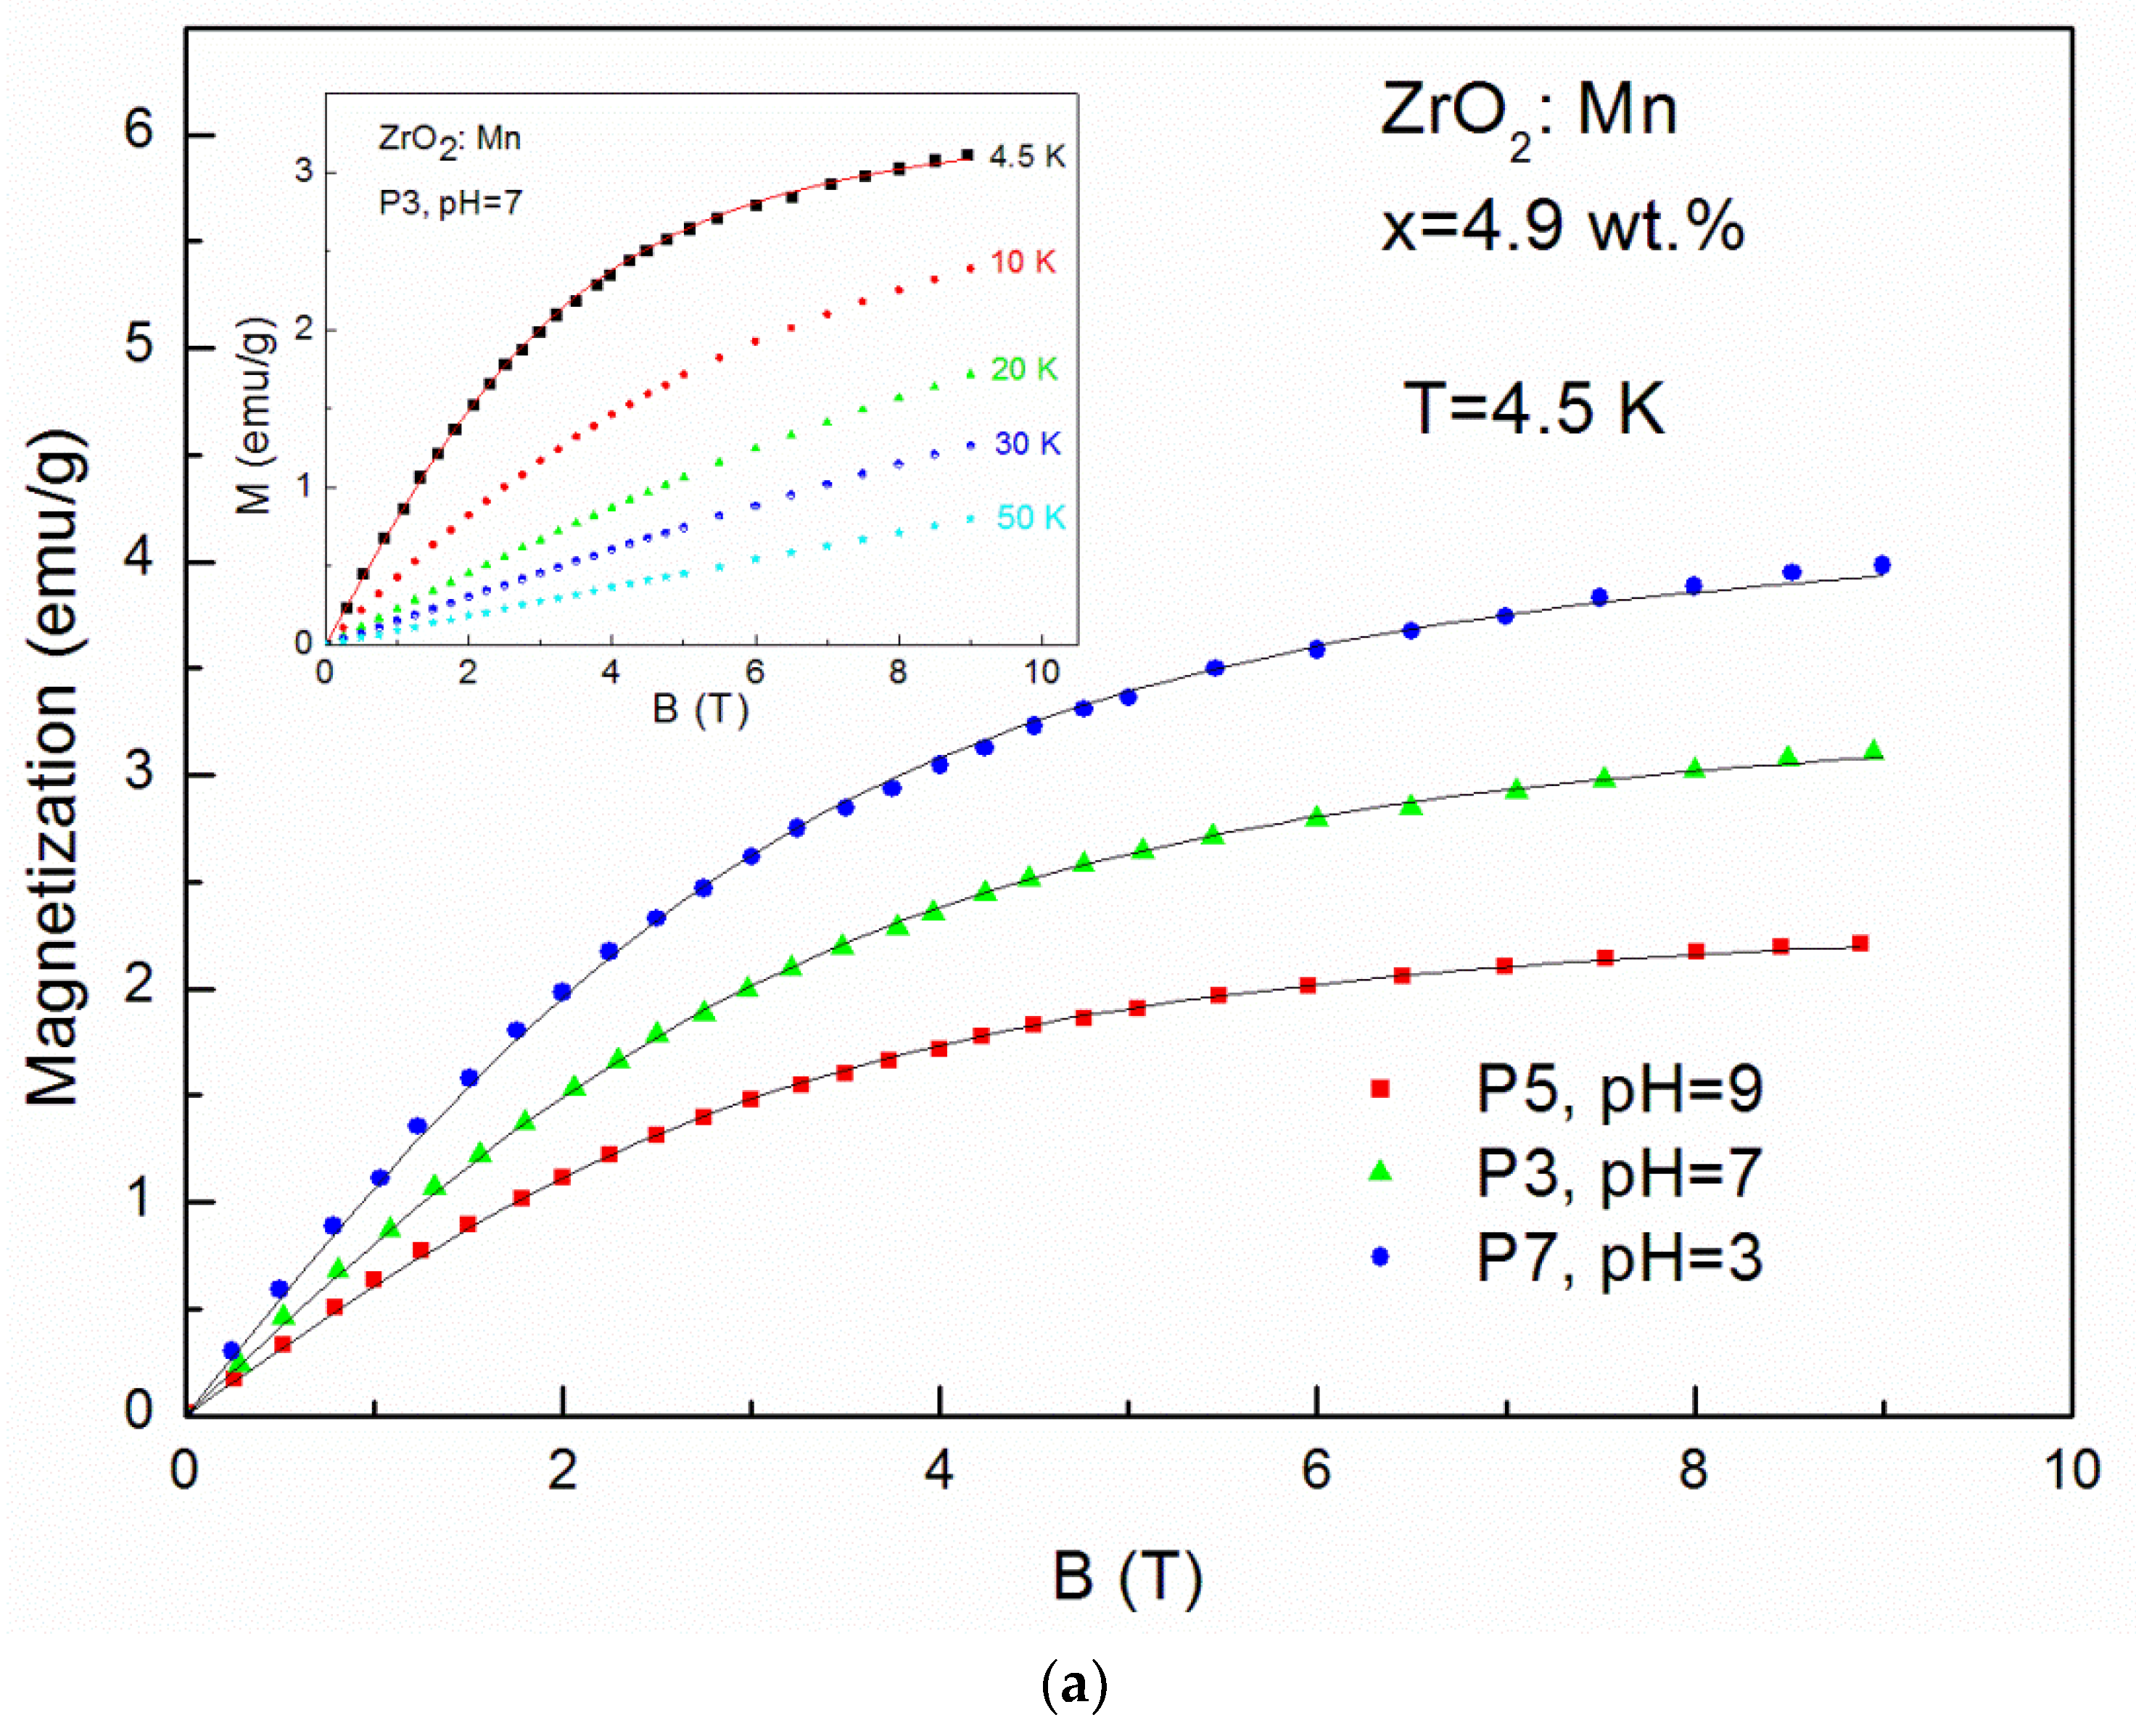
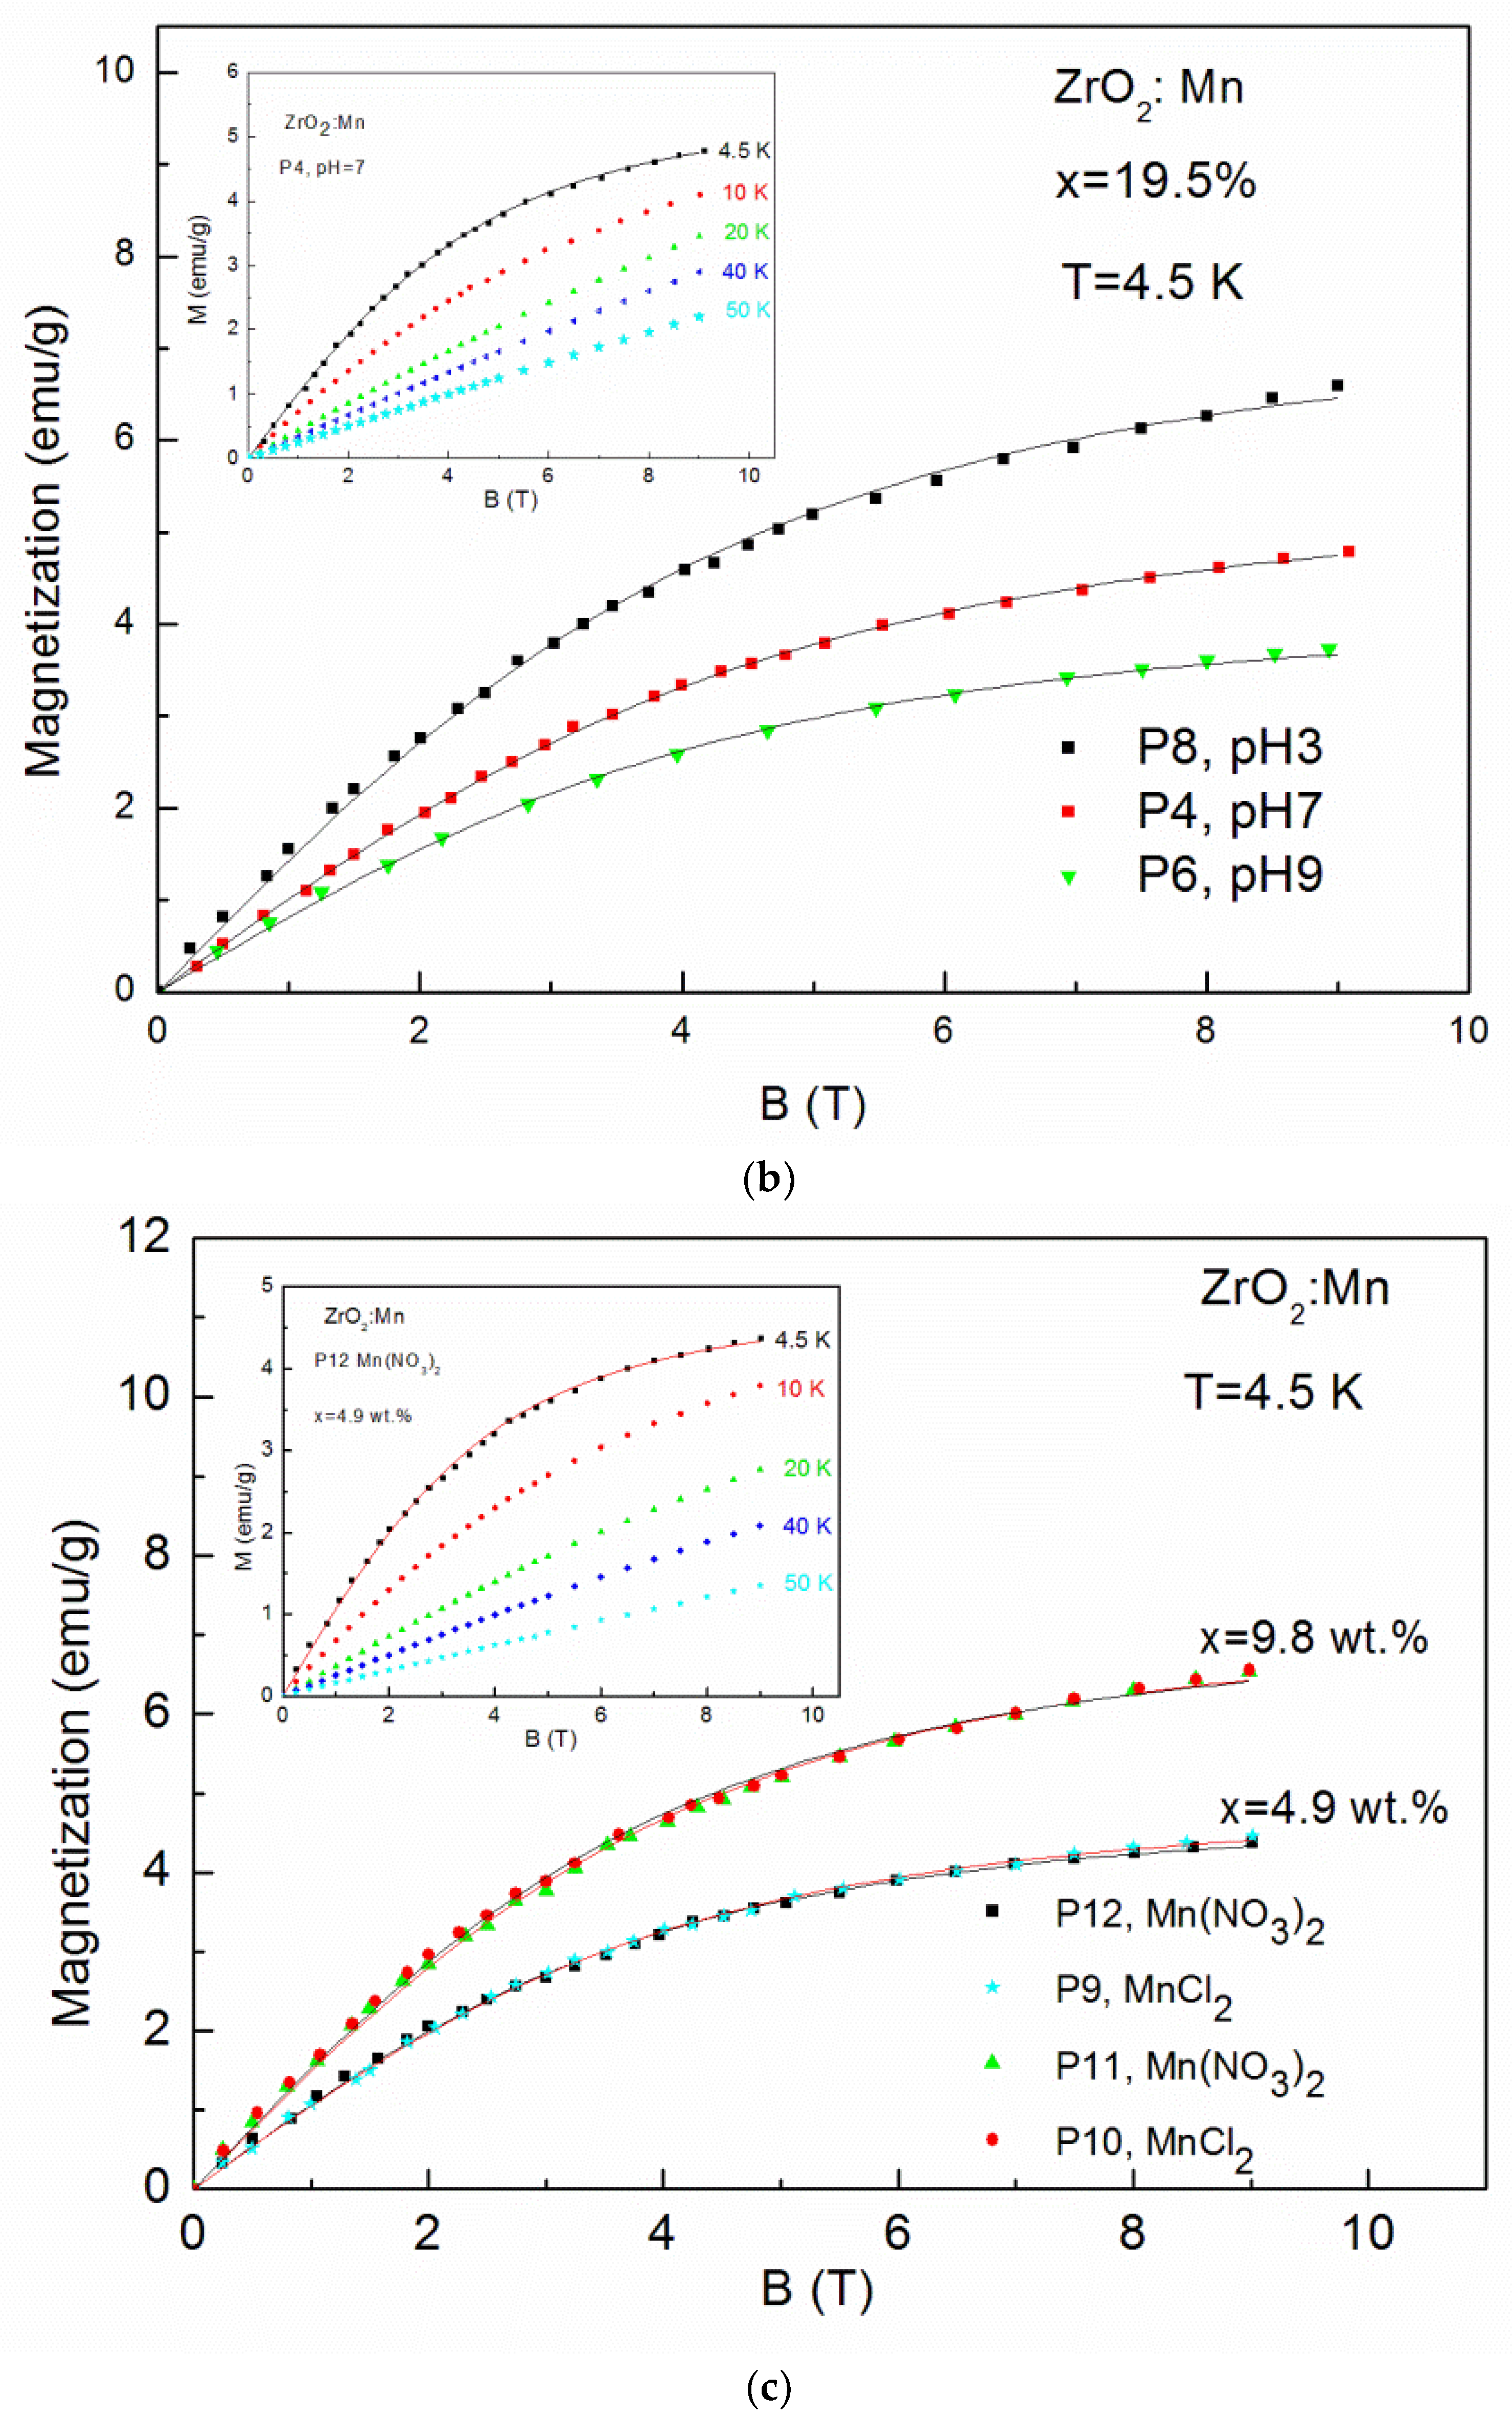
3.2. Magnetic Studies

Figure 3a–d show the results of the AC magnetic susceptibility measurements. The inverse magnetic susceptibility and the susceptibility for selected samples are plotted as functions of temperature. The imaginary part of the AC magnetic susceptibility is close to zero and the temperature is independent for all of the measured samples.
For all of the investigated samples, the high-temperature behavior of the inverse low-field susceptibility χ−1 was nearly linear. All of the ZrO2:Mn samples exhibited Curie–Weiss law behavior at high temperatures. We did not observe the presence of features that could be related to the secondary magnetic phases. In particular, for sample P8, where unidentified additional phase was detected by XRD measurements, only Curie–Weiss behavior is observed. The diamagnetic host lattice temperature dependence was measured for pure nanocrystalline ZrO2 (P1 and P2 samples: χdia = −0.6 × 10⁻⁶ emu/g) and was subtracted from the measured magnetic susceptibility. The experimental methods for the magnetic materials are described (e.g., in [31,32]).
At higher temperatures, the AC mass susceptibility can be described by the formula [32]:
χ = C(x)/(Tθ(x)),
where C(x) = C0x and θ(x) is the Curie–Weiss temperature. C0 is defined as: C0 = N(geff μB)2S(S + 1)/3kBρ. Here, N is the number of cations per unit volume, geff is the effective gyromagnetic factor of Mn ion, S is the spin, ρ is the mass density calculated from the lattice parameters, and µB denotes the Bohr magneton. Here, we assume that S = 5/2 and geff = 2.
The results of the fitting procedure are given in Table 2. For all of the samples, the negative values of the Curie–Weiss temperature θ were determined, which indicates that antiferromagnetic (AF) interactions are predominant in the measured samples. The negative values of the Curie–Weiss temperature have already been reported for ZrO2:Mn [14,23,24,25]. In our paper, we focus on the influence of the synthesis procedure on the resultant magnetic properties, e.g., the Curie–Weiss temperature. The inspection of Table 2 shows that the obtained values of the Curie–Weiss temperature strongly depend on the conditions of the preparation procedure. Lower values of θ were obtained for samples prepared by the use of MnCl2 and Mn(NO3)2 precursors. Three samples doped with 4.9 wt % of Mn (P5, P9, P12) were prepared with the same pH value (pH = 9) and by the use of three different precursors. We determined that θ = −2.5 K for the KMnO4 precursor, θ = −1.8 K for the MnCl2 precursor, and θ = −1 K for the Mn(NO3)2 precursor. The same tendency was observed for samples doped with a higher Mn content. For two samples doped with 9.8 wt % of Mn and prepared with pH = 9, we determined that θ = −5.7 K for the MnCl2 precursor and θ = −4.7 K for the Mn(NO3)2 precursor. For the KMnO4 precursor, we studied the influence of the pH of the reaction mixture used for the synthesis. Figure 4 shows the dependence of the Curie–Weiss temperature θ on the pH value. We observed a distinct increase in the absolute values of the Curie–Weiss temperature θ with the increase of pH values. It suggests that the antiferromagnetic interactions are strengthened with an increase of the pH value. The Curie–Weiss temperature can be tuned by the appropriate selection of the synthesis conditions. For example, in the case of the KMnO4 precursor and pH = 9, for 19.5 wt % of Mn, the absolute values of θ can be much decreased: from −17.4 K to −6.1 K by the decrease of the pH value from pH = 9 to pH = 3.
We calculated the concentration of Mn ions from the determined C parameter using Equation (1). The obtained values are lower than those of the nominal content. The observed discrepancy can be related to the efficiency of the used synthesis process. The calculated values of x depend on the used pH values. The higher concentration values are obtained for lower values of pH. The Curie–Weiss temperature θ(x) depends on the content of Mn ions. Using the theory of Spałek et al. [32], one can express θ(x) as: θ(x) = θ0x. The analysis of the results gathered in Table 2 shows that the observed large changes of θ values with pH values (for the same nominal content of Mn) are not related to the changes of the content of Mn ions. The results suggest that an increase in pH values enhances the strength of antiferromagnetic interactions.
Magnetization (M) up to 50 K as a function of magnetic field (B) up to 9 T is shown in Figure 5a–c. The magnetic measurements revealed no hysteresis and no saturation. No evidence of ferromagnetism was observed.
The data do not fit well to the standard Brillouin function (not shown) possibly because of the presence of antiferromagnetic (AF) interactions between magnetic ions. Taking into account the weak saturation effect due to the AF interactions between Mn ions, a reasonable fit was obtained by using the phenomenological equation [33]:
M(B,T) = S g µB N xeff BS(B,Teff),
where BS is the Brillouin function for a spin S = 5/2, Teff = T + T0 and xeff are the fitting parameters, N is the number of cations per unit mass, g = 2 is the Landé factor, and µB is the Bohr magneton.
The so-called effective Brillouin function, Bs(B,Teff), has been widely and successfully used to describe the magnetization of diluted magnetic semiconductors. It is worth noting that the value of the xeff parameter represents an effective molar fraction of active Mn and is usually smaller than the real concentration of magnetic ions due to antiferromagnetic interactions between magnetic ions [33]. The value of T0 < T is a signature of an AF coupling between Mn ions [33]. The solid curves (Figure 5a–c) are the fitting results of experimental data at 4.5 K. The fitting values are shown in Table 2. It is clearly visible that fitting values of xeff decrease with the increase of pH values. For example, in the case of samples doped with 4.9 wt % by the use of KMnO4 precursor, we obtained: xeff = 0.018 (0.81 wt %) for pH = 3 (the P7 sample), xeff = 0.015 (0.67 wt %) for pH = 7 (the P3 sample), and xeff = 0.010 (0.45 wt %) for pH = 9 (the P5 sample). The same tendency is visible for samples doped with a higher Mn concentration (19.5 wt %). We obtained: xeff = 0.032 (1.44 wt %) for pH = 3 (the P8 sample), xeff = 0.024 (1.08 wt %) for pH = 7 (the P4 sample), and xeff = 0.018 (0.81 wt %) for pH = 9 (the P6 sample). It means that an increase in pH values leads to a decrease in the Mn content in the ZrO2 structure. A large discrepancy between the nominal content and the xeff parameter was also observed by J. Yu et al. [23]. The authors [23], similarly to our results, observed that the ratio of the xeff parameter to the nominal content decreased with the increase of x and suggested the enhancement of antiferromagnetic interactions between the doped magnetic ions. For our samples, a similar effect was also observed. The obtained values of xeff are lower than the values of x calculated from the AC susceptibility fitting parameter C(x). However, we recall that lower values of xeff reflect the antiferromagnetic interactions between Mn ions.

4. Conclusions

We have studied the structural and magnetic properties of nanocrystalline ZrO2 doped with Mn in hydrothermal synthesis. We have shown that the formation of high-temperature crystal phases strongly depends on the synthesis conditions, e.g., the type of the precursor. We examined three types of precursors: KMnO4, MnCl2, and Mn(NO3)2. Using these two last precursors (MnCl2 and Mn(NO3)2) leads to the formation of pure cubic ZrO2 phase (for nominal 9.8 wt % of Mn). Our experimental results suggest that using KMnO4 precursor does not lead to the formation of cubic phase of ZrO2. In that case, we noticed that an increase of pH values decreases the amount of monoclinic phase and increases the amount of tetragonal phase. We showed that changing the pH value allows for adjusting the magnetic parameters. In particular, it is possible to obtain a material with a desired Curie–Weiss temperature. Thus, the strength of antiferromagnetic interactions can be suppressed by adjusting the chemical synthesis conditions.

Author Contributions

Conceptualization, I.K.-K. and W.D.; Magnetic investigations, I.K.-K. and M.A.; Data analysis, I.K.-K. and R.M.; Synthesis and STEM measurements, A.M. and L.S.; XRD investigations, R.M.; Manuscript writing, I.K.-K.

Conflicts of Interest

The authors declare no conflict of interest.

References

  1. Yadav, G.D.; Nair, J.J. Sulfated zirconia and its modified versions as promising catalysts for industrial processes. Microporous Mesoporous Mater. 1999, 33, 1–48. [Google Scholar] [CrossRef]
  2. Lee, D.S.; Kim, W.S.; Choi, S.H.; Kim, J.; Lee, H.W.; Lee, J.H. Characterization of ZrO2 codoped with Sc2O3 and CeO2 electrolyte for the application of intermediate temperature SOFCs. Solid State Ion. 2005, 176, 33–39. [Google Scholar] [CrossRef]
  3. Badwal, S.P.S. Stability of Solid Oxide Fuel Cell Components. Solid State Ion. 2001, 143, 39–46. [Google Scholar] [CrossRef]
  4. Minh, N.Q. Ceramic Fuel Cells. J. Am. Ceram. Soc. 1993, 76, 563–588. [Google Scholar] [CrossRef]
  5. French, R.H.; Glass, S.J.; Ohuchi, F.S.; Xu, Y.N.; Ching, W.Y. Experimental and theoretical determination of the electronic structure and optical properties of three phases of ZrO2. Phys. Rev. B 1994, 49, 5133–5142. [Google Scholar] [CrossRef]
  6. Yashima, M.; Hirose, T.; Katano, S.; Suzuki, Y.; Kakihana, M.; Yoshimura, M. Structural changes of ZrO2-CeO2 solid solutions around the monoclinic-tetragonal phase boundary. Phys. Rev. B 1995, 51, 8018–8025. [Google Scholar] [CrossRef]
  7. Albanese, E.; Leccese, M.; Di Valentin, C.; Pacchioni, G. Magnetic properties of nitrogen doped ZrO2: Theoretical evidence of absence of room temperature ferromagnetism. Sci. Rep. 2016, 6, 31435–31445. [Google Scholar] [CrossRef] [PubMed]
  8. Bacquet, G.; Dugas, J.; Escribe, C.; Rouanet, A. The system ZrO2 CaO studied by the electron spin resonance of Mn2+ ions. J. Solid State Chem. 1976, 19, 251–261. [Google Scholar] [CrossRef]
  9. Appel, C.C.; Bonanos, N.; Horsewell, A.; Linderoth, S. Ageing behaviour of zirconia stabilised by yttria and manganese oxide. J. Mater. Sci. 2001, 36, 4493–4501. [Google Scholar] [CrossRef]
  10. Hannink, R.H.J. Microstructural development of sub-eutectoid aged MgO-ZrO2 alloys. J. Mater. Sci. 1983, 18, 457–470. [Google Scholar] [CrossRef]
  11. Zippel, J.; Lorenz, M.; Lenzner, J.; Grundmann, M.; Hammer, T.; Jacquot, A.; Böttner, H. Electrical transport and optical emission of MnxZr1xO2 (0 ≤ x ≤ 0.5) MnxZr1xO2 (0 ≤ x ≤ 0.5) thin films. J. Appl. Phys. 2001, 110, 043706. [Google Scholar] [CrossRef]
  12. Dimri, M.C.; Kooskora, H.; Pahapill, J.; Joon, E.; Heinmaa, I.; Subbi, J.; Stern, R. Search for ferromagnetism in manganese-stabilized zirconia. Phys. Status Solidi A 2011, 208, 172–179. [Google Scholar] [CrossRef]
  13. Saravanakumra, S.; Kamalaveni, J.; Rani, M.P.; Saravanan, R. Solubility of Mn stabilized cubic zirconia nanostructures. J. Mater. Sci. Mater. Electron. 2014, 25, 837–843. [Google Scholar] [CrossRef]
  14. Pucci, A.; Clavel, G.; Willinger, M.-G.; Zitoun, D.; Pinna, N. Transition metal-doped ZrO2 and HfO2 nanocrystals. J. Phys. Chem. C 2009, 113, 12048–12052. [Google Scholar] [CrossRef]
  15. Pearton, S.J.; Heo, W.H.; Ivill, M.; Norton, D.P.; Steiner, T. Dilute magnetic semiconducting oxides. Semicond. Sci. Technol. 2004, 19, R59–R74. [Google Scholar] [CrossRef]
  16. Kuryliszyn-Kudelska, I.; Hadžić, B.; Sibera, D.; Romčević, M.; Romčević, N.; Narkiewicz, U.; Dobrowolski, W. Dynamic magnetic properties of ZnO nanocrystals incorporating Fe. J. Alloys Compd. 2011, 509, 3756–3759. [Google Scholar] [CrossRef]
  17. Kuryliszyn-Kudelska, I.; Dobrowolski, W.; Arciszewska, M.; Romčević, N.; Romčević, M.; Hadžić, B.; Sibera, D.; Narkiewicz, U.; Łojkowski, W. Transition metals in ZnO nanocrystals—Magnetic and structural properties. Sci. Sinter. 2013, 45, 31–48. [Google Scholar] [CrossRef]
  18. Hong, N.H.; Kanoun, M.B.; Goumri-Said, S.; Song, J.-H.; Chikoidze, E.; Dumont, Y.; Ruyter, A.; Kurisu, M. The origin of magnetism in transition metal-doped ZrO2 thin films: Experiment and theory. J. Phys. Condens. Matter 2013, 25, 436003–436010. [Google Scholar] [CrossRef] [PubMed]
  19. Sundaresan, A.; Bhagavi, R.; Rangarajan, N.; Siddesh, U.; Rao, C.N.R. Ferromagnetism as a universal feature of nanoparticles of the otherwise nonmagnetic oxides. Phys. Rev. B 2006, 74, 161306(R). [Google Scholar] [CrossRef]
  20. Venkatesan, M.; Fitzgerald, C.B.; Coey, J.M.D. Thin films: Unexpected magnetism in a dielectric oxide. Nature 2004, 430, 630. [Google Scholar] [CrossRef] [PubMed]
  21. Ostanin, S.; Ernst, A.; Sandratskii, L.M.; Bruno, P.; Dane, M.; Dughes, I.D.; Staunton, J.B.; Hergert, W.; Mertig, I.; Kudrnovsky, J. Mn-stabilized zirconia: From imitation diamonds to a new potential high-TC ferromagnetic spintronics material. Phys. Rev. Lett. 2007, 98, 016101. [Google Scholar] [CrossRef] [PubMed]
  22. Boujnah, M.; Zaari, H.; Benyoussef, A.; El Kenz, A.; Mounkachi, O. Understanding ferromagnetism and optical absorption in 3D transition metal-doped cubic ZrO2 with the modified Becke-Johnson exchange-correlation functional. J. Appl. Phys. 2014, 115, 123909–123916. [Google Scholar] [CrossRef]
  23. Yu, J.; Duan, L.B.; Yang, Y.C.; Rao, G.H. Absence of ferromagnetism in Mn- and Fe-stabilized zirconia nanoparticles. Physica B 2008, 403, 4264–4268. [Google Scholar] [CrossRef]
  24. Clavel, G.; Willinger, M.G.; Zioun, D.; Pinna, N. Manganese-doped zirconia nanocrystals. Eur. J. Inorg. Chem. 2008, 6, 863–868. [Google Scholar] [CrossRef]
  25. Srivastava, S.K.; Lejay, P.; Barbara, B.; Boisron, O.; Pailhes, S.; Bouzerar, G. Absence of ferromagnetism in Mn-doped tetragonal zirconia. J. Appl. Phys. 2011, 110, 043929. [Google Scholar] [CrossRef] [Green Version]
  26. Zippel, J.; Lorenz, M.; Setzer, A.; Wagner, G.; Sobolev, N.; Esquinazi, P.; Grundmann, M. Defect-induced ferromagnetism in undoped and Mn-doped zirconia thin films. Phys. Rev. B 2010, 82, 125209–125214. [Google Scholar] [CrossRef]
  27. Hong, N.H.; Park, C.K.; Raghavender, A.T.; Ciftja, O.; Bingham, N.S.; Phan, M.H.; Srikanth, H. Room ferromagnetism in monoclinic Mn-doped ZrO2 thin films. J. Appl. Phys. 2012, 111, 07C302. [Google Scholar] [CrossRef]
  28. Kumar, S.; Ojha, A.K. Room temperature ferromagnetism in undoped and Mn doped t-ZrO2 nanostructures originated due to oxygen vacancy and effect of Mn doping on its optical properties. Mater. Chem. Phys. 2016, 169, 13–20. [Google Scholar] [CrossRef]
  29. Kuryliszyn-Kudelska, I.; Arciszewska, M.; Małolepszy, A.; Mazurkiewicz, M.; Stobiński, L.; Grabias, A.; Kopcewicz, M.; Paszkowicz, W.; Minikaev, R.; Domukhovski, V.; et al. Influence of Fe doping on magnetic properties of ZrO2 nanocrystals. J. Alloys Compd. 2015, 632, 609–615. [Google Scholar] [CrossRef]
  30. Patterson, A.L. The Scherrer Formula for X-ray Particle Size Determination. Phys. Rev. 1939, 56, 978–982. [Google Scholar] [CrossRef]
  31. Buschow, K.H.J.; de Boer, F.R. Physics of Magnetism and Magnetic Materials; Plenum Publishers: New York, NY, USA, 2003; ISBN 978-0-306-48408-7. [Google Scholar]
  32. Spałek, J.; Lewicki, A.; Tarnawski, Z.; Furdyna, J.K.; Gałązka, R.R.; Obuszko, Z. Magnetic susceptibility of semiconductors: High-temperature regime and the role of superexchang. Phys. Rev. B 1986, 33, 3407–3418. [Google Scholar] [CrossRef]
  33. Gaj, J.A.; Planel, R.; Fishman, G. Relation of magneto-optical properties of free excitonic to spin alignment of Mn2+ ions in Cd1−xMnxTe. Solid State Commun. 1979, 29, 435–438. [Google Scholar] [CrossRef]
Figure 1. STEM images for samples of nanosized ZrO2 doped with Mn: (a) the P5 sample doped with 4.9 wt % of Mn prepared with KMnO4 precursor; (b) the P12 sample doped with 4.9 wt % of Mn prepared with Mn(NO3)2 precursor; (c) the P11 sample doped with 9.8 wt % of Mn prepared with the use of Mn(NO3)2 precursor; (d) the P6 sample doped with 19.5 wt % of Mn prepared with the use of KMnO4 precursor.
Magnetochemistry 04 00028 g001
Figure 2. The observed XRD patterns (red, blue, and green lines) and Rietveld refinement (black line) of: (a) ZrO2 doped with 4.9 wt % of Mn prepared by the use of KMnO4 precursor with different pH values, pH = 3, 7, 9; (b) ZrO2 doped with 4.9 wt % of Mn prepared by the use of KMnO4 precursor with pH = 7; the lowest curve (pink) is the difference between the observed and calculated XRD patterns; (c) ZrO2 doped with 4.9 wt % of Mn prepared with MnCl2 and Mn(NO3)2 precursors; (d) ZrO2 doped with 9.8 wt % of Mn prepared with MnCl2 and Mn(NO3)2 precursors; (e) ZrO2 doped with 19.5 wt % of Mn prepared by the use of KMnO4 precursor with different pH values, pH = 3, 7, 9; (f) ZrO2 prepared with different pH values, pH = 3, 7. The vertical bars indicate the expected Bragg reflection positions. The isolated peaks attributed to the monoclinic ZrO2 are marked with the green arrows. The isolated peaks attributed to the tetragonal ZrO2 are marked with black arrows. The blue arrows indicate an additional NaCl crystal structure (P4 sample). The pink arrows indicate the observed additional unidentified phase for the P8 sample.
Magnetochemistry 04 00028 g002aMagnetochemistry 04 00028 g002b
Figure 3. Alternating current (AC) magnetic susceptibility data; The real part (Re(χ)) and imaginary (Im(χ)) part of AC magnetic susceptibility as well as the calculated χ = (Re(χ)2+Im(χ)2)1/2 for: (a) the P3 sample; (b) the P4 sample, where the insets show fitting curves (red solid lines); The inverse magnetic susceptibility for nanocrystalline ZrO2:Mn samples synthesized with: (c) the KMnO4 precursor; (d) the MnCl2 and Mn(NO3)2 precursors.
Magnetochemistry 04 00028 g003aMagnetochemistry 04 00028 g003b
Figure 4. The Curie–Weiss temperature dependence on the pH value of the reaction mixture used in the synthesis.
Magnetochemistry 04 00028 g004
Figure 5. The magnetization data measured up to 9 T for: (a) ZrO2 doped with 4.9 wt % of Mn samples prepared by use of KMnO4 precursor with different pH values (pH = 3, pH = 7, pH = 9) at T = 4.5 K and sample P3 for selected temperatures (inset); (b) ZrO2 samples doped with 19.5 wt % of Mn prepared by use of KMnO4 precursor with different pH values (pH = 3, pH = 7, pH = 9) at T = 4.5 K and sample P4 for selected temperatures (inset); (c) samples doped with 4.9 wt % of Mn and 9.8 wt % of Mn prepared with MnCl2 and Mn(NO3)2 precursors at T = 4.5 K and sample P12 and doped with 4.9 wt % of Mn for selected temperatures (inset).
Magnetochemistry 04 00028 g005aMagnetochemistry 04 00028 g005b
Table 1. The details of the synthesis and the results of XRD studies (the obtained percentage of determined crystal phases and the mean size of nanocrystallites D) for the undoped samples and the samples prepared with KMnO4, MnCl2, and Mn(NO3)2. The “+” means that the determined crystalline phase was detected; however, the experimental data did not allow us to determine the percentage of obtained crystal phases and/or the mean size of nanocrystallites D.
Sample Name and PrecursorNominal Content of Mn pHZrO2
(Cubic)
ZrO2
(Tetragonal)
ZrO2
(Monoclinic)
NaClAdditional
Phase
%D
(nm)
%D
(nm)
%D
(nm)
%D
(nm)
%D
(nm)
P7
KMnO4
4.9 wt %
pH 3
--77.2722.810.8----
P3
KMnO4
4.9 wt %
pH 7
--88.97.111.110.1----
P5
KMnO4
4.9 wt %
pH 9
--87.47.512.617----
P8
KMnO4
19.5 wt %
pH 3
--++++--++
P4
KMnO4
19.5 wt %
pH 7
--73.57.315.110.811.4+--
P6
KMnO4
19.5 wt %
pH 9
--84.88.115.217----
P9
MnCl2
4.9 wt %
pH 9
95.47.1--4.6+----
P12
Mn(NO3)2
4.9 wt %
pH 9
94.26.7--5.8+----
P10
MnCl2
9.8 wt %
pH 9
1006.6--------
P11
Mn(NO3)2
9.8 wt %
pH 9
1005.8--------
P1
ZrOCl2
-
pH 3
505--507.3----
P2
ZrOCl2
-
pH 7
646.1--368.2----
Table 2. The values of parameters C and θ determined from fits to the Curie–Weiss law for ZrO2:Mn. The parameter x was determined from: C(x) = C0x, C0 = N(geff μB)2S(S + 1)/3kBρ. The values of the parameters xeff and Teff were determined from fits to the effective Brillouin function law for ZrO2:Mn.
Sampleθ (K)C (emuK/g)xxeffTeff (K)
P7 4.9 wt %
pH 3; KMnO4
−0.10.000800.022 (0.99 wt %)0.018 (0.81 wt %)1.48
P3 4.9 wt %
pH 7; KMnO4
−1.50.000660.018 (0.80 wt %)0.015 (0.67 wt %)1.77
P5 4.9 wt %
pH 9; KMnO4
−2.50.004700.013 (0.58 wt %)0.010 (0.45 wt %)1.36
P8 19.5 wt %
pH 3; KMnO4
−6.10.001670.046 (2.08 wt %)0.032 (1.44 wt %)3.13
P4 19.5 wt %
pH 7; KMnO4
−9.80.001640.045 (2.01 wt %)0.024 (1.08 wt %)3.71
P6 19.5 wt %
pH 9; KMnO4
−17.40.001580.044 (2.00 wt %)0.018 (0.81 wt %)3.21
P9 4.9 wt %
pH 9; MnCl2
−1.80.000860.024 (1.08 wt %)0.021 (0.94 wt %)2.56
P12 4.9 wt %
pH 9; Mn(NO3)2
−10.000790.022 (0.99 wt %)0.021 (0.94 wt %)2.29
P10 9.8 wt %
pH 9; MnCl2
−5.70.001780.049 (2.20 wt %)0.031 (1.40 wt %)2.58
P11 9.8 wt %
pH 9; Mn(NO3)2
−4.70.001670.046 (2.08 wt %)0.031 (1.40 wt %)2.87

