1. Introduction
In recent years, fast battery charging has become a thriving area of research, as a result of the increasing demands in portable electronics [
1], electric vehicles [
2] and electrical energy storage systems [
3]. Despite its convenience, fast battery charging can drastically reduce cell longevity if improperly addressed. This is primarily caused by the elevated cell temperatures and high currents used during fast charging, which are identified as the two main factors that accelerate battery degradation [
4] and reduce battery state-of-safety [
5].
Even so, fast battery charging capabilities can be enhanced by modifying cell active materials and cell design [
6], and improving the charging algorithm [
7,
8]. In addition, the effect of battery heat generation also plays a major role in fast charging [
9]. Hence, a detailed battery thermal analysis during fast charging could be used to design safer, quicker and more efficient charging protocols.
In this work, we propose a thermal model to decipher the heat generation contributions (both reversible and irreversible) during fast battery charging. The fast battery charging technique thermally studied here was previously reported in [
10], and was validated to attain quick recharges while causing no accelerated cell degradation [
11]. The proposed thermal model is similar to several thermal models found in the literatures [
12,
13,
14,
15], but it presents a low computational complexity, and utilizes the external cell surface temperature as the main variable to infer heat generation during operation. Despite using a similar approach as the one presented here, other models [
16] present more complex, higher-order differential equations which could be more difficult to implement in commercial battery management systems (BMS).
The findings from this work improve the understanding of the thermal behavior of this particular fast charging technique, while using a simple, effective thermal model.
The paper is organized as follows:
Section 2 presents the main features of the fast charging method as well as the measurements made to implement the thermal analysis;
Section 3 explains the thermal model and
Section 4 shows and discusses the obtained results, highlighting how the thermal capacity and the thermal resistance of the cell are obtained; finally,
Section 5 presents the conclusions.
2. Experimental
The experiments were conducted on a commercial graphite/LiFePO
4 (C/LFP) cylindrical cell, manufactured by A123 Systems (ANR26650M1, Livonia, MI, USA). These cells have a rated capacity of 2.3 Ah and a nominal cell voltage of 3.3 V when evaluated at nominal cell conditions, i.e., 1C rate. The cells have an average weight of 0.075 kg. The specific energy under nominal conditions is about 99.2 Wh∙kg
−1 [
17]. Cell characterization and cycle aging were conducted using a multi-channel Arbin BT-2000 battery tester (College Station, TX, USA). The cell-surface temperature was monitored using T-type thermocouples manufactured by Omega (Norwalk, CT, USA). The thermocouples were attached to the lateral cell surface using self-adhesive thermocouple pads. A climate chamber manufactured by Memmert (Schwabach, Germany) was used to maintain constant ambient temperature of 22 °C throughout testing.
The cells were started with the commissioning test, in which they were identified and weighted, and the open circuit voltage (
OCV) was measured. Next, a conditioning series was performed following the United States Advanced Battery Consortium (USABC) test procedure #2 [
18]: several cycles of standard 1C charges and C/3, C/2, 1C, C/3 discharges until to achieve stability of cell capacity. Thereafter, C/25 charge and discharge cycles were carried out to determine a practical maximum capacity with minimal kinetic effects [
19,
20]. Subsequently, the cells were subjected to cycling. The cycling scheme consisted in fast charging and fast discharging. Fast charging consisted of a multistage fast charging technique using three charging steps at 4C (9.2 A), 1C (2.3 A) under constant current, and a fixed 5 min length constant voltage (CV) stage at 3.6 V. Discharges were carried out at 4C (−9.2 A) to 2.0 V cut off voltage. After a resting time of 2 min the process starts again.
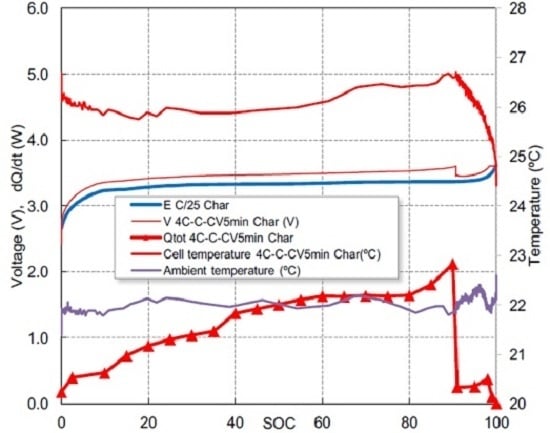
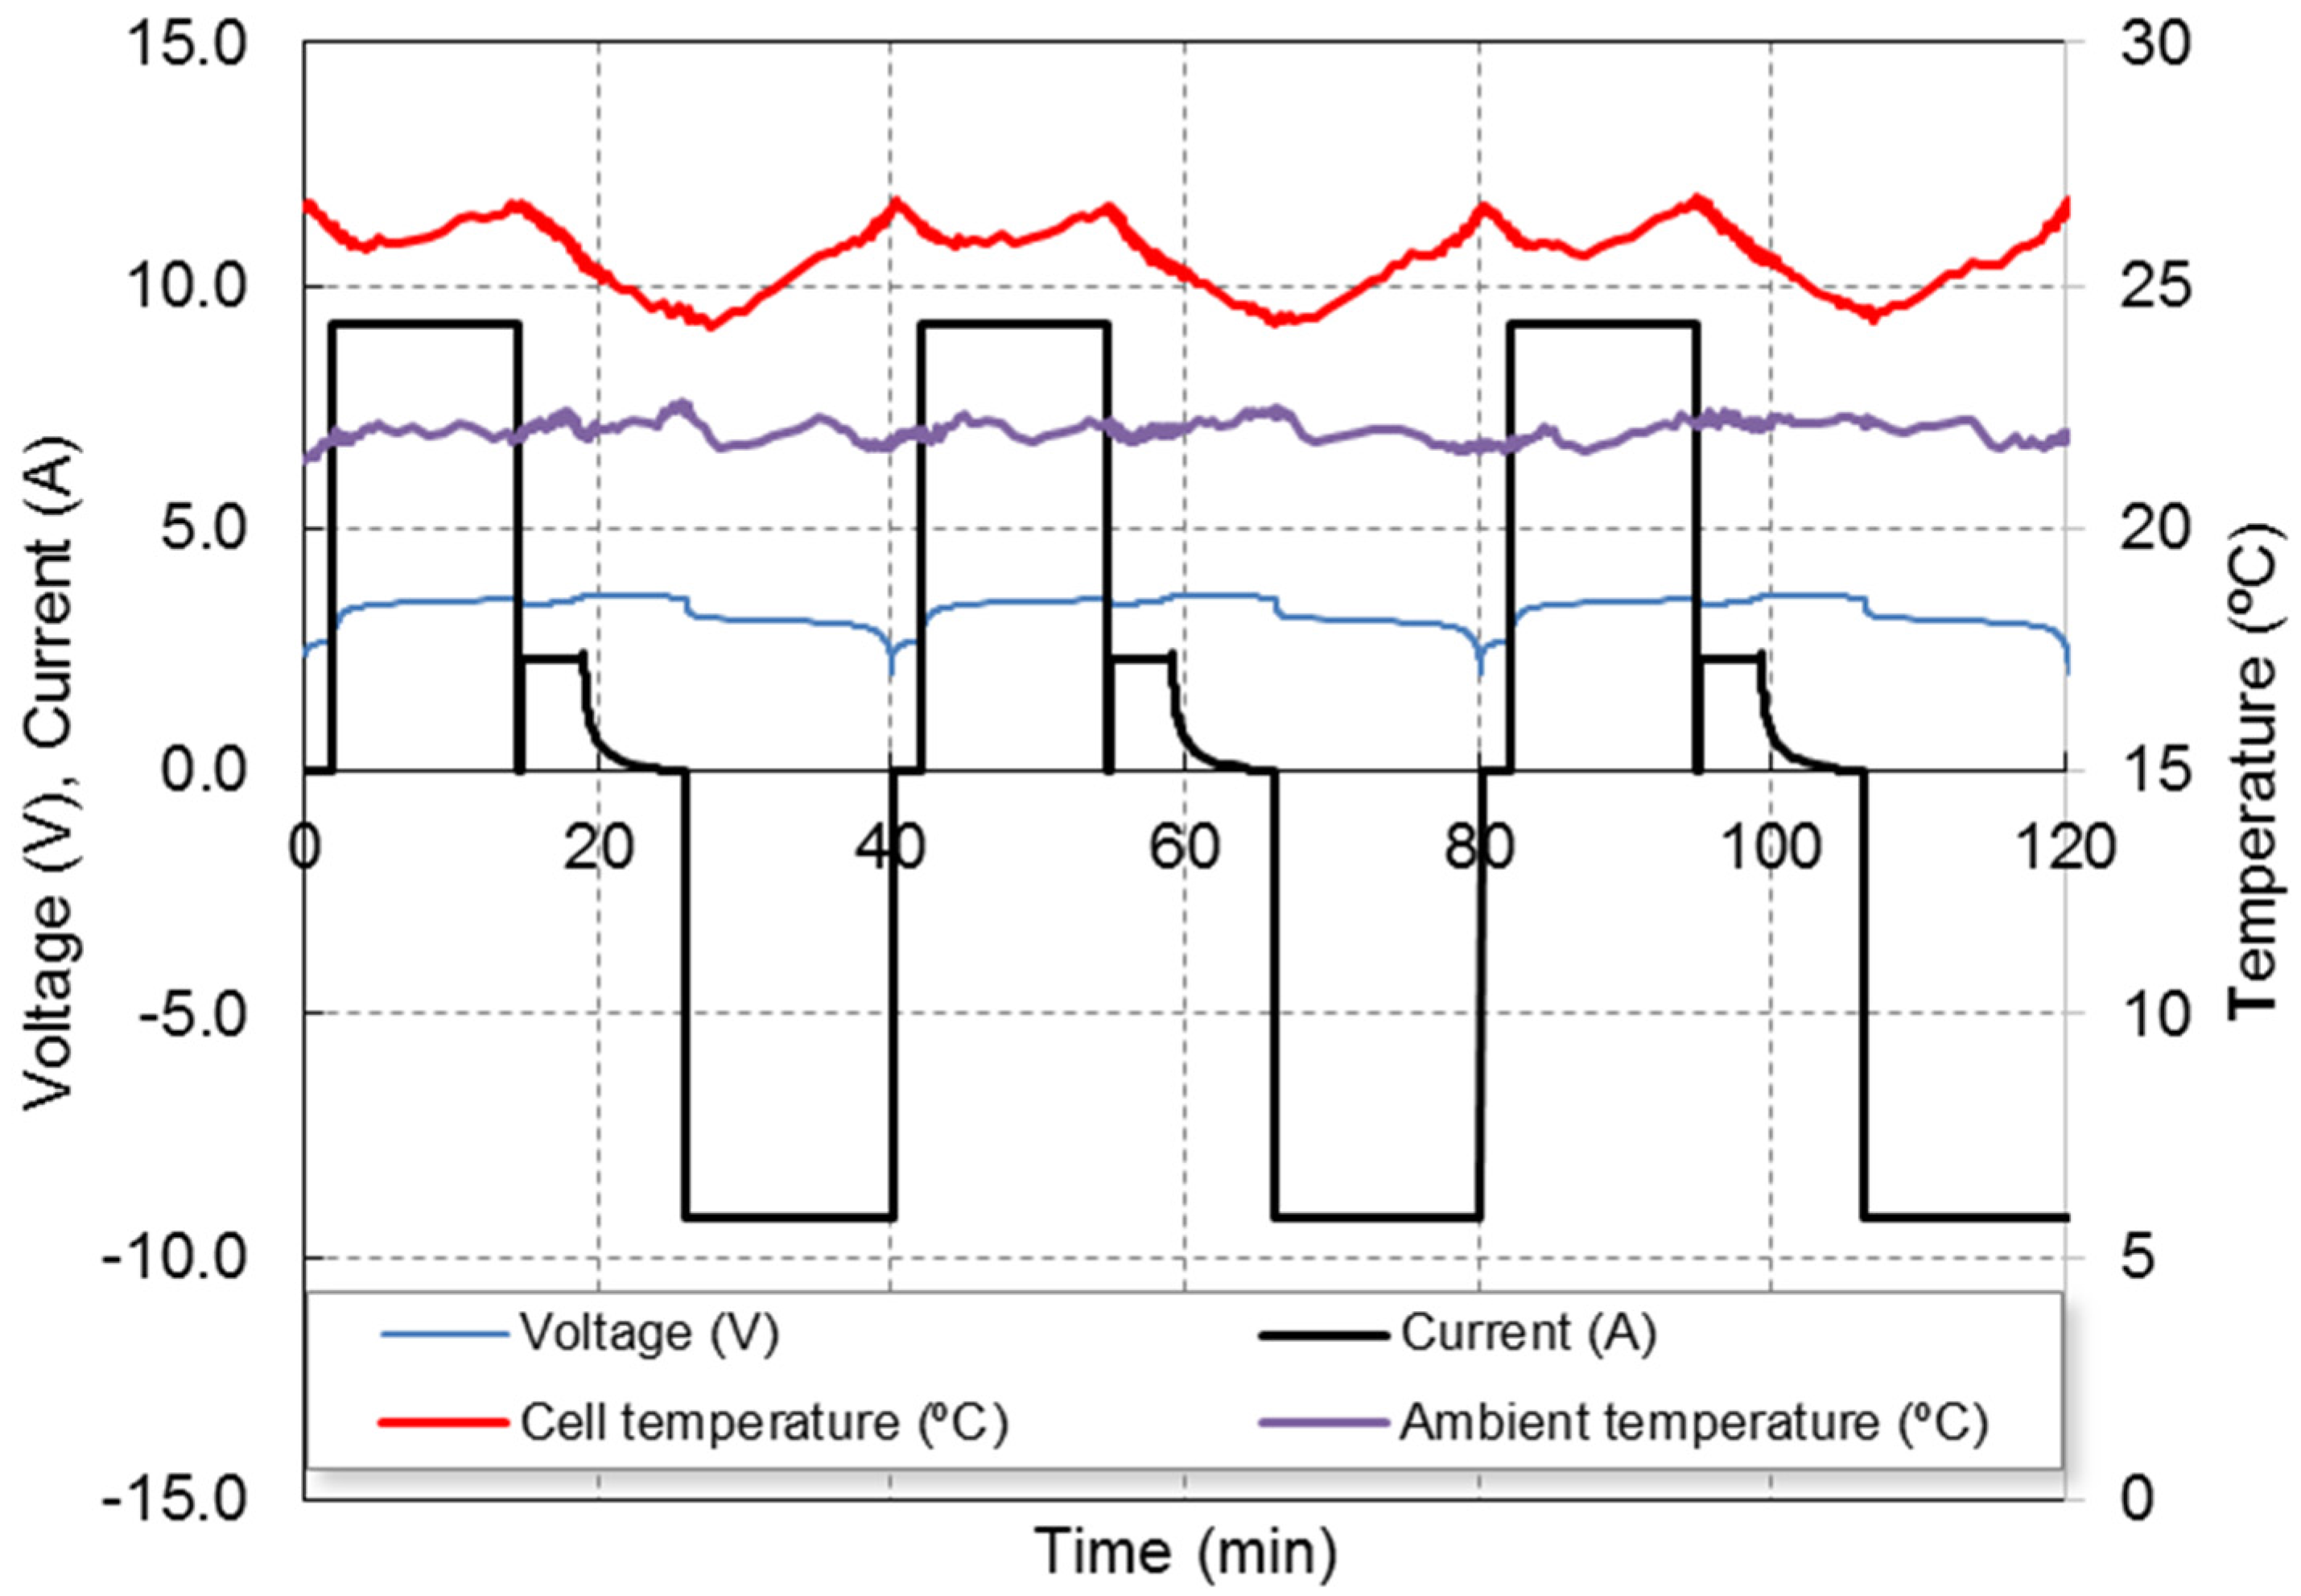
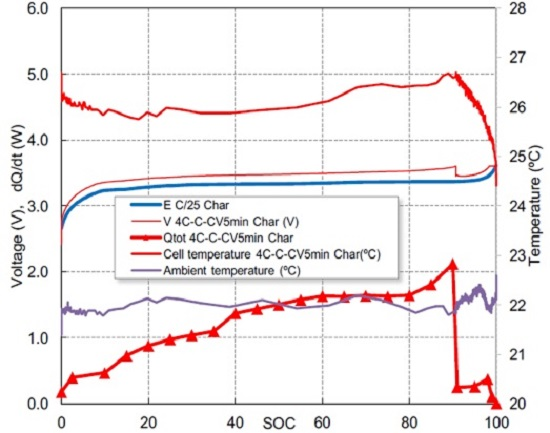
The used multistage fast charging technique profile is shown in
Figure 1, showing the evolution of cell voltage, current and temperature (both cell temperature surface and ambient temperature), for three consecutive cycles. The fast charging protocol approximately completes the charge in 25 min, while a standard charging protocol at 1C needs 1 h. The 4C step lasts about 15 min, the 1C stage lasts about 4 min and the 5 last min of the CV step allows the charge to be completed. The goal of the 4C step is quickly provides the most of the capacity while the temperature increases. The 1C-CV steps complete at the charge at slow speed and reduce the temperature. More details of this method can be found in our previous work [
10,
11].
This fast charging/fast discharging sequence was performed continuously for 300 cycles, after which the reference tests were performed. The test sequence includes a final constant current charge and discharge cycle at C/25 (0.092 A). The C/25 rate is considered slow enough to obtain a practical approach to the
OCV of the cell [
21]. If the
OCV is represented as a function of the estate of charge,
E(
SOC), it provides a pseudo-thermodynamic description of the cell voltage with negligible kinetic effects, and it is used as a reference to obtain the resistance of the cell
Rcell(
SOC) during the charge and the discharge. Both resistances are necessary to measure the irreversible component of the heat generation.
Taking into account that charging current is considered positive and discharging current is considered negative, the cell resistance is defined as Equation (1):
where
V(
SOC) is the battery voltage for both charge (
V(
SOC) >
E(
SOC)) and discharge (
V(
SOC) <
E(
SOC)).
Figure 1 also shows the temperature profile at the battery casing measured by means of a thermocouple. The ambient temperature is 22 °C. A repetitive pattern can be observed: the casing temperature varies between 24 °C at the end of the charge and 27 °C at the end of both 4C charge and discharge stages.
To obtain the average thermal capacity of the cell from the specific density and specific heat of its components the cell has been open in glove box and the thickness of the collectors, separators and electrodes have been measured by means of a micrometer screw.
3. Model
The cell is assumed to be small enough so that it is considered a body with constant thermal capacity,
Ccell (J/K), and uniform internal temperature
Tint (K). This temperature will change (Equation (2)) as a result of the balance between the stored internal energy, the heat generated (W) by the cell operation and the heat exchanged (W) with the outside environment at constant temperature
Text (K).
The exchanged heat (Equation (3)) is considered proportional to: (a) the total area (lateral and bases), Acell (m2), of the cell; and (b) the temperature difference between the ambient temperature, Text, and the battery casing temperature, T (K).
The proportionality constant is the heat transfer coefficient,
hext (W·m
−2·K
−1), which only depends on convective cooling conditions.
Heat generated inside the cell, when a current flows through the cell, has two main components during normal operation. The first is the irreversible heat linked to full overpotential which includes the charge transfer processes of the reactions at the surface of the electrode particles, the mass transport by diffusion to/from the surface, and the voltage drop on the metal parts and the electrolyte. These processes are responsible for the overpotential, defined as the difference between the battery voltage (
V) when current flows through the battery and the quasi-equilibrium voltage of the battery (
E). This irreversible heat is defined by Equation (4) for both charge and discharge. It is an exothermic dissipative component (
) that heats the cell for both charge and discharge.
The heat generated reversibly is linked to the entropic change of electrode reactions. Applying basic thermodynamic relationships, the definition of the reversible component is given by Equation (5):
where the current is positive for charge and negative for discharge, and the thermal coefficient of the cell is d
E/d
T for both charge and discharge. If the discharge reaction of the cell is exothermic and warms the cell, the charge reaction of the cell is endothermic and cools the cell.
A part of the heat generated by the cell is transported first by conduction from inside the cell, where the temperature is
Tint, to the outer surface of the cell casing, where the temperature is
T, and then from the cell casing to outside the cell, where the temperature is
Text. This heat flow is expressed by Equation (6):
where the internal heat transfer coefficient,
hint, is considered an effective amount that absorbs any difference in the thermal conductivities that may exist in the radial direction and the axial direction of the cylindrical cell.
Inverse coefficients
hint and
hext are the corresponding thermal resistances
Rth,int and
Rth,ext, respectively. The sum of these two resistances,
Rth (K/W), is defined by Equation (7):
Internal temperature (
Tint), which is not measurable, is eliminated from Equation (2) using Equations (3), (6) and (7). The outer surface of the cell casing,
T, and the environment temperature,
Text, appear instead of
Tint. Both
T and
Text are easily measurable. Equation (2) becomes Equation (8):
For small cells, this simplified model provides good results with little computational effort. As shown in the next section, the obtained values for thermal parameters
Ccell and
Rth are almost identical to those obtained with other methods in [
15].
4. Results and Discussion
The time axis of
Figure 1 is transformed into the
SOC axis for discussing the temperature profiles. The used relationships were (Equation (9)):
where
Idis = −9.2 A for the fast discharge at 4C. For the 4C-1C-CV multistage charging method
Ich = 9.2 A for the CC stage at 4C,
Ich = 2.3 A for the charge stage at CC stage at 1C and
Ich =
I(t) for the CV stage. The measured battery capacity at C/25 is taken as the maximum capacity for both charge and discharge:
Qmax = 2.3 Ah. The discharge capacity at 4C is slightly lower than
Qmax. The charge capacity using the 4C-1C-CV multistage charging method is almost equal to
Qmax due to the final CV stage.
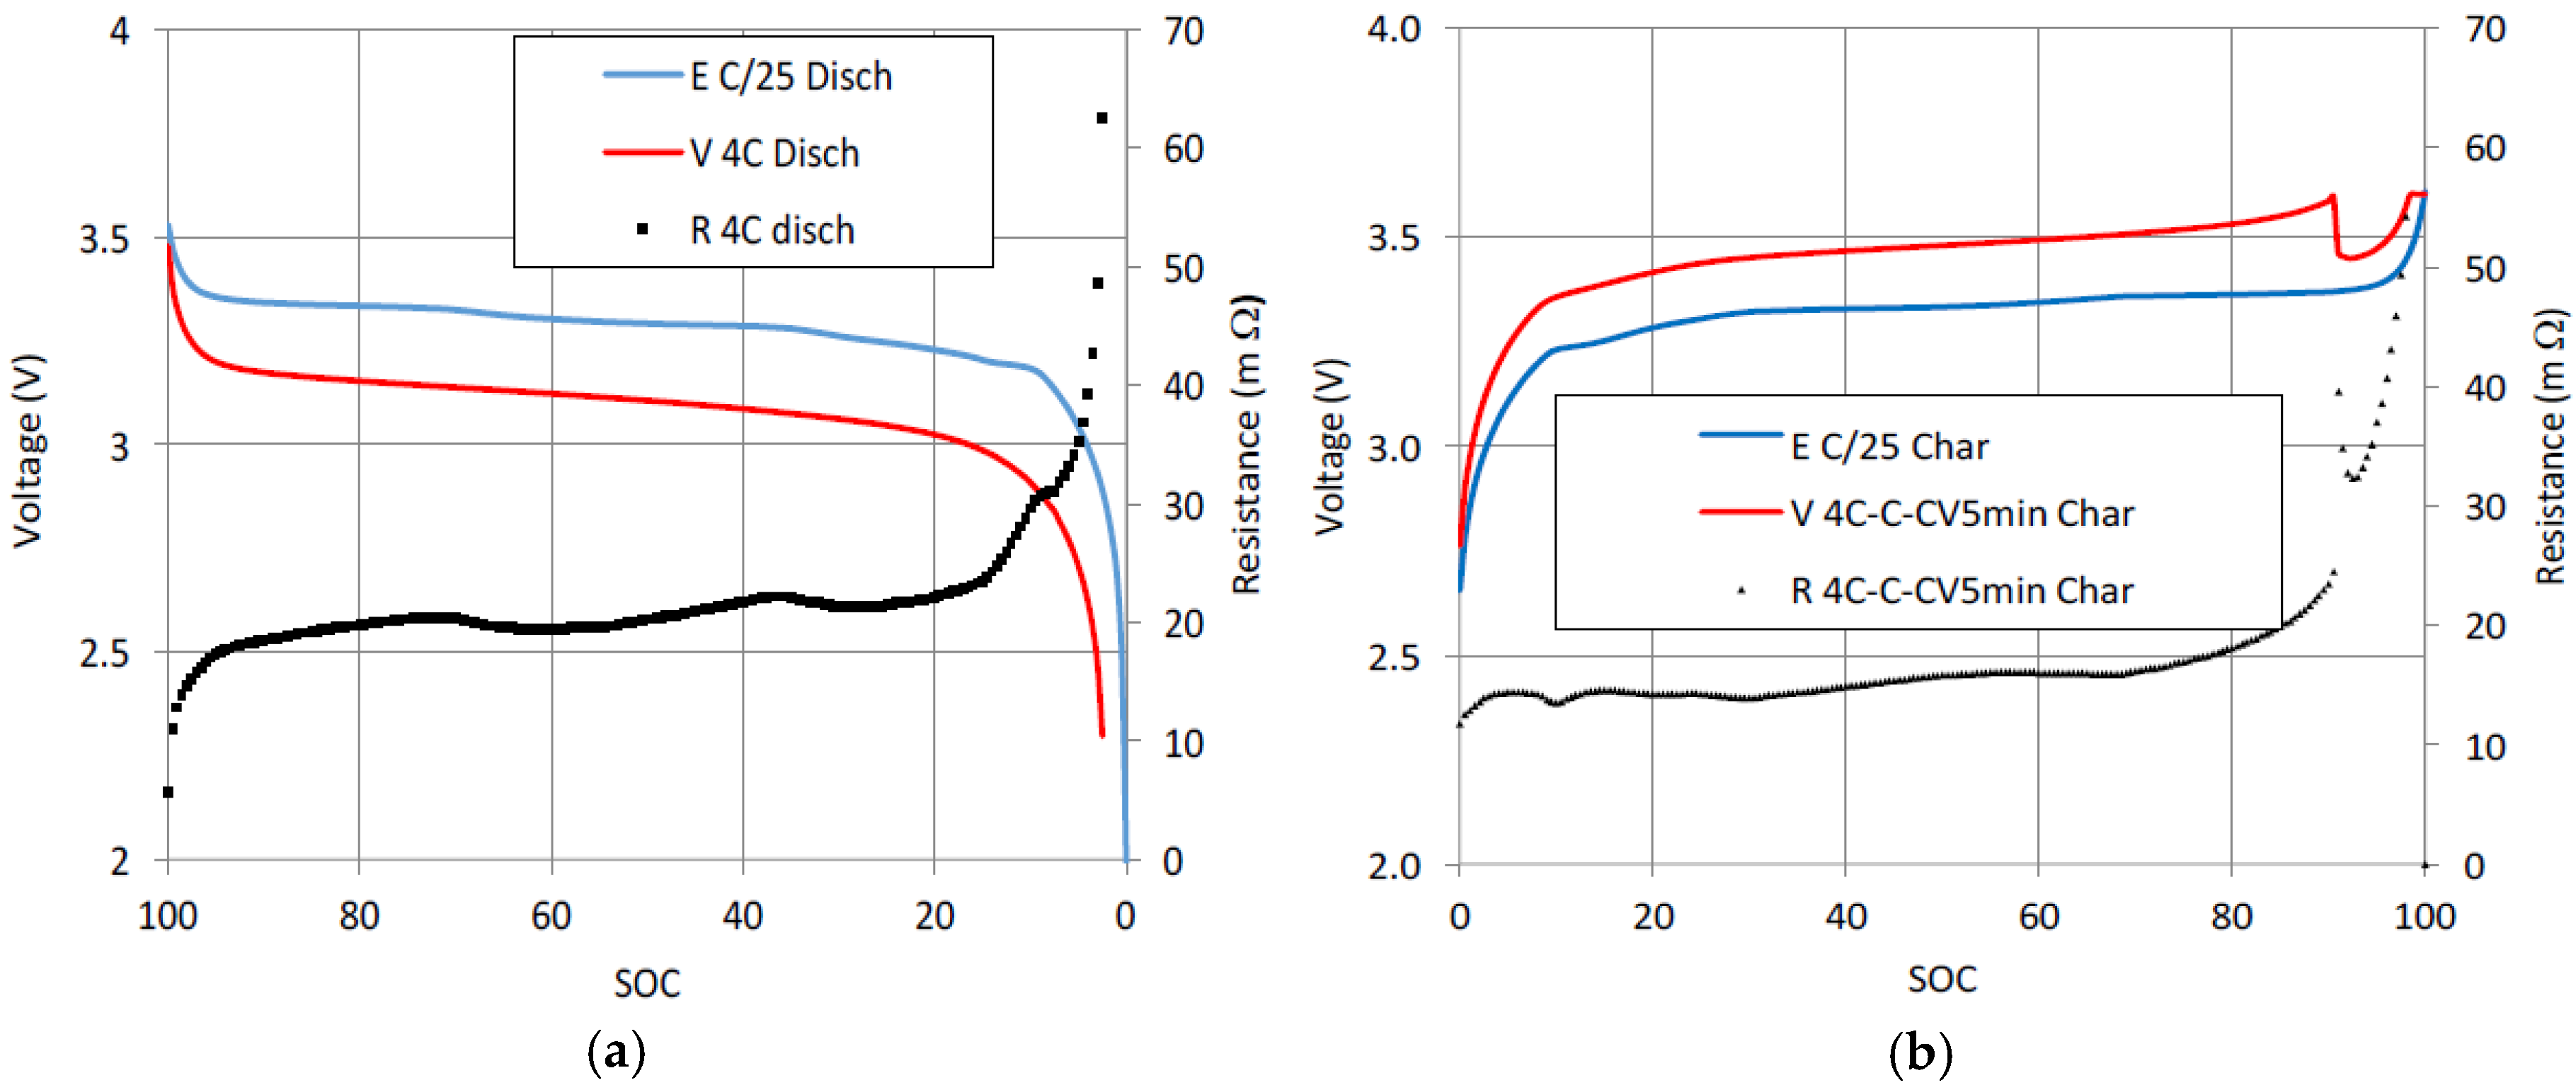
Figure 2a shows the measured voltage for the quasi-thermodynamic discharge at C/25, the measured voltage for a fast discharge at 4C,
Idis = −9.2 A, and the internal resistance of the cell obtained by applying Equation (1). The value of the internal resistance is about 20 mΩ, except near the full discharge area (
SOC = 0), where the
E(
SOC) −
V(
SOC) polarization is very high. The internal resistance presents intermediate peaks due to there being steps in the voltage curve
E(
SOC). These voltage steps are caused by the intercalation compounds of the cell graphite [
22].
Figure 2b shows the value of the internal resistance for a 4C-1C-CV fast charge cycle. At C/25, charging curve
E is slightly higher than discharging curve
E due to structural hysteresis [
23]. The resistance step near the full charge area (
SOC = 90) shown in
Figure 2b is generated by the corresponding step in the 4C-1C-CV multistage charging voltage. The resistance values are lower for charge than for discharge. For charge, the typical value for internal resistance is 15 mΩ, which is according with references [
24,
25]. Unlike at the end of discharge, polarization
I·Rcell =
V −
E near full charge tends to be a very low value because the CV stage ends with a very low current value when
E(
SOC) ≈
V(
SOC).
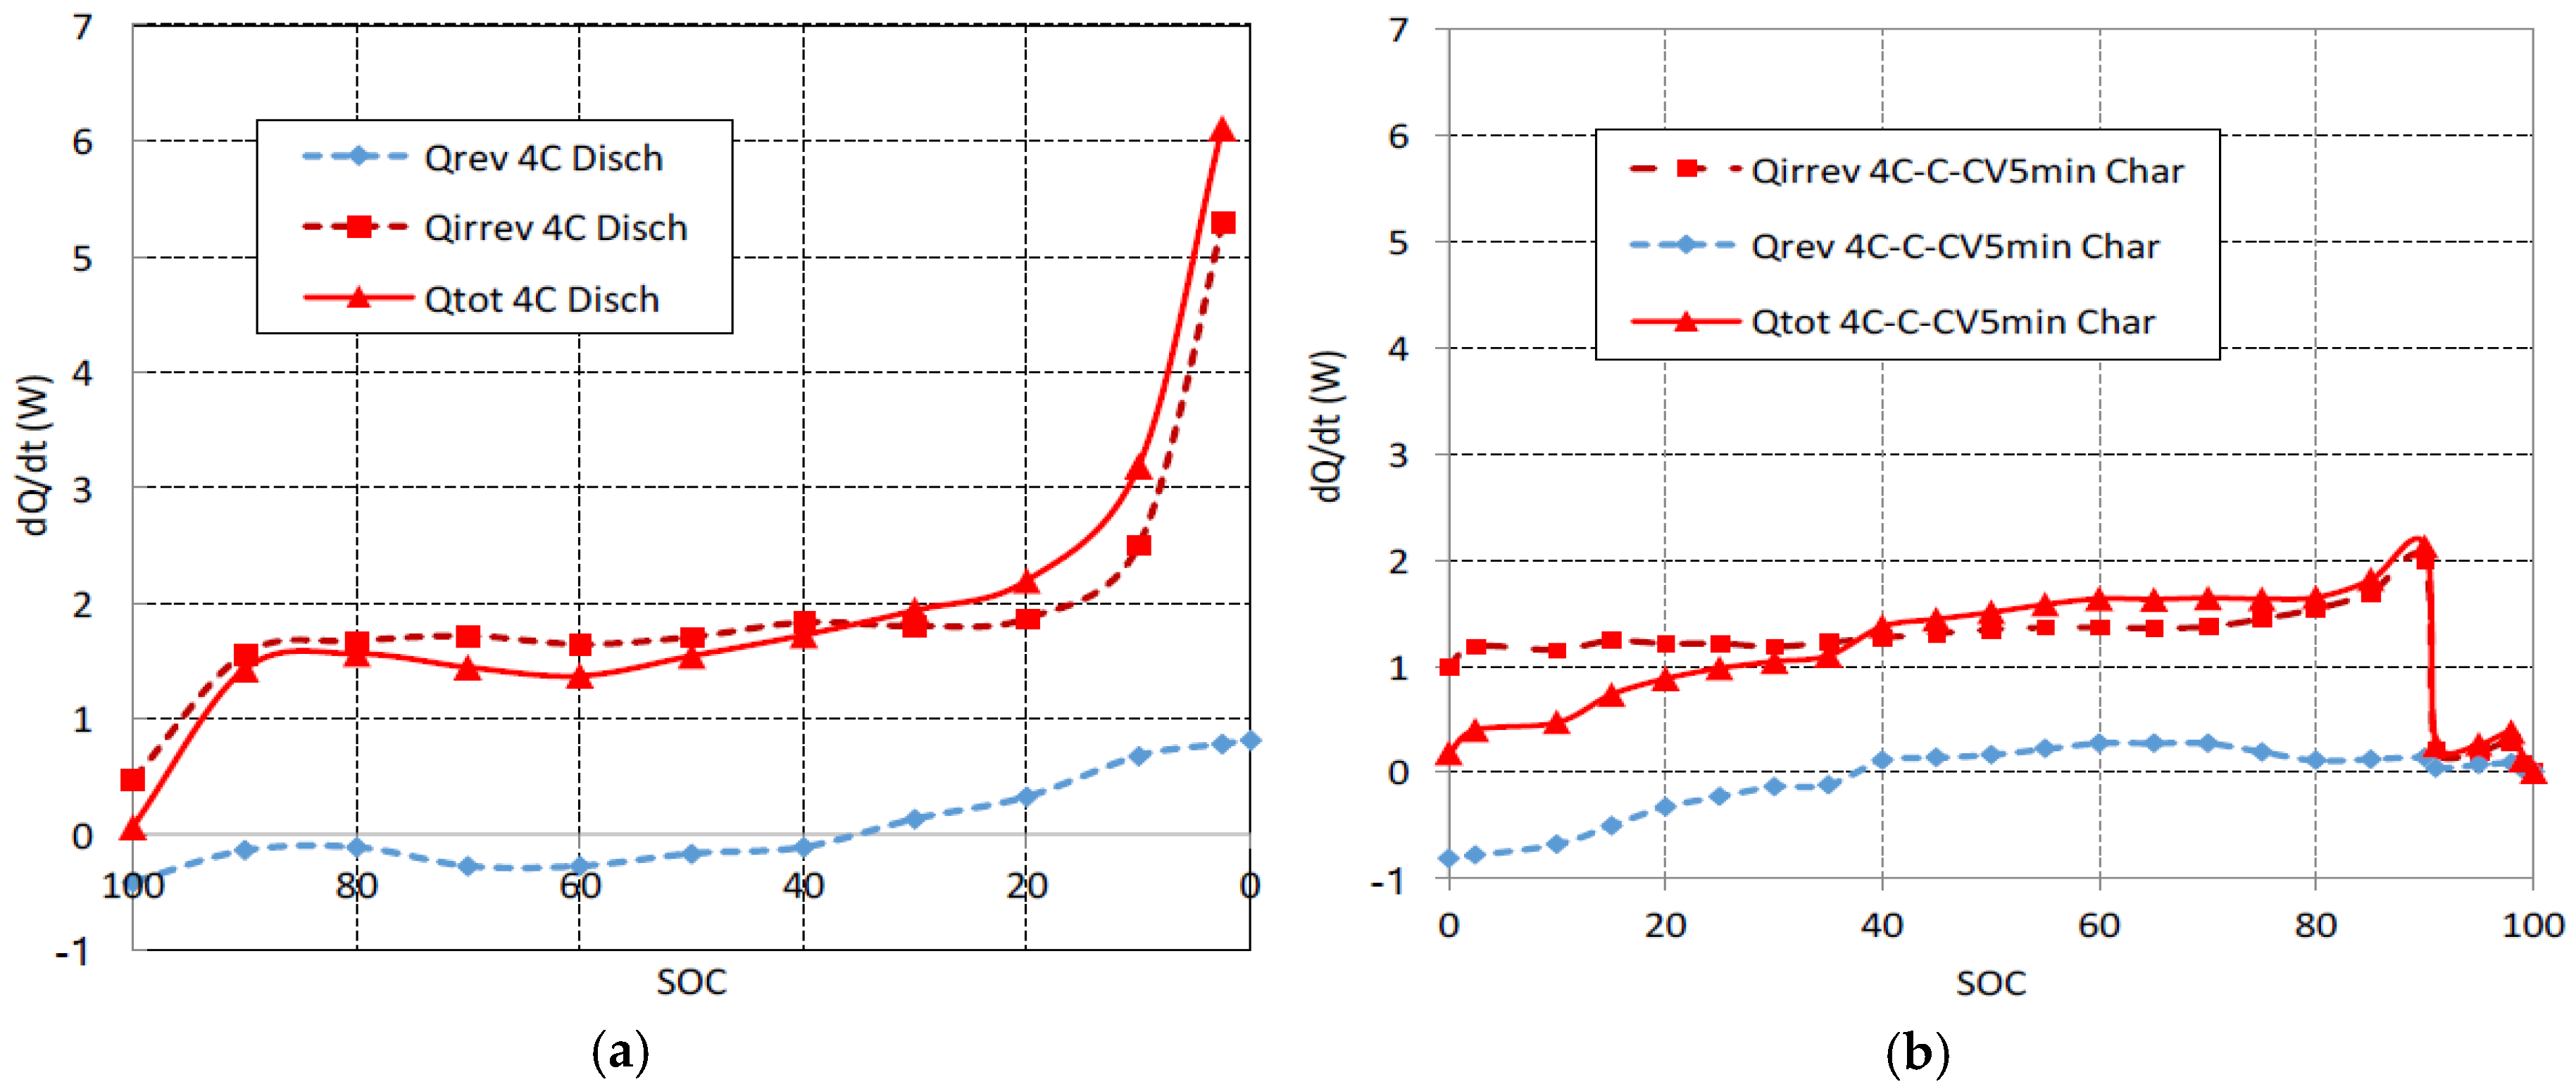
The heat generation power is shown in
Figure 3a for a 4C discharge and it is shown in
Figure 3b for a fast multistage charge. The reversible component of heat has been calculated by means of Equation (5). The thermal coefficient d
E/d
T was obtained from reference [
15]. It can be observed that the reversible component of heat corresponds to an endothermic reaction (heat is absorbed) at the beginning of discharge at 4C, but it corresponds to an exothermic reaction (heat is released) when
SOC is lower than 40%. When the charge begins at 4C, the reversible component of heat corresponds to an endothermic reaction. The reversible absorbed heat at the beginning of the charge at 4C is equal in magnitude to the reversible released heat at the end of discharge at 4C. Also for charge, when
SOC is greater than 40%, reactions become exothermic and the reversible component of heat is released. The reversible released heat during the end charge is lower than the reversible absorbed heat during the initial discharge due to the 1C-CV charging stages. These reversible components of heat present variations related to the intercalation compounds of graphite [
26]. Although at low C rates (<1C) the reversible components of heat have a considerable weight [
27], it can be observed in
Figure 3 that the type Joule (α·
I2) irreversible components dominate the total heat generation due to the high rates (4C) used in this work. For this reason, the beginning of the 1C charge stage, see
Figure 3b, is crucial to reduce the cell overheating. The heat generation of discharge at 4C interpolates well between the values of reference [
16] for discharges at 3C and 6C for the same cell.
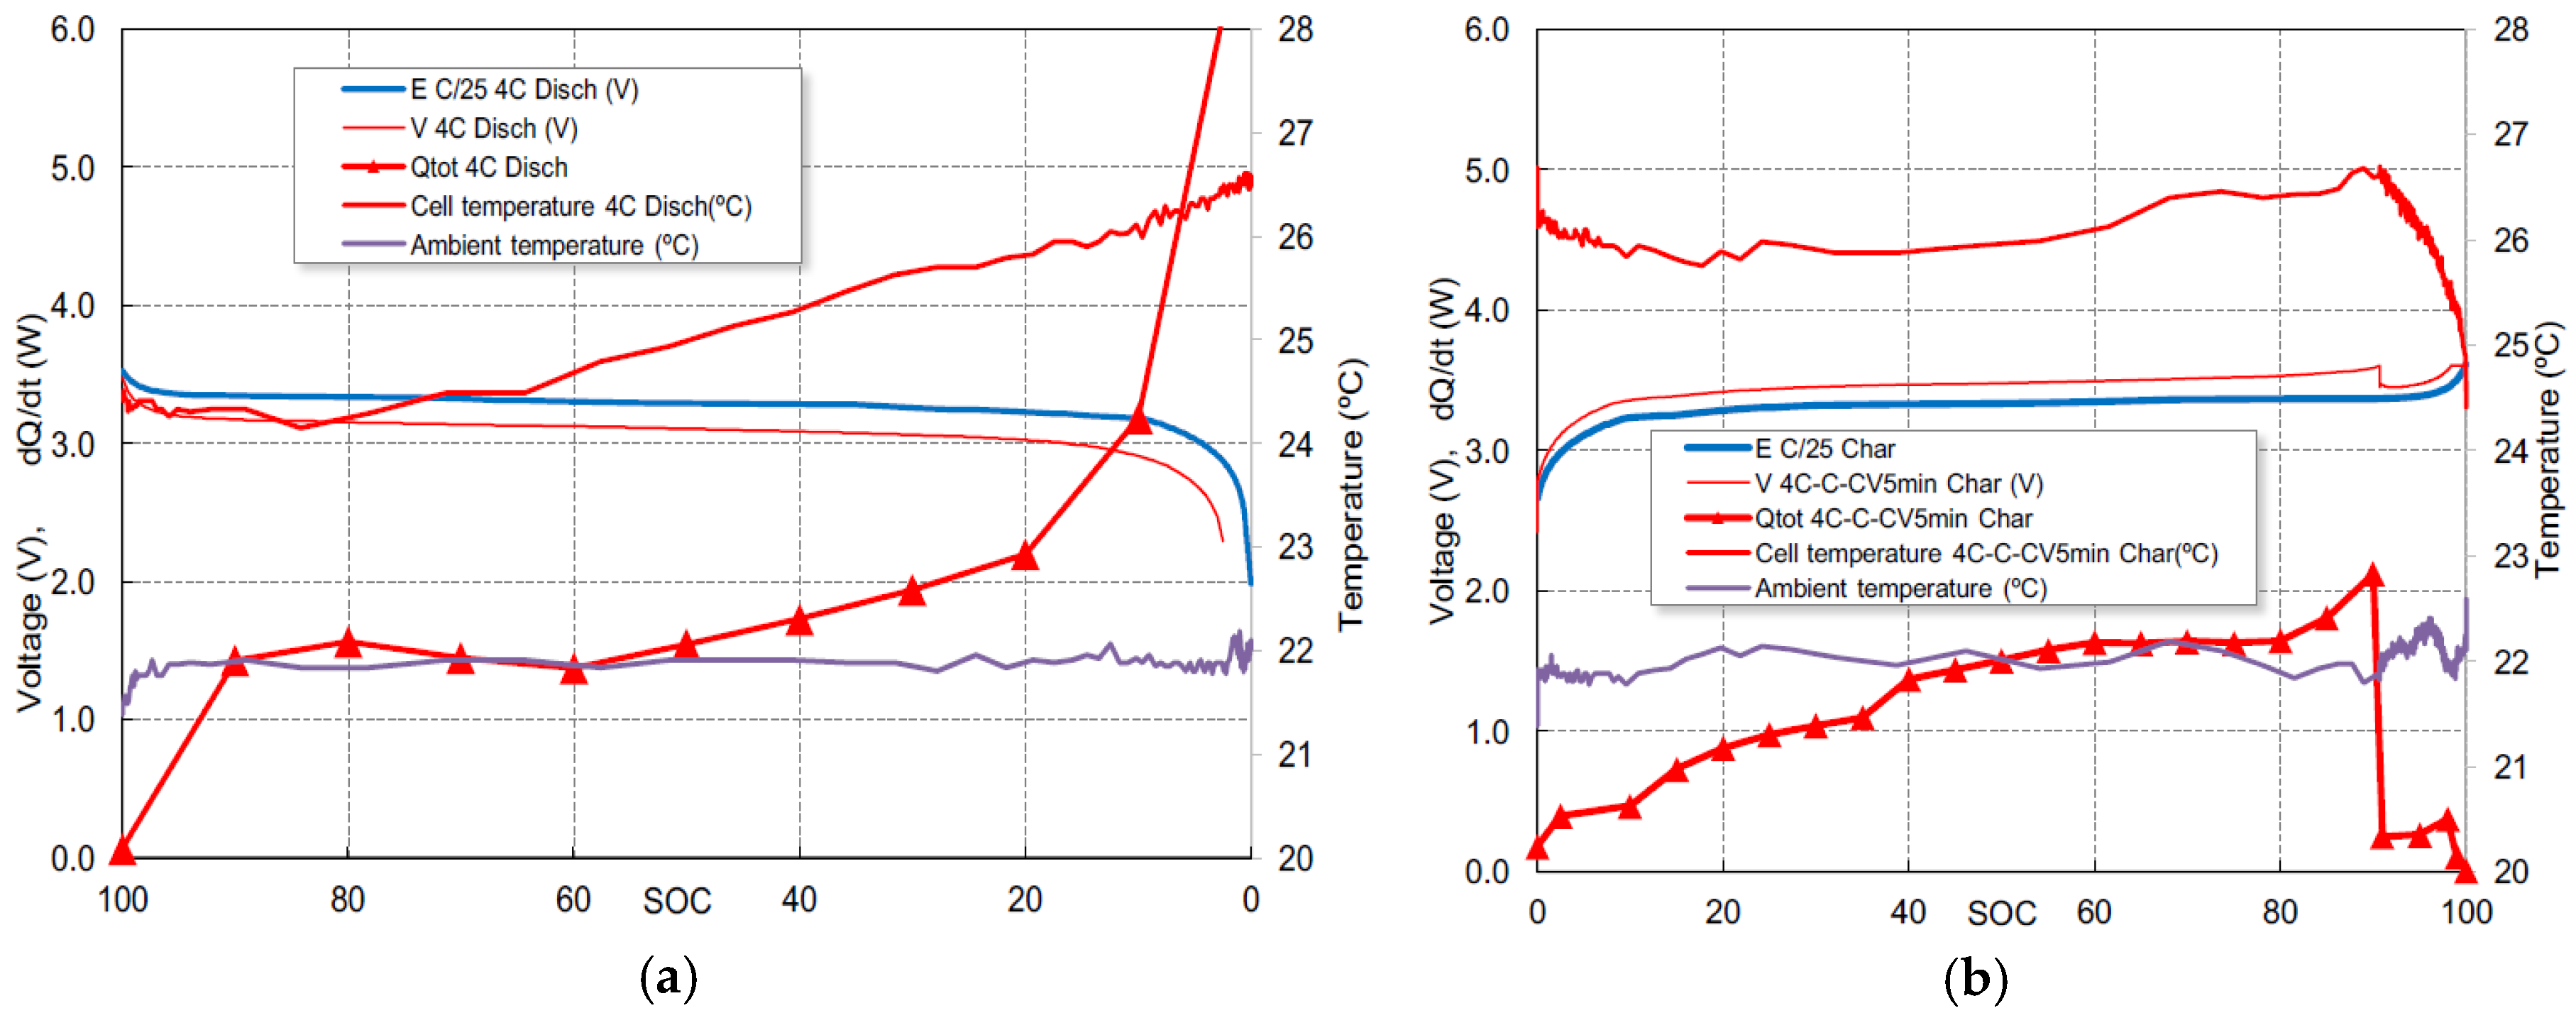
The correlation between the total heat generation, the heat exchange with the environment and temperature variations can be seen in
Figure 4a for the 4C discharge and in
Figure 4b for the 4C-1C-CV fast charge. For discharge, there is an initial cooling followed by an approximately linear heating for both temperature and heat generation, more noticeable in the area where
SOC ranges from 60% to 20%. Below 20% of
SOC, the heat generation increases faster due to the high value of
Rcell shown in
Figure 2a, but the temperature continues to increase linearly. This fact implies an overestimation of the cell resistance or a very effective evacuation of heat to the outside. The decrease of the temperature at the start of the charge, as shown in
Figure 4b, is induced by the resting period of 2 min between charge and discharge (not represented), a moderate heat generation due to the endothermic effect shown in
Figure 3b and the progressive cooling to the outside.
For charge, the heat generation reaches the maximum when SOC is 90%, at the end of the 4C charge stage. It can be observed that the cell temperature and heat dissipation are drastically reduced when the 1C charge stage begins.
Reversible heat generation has not been directly measured in this work but has been estimated from values of d
E/d
T extracted from [
15]. There is also uncertainty in the assessment of the
SOC scale, related to the fact that discharge at 4C does not end with a CV stage and there is no guarantee that the cell charge begins at
SOC = 0% for all the charging cycles. For these reasons, we made a partial adjustment of the experimental data to the thermal model. The current is zero and there is no heat generation during the resting period, 2 min, between the end of the discharge at 4C and the beginning of the charge at 4C, as shown in
Figure 1. Equation (8) becomes Equation (10):
which is a first-order differential equation with a time constant τ
th.
The integration of Equation (10) and the adjustment of the experimental data corresponding to the resting period provides τth = 940 s.
The average thermal capacity (J/K) of the cell (C/LFP, 2.3 Ah) can be determined by means of Equation (11) [
28]:
and data from
Table 1. The thickness,
Li, of cell materials has been obtained by dismantling the cell and measuring them. Densities (ρ
i) and specific heats (
CP,i) have been taken from reference [
16]. The cell mass was
wcell = 0.075 kg. The result for the thermal capacity is
Ccell = 75.6 J/K, which is in accordance with the value of 75.56 J/K of reference [
15], which was measured by means of a direct adjustment of the temperature-time data in the transient area of a thermal cycle once the thermal resistances were measured in a stationary state.
The total thermal resistance (internal and external) can be determined by means of the time constant of Equation (10). It has been obtained that
Rth = τ
th/
Ccell = (940 s)/(75.6 J/K) = 12.4 K/W. This value is also identical to that obtained by [
15].


 ,
, 


