Article

Generalized Characterization Methodology for Performance Modelling of Lithium-Ion Batteries

by
Daniel-Ioan Stroe
*,
Maciej Swierczynski
,
Ana-Irina Stroe
and
Søren Knudsen Kær
Department of Energy Technology, Aalborg University, 9220 Aalborg East, Denmark
*
Author to whom correspondence should be addressed.
Batteries 2016, 2(4), 37; https://doi.org/10.3390/batteries2040037
Submission received: 30 September 2016 / Revised: 17 November 2016 / Accepted: 22 November 2016 / Published: 1 December 2016
(This article belongs to the Special Issue Lithium Ion Batteries)

Abstract

:
Lithium-ion (Li-ion) batteries are complex energy storage devices with their performance behavior highly dependent on the operating conditions (i.e., temperature, load current, and state-of-charge (SOC)). Thus, in order to evaluate their techno-economic viability for a certain application, detailed information about Li-ion battery performance behavior becomes necessary. This paper proposes a comprehensive seven-step methodology for laboratory characterization of Li-ion batteries, in which the battery’s performance parameters (i.e., capacity, open-circuit voltage (OCV), and impedance) are determined and their dependence on the operating conditions are obtained. Furthermore, this paper proposes a novel hybrid procedure for parameterizing the batteries’ equivalent electrical circuit (EEC), which is used to emulate the batteries’ dynamic behavior. Based on this novel parameterization procedure, the performance model of the studied Li-ion battery is developed and its accuracy is successfully verified (maximum error lower than 5% and a mean error below 8.5 mV) for various load profiles (including a real application profile), thus validating the proposed seven-step characterization methodology.

1. Introduction

Recent developments of lithium-ion (Li-ion) batteries based on new and improved chemistries have resulted in batteries with high performance, long lifetime and increased safety [1,2]. Thus, Li-ion batteries have become the key energy storage technology for e-mobility applications [3,4]. Furthermore, energy storage systems based on Li-ion batteries are evaluated in different projects where they are used in grid ancillary service applications [5,6,7] or for renewables’ grid integration [6,8,9]. Consequently, Li-ion batteries are expected to become the major player in utility-scale applications as stated in different surveys [10,11]. Nevertheless, Li-ion batteries are characterized by a high investment cost in comparison to other energy storage technologies (e.g., lead acid and nickel metal hydride (NiMH) batteries) and their performance behavior is highly influenced by the operating conditions: temperature, load current and state-of-charge (SOC). Thus, in order to gain from the aforementioned advantages, the Li-ion batteries have to be operated in an efficient and cost-effective manner.
This objective can be achieved by relying on accurate performance models, which are able to estimate accurately the dynamic behavior of Li-ion batteries independently of the operating conditions; thus, precise energy management strategies can be defined and accurate sizing of the Li-ion batteries based systems can be realized. Moreover, by relying on accurate performance models, Li-ion batteries can be tested by simulations considering different scenarios, thereby reducing the laboratory testing efforts that are usually cost demanding and time consuming.
Depending on the modelling approach followed, Li-ion battery performance models are divided into three main categories: electrochemical models [12,13], mathematical models [14,15], and electrical models [16,17,18]; furthermore, combinations between these three modelling approaches were proposed [19,20]. These approaches are characterized by different accuracy levels and degrees of complexity. Electrical models represent the most suitable solutions for Li-ion battery modelling when they need to be integrated in system-level simulations because of their features such as high accuracy and average computation complexity [21]. Thus, an electrical-based performance modelling approach is detailed in this paper.
Electrical models use an equivalent electrical circuit (EEC), composed of combinations of resistors, capacitors, inductors, constant phase elements etc., to describe the performance (dynamic) behavior of Li-ion batteries. Two methods are traditionally used to parametrize the elements of the EEC. The first method involves applying a DC pulse to the Li-ion battery and measuring the voltage response of the battery [16,22,23,24]. The DC pulse-based electrical models, also referred as Thévenin-based electrical models, use a series resistance and several resistance-capacitance (RC) parallel networks to predict the response of the Li-ion battery to transient load events. The accuracy of the Thévenin-based models depends on the number of RC networks used to estimate the voltage of the Li-ion battery (i.e., the higher the number of RC parallel networks, the better the accuracy of the model), as shown in [22,24]. For a thorough parameterization of the EEC, the DC pulses have to be applied at different SOCs, load currents, and temperatures since the parameters of the EEC are highly dependent on the operating conditions as illustrated in [16,25,26]. One of the disadvantages of the DC pulse technique is represented by the fact that high charging and discharging current pulses cannot be applied at high and low SOC levels, respectively, for low temperatures since the maximum and minimum battery voltage values will be reached. Consequently, a full parameterization of the EEC is not possible. Furthermore, the elements of the EEC, which are determined with this method, mostly lack physicochemical meaning. All these disadvantages are overcome when the second method based on the electrochemical impedance spectroscopy (EIS) technique is used for parameterization of the EEC [27]. EIS has become in the last decade an established technique for characterizing Li-ion batteries and for modelling and parameterizing their performance behavior [17,18,28,29]. The models developed with this technique, referred to as impedance-based models, have the advantage that their EEC’s elements can be easily related with physicochemical processes that occur inside the battery, such as charge transfer and diffusion [28,30,31]. In order to parameterize an impedance-based model, EIS measurements have to be performed at various battery SOC levels and temperatures. Furthermore, it is possible to perform EIS measurements with superimposed DC current, in order to obtain the dependence of the EEC elements on the load current [29]; however, these measurements can be performed only for small currents (reduced C-rates) because, since the EIS measurements are time demanding, they will result in changing the Li-ion battery’s SOC. Thus, the impedance-based performance model will not be able to predict accurately the voltage of the Li-ion batteries for high C-rates, which are characteristic for Li-ion batteries used in many e-mobility and grid applications.
This paper proposes a new approach to parameterize the EEC, which combines the advantages of the two traditional methods. Therefore, the proposed hybrid method uses the EIS technique to parameterize the EEC and express the dependence of its elements on the SOC and temperature and the DC pulse technique to express their dependence on the load current. Furthermore, a physicochemical interpretation of the EEC elements and their corresponding values can be realized. Nevertheless, building and parameterizing a performance model for a Li-ion battery is a complex process and an extensive laboratory characterization of the targeted battery has to be performed in order to obtain information about various parameters such as: capacity, open-circuit voltage (OCV) etc. and their dependence on the operating conditions such as: SOC, temperature, and load current. Thus, besides proposing a new approach of parameterizing the EEC, this paper presents a comprehensive seven-step methodology for characterizing and modelling the performance behavior of a Li-ion battery. The present paper is structured as follows. Section 2 gives brief information about the Li-ion battery used in this work and presents the experimental set-up used for characterizing the Li-ion battery. Section 3 presents the proposed seven-step methodology for characterizing and parameterizing the performance model of the studied Li-ion battery. Based on the obtained results from the characterization test, the performance model of the Li-ion battery is developed in Section 4. In Section 5, extensive results obtained from the validation of the proposed performance model are presented, while concluding remarks are given in Section 6.

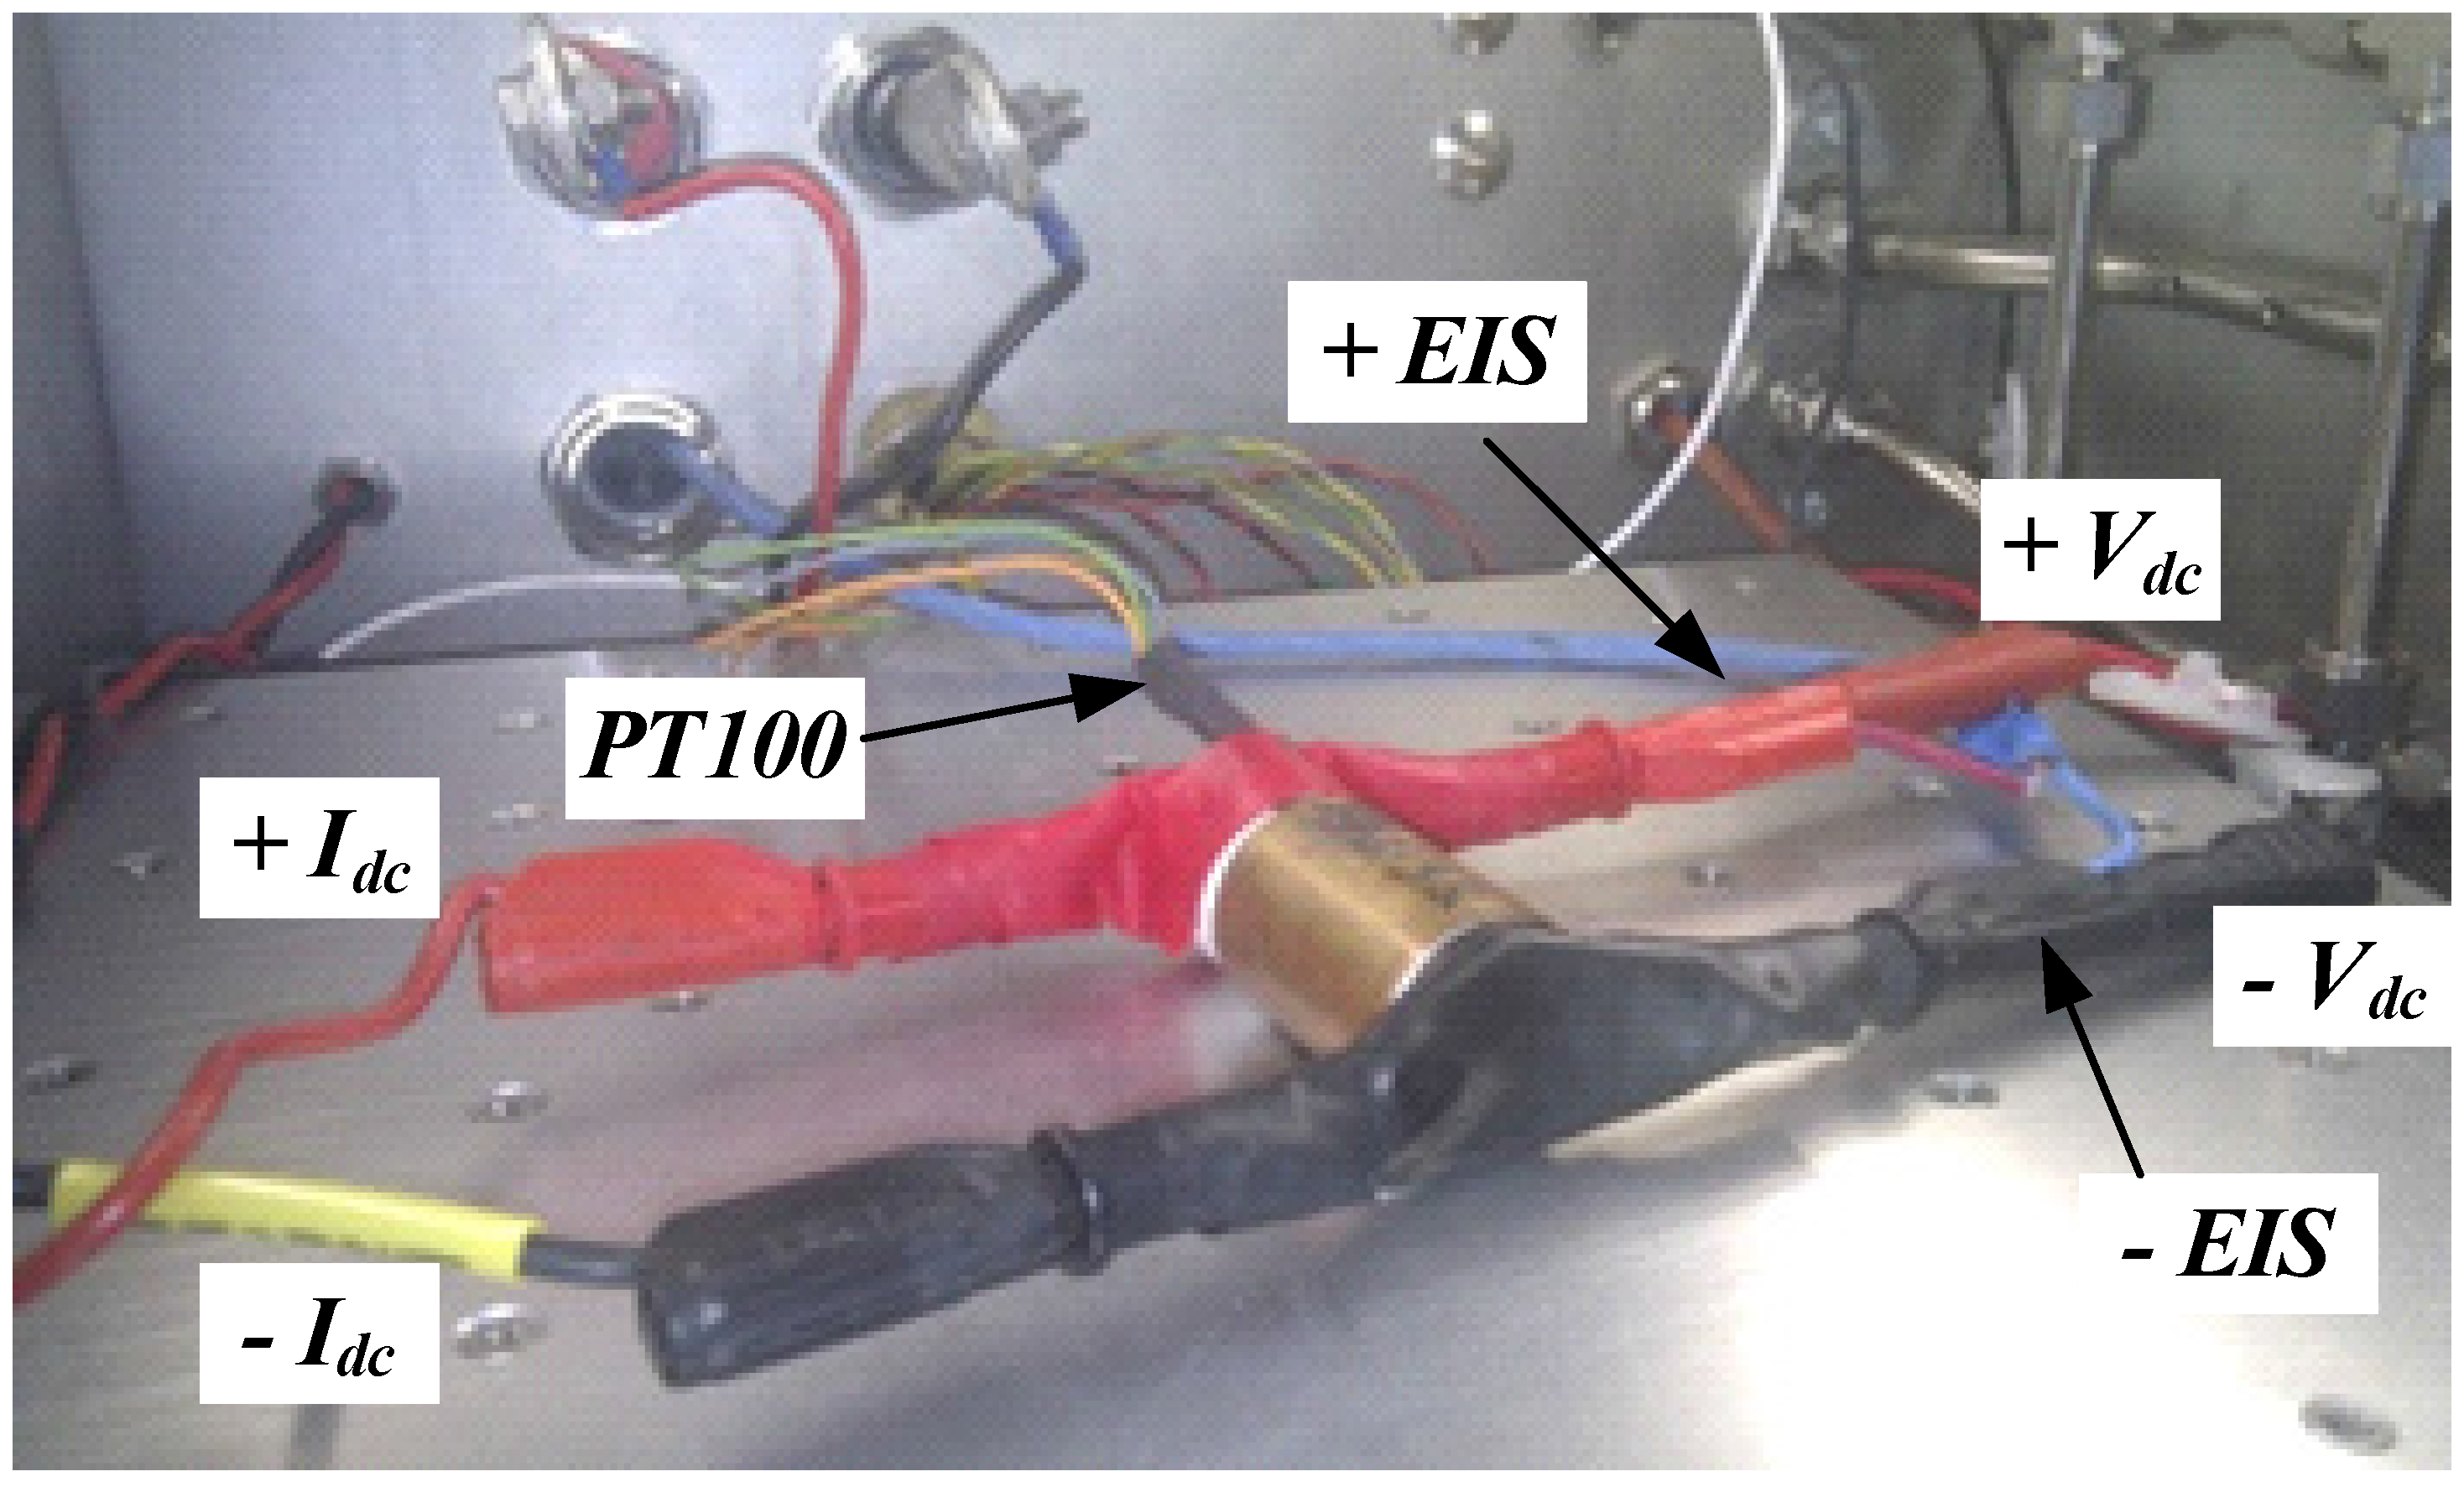
2. Experimental Set-Up

At present, a wide variety of Li-ion battery chemistries are available on the market that are, depending on their characteristics, suitable for a broad range of applications from electro-mobility to back-up power and renewables’ grid integration [32]. Nevertheless, none of these chemistries is superior to the others from all perspectives (e.g., energy density, specific energy, cost per cycle, etc.) [33]. Therefore, the characterization methodology presented in this work and the proposed performance model can be applied independently of the type of the selected Li-ion battery chemistry. For exemplifying the proposed characterization methodology, a commercial 2.5 Ah battery based on the lithium iron phosphate/graphite (further referred to as LFP/C), is used in this work.
During the whole characterization process, the battery was placed inside a temperature-controlled chamber, as illustrated in Figure 1, and its temperature was continuously monitored using a PT100 sensor. Furthermore, the temperature of the chamber was adjusted in order to obtain the desired temperature on the surface of the LFP/C battery; thus, the temperature values mentioned in this work are the ones of the battery and not the ambient temperature values of the chamber.

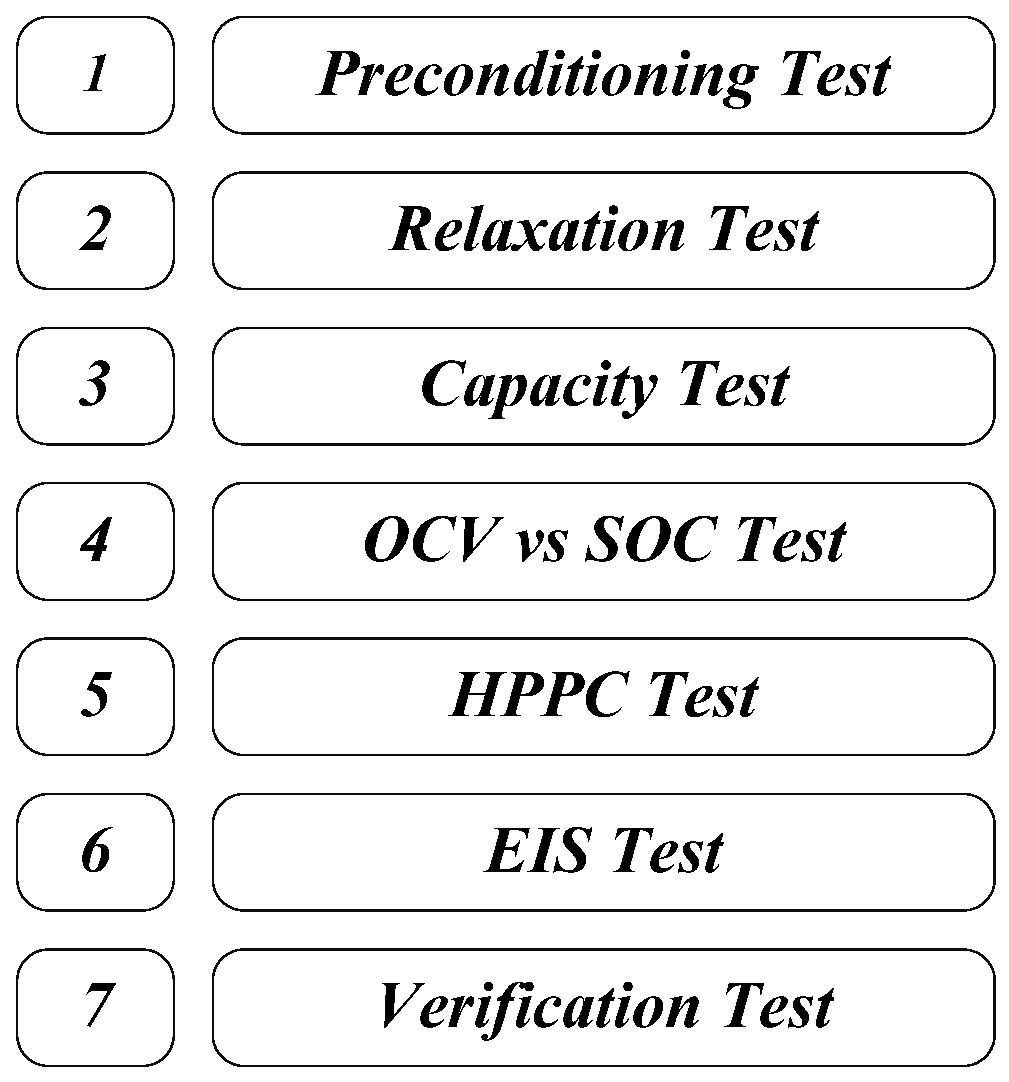
3. Lithium-Ion Battery Characterization Methodology

The main objective of the proposed characterization methodology was to measure the performance parameters of the studied battery and to determine their dependence on the operating conditions; the operating conditions cover the sum of the conditions given by the load current, temperature, and SOC. Based on the obtained results, which are presented throughout this section, the performance model of the LFP/C battery was developed and parameterized (see Section 4).
In order to determine the performance behavior of the tested LFP/C battery, the seven-step methodology, which is presented in Figure 2, was proposed. This methodology is composed of various tests, which were carried out following the sequence illustrated in Figure 2; the first six tests are presented throughout the next subsections, while the last step (i.e., verification test) is extensively discussed in Section 5.

3.1. Preconditioning Test

The objective of the preconditioning test was to remove any possible passivation to which the battery was subjected to, between the manufacturing time and the initial tests. Moreover, an additional goal of this test was to stabilize the battery capacity since the solid electrolyte interface of the batteries is not shaped after the manufacturing process and its porosity/shape changes meaningfully after the first few cycles. Thus, the preconditioning test was composed of five successive charge-discharge cycles performed with 1C-rate (i.e., 2.5 A) at 25 °C [21]. The results obtained for the case of the discharging capacity of the tested battery are presented in Figure 3.
The measured capacity of the LFP/C battery was stable, with a tendency of slight monotonic increase of approximately 0.6% during the five performed cycles; nevertheless, the battery was considered preconditioned since its capacity did not change more than 3% during two consecutive discharges [34].

3.2. Relaxation Test
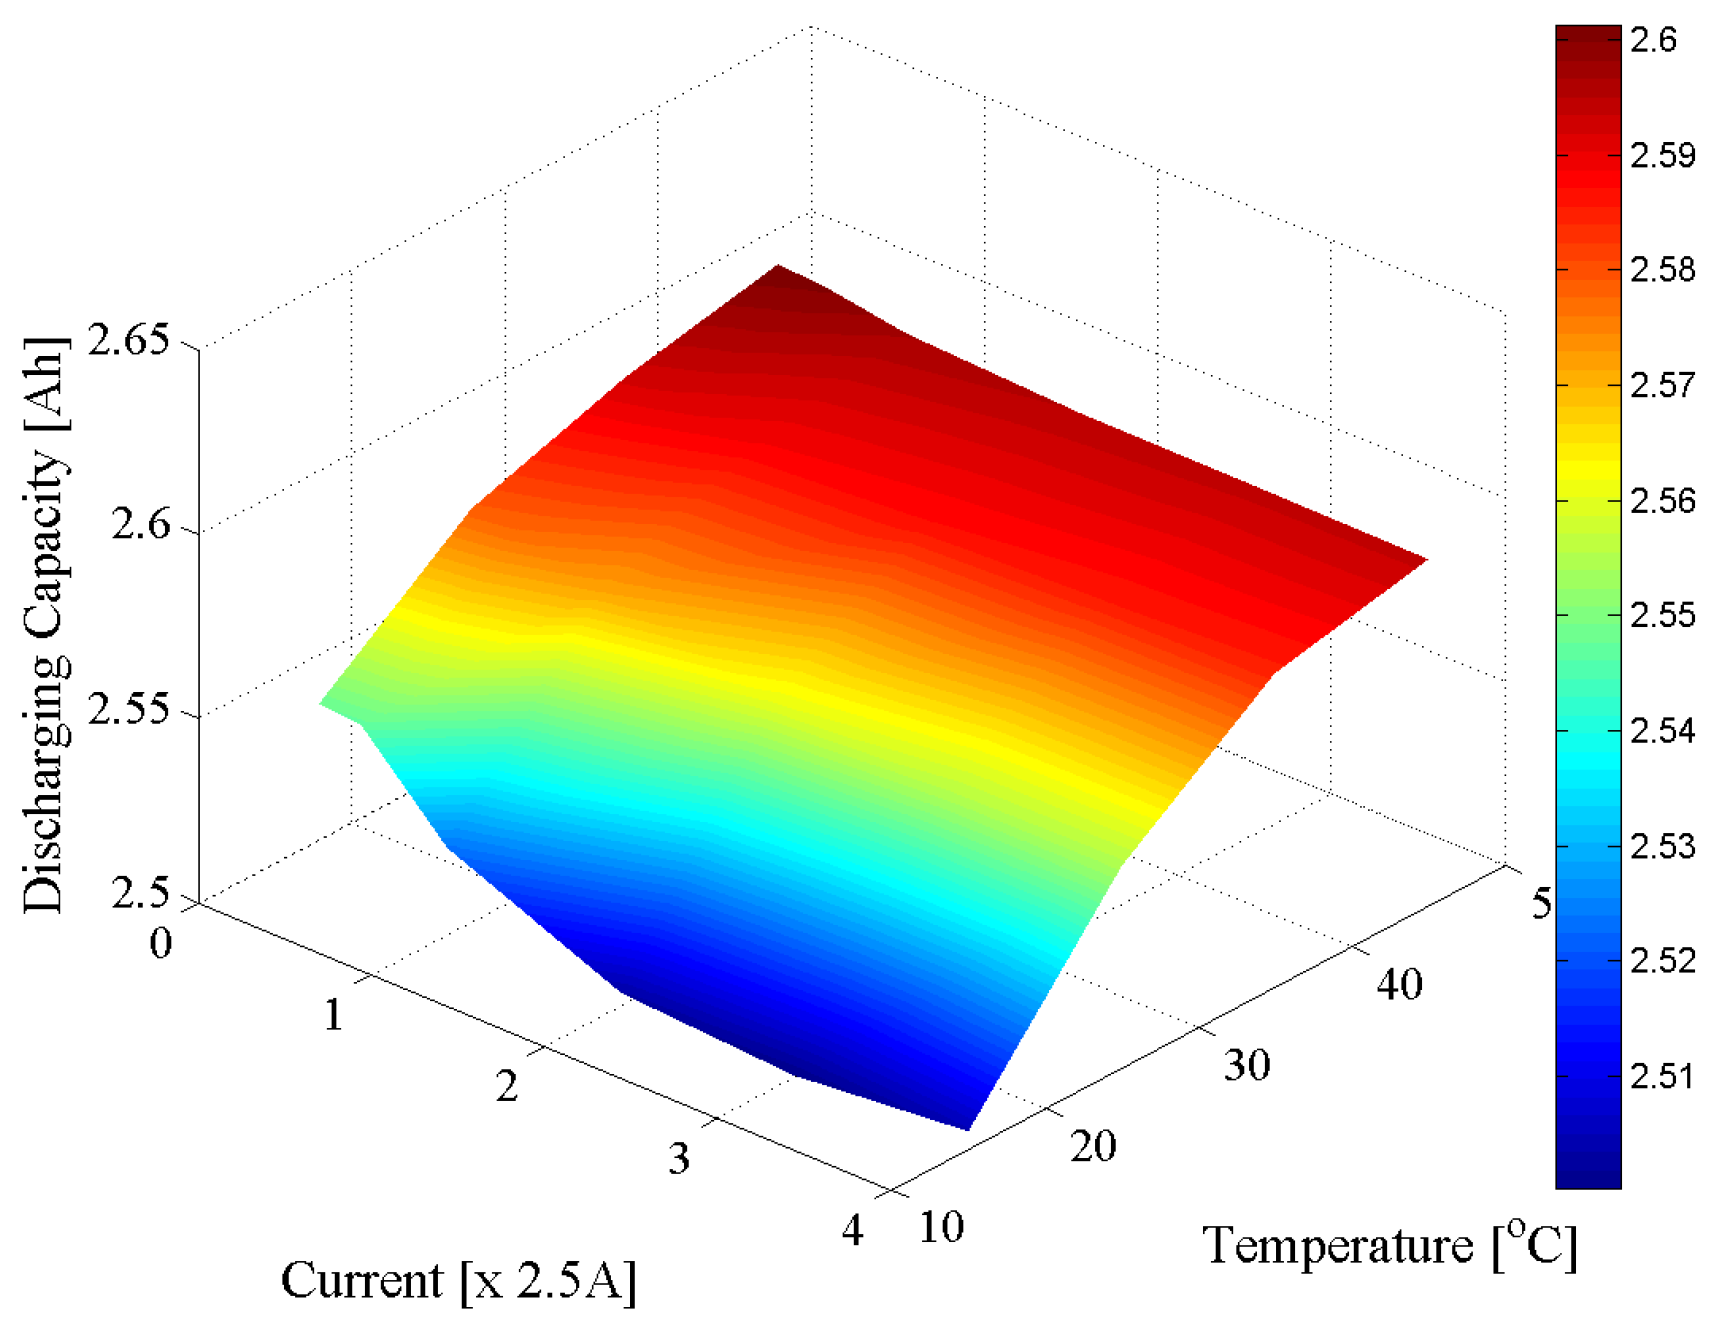
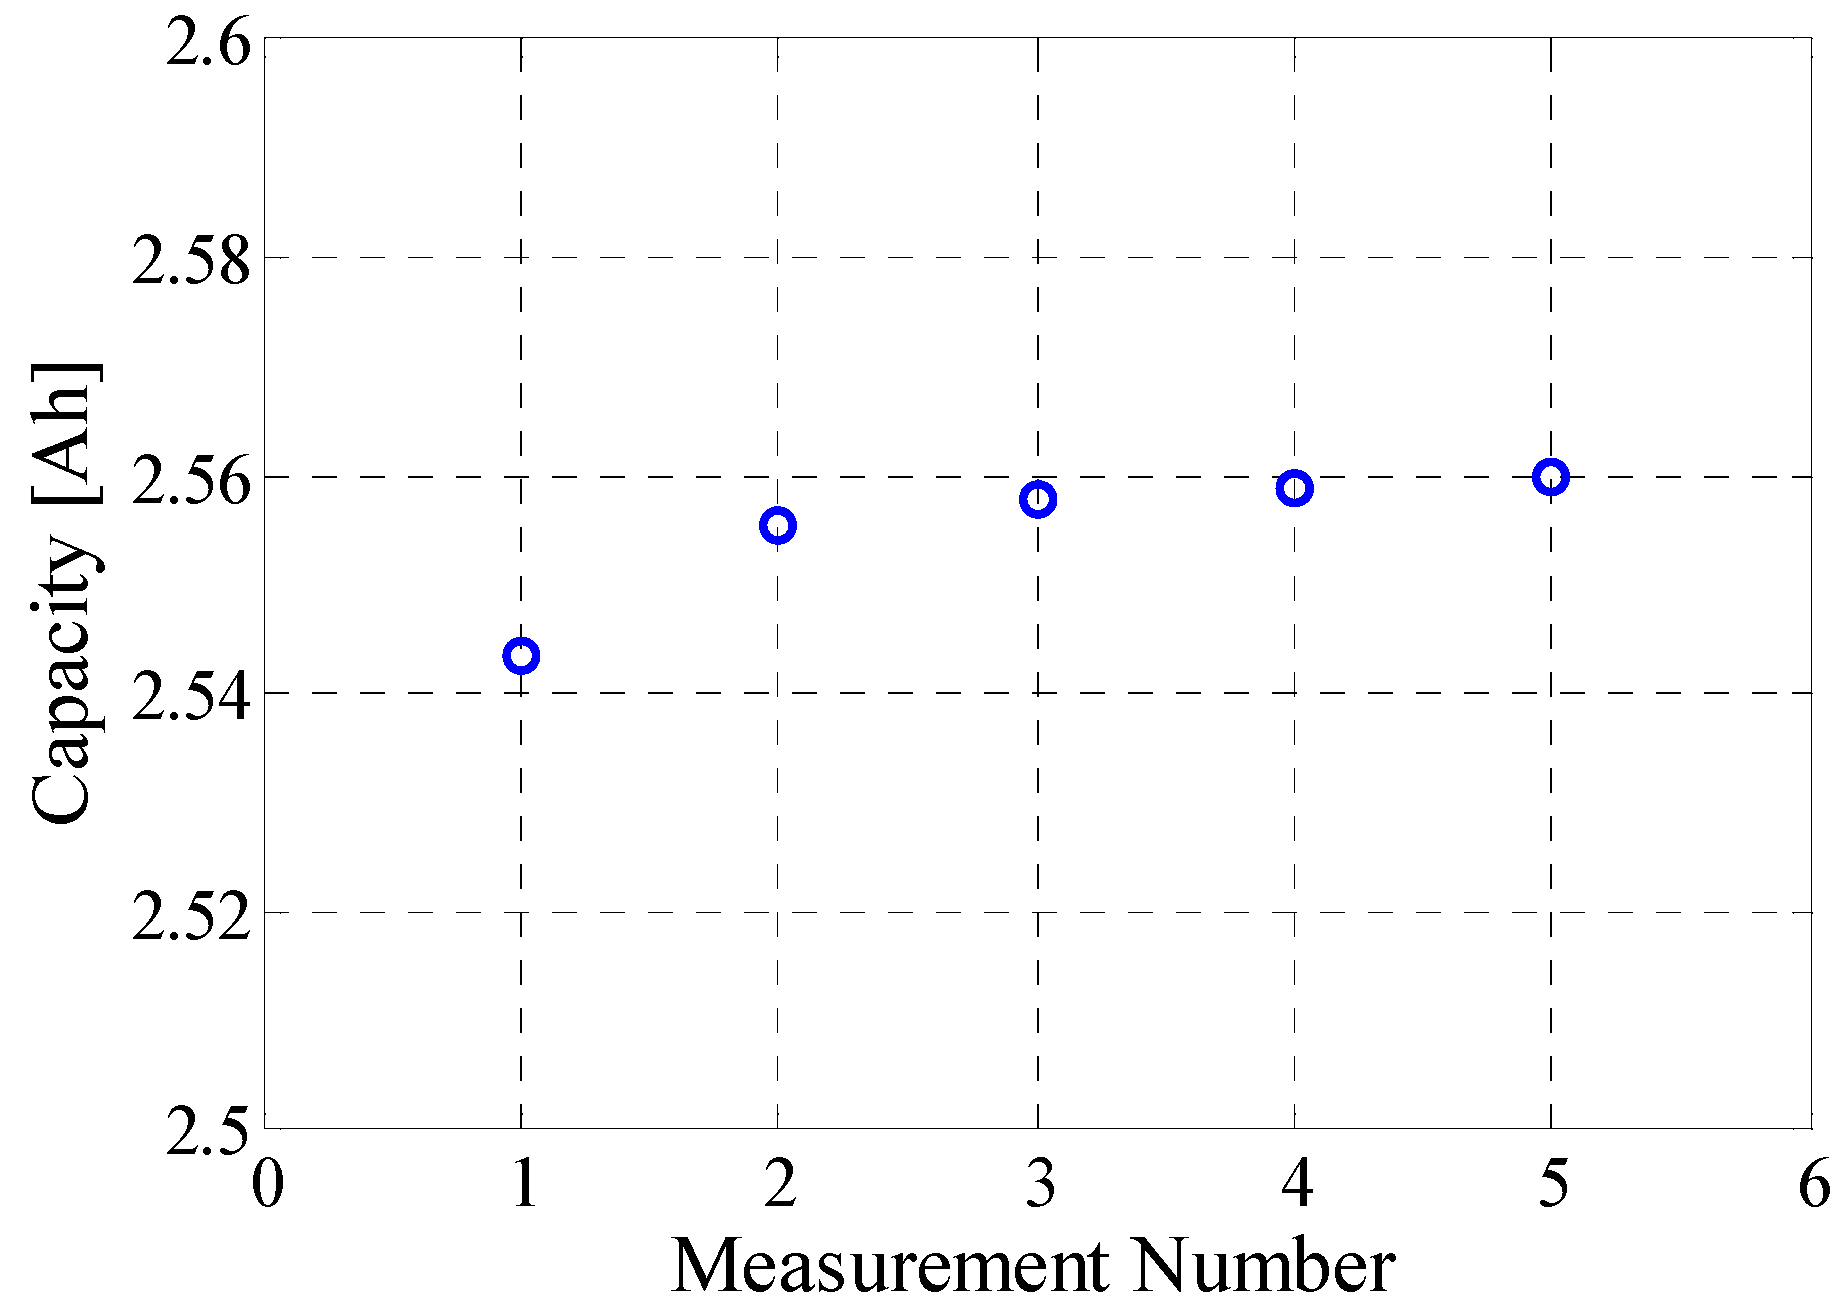
Usually, the behavior of the Li-ion batteries is altered by the concentration gradients of the ionic charge carriers immediately after the load current is switched off [35]. Consequently, a relaxation period, which will allow the battery to reach thermodynamic stability, has to be applied between the switch off of the load current and the desired measurement. In order to determine the optimal length of this relaxation period, the behavior of the OCV of the LFP/C battery was investigated; the battery was fully charged and then discharged at three different SOCs (i.e., 80%, 50% and 20%), where it was kept at OCV conditions for 24 h, respectively [21]. The voltage values measured, with one-second resolution, during the relaxation period were related to the OCV value measured after 24 h (when the battery was considered quasi-stabilized); thus, the OCV error was computed according to Equation (1).
ε O C V = | V i O C V | O C V 100
where εOCV represents the OCV error and Vi represents the voltage measured at every second during the 24 h relaxation.
Based on the obtained results, which are summarized in Table 1, it was concluded that the OCV value is only slightly influenced by a relaxation time, which varies between 15 min and 24 h. Thus, a relaxation time of one hour was considered enough for the LFP/C battery to reach quasi-thermodynamic stability and to allow for accurate measurement of the desired performance parameters.

3.3. Capacity Test

The capacity of Li-ion batteries is dependent on the operating temperature and on the applied load current [15,17]. Moreover, as presented by various researchers, the capacity of Li-ion batteries degrades over time [36,37,38]; however, this analysis is out of the scope of the present paper. The objective of the capacity test was to determine the dependence of the charged and discharged capacity of the LFP/C battery on the two aforementioned parameters. Thus, the capacity of the battery was measured for six different C-rates (i.e., C/4, C/2, 1C, 2C, 3C and 4C) and at four different temperatures (i.e., 15 °C, 25 °C, 35 °C and 45 °C), following the procedure which is presented in [21].
The dependence of the LFP/C battery’s discharging capacity on the C-rate and on the temperature is illustrated in Figure 4. The discharged capacity of the LFP/C battery measured at 25 °C decreases as the applied current increases; however, the decrease of the capacity for the considered C-rate interval (C/4–4C) is lower than 1%. This behavior suggests a Peukert number very close to 1, which is in good agreement with the results reported for a similar battery chemistry by Omar et al. [39]. Furthermore, as presented in Figure 4, for the considered temperature interval, a slight increase of the LFP/C battery capacity with increasing temperature was measured, which might have been caused by the increased electronic and ionic conductivity in the electrode and electrolyte at high temperatures; similar results were reported in [17,39,40].

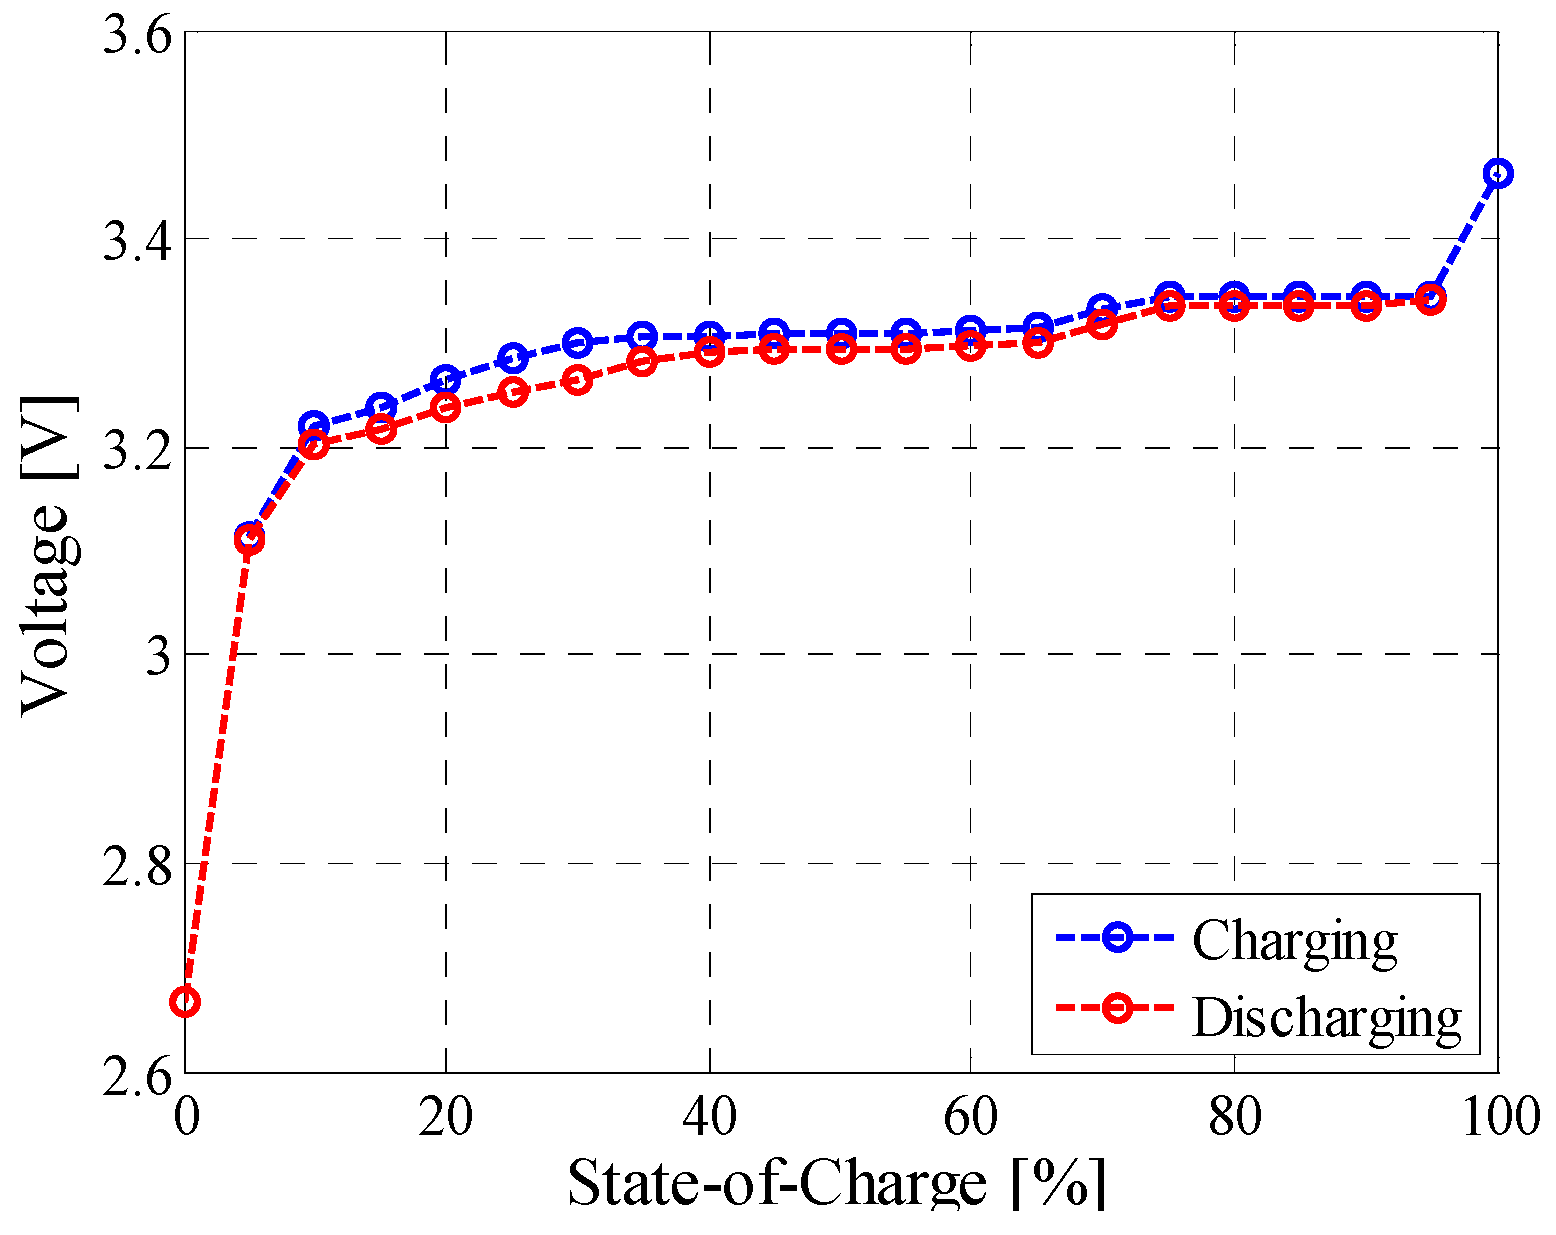
3.4. Open-Circuit Voltage versus State-of-Charge Test

Similar to most of the Li-ion battery parameters, the OCV is strongly dependent on the operating conditions (i.e., temperature, SOC, etc.). Therefore, the goal of this test was to measure the OCV-SOC characteristic of the LFP/C battery at different temperatures for both charging and discharging conditions; the OCV was measured in steps of 5% SOC following the methodology described in [21].
For instance, the OCV-SOC characteristic of the tested battery, measured at 25 °C, is presented in Figure 5. For the measured characteristic, a hysteresis effect is observed, which is more pronounced for the 10%–40% SOC interval. This behavior of the OCV is intrinsic for Li-ion batteries based on active materials, which perform a two-phase transition lithium insertion and extraction process, as is the case of the LFP material [41]. The hysteresis effect is mainly influenced by the previous history (e.g., charging/discharging C-rate and relaxation time) of the LFP/C battery and can be modelled following various approaches reported in literatures [42,43].

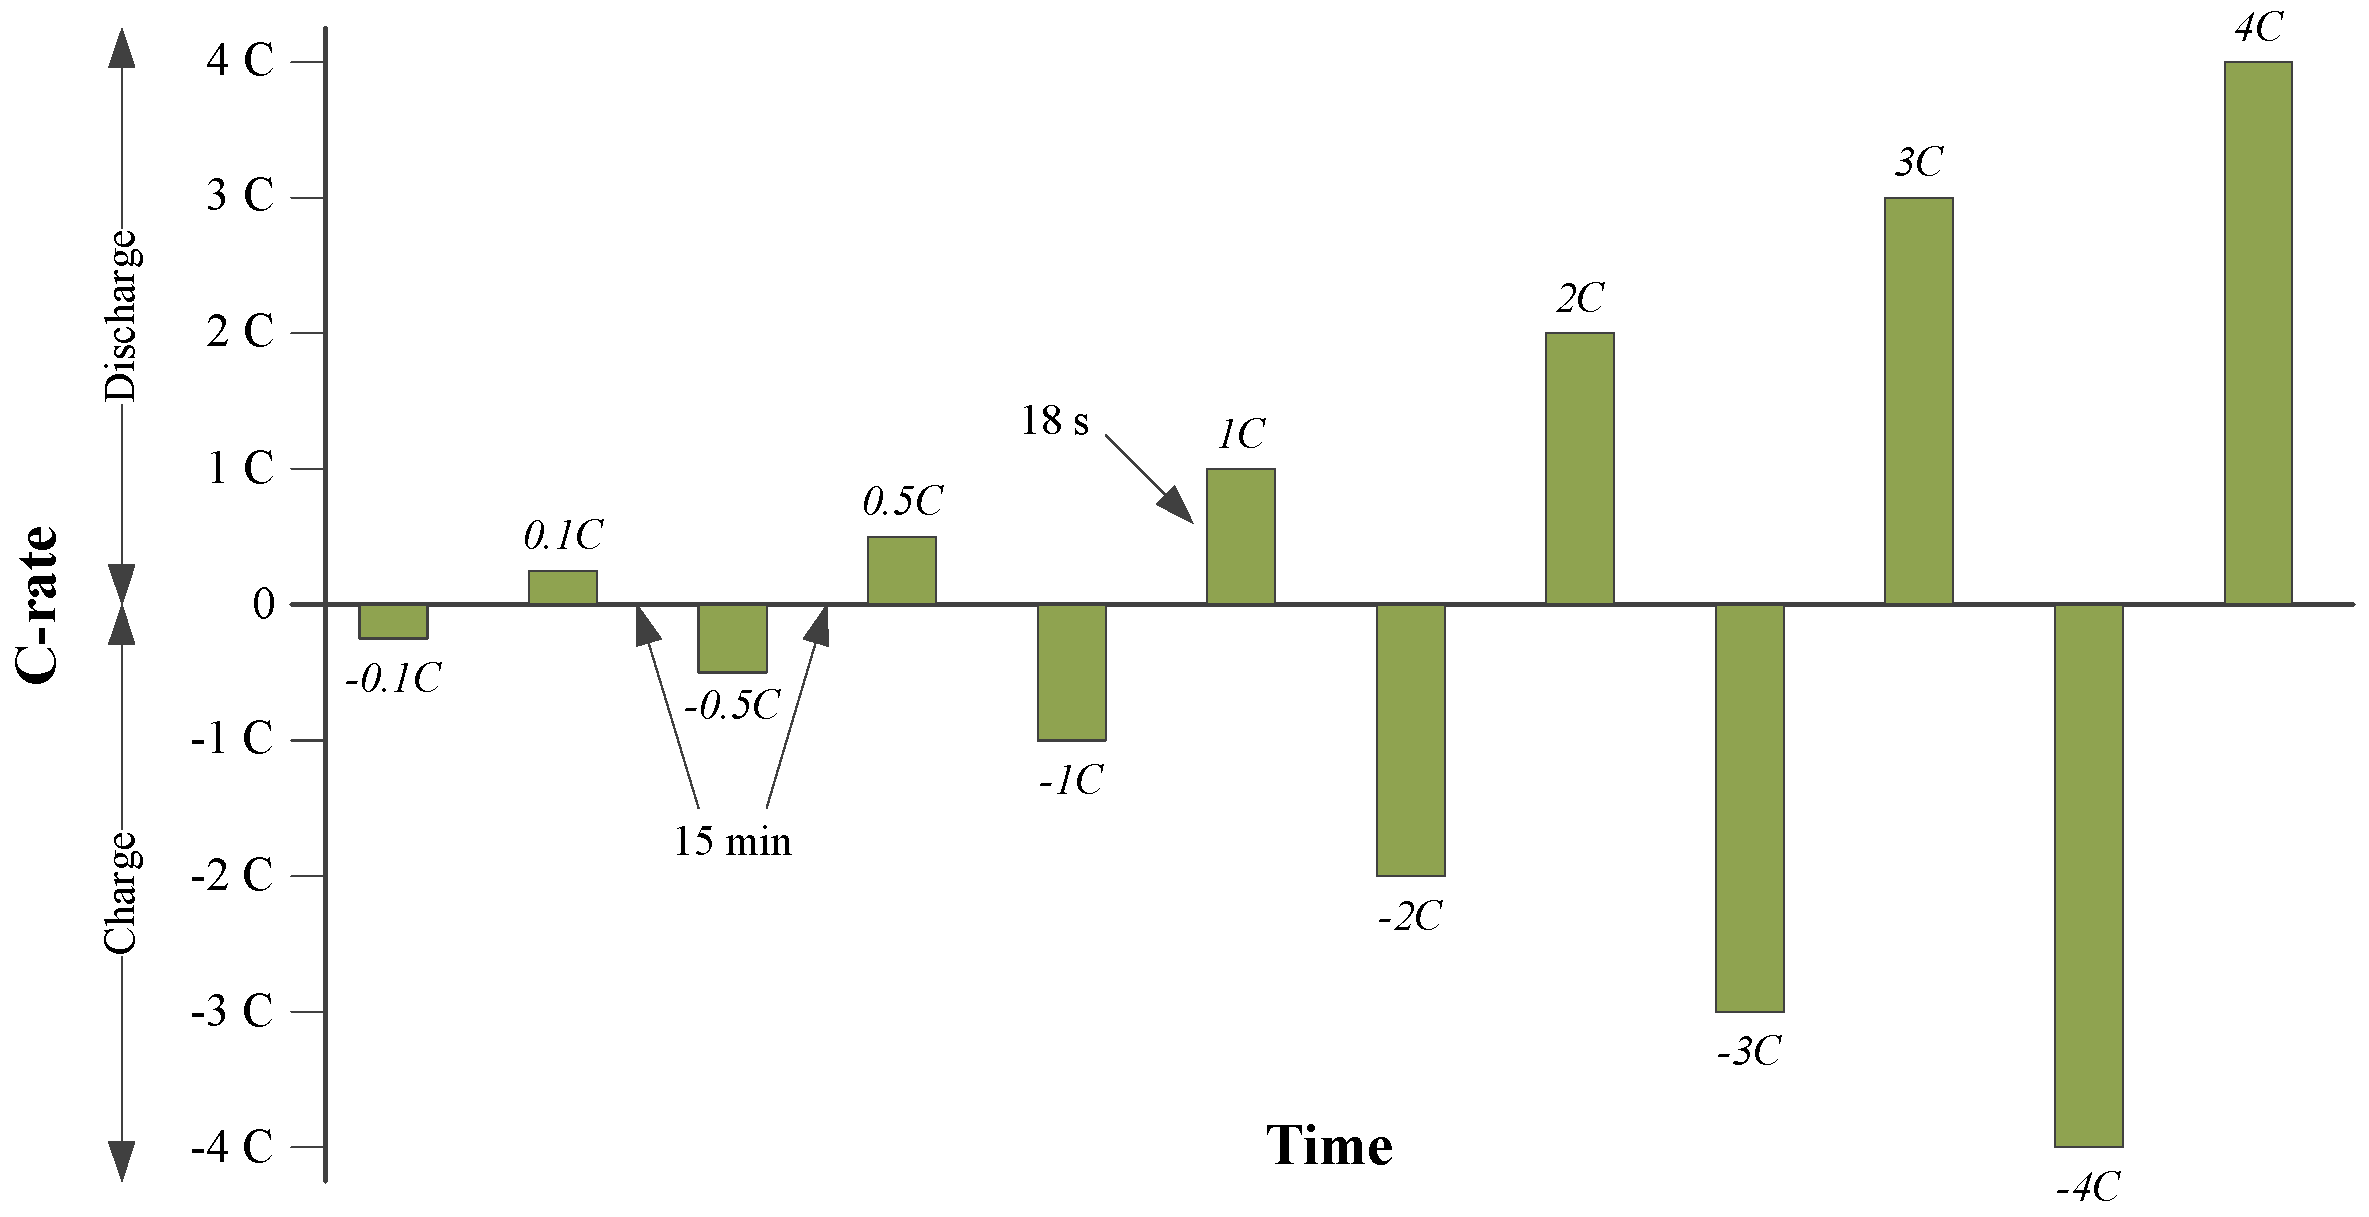
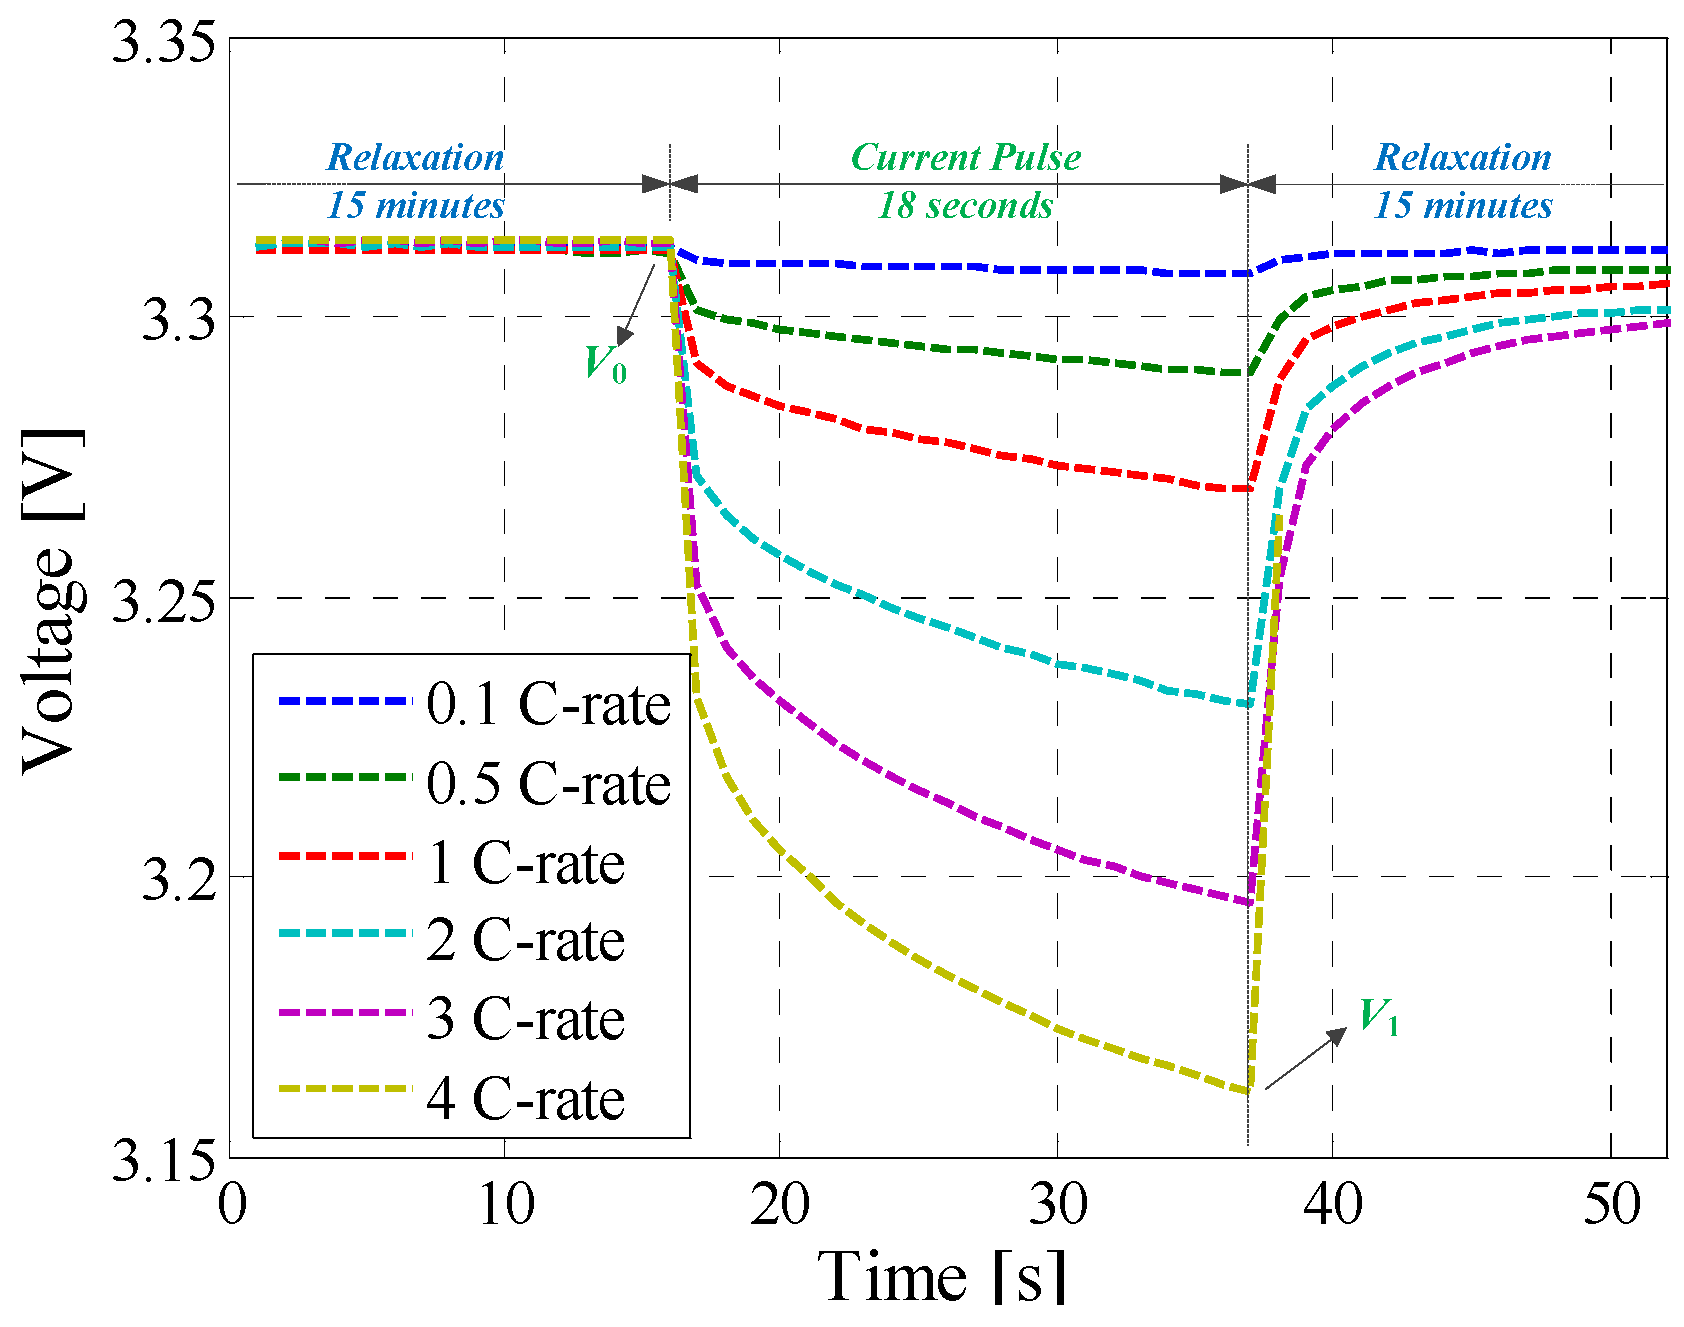
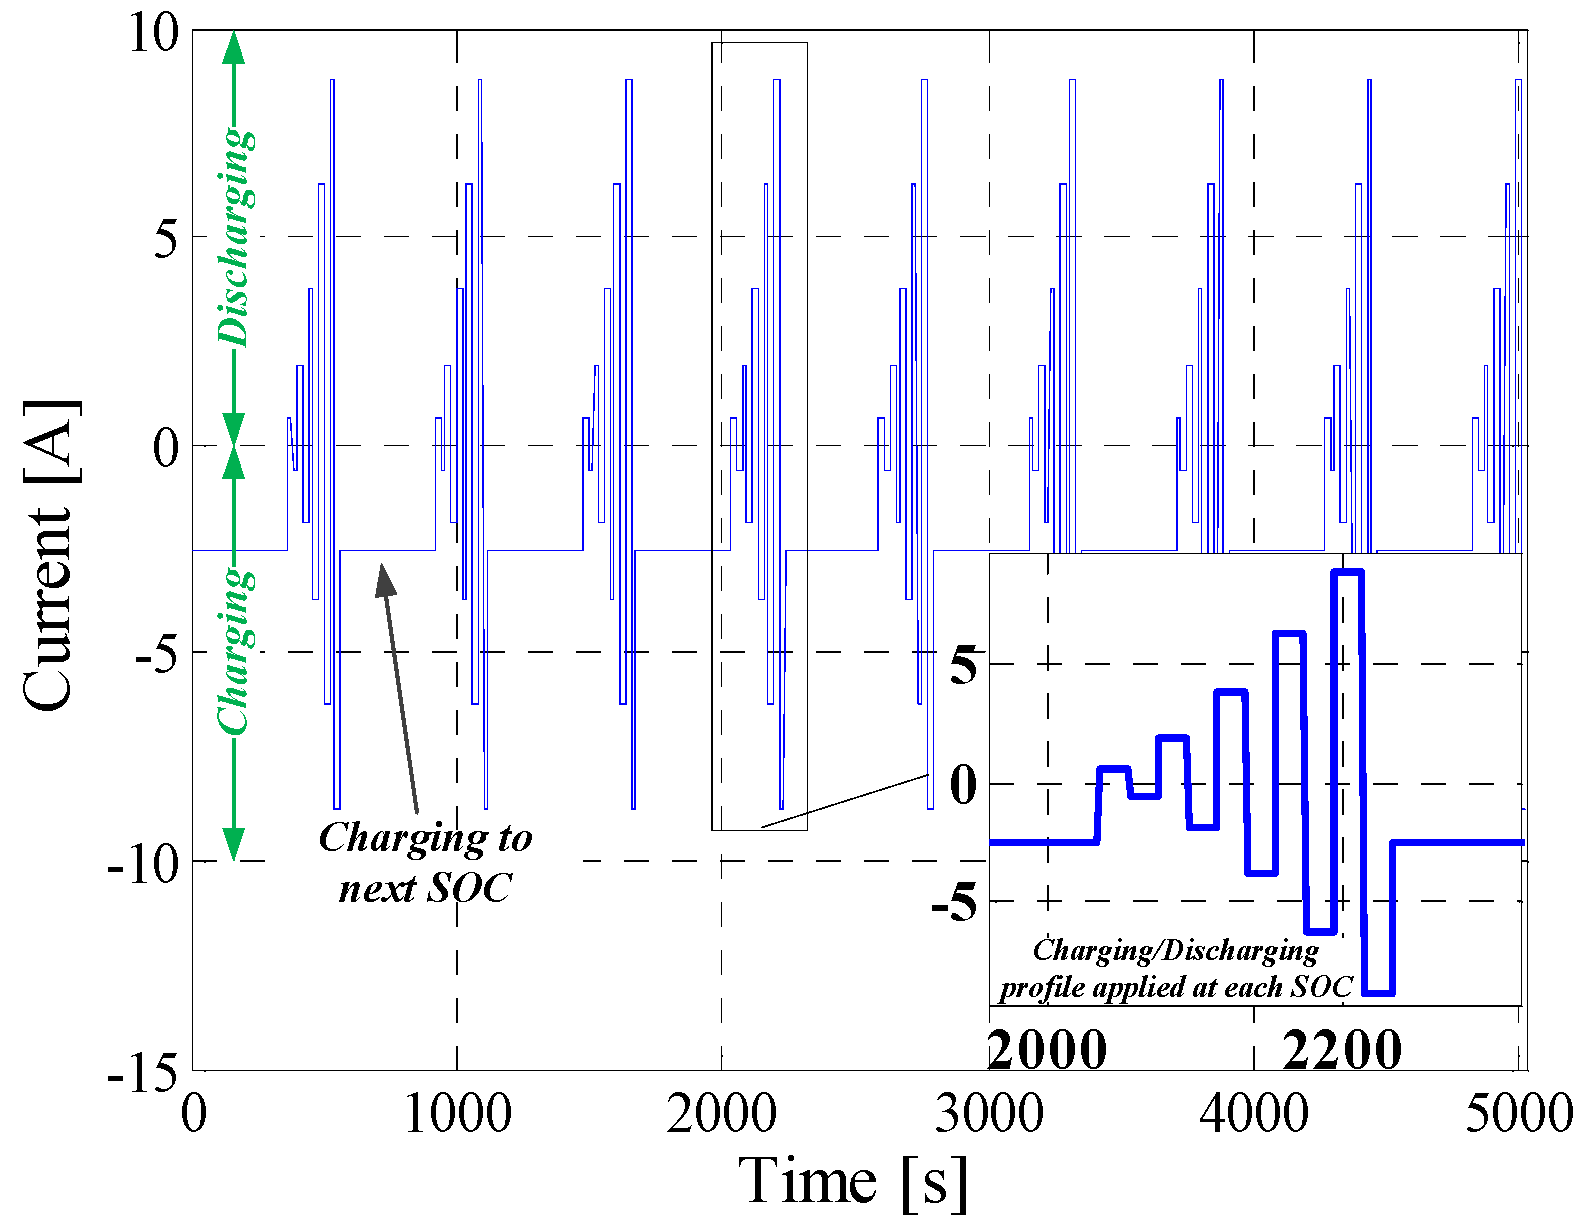
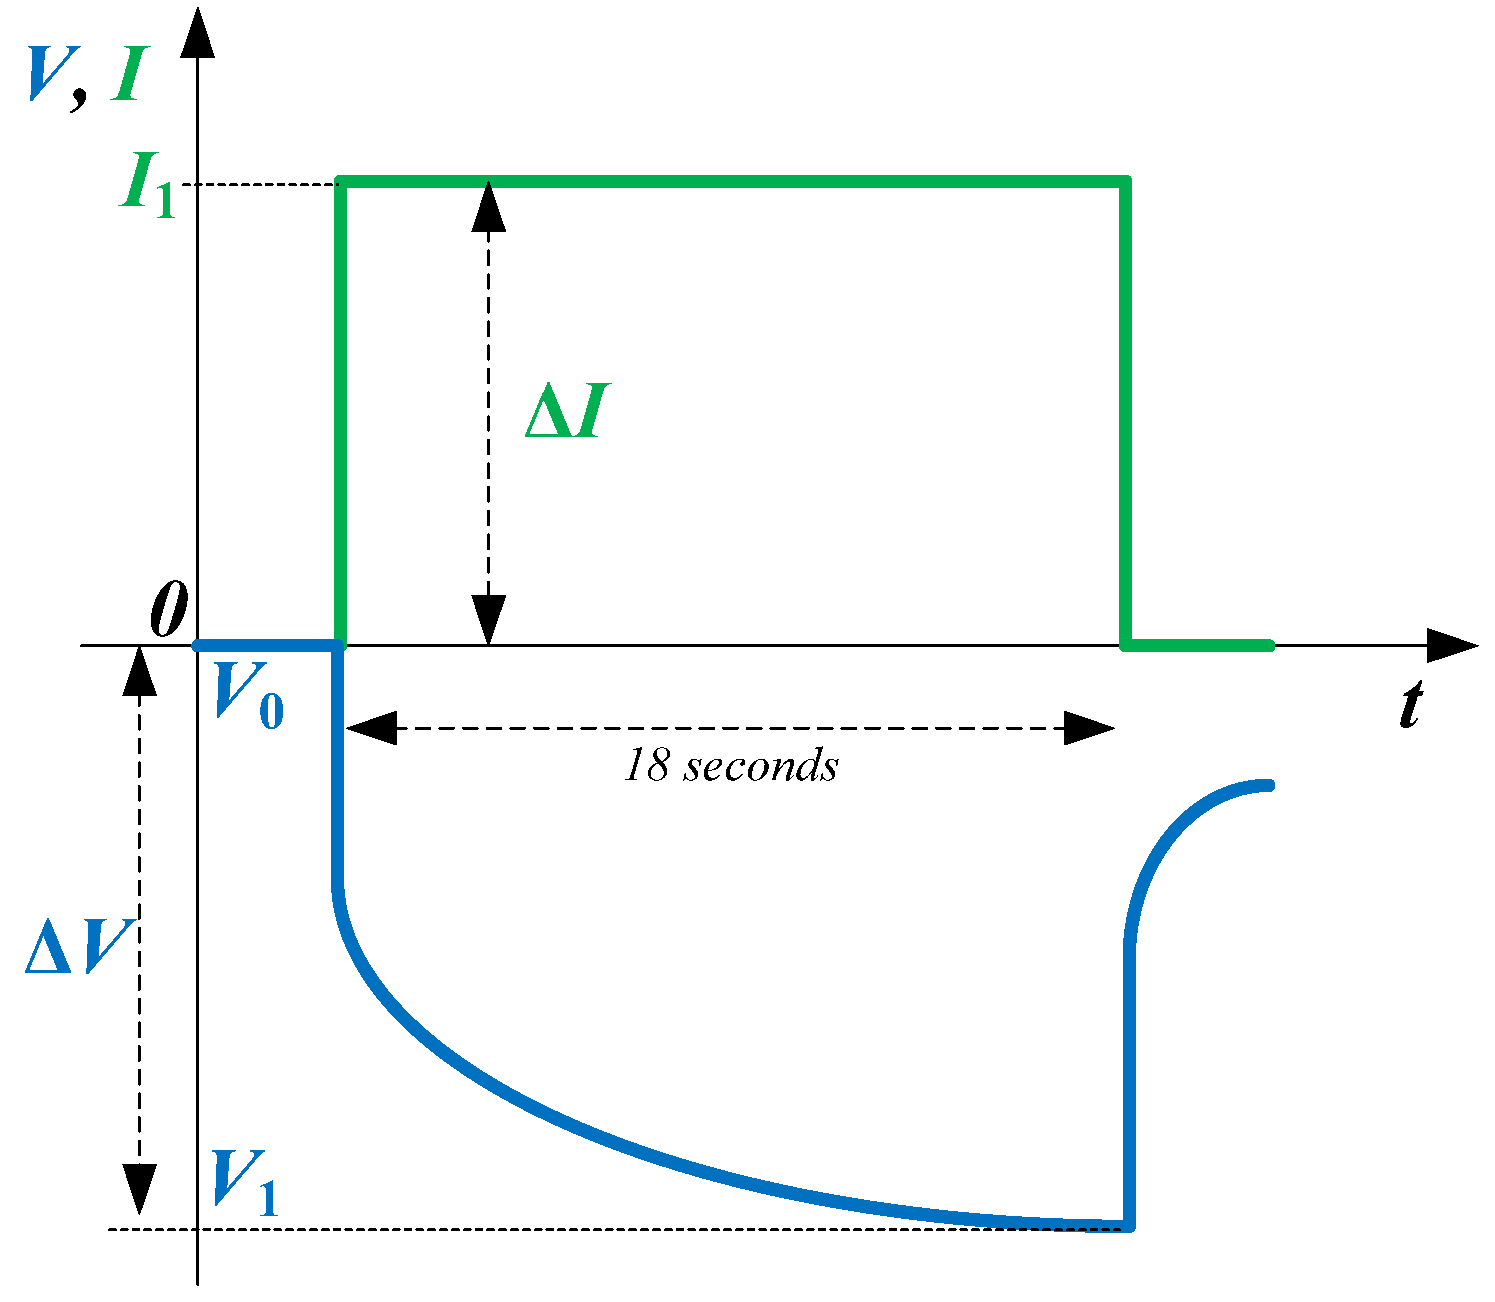
3.5. Hybrid Pulse Power Characterization Test

The impedance represents a very important performance parameter of the Li-ion batteries since it defines the power capability of the battery. Moreover, it is the parameter which describes the dynamic behavior of Li-ion batteries. As most of the Li-ion battery parameters, the impedance shows a non-linear behavior depending on the operating conditions such as SOC, temperature, C-rate [44,45]. Furthermore, the battery impedance is highly dependent on the battery’s state-of-health (SOH) [44]; however, this is out of the scope of the present work. In order to account for all the aforementioned dependences, the impedance of the LFP/C battery was measured following a modified version of the hybrid pulse power characterization (HPPC) test. The measurement profile applied to the LFP/C battery is presented in Figure 6 and consists of consecutive charging and discharging DC current pulses of different C-rates (i.e., 0.1C, 0.5C, 1C, 2C, 3C and 4C); the pulse duration was set to 18 s [34] and the relaxation time between each two consecutive pulses was set to 15 min.
Furthermore, in order to consider the dependence of the impedance on SOC and temperature, the test profile presented in Figure 6 was applied to the 5%–95% SOC interval (considering a 5% SOC resolution) and for the same temperatures (i.e., 15 °C, 25 °C, 35 °C and 45 °C) considered during measurement of the other performance parameters.
The typical voltage response of a Li-ion battery to a discharging current pulse is illustrated in Figure 7; a similar voltage behavior is obtained for a charging current pulse. As presented in the ISO 12405-1:2011 Standard [34], the charging and discharging impedance of the battery could be calculated for various pulse lengths (i.e., 0.1 s, 2 s and 18 s). Furthermore, the impedances corresponding to these pulse lengths are caused by/related to different electrochemical processes inside the battery [44]. Nevertheless, in this work, impedance values determined for a current length of 18 s are presented. Based on the current and voltage measurements, the impedance of the Li-ion battery is computed based on Ohm’s law, as:
R i = Δ V Δ I = V 1 V 0 I 1
where Ri represents the impedance of the battery, ∆V represents the change in the voltage due to the applied current pulse, ∆I represents the change in the current, V1 represents the voltage measured after 18 s, V0 represents the voltage measured just before applying the current pulse, and I1 represents the amplitude of the applied current pulse.
The voltage response of the LFP battery to the current profile measured at 50% SOC is illustrated in Figure 8.
Based on battery’s voltage response (similar to those presented in Figure 8), and considering Equation (2), the charging and discharging impedance of the tested LFP/C battery was determined for all the considered conditions; for example, Figure 9 presents the measured impedance of the LFP/C during pulse charging and discharging with 1C-rate (i.e., 2.5 A) at T = 25 °C. Both impedance characteristics are showing a parabolic dependence on the SOC, following a nearly flat region between 20% and 90% SOC.

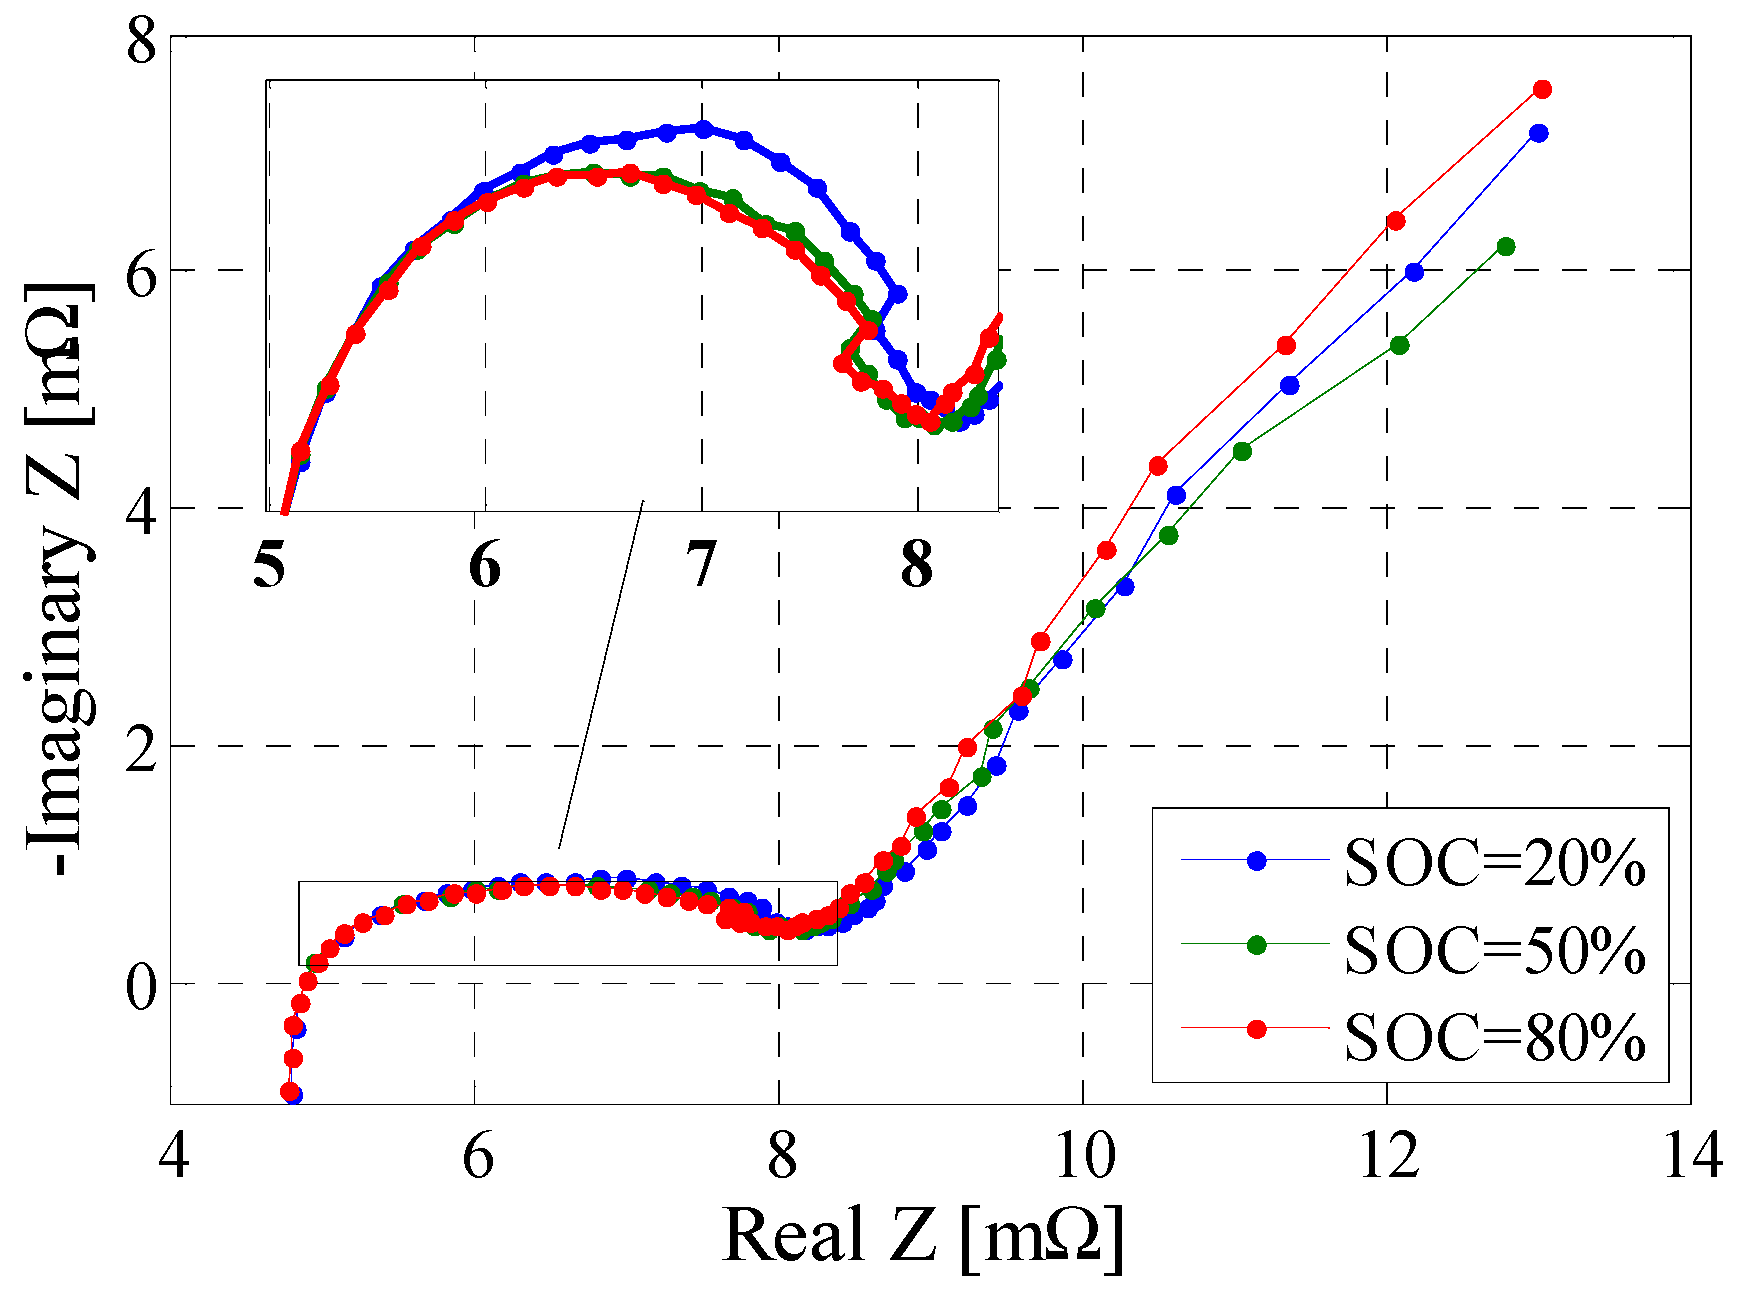
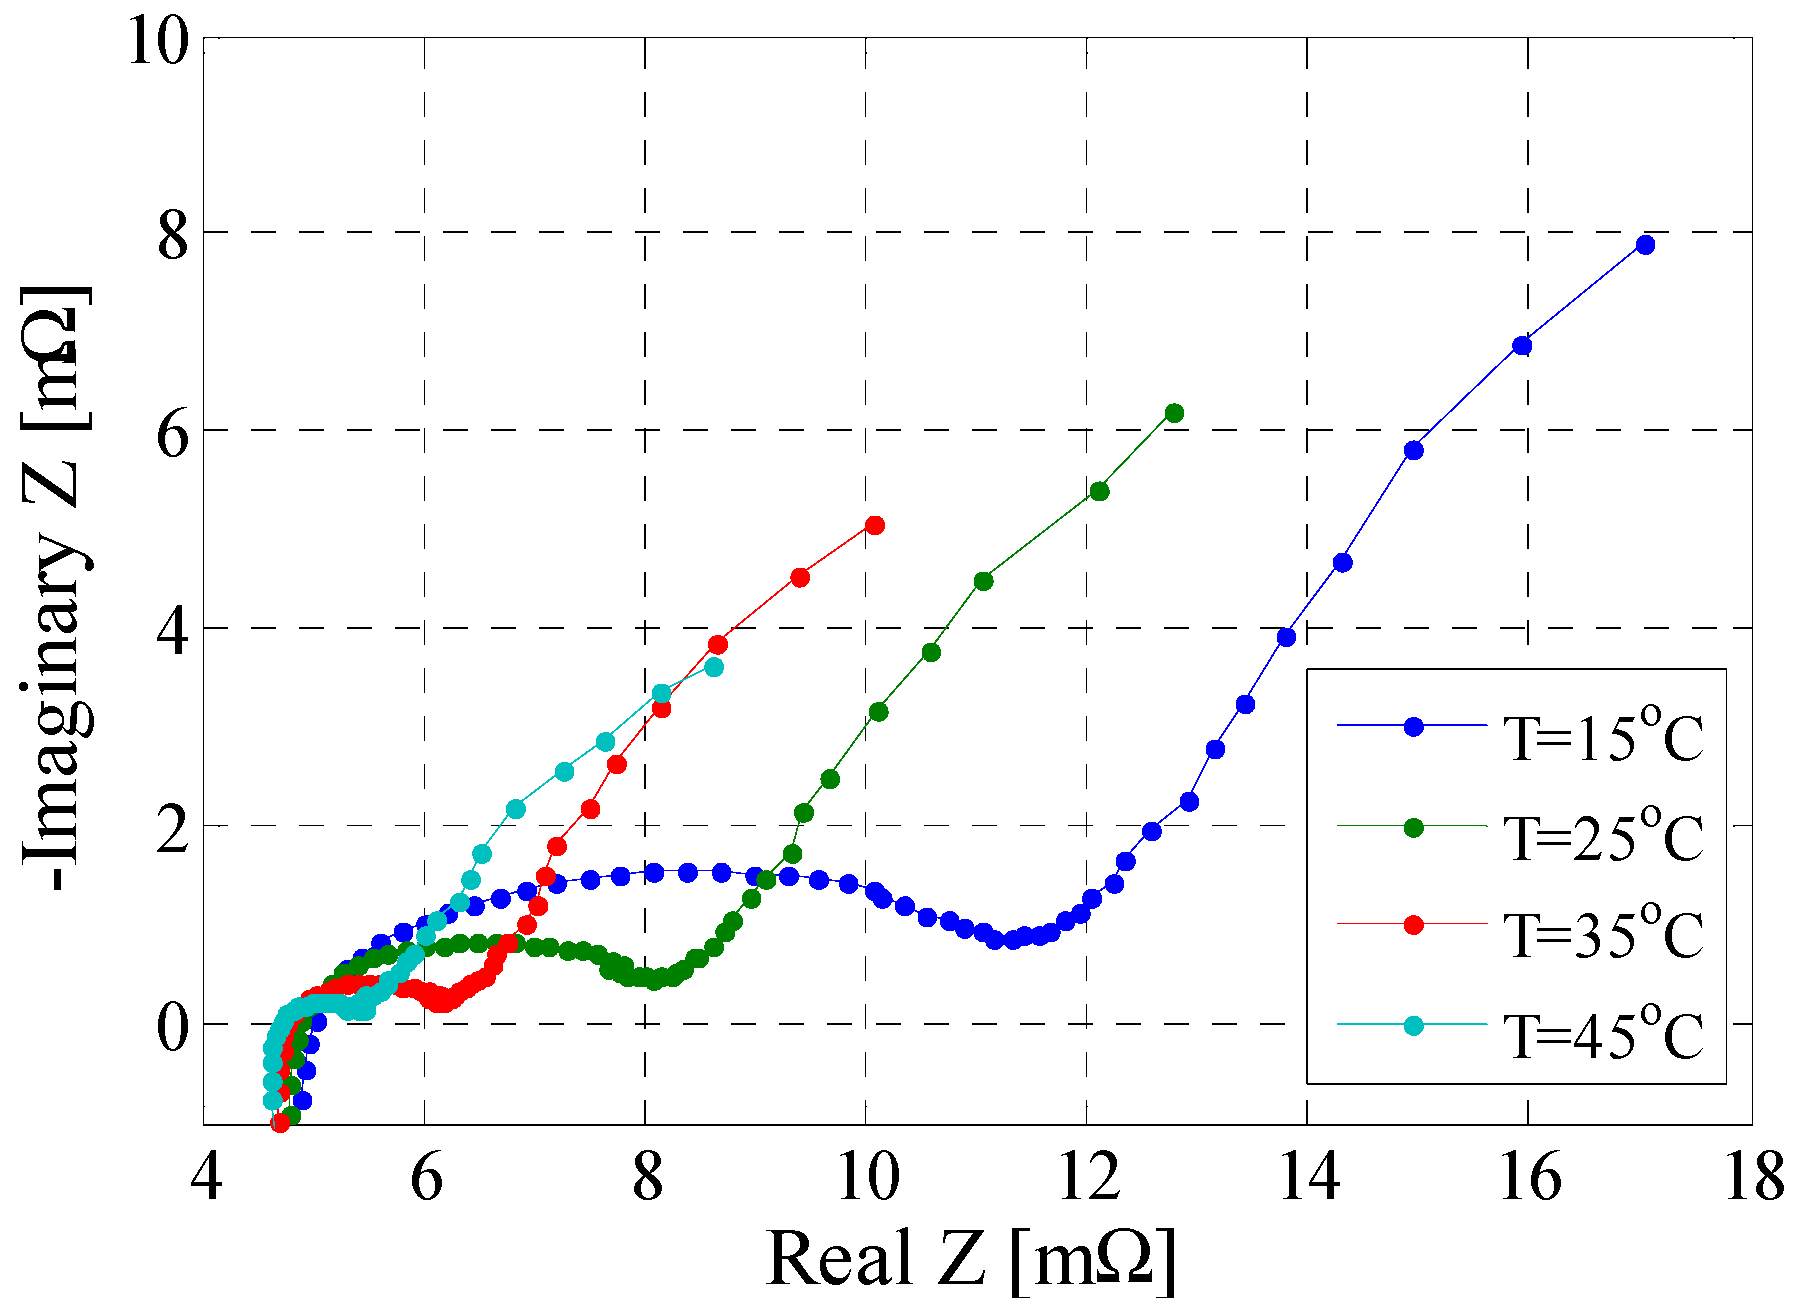
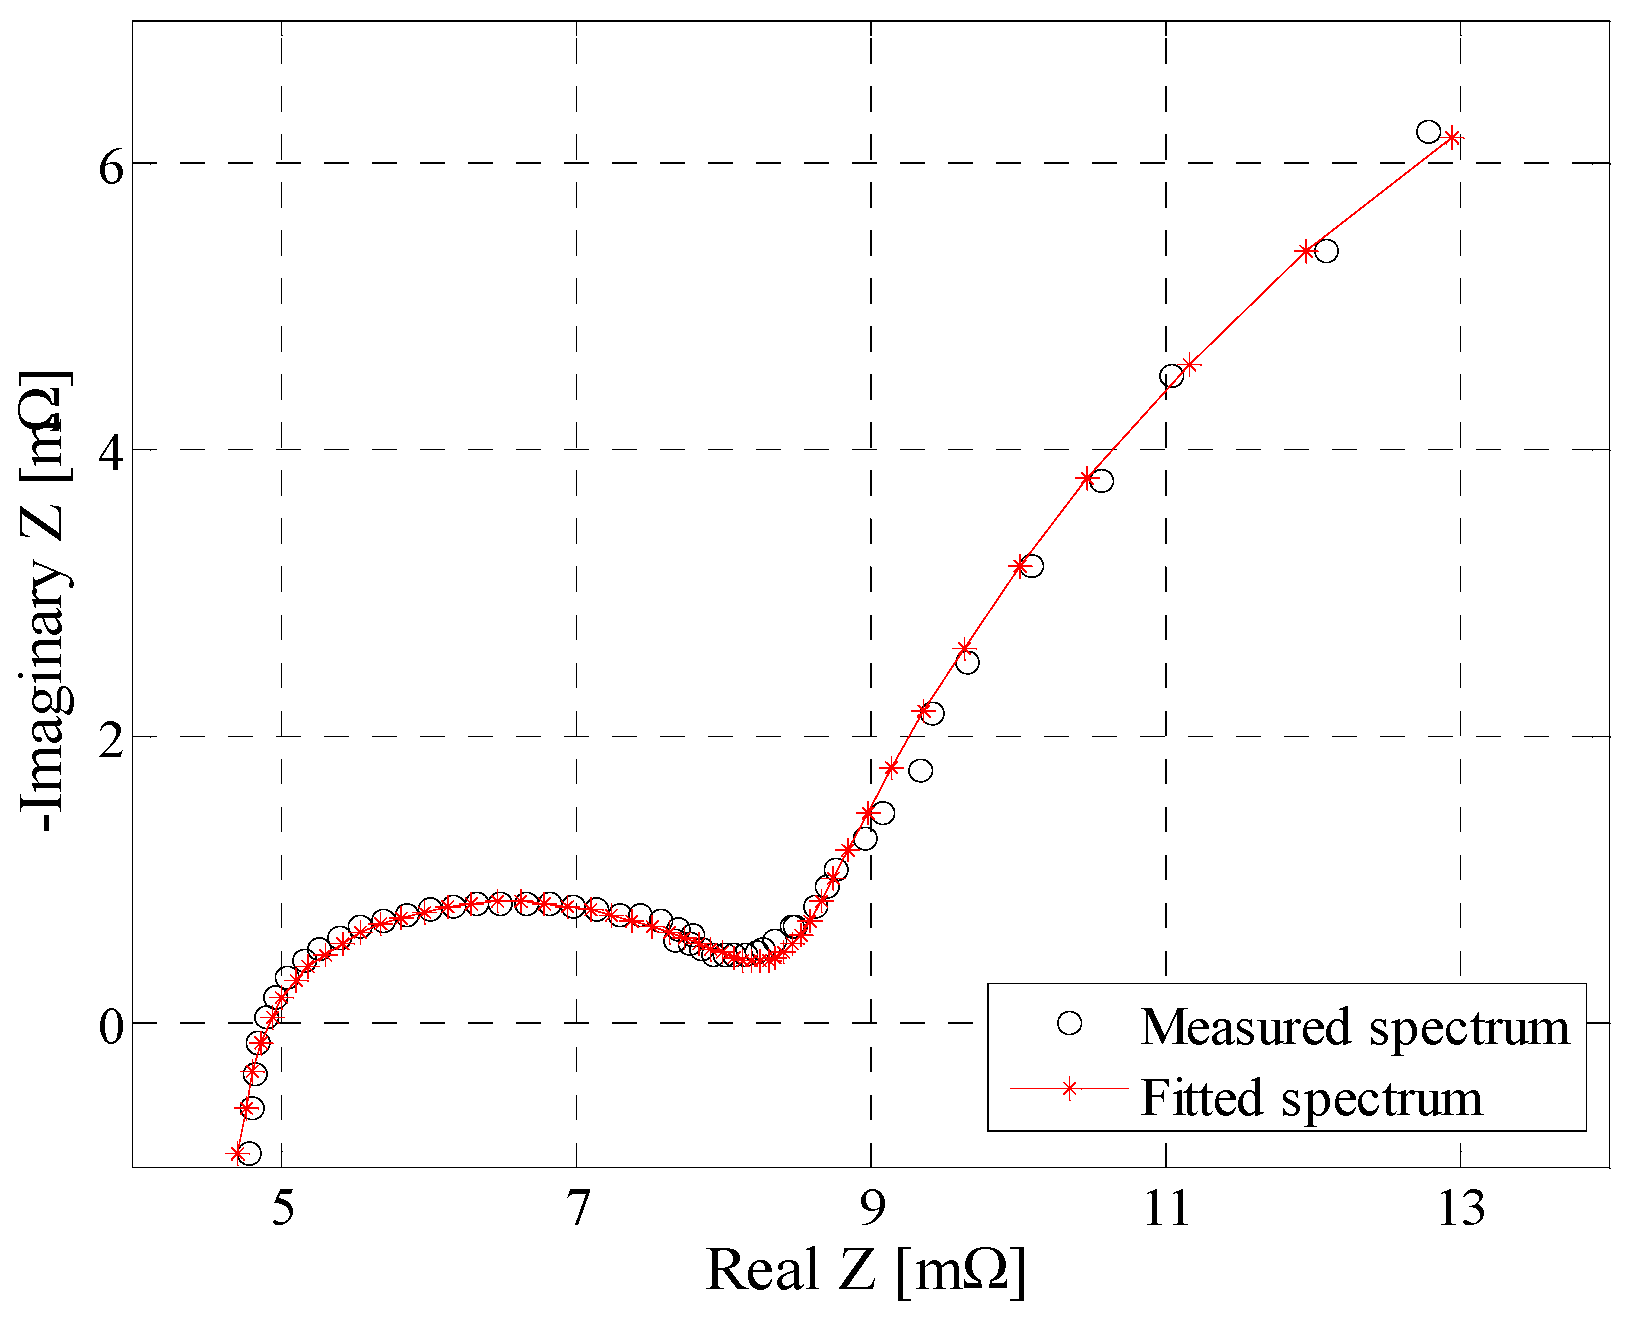
3.6. Electrochemical Impedance Spectroscopy Test

EIS has developed as a reliable method for characterization and modelling the performance behavior of the Li-ion batteries. The small-signal impedance of the Li-ion batteries is determined by applying a small sinusoidal current (galavantostatic mode) or voltage (potentiostatic mode) and measuring the amplitude and phase shift of the output voltage or current, respectively. This procedure is repeated for a sweep of frequencies, and thus the battery impedance spectrum is obtained.
In this work, the EIS measurements were performed in galvanostatic mode and for the frequency range 10 kHz–10 mHz. Furthermore, all the EIS measurements were performed without superimposed DC current; thus, the influence of the current on the small-signal AC impedance was not determined. As for the other considered performance parameters, the small-signal impedance was measured at different temperatures and for the entire SOC interval (0%–100% SOC with 5% SOC resolution). The dependence of the LFP/C battery’s impedance spectra on the SOC and temperature is presented in Figure 10 and Figure 11, respectively.

4. Lithium-Ion Battery Performance Model

Li-ion battery performance models can be classified into three main categories: electrochemical, electrical, and mathematical models, depending on the development and parameterization approach. These modelling approaches are characterized by different degrees of complexity, different accuracy levels and could be used for different purposes (e.g., battery design, system simulation). Nevertheless, this work has focused on the development and parameterization of the LFP/C battery performance model using an electrical modelling approach.

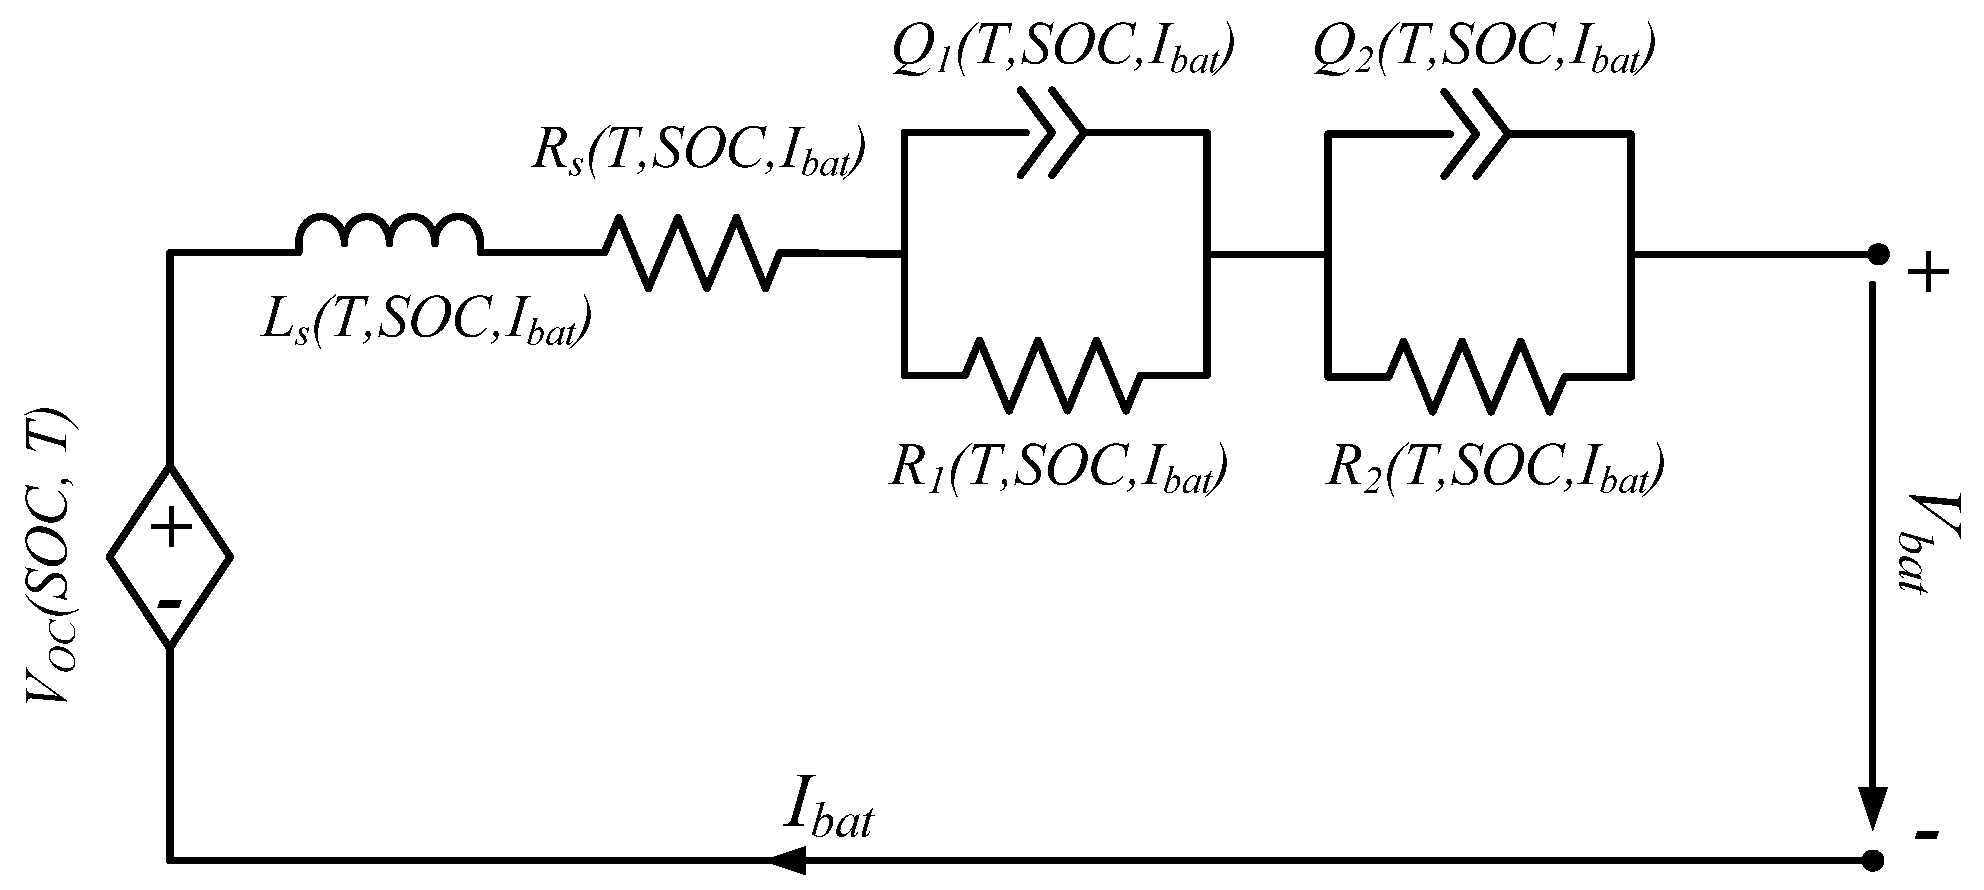
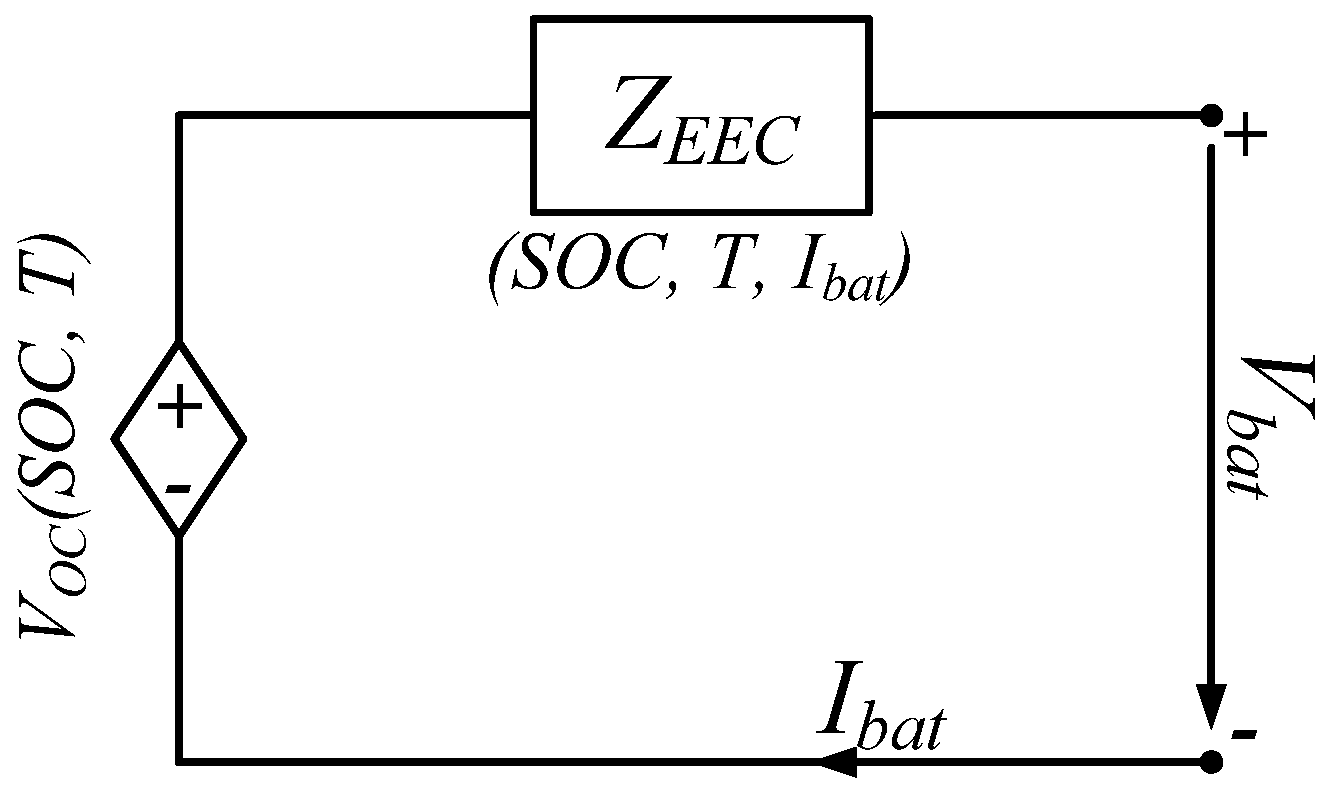
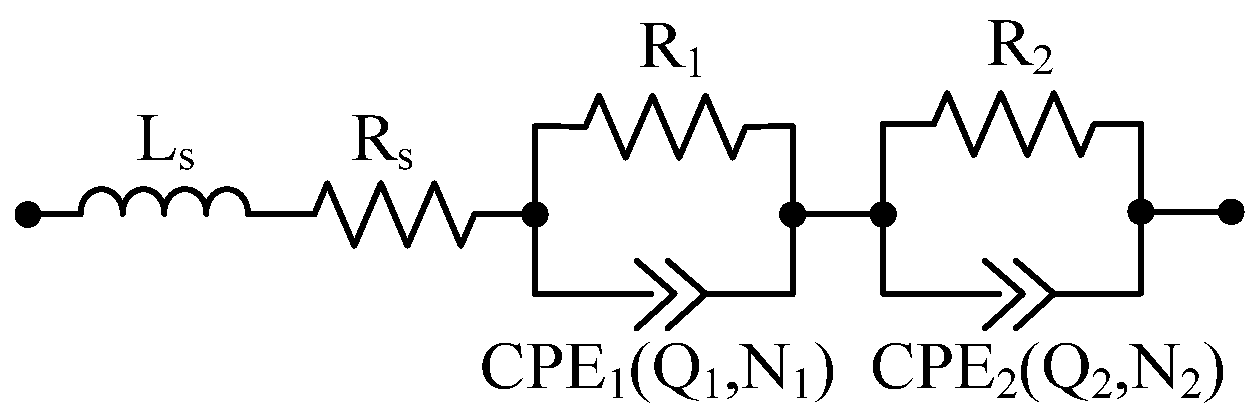
4.1. Equivalent Electrical Circuit Model

Li-ion batteries’ electrical models generally use EECs, composed of simple (e.g., resistors, capacitors, inductors) or more complex elements (e.g., constant phase elements, Warburg elements, etc.) and a voltage source to express the dynamic behavior of batteries. The basic configuration of an EEC-based performance model is presented in Figure 12. The structure of the EEC can have different configurations depending on various aspects, such as: model accuracy, model computation time, Li-ion battery chemistry, etc.
According to the configuration shown in Figure 12, the voltage of the battery is computed according to Equation (3).
V bat = V OC ± V EEC
where Vbat represents the voltage of the battery, VOC represents the OCV, and VEEC represents the voltage drop across the EEC, which is used to model the dynamics of the battery.
The voltage drop across EEC’s impedance is obtained as the sum of various over-voltages, which are caused by different processes occurring inside the battery with different time constants during charging or discharging [46]:
V EEC = V ohmic ± V chtr ± V diff
where Vohmic represents the ohmic over-voltage (caused by the resistance of the poles, current collectors, electrolytes, etc.), Vchtr represents the charge transfer over-voltage (caused by electrochemical reaction at inner surfaces), and Vdiff represents the diffusion over-voltage (caused by a deficit or surplus of reactants at the reaction’s location).
Thus, to model the voltage behavior of the LFP/C battery, the contributions of the VOC and of the VEEC components have to be known. The contribution of the OCV to the battery voltage was obtained for various conditions (i.e., SOCs and temperatures) during the battery characterization, as presented in Section 3.4. To obtain the contribution of the VEEC to the LFP/C battery voltage, the EEC had to be parameterized.
The parameterization of the EEC was realized by curve fitting the impedance spectra of the LFP/C battery, which were measured at different conditions as presented in Section 3.6. The configuration of the EEC which was used for curve fitting, and consequently to express the dynamics of the LFP/C battery, is illustrated in Figure 13. The curve fitting procedure was based on a complex non-linear least-square (CNLS) algorithm, where both real and imaginary components of the measured impedance were fitted simultaneously using a least square minimization; an example of the impedance spectrum curve fitting results is shown in Figure 14.
As presented in Figure 14, the EEC configuration based on a series inductance Ls, a series resistance Rs, and two ZARC elements (i.e., parallel connections of a resistor and a constant phase element) was able to accurately fit the measured impedance spectrum of the tested LFP/C battery. Therefore, this EEC configuration was used to fit all the measured impedance spectra (at the conditions discussed in Section 3.6) and thus to model the performance behavior of the LFP/C battery. The impedance of the selected EEC is given by:
Z EEC = j ω L s + R s + R 1 1 + ( j ω ) N 1 Q 1 R 1 + R 2 1 + ( j ω ) N 2 Q 2 R 2
where R1, Q1, and N1 represent the resistance, the generalized capacitance and the depression factor of the first ZARC element, respectively; the same explanations are valid for the second ZARC of the EEC.
A main advantage of the EIS technique over other parameterization techniques is represented by its feature to relate EEC elements to the physicochemical process that occur inside the battery [28,30]. Thus, in the present work, the first term in Equation (5) is used to describe the inductive behavior at high frequencies, the second term is used to calculate the over-voltage caused by the ohmic resistance (Vohmic), the third term is used to calculate the over-voltage corresponding to the charge-transfer process (Vchtr), while the last term is used to determine the over-voltage corresponding to the diffusion process (Vdiff). Consequently, based on the aforementioned aspects, the battery voltage Equation (3) was rewritten as given in Equation (6). Furthermore, considering Equation (6), the configuration of the EEC, which was used to model the performance behavior of the LFP/C battery, is presented in Figure 15.
V bat = V OC + I bat ( j ω L s + R s + R 1 1 + ( j ω ) N 1 Q 1 R 1 + R 2 1 + ( j ω ) N 2 Q 2 R 2 )

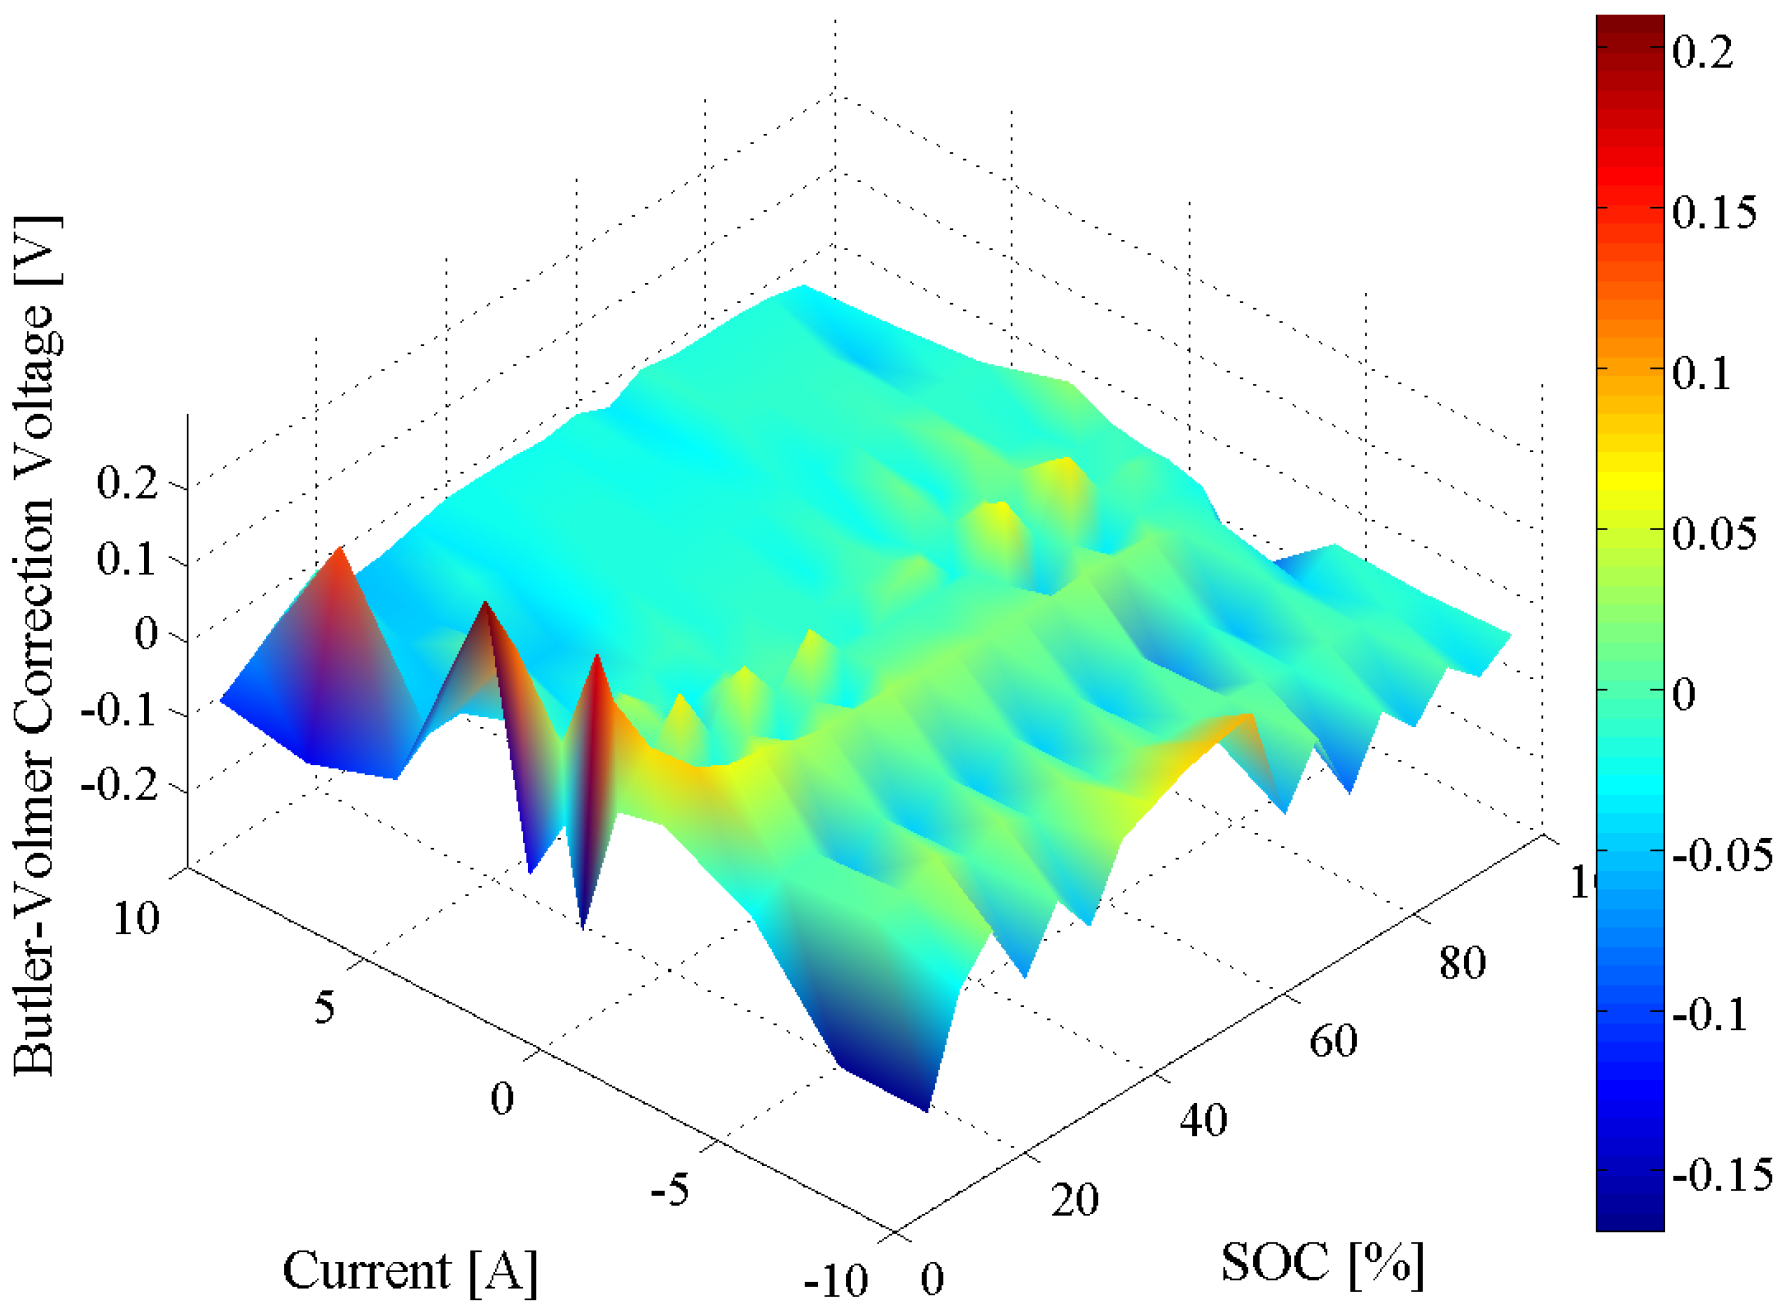
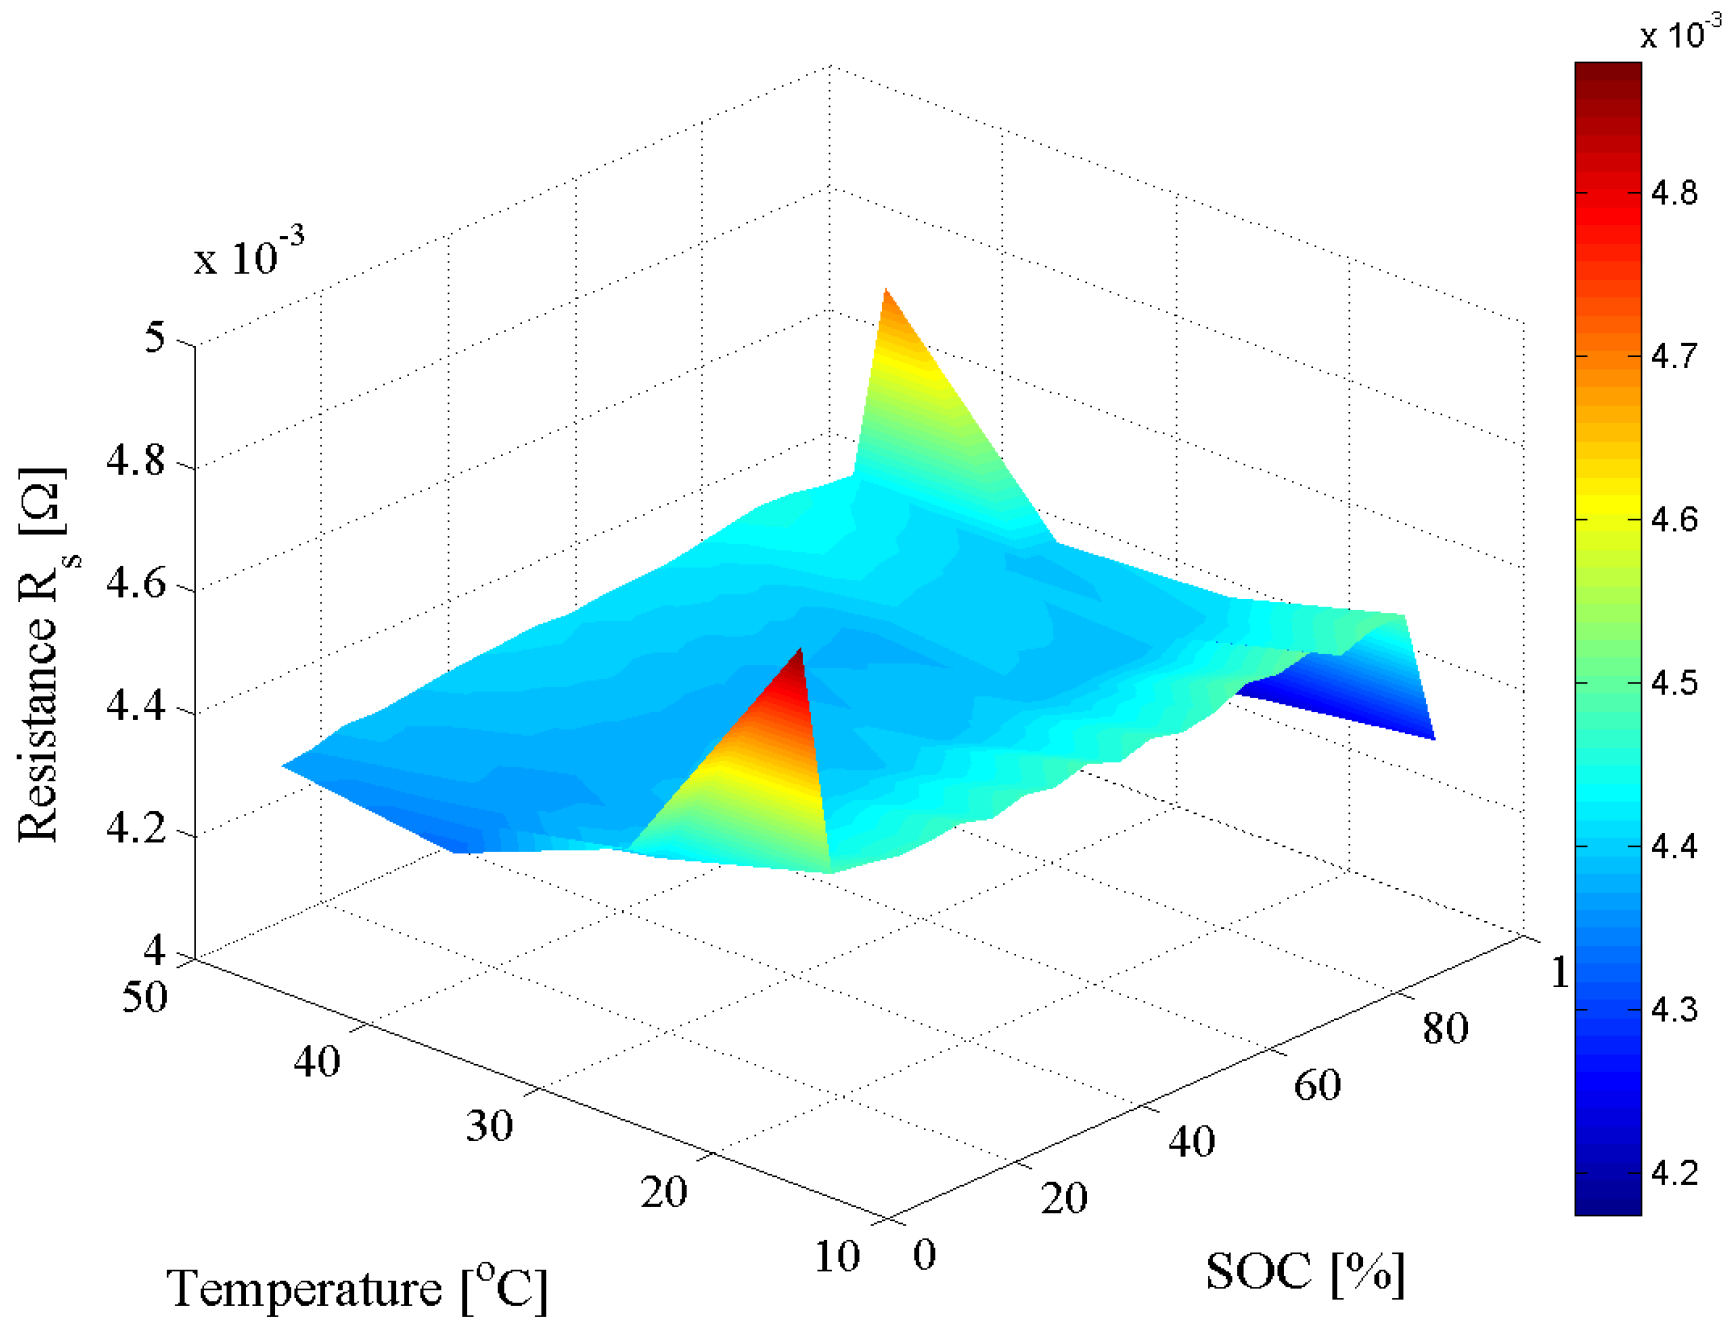
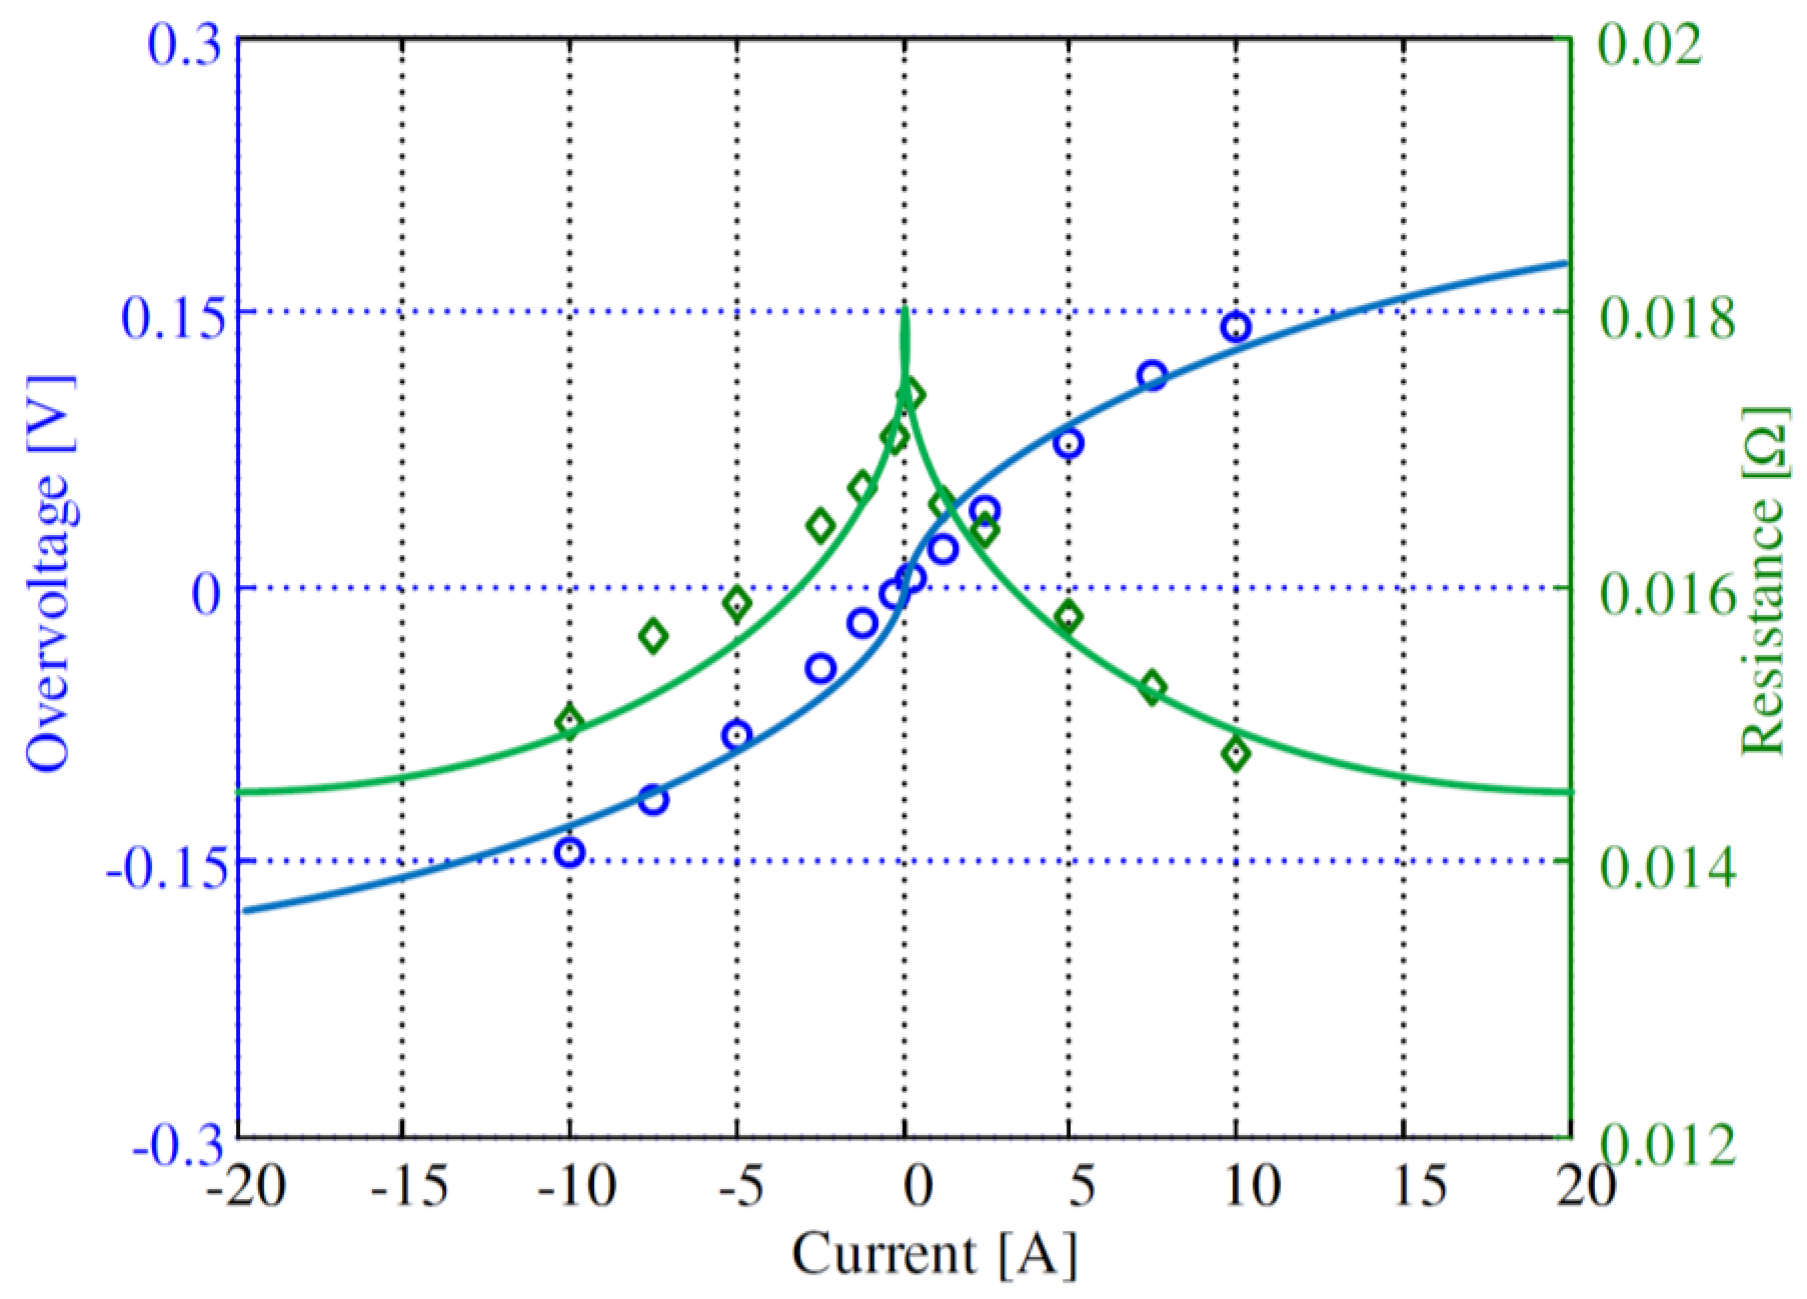
4.2. Dependence on Load Current

Besides being dependent on SOC and temperature—dependences obtained from the EIS measurements (see Section 3.6)—the parameters of the EEC are also dependent on the load current as illustrated in Figure 15. Nevertheless, because all the EIS measurements were performed without superimposed DC current (see Section 3.6), the effect of the load current on the parameters of the EEC was not determined. Among the parameters of the EEC, the charge transfer resistance R1 shows a highly non-linear dependence on the load current. This non-linear dependence of the charge-transfer resistance, and of the corresponding over-voltage, on the LFP/C battery current is presented in Figure 16.
Theoretically, the exponential dependence between the Li-ion battery current and the potential can be determined from the Butler-Volmer equation given in Equation (7) [47].
i = i 0 ( e α n F R T η e ( 1 α ) n F R T η )
where i is the electrode current density, i0 is the exchange current density, α is the symmetry factor, n is the number of electrons, R is the universal gas constant (8.3144 J·K−1·mol−1), F is the Faraday constant (96,485.339 C·mol−1), η is the overpotential (i.e., the difference between the electrode potential and equilibrium potential).
However, information about various parameters given in Equation (7) were not available and require specialized laboratory equipment in order to determine them. Consequently, in order to determine the dependence of the LFP/C battery voltage on the load current, the following approach was followed: a comparison was performed between the battery voltage response measured over a period of 18 s in the laboratory (during the HPPC tests—see Section 3.5) and the simulated voltage response. The obtained difference was considered to describe the impact of the current on the voltage of the LFP/C battery. The aforementioned procedure was repeated for all SOCs, temperatures, and C-rates, which were considered during the battery impedance measurement by HPPC test. The obtained voltage correction factors, assigned to the effect of the current on the LFP/C battery voltage were stored as a 3D look-up table; for instance, Figure 17 presents the look-up table implementation of the voltage correction factors for the 25 °C dimension.

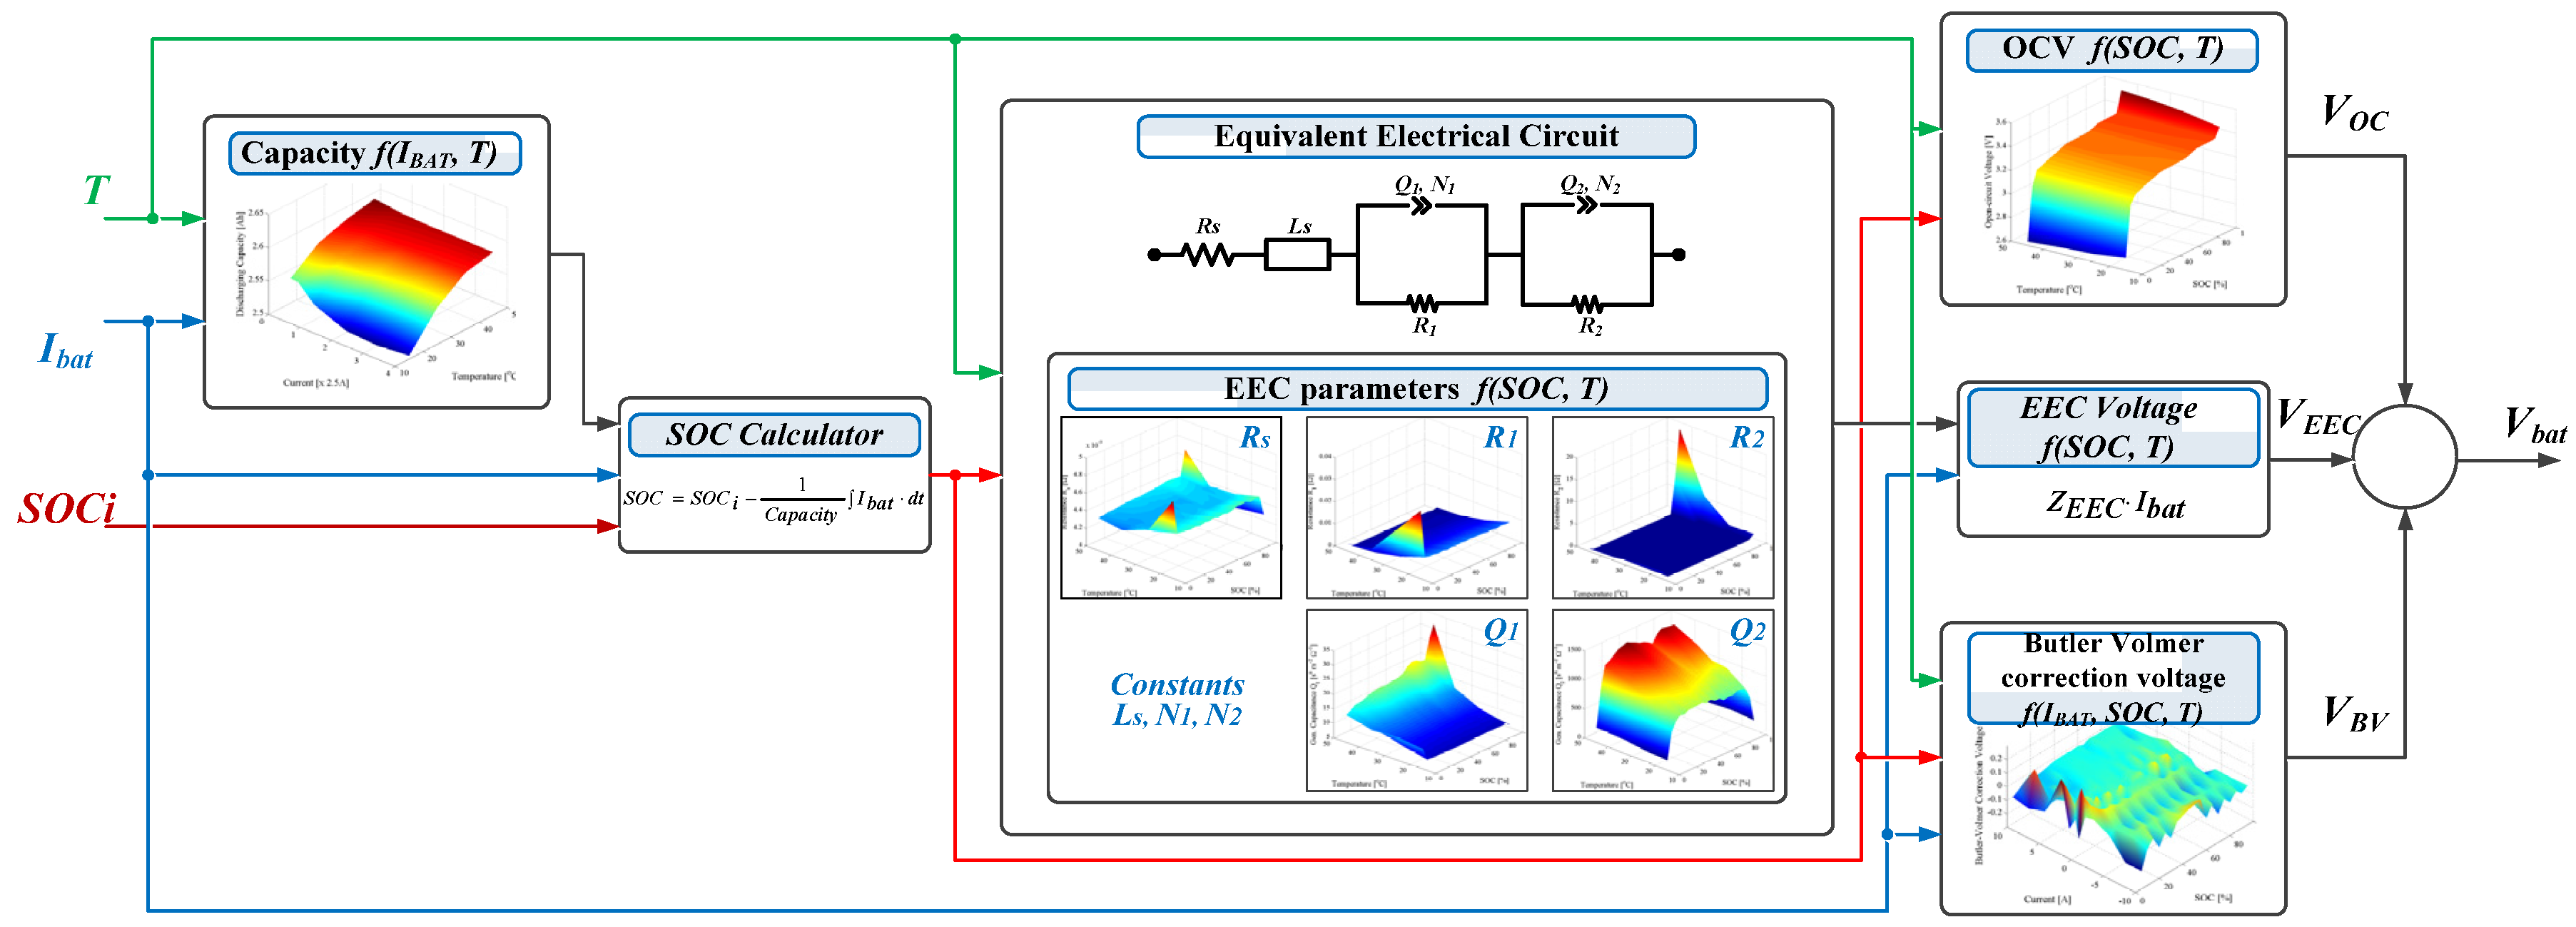
4.3. Model Implementation

Based on the voltage Equation (6) and considering the dependences of the performance parameters on the operating conditions, the performance model of the LFP/C battery was implemented according to the block diagram proposed in Figure 18.
The inputs of the proposed performance model for the LFP/C battery are the applied load current, the initial SOC and the temperature, while the output of the model is the estimated battery voltage; additionally, the model can return information about the battery SOC at every moment. Furthermore, since no thermal model was developed for the LFP/C battery, the temperature of the battery is considered constant during the whole simulation.
The parameterization of the proposed performance model was performed based on the results obtained from the characterization test, which was presented in detail in Section 3. The parameters of the LFP/C battery were implemented as 2D look-up tables (i.e., capacity, OCV, EEC’s parameters) and 3D-look-up table (i.e., Butler-Volmer correction voltage) in order to consider their dependences on the operating conditions (i.e., SOC, temperature, and load current). Because for similar operating conditions, the capacity of the Li-ion batteries is different between charging and discharging case (i.e., Coulombic efficiency different than 100%), two separate look-up tables were implemented for the charging and discharging capacity, respectively. Because of the hysteresis effect (see Figure 5), which is inherent to LFP/C battery chemistry, a similar approach was followed for implementing the OCV characteristic; however, for other Li-ion battery chemistries, a single look-up table is enough to model the OCV characteristic for both charging and discharging cases.
During the fitting process of the measured impedance spectra, it was found out that only Rs, R1, R2, Q1, and Q2 are dependent on the SOC and temperature at which the EIS measurements had been performed. Consequently, these parameters were implemented into the performance model as 2D look-up tables since their values are dependent on the SOC and temperature; Figure 19 exemplifies the look-up table implementation of the series resistance Rs. The other parameters of the EEC, Ls, N1, and N2 were found to be constant, independent of the operating conditions: Ls = 1.8 × 10⁻⁸ H, N1 = 0.5, and N2 = 0.8.
Finally, the estimated voltage of the LFP/C battery was obtained by summing up the contributions from the OCV, the voltage drop across the EEC, and the Butler-Volmer correction voltage, as illustrated in Figure 18.

5. Validation of the Performance Model

In order to verify the accuracy of the developed performance model of the LFP/C battery and to validate the proposed characterization procedure, different load current profiles were considered. The accuracy of the developed performance model was evaluated by computing the coefficient of determination R2 which was obtained by comparing the measured and estimated battery’s voltage profiles, according to Equation (8).
R 2 = 1 x = 1 n ( V model ( x ) V meas ( x ) ) 2 x = 1 n ( V model ( x ) V meas ¯ ) 2
where Vmodel is the estimated battery voltage, Vmeas represents the measured battery voltage, x represents the present observation, and n represents the total number of observations.
Moreover, the mean ( ε ¯ ) and the maximum (εmax) deviation between the measured and estimated battery voltage profiles were computed according to Equations (9) and (10) for the three considered verification cases.
| ε ¯ | = | V meas ( x ) V model ( x ) | ¯
ε max = max ( 100 | V meas ( x ) V model ( x ) | V meas ( x ) )

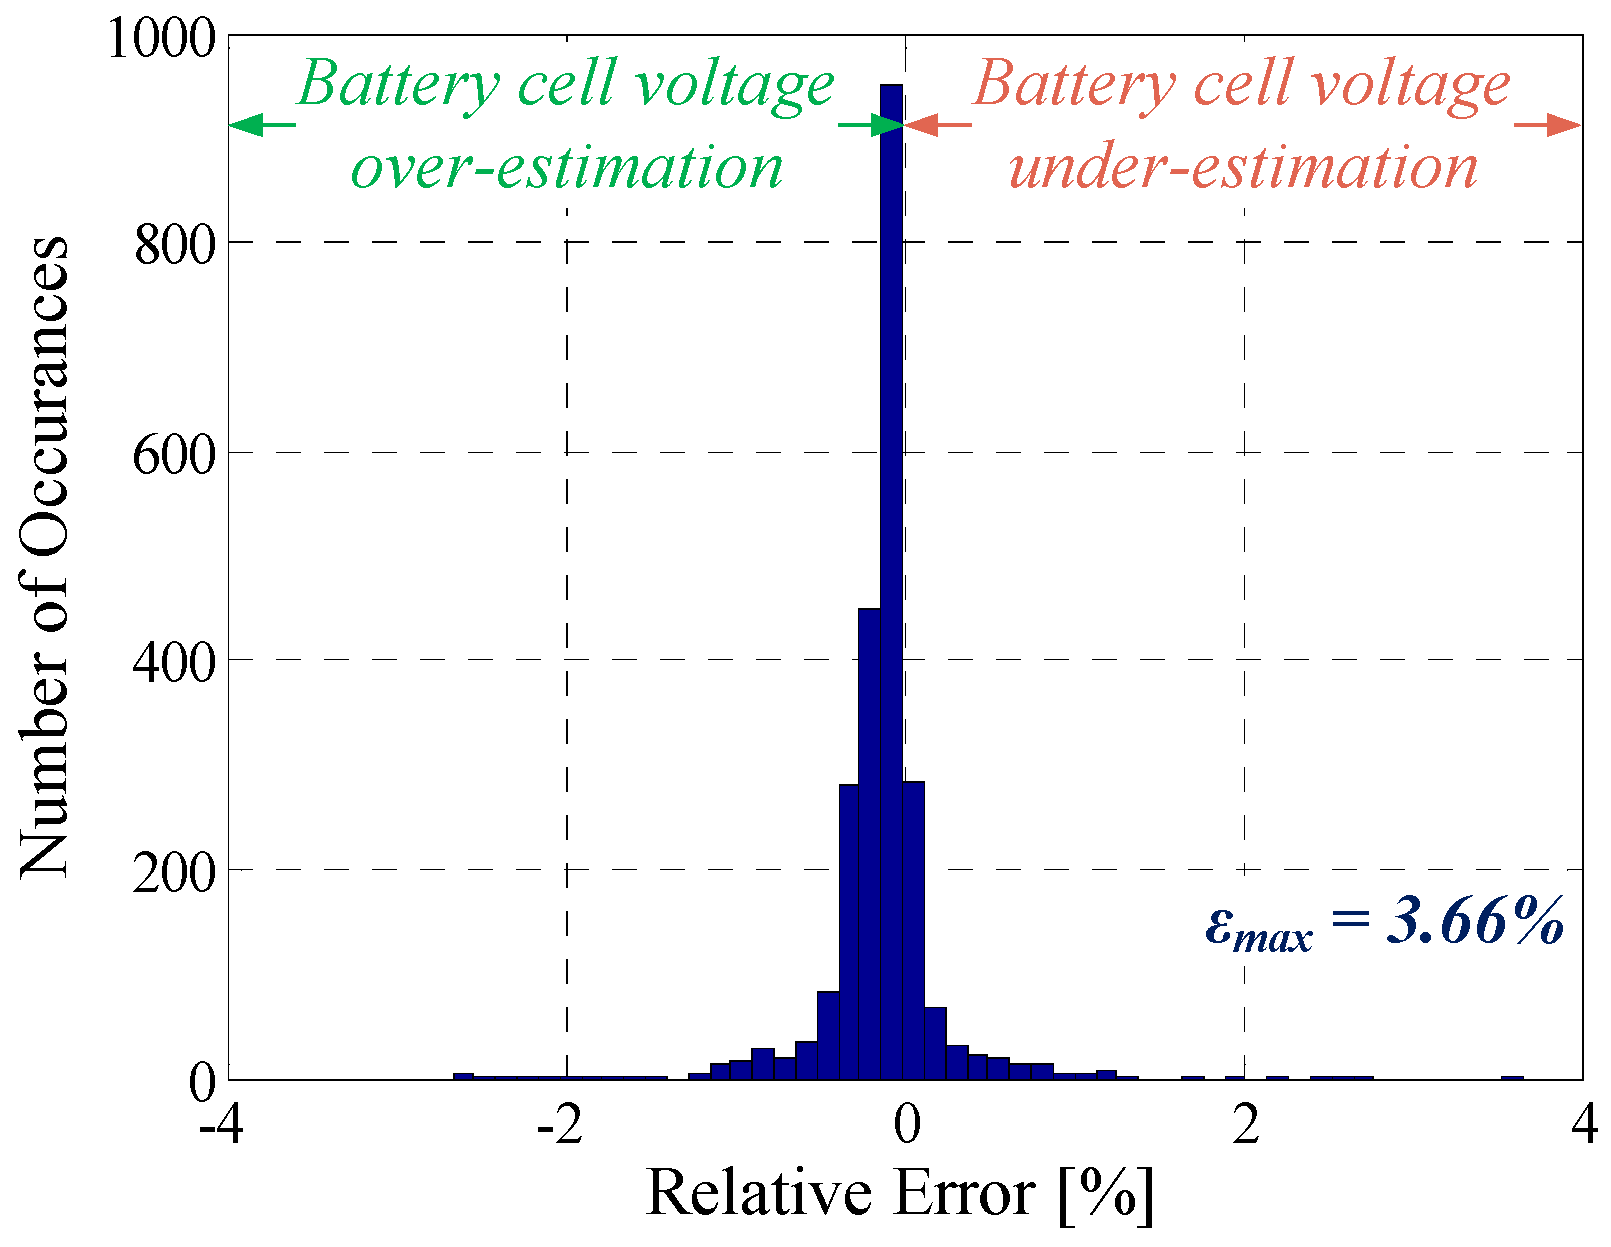
5.1. Pulse Discharge

The first validation of the developed performance model was carried out using a discharging current pulse profile. From a fully charged state, the LFP/C battery was discharged with 1C-rate (i.e., 2.5 A) in steps of 10% SOC; between two consecutive discharging current pulses, a relaxation period of 15 min was applied. The measured and estimated voltage profiles of the LFP/C for this verification case are illustrated in Figure 20. The developed performance model was able to estimate very accurately the voltage of the tested LFP/C battery, with a maximum error εmax = 3.66% and a mean error ε ¯ = 6.8 mV.
The distribution of the voltage deviations, expressed as relative error values, is presented in Figure 21, showing that the model has a slight tendency of over-estimating the voltage behavior of the tested LFP/C battery; the main contribution of this tendency is represented by the voltage estimation error after the current pulse is cut off. The dynamic behavior of the performance model might be improved (thus the accuracy of the model will further increase) by considering an EEC with more ZARC elements (or R-C parallel networks) [24]; however, this will cause a high increase of the computation time of the performance model.

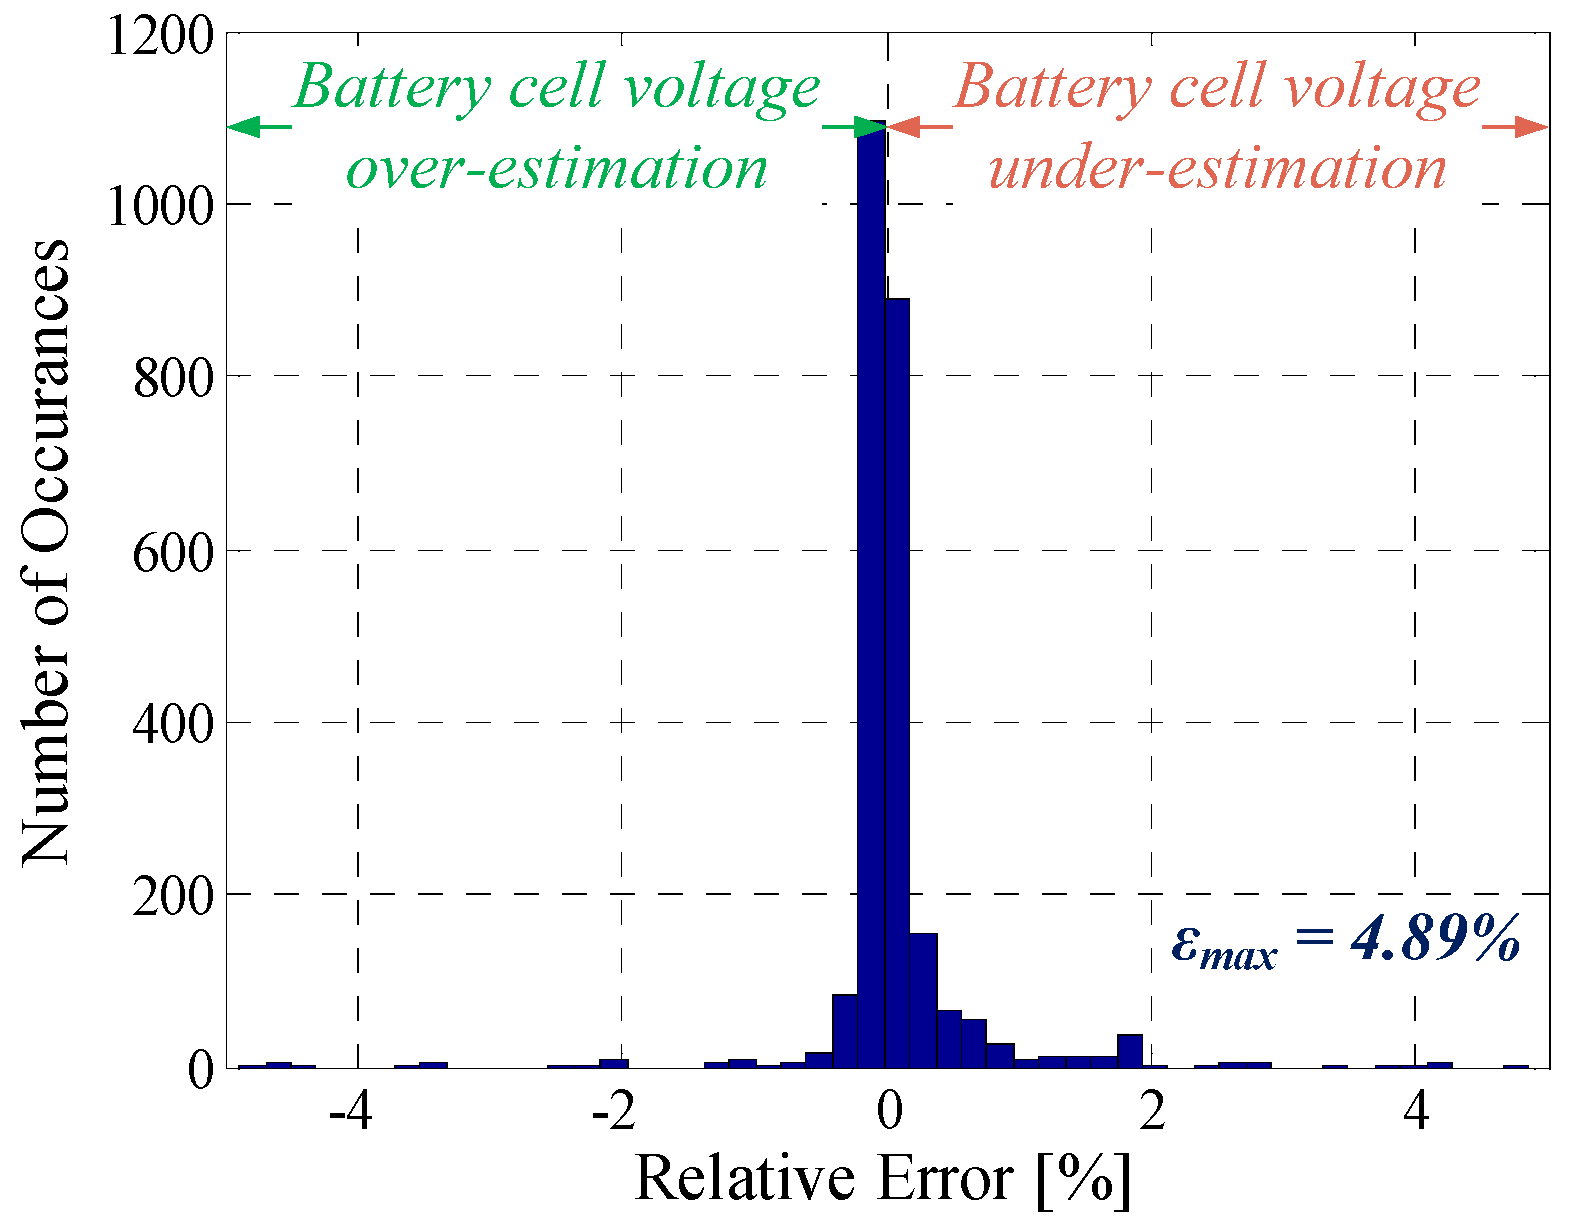
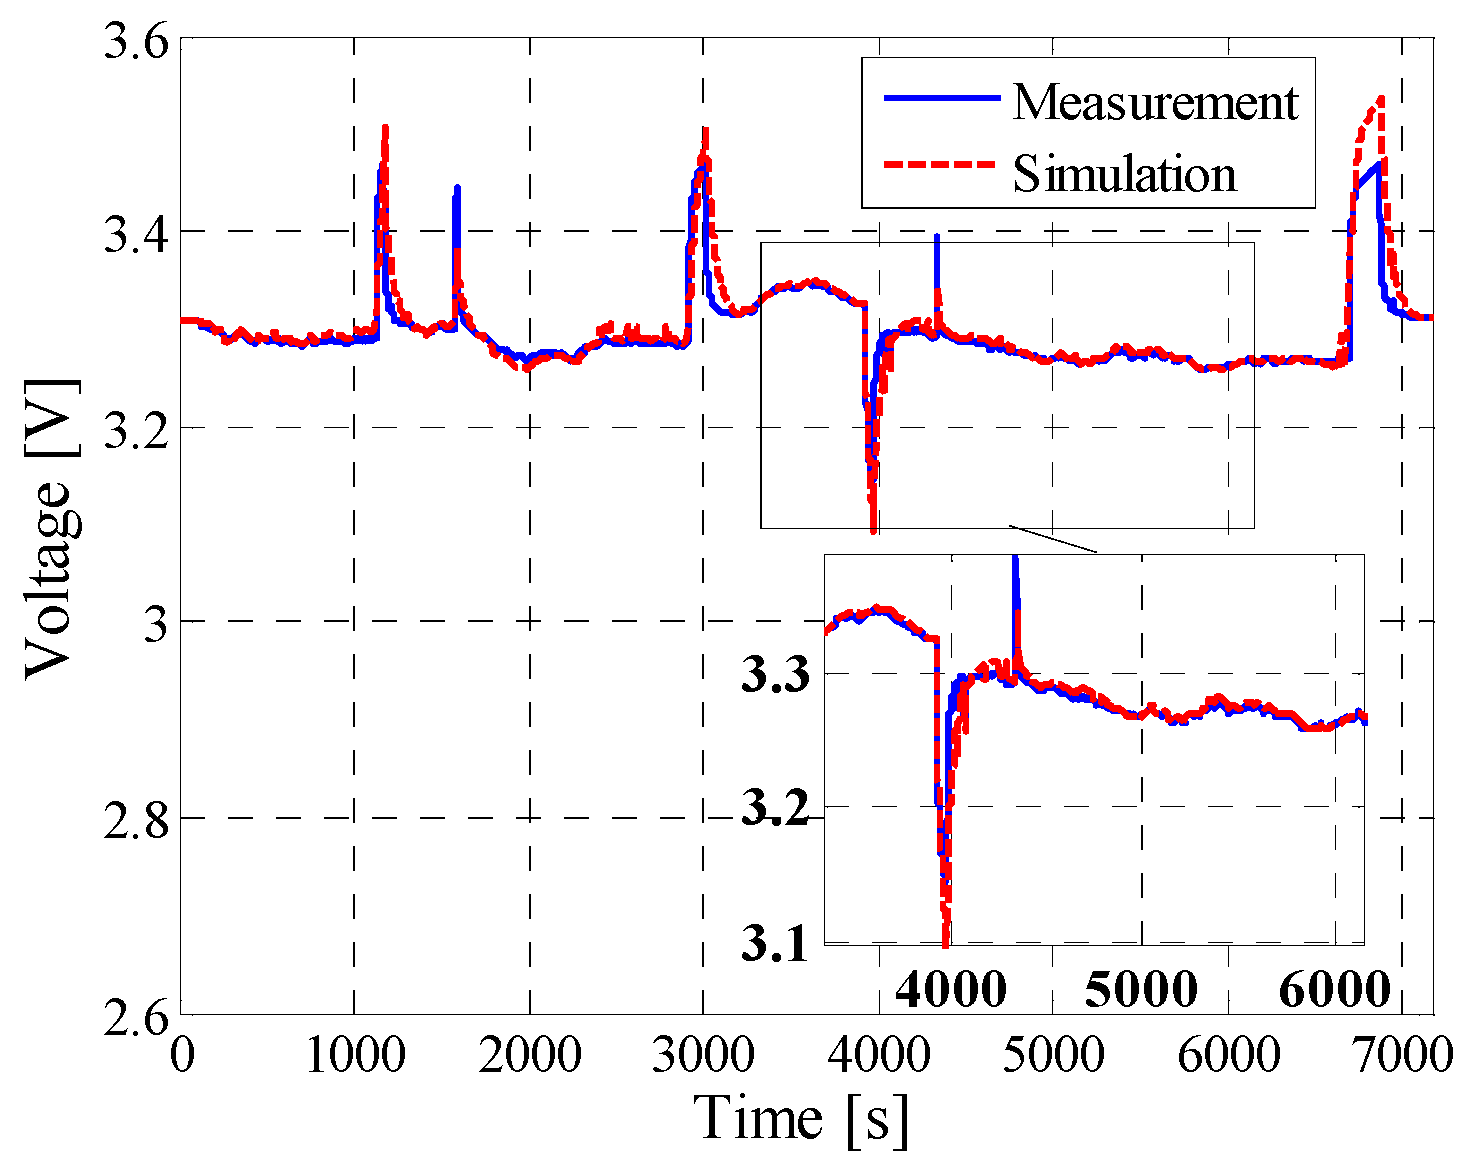
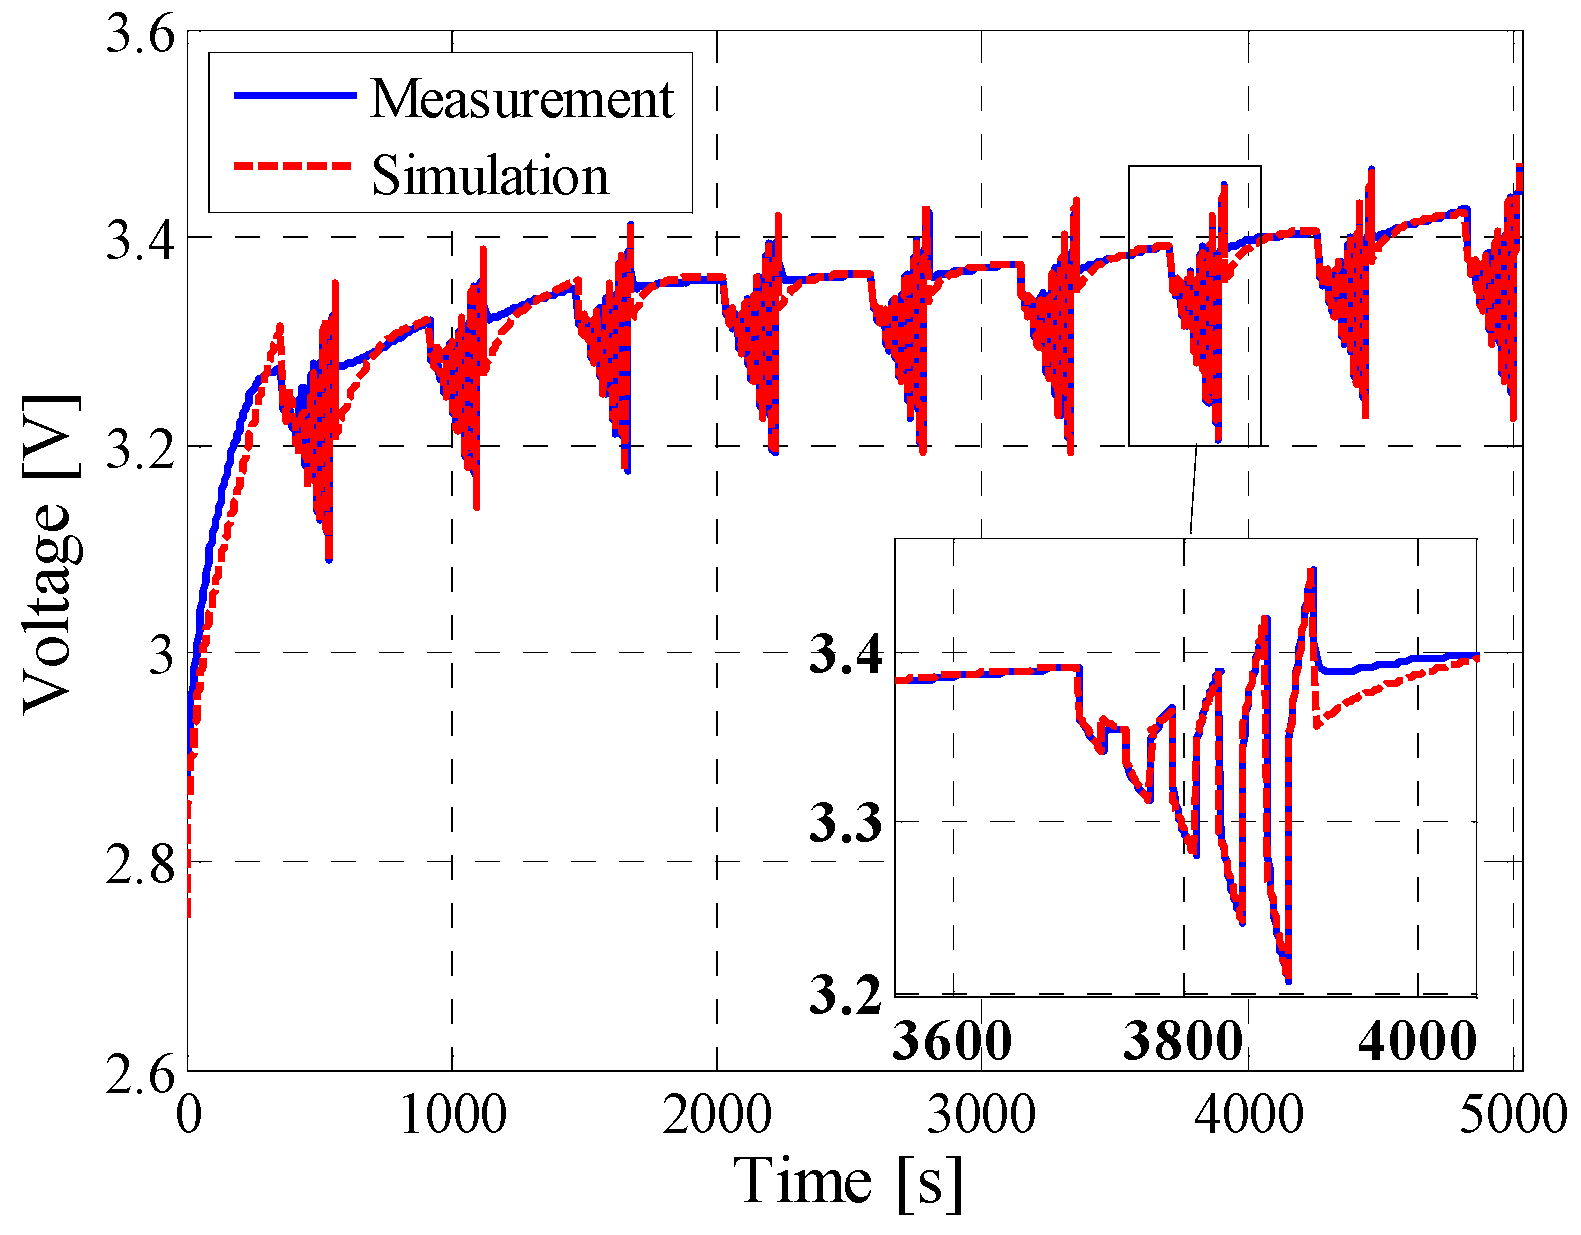
5.2. Dynamic Pulse Charging and Discharging

In real applications (e.g., e-mobility, grid support etc.), Li-ion batteries are subjected to complex charging-discharging profiles. Consequently, the developed performance model was verified for a current profile, which was composed of charging and discharging pulses of different C-rates, over the whole SOC interval; the considered current profile is presented in Figure 22. To allow for a non-biased verification, the C-rates, which were used for this dynamic profile, are different than the C-rates used to compute the Butler-Volmer correction voltage (see Section 3.5 and Section 4.2).
The measured and estimated voltage profiles obtained by applying the dynamic current profile, presented in Figure 22, are illustrated in Figure 23. For this case, the proposed model is able to predict the voltage of the LFP/C battery with a mean error of ε ¯ = 6.4 mV and maximum error of εmax = 4.89%. Furthermore, the distribution of the relative error, presented in Figure 24, shows in this case a tendency of the developed model to under-estimate the voltage of the battery; as shown in the zoomed view of Figure 23, this under-estimation of the voltage was mainly caused by the inability of the model to react to sudden and large variation of C-rates (i.e., 3.5C-rate to 1C-rate).

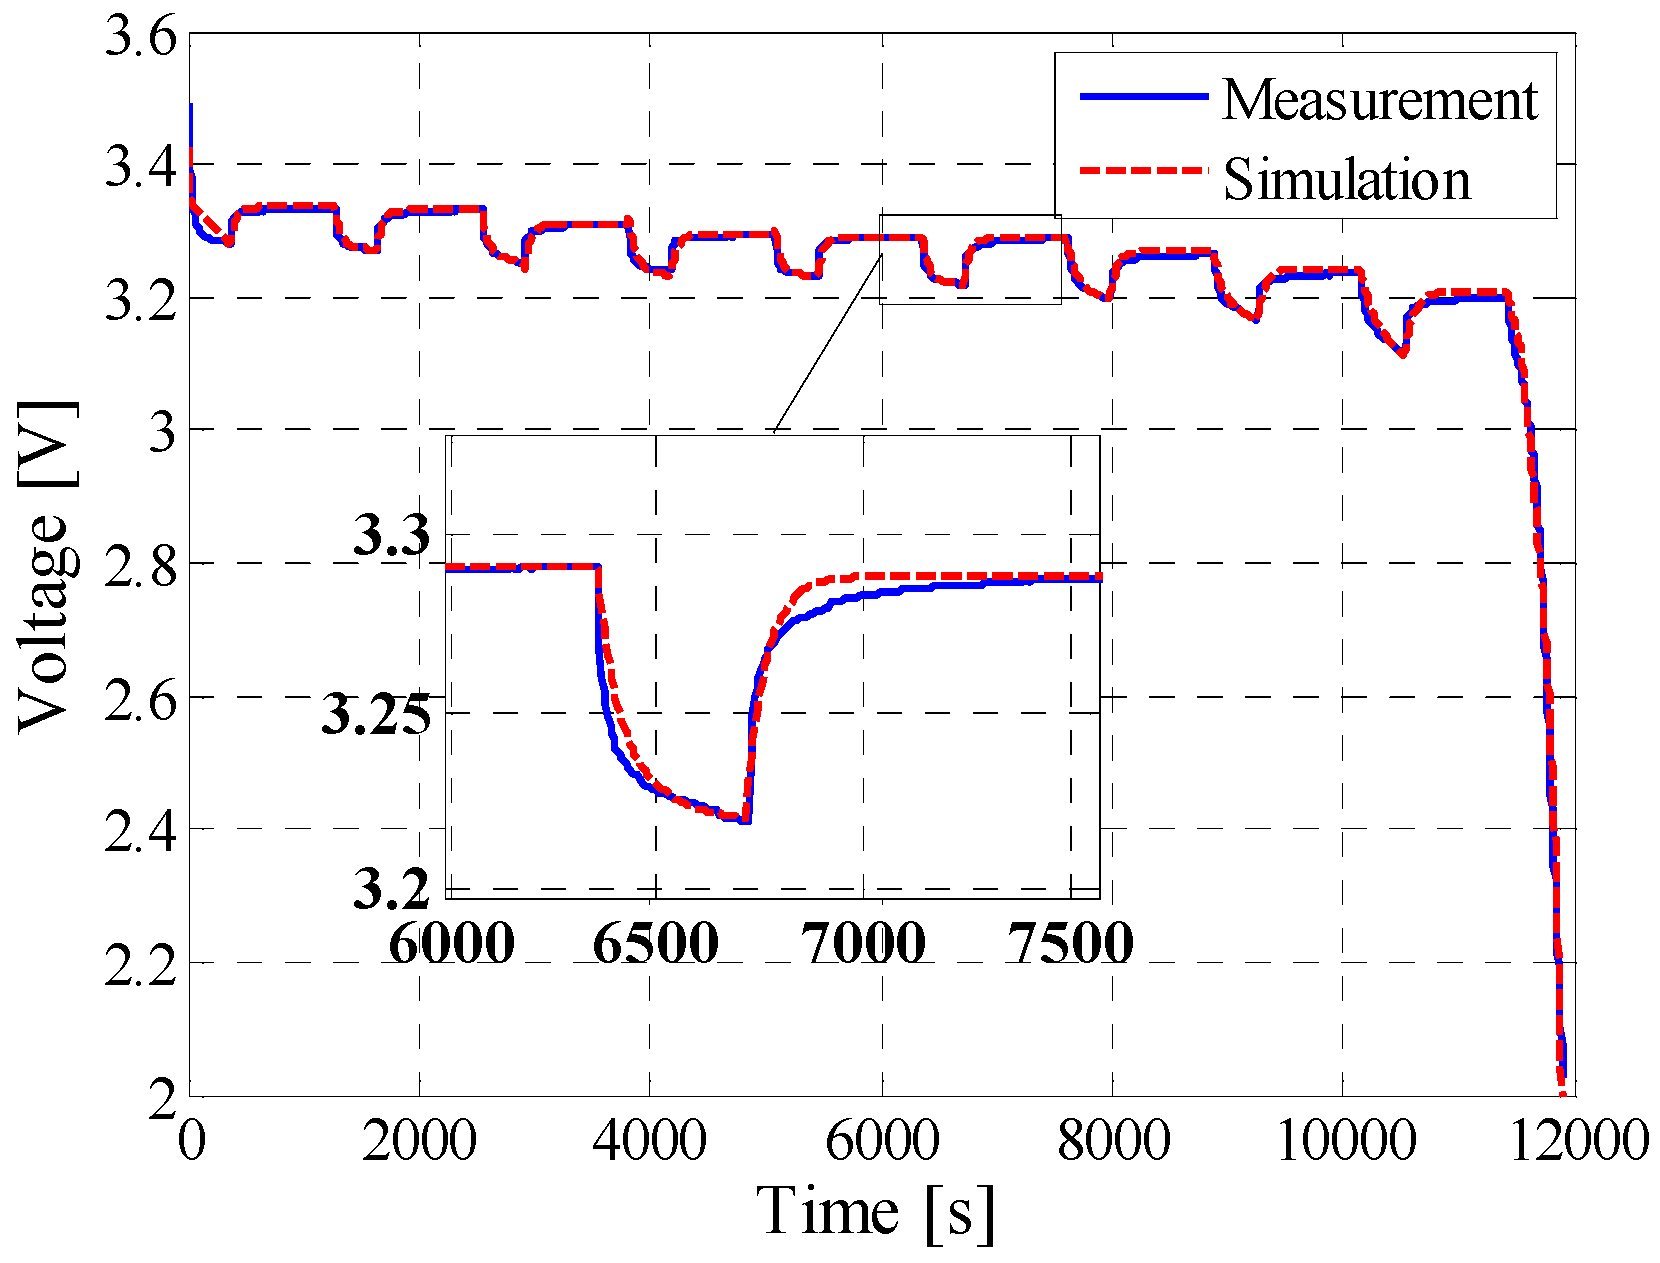
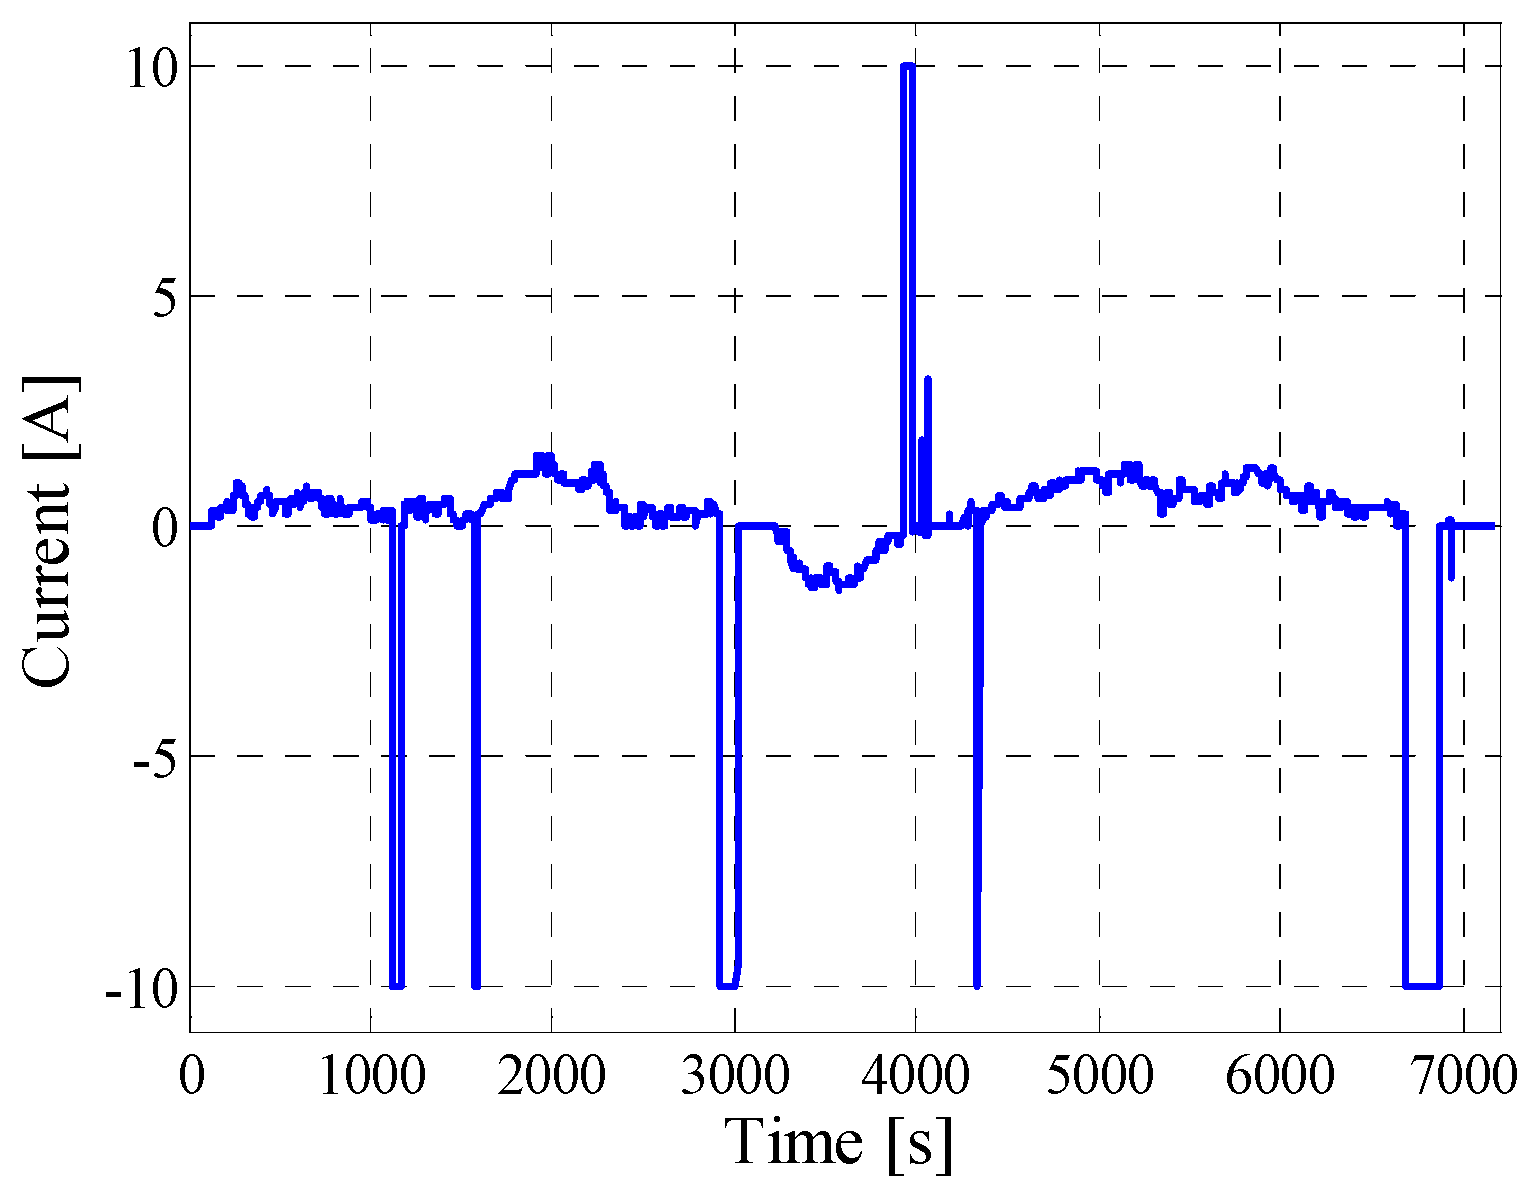
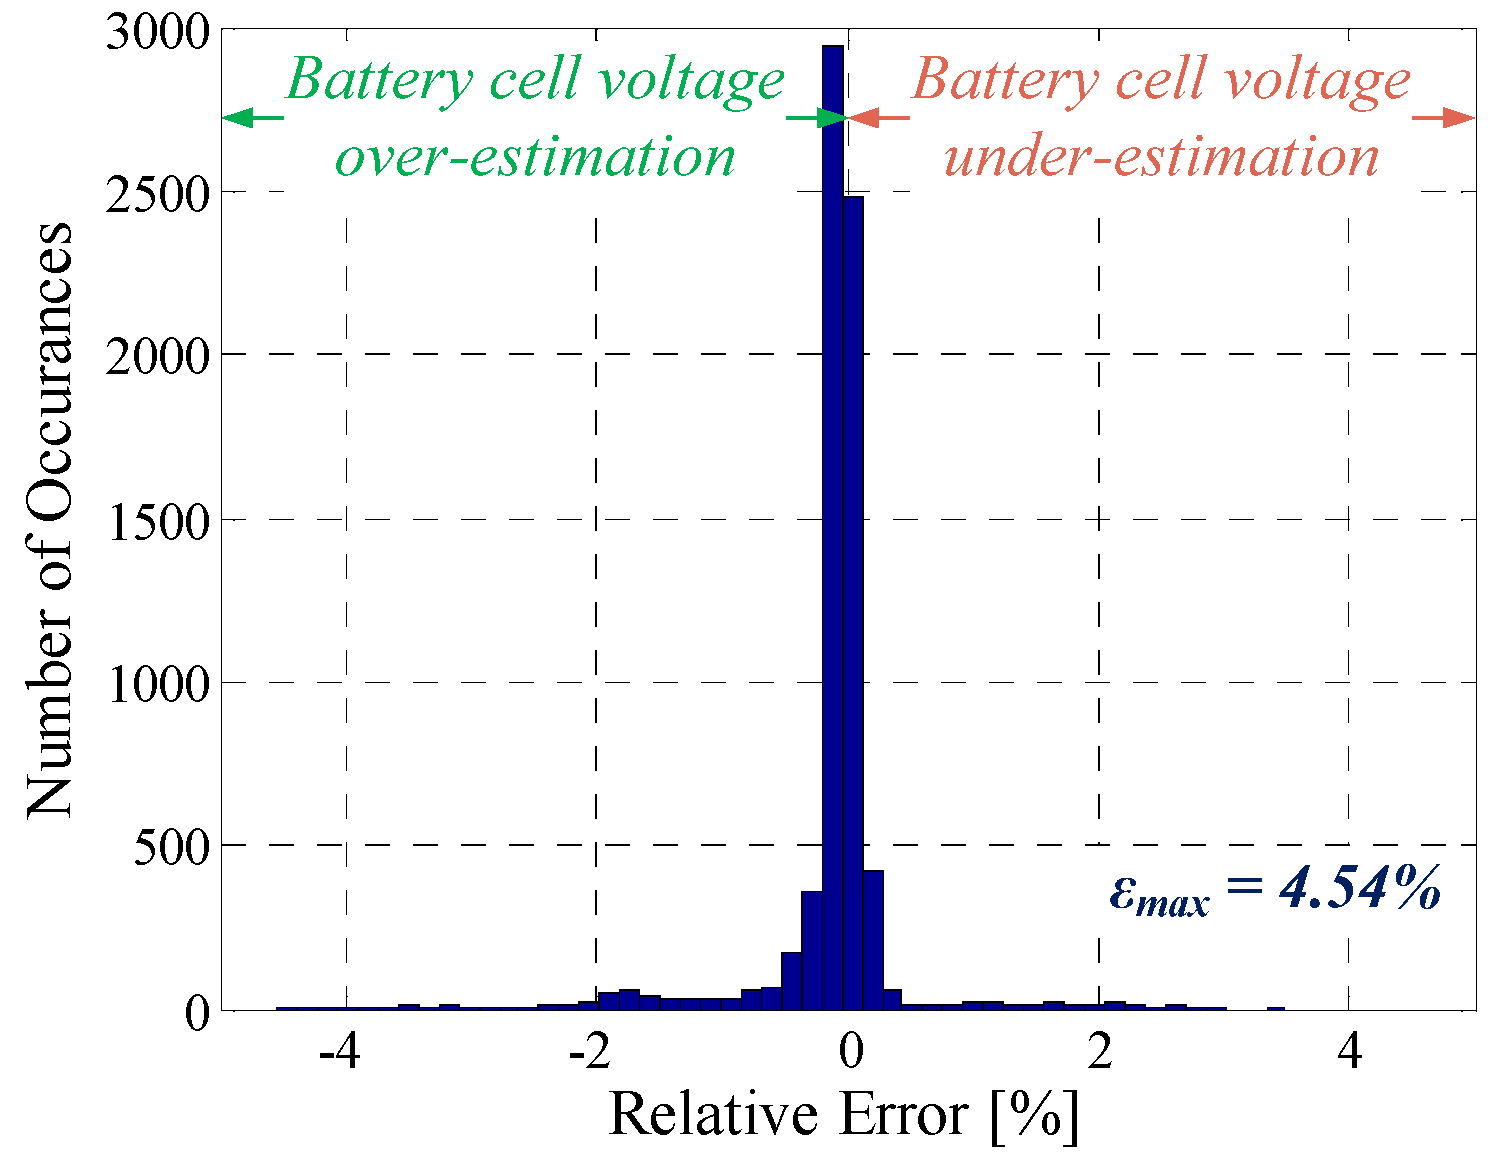
5.3. Field-Measured Profile

The third verification of the developed performance model was performed using a realistic current profile, which was measured on field on LFP/C batteries providing primary frequency regulation (PFR) in the Danish energy market [5]. The considered current profile with a length of two hours is illustrated in Figure 25. The comparison between the estimated and measured voltage of the LFP/C battery, when the field-measured current profile was considered, is presented in Figure 26. The performance model of the LFP/C battery estimates generally with good accuracy ( ε ¯ = 8.4 mV and εmax = 4.54%) the voltage of the battery. Nevertheless, the model has the tendency to over-estimate the voltage response of the LFP/C battery, when sudden and large variation of the load current have occurred (i.e., changes in the current from below 1C-rate to 4C-rate); this behavior is illustrated in Figure 27, where the distribution of the relative error obtained by comparing the measured and estimated voltage profiles is plotted.
The developed performance model is able to accurately estimate the voltage behavior of the tested LFP/C battery—regardless of the applied current profile—returning a maximum error lower than 5% and a mean error below 8.5 mV as summarized in Table 2.

6. Conclusions

A seven-step characterization methodology for measuring the performance characteristics of the Li-ion batteries was proposed in the first part of this work. For exemplification of the procedure, a commercially available 2.5 Ah LFP/C battery was used. The results obtained during the characterization test were used to develop and parameterize the performance model of the LFP/C battery.
In order to model the dynamic behavior of the battery, a novel hybrid procedure was proposed. Thus, the developed performance model combines information obtained from the electrochemical impedance spectroscopy (EIS) test (i.e., dependence of the impedance on SOC and temperature) and HPPC test (i.e., dependence on the load current), respectively. The proposed hybrid performance model was verified using different representative dynamic current profiles. The obtained results, maximum error lower than 5% and a mean error below 8.5 mV, have suggested that the developed model is able to estimate with high accuracy the voltage of the LFP/C battery, independent of the considered test conditions. Thus, it can be concluded that the proposed seven-step generalized characterization procedure for Li-ion batteries was validated.
Even though the proposed characterization procedure was illustrated for a certain Li-ion battery chemistry (i.e., LFP/C), it can be applied to any type of Li-ion battery chemistry with the amendment that the values of the test conditions (i.e., temperature and load current levels) have to be adjusted in order to match the manufacturer data-sheets.

Author Contributions

Daniel-Ioan Stroe and Maciej Swierczynski conceived, designed, and performed the experiments. Daniel-Ioan Stroe and Ana-Irina Stroe analyzed the data; Søren Knudsen Kær reviewed the paper; and Daniel-Ioan Stroe wrote the paper.

Conflicts of Interest

The authors declare no conflict of interest.

References

  1. Pistoia, G. (Ed.) Lithium-Ion Batteries: Advances and Applications; Elsevier: Amsterdam, The Netherlands, 2014.
  2. Scrosati, B.; Garche, J. Lithium batteries: Status, prospects and future. J. Power Sources 2010, 195, 2419–2430. [Google Scholar] [CrossRef]
  3. Alexander, D.; Gartner, J. Electric Vehicle Batteries—Lithium Ion Batteries for Hybrid, Plug-in-Hybrid, and Battery Electric Vehicles: Global Market Analysis and Forecasts; Navigant Research: Boulder, CO, USA, 2014. [Google Scholar]
  4. Catenacci, M.; Verdolini, E.; Bosetti, V.; Fiorese, G. Going electric: Expert survey on the future of battery technologies for electric vehicles. Energy Policy 2013, 61, 403–413. [Google Scholar] [CrossRef]
  5. Swierczynski, M.; Stroe, D.I.; Lærke, R.; Stan, A.I.; Kjær, P.C.; Teodorescu, R.; Kær, S.K. Field experience from Li-ion BESS delivering primary frequency regulation in the Danish energy market. ECS Trans. 2014, 61, 1–14. [Google Scholar] [CrossRef]
  6. Gaillac, L.; Castaneda, J.; Edris, A.-A.; Elizondo, D.; Wilkins, C.; Vartanian, C.; Mendelsohn, D. Tehachapi wind energy storage project: Description of operational uses, system components, and testing plans. In Proceedings of the 2012 IEEE PES Transmission and Distribution Conference and Exposition (T&D), Orlando, FL, USA, 7–10 May 2012; pp. 1–6.
  7. Rastler, D.M. Electric Energy Storage Technology Options: A White Paper Primer on Applications, Costs, and Benefits; Technical Report 1020676; Electric Power Research Institute (EPRI): Palo Alto, CA, USA, 2010. [Google Scholar]
  8. Li, X.; Hui, D.; Xu, M.; Wang, L.; Guo, G.; Zhang, L. Integration and energy management of large-scale lithium-ion battery energy storage station. In Proceedings of the 2012 15th International Conference on Electrical Machines and Systems (ICEMS), Sapporo, Japan, 21–24 October 2012; pp. 1–6.
  9. Vartanian, C.; Bentley, N. A123 systems’ advanced battery energy storage for renewable integration. In Proceedings of the 2011 IEEE/PES Power Systems Conference and Exposition (PSCE), Phoenix, AZ, USA, 20–23 March 2011; pp. 1–6.
  10. Jeffe, S.; Adamson, K.-A. Advanced Batteries for Utility-Scale Energy Storage; Navigant Research: Boulder, CO, USA, 2014. [Google Scholar]
  11. Battery Storage for Renewables: Market Status and Technology Outlook; The International Renewable Energy Agency (IRENA): Masdar, United Arab Emirates, 2015.
  12. Klein, R.; Chaturvedi, N.; Christensen, J.; Ahmed, J.; Findeisen, R.; Kojic, A. Electrochemical model based observer design for a lithium-ion battery. IEEE Trans. Control Syst. Technol. 2013, 21, 289–301. [Google Scholar] [CrossRef]
  13. Smith, K.; Rahn, C.; Wang, C.-Y. Model-based electrochemical estimation and constraint management for pulse operation of lithium ion batteries. IEEE Trans. Control Syst. Technol. 2010, 18, 654–663. [Google Scholar] [CrossRef]
  14. Shepherd, C. Design of primary and secondary cells—II. An equation describing battery discharge. J. Electrochem. Soc. 1965, 112, 657–664. [Google Scholar] [CrossRef]
  15. Gao, L.; Liu, S.; Dougal, R. Dynamic lithium-ion battery model for system simulation. IEEE Trans. Compon. Packag. Technol. 2002, 25, 495–505. [Google Scholar]
  16. Chen, M.; Rincon-Mora, G. Accurate electrical battery model capable of predicting runtime and IV performance. IEEE Trans. Energy Convers. 2006, 21, 504–511. [Google Scholar] [CrossRef]
  17. Swierczynski, M.; Stroe, D.; Stan, A.-I.; Teodorescu, R.; Sauer, D. Selection and performance-degradation modeling of LiMO2/Li4Ti5O12 and LiFePO4/C battery cells as suitable energy storage systems for grid integration with wind power plants: An example for the primary frequency regulation service. IEEE Trans. Sustain. Energy 2014, 5, 90–101. [Google Scholar] [CrossRef]
  18. Andre, D.; Meiler, M.; Steiner, K.; Walz, H.; Soczka-Guth, T.; Sauer, D.U. Characterization of high-power lithium-ion batteries by electrochemical impedance spectroscopy. II: Modelling. J. Power Sources 2011, 196, 5349–5356. [Google Scholar] [CrossRef]
  19. Rong, P.; Pedram, M. An analytical model for predicting the remaining battery capacity of lithium-ion batteries. IEEE Trans. Large Scale Integr. Syst. 2006, 14, 441–451. [Google Scholar] [CrossRef]
  20. Kim, T.; Qiao, W. A hybrid battery model capable of capturing dynamic circuit characteristics and nonlinear capacity effects. IEEE Trans. Energy Convers. 2011, 26, 1172–1180. [Google Scholar] [CrossRef]
  21. Stroe, D.-I. Lifetime Models for Lithium-Ion Batteries Used in Virtual Power Plants. Ph.D. Thesis, Aalborg University, Aalborg, Denmark, 2014. [Google Scholar]
  22. Jackey, R.; Saginaw, M.; Sanghvi, P.; Gazzarri, J.; Huria, T. Battery Model Parameter Estimation Using a Layered Technique: An Example Using a Lithium Iron Phosphate Cell; Society of Automotive Engineers: Warrendale, PA, USA, 2013. [Google Scholar]
  23. Hentunen, A.; Lehmuspelto, T.; Suomela, J. Time-domain parameter extraction method for Thévenin-equivalent circuit battery models. IEEE Trans. Energy Convers. 2014, 29, 558–566. [Google Scholar] [CrossRef]
  24. Zhang, H.; Chow, M.-Y. Comprehensive dynamic battery modeling for PHEV applications. In Proceedings of the 2010 IEEE Power and Energy Society General Meeting, Minneapolis, MN, USA, 25–29 July 2010; pp. 1–6.
  25. Rahimi-Eichi, H.; Balagopal, B.; Chow, M.-Y.; Yeo, T.-J. Sensitivity analysis of lithium-ion battery model to battery parameters. In Proceedings of the 39th Annual Conference of the IEEE Industrial Electronics Society (IECON 2013), Vienna, Austria, 10–13 November 2013; pp. 6794–6799.
  26. Hsieh, Y.-C.; Lin, T.-D.; Chen, R.-J.; Lin, H.-Y. Electric circuit modelling for lithium-ion batteries by intermittent discharging. IET Power Electron. 2014, 7, 2672–2677. [Google Scholar] [CrossRef]
  27. Buller, S.; Thele, M.; Karden, E.; Doncker, R.W.D. Impedance-based non-linear dynamic battery modeling for automotive applications. J. Power Sources 2003, 113, 422–430. [Google Scholar] [CrossRef]
  28. Karden, E.; Buller, S.; Doncker, R.W.D. A frequency-domain approach to dynamical modeling of electrochemical power sources. Electrochim. Acta 2002, 47, 2347–2356. [Google Scholar] [CrossRef]
  29. Buller, S.; Thele, M.; de Doncker, R.; Karden, E. Impedance-based simulation models of supercapacitors and Li-ion batteries for power electronic applications. IEEE Trans. Ind. Appl. 2005, 41, 742–747. [Google Scholar] [CrossRef]
  30. Andre, D.; Meiler, M.; Steiner, K.; Wimmer, C.; Soczka-Guth, T.; Sauer, D.U. Characterization of high-power lithium-ion batteries by electrochemical impedance spectroscopy. I. Experimental investigation. J. Power Sources 2011, 196, 5334–5341. [Google Scholar] [CrossRef]
  31. Barsoukov, E.; Macdonald, J.R. (Eds.) Impedance Spectroscopy: Theory, Experiment, and Applications, 2nd ed.; Wiley: Hoboken, NJ, USA, 2005.
  32. Stan, A.-I.; Swierczynski, M.; Stroe, D.-I.; Teodorescu, R.; Andreasen, S. Lithium ion battery chemistries from renewable energy storage to automotive and back-up power applications—An overview. In Proceedings of the 2014 International Conference on Optimization of Electrical and Electronic Equipment, Brasov, Romania, 22–24 May 2014; pp. 713–720.
  33. Batteries for Electric Cars—Challenges, Opportunities, and the Outlook to 2020; The Boston Consulting Group: Boston, MA, USA, 2010.
  34. Electrical Propelled Road Vehicles—Test Specification for Lithium-Ion Traction Battery Packs and Systems—Part 1: High-Power Applications; ISO 12405-1:2011 Standard; The International Organization for Standardization (ISO): Geneva, Switzerland, 2011.
  35. Bohlen, O. Impedance Based Battery Monitoring. Ph.D. Thesis, RWTH Aachen University, Aachen, Germany, 2008. [Google Scholar]
  36. Stroe, D.-I.; Swierczynski, M.; Stan, A.-I.; Teodorescu, R.; Andreasen, S. Accelerated lifetime testing methodology for lifetime estimation of lithium-ion batteries used in augmented wind power plants. IEEE Trans. Ind. Appl. 2014, 50, 4006–4017. [Google Scholar] [CrossRef]
  37. Ecker, M.; Gerschler, J.B.; Vogel, J.; Käbitz, S.; Hust, F.E. Development of a lifetime prediction model for lithium-ion batteries based on extended accelerated aging test data. J. Power Sources 2012, 215, 248–257. [Google Scholar] [CrossRef]
  38. Grolleau, S.; Delaille, A.; Gualous, H.; Gyan, P.; Revel, R.; Bernard, J.; Redondo-Iglesias, E.; Peter, J. Calendar aging of commercial graphite/LiFePO4 cell—Predicting capacity fade under time dependent storage conditions. J. Power Sources 2014, 255, 450–458. [Google Scholar] [CrossRef]
  39. Omar, N.; Verbrugge, B.; Mulder, G.; van den Bossche, P.; van Mierlo, J.; Daowd, M.; Dhaens, M.; Pauwels, S. Evaluation of performance characteristics of various lithium-ion batteries for use in BEV application. In Proceedings of the 2010 IEEE Vehicle Power and Propulsion Conference (VPPC), Lille, France, 1–3 September 2010; pp. 1–6.
  40. Omar, N.; van den Bossche, P.; Mulder, G.; Daowd, M.; Timmermans, J.M.; van Mierlo, J.; Pauwels, S. Assessment of performance of lithium iron phosphate oxide, nickel manganese cobalt oxide and nickel cobalt aluminum oxide based cells for using in plug-in battery electric vehicle applications. In Proceedings of the 2011 IEEE Vehicle Power and Propulsion Conference (VPPC), Chicago, IL, USA, 6–9 September 2011; pp. 1–7.
  41. Roscher, M.; Bohlen, O.; Vetter, J. OCV hysteresis in Li-ion batteries including two-phase transition materials. Int. J. Electrochem. 2011, 2011, 984320. [Google Scholar] [CrossRef]
  42. Roscher, M.; Bohlen, O.; Sauer, D. Reliable state estimation of multicell lithium-ion battery systems. IEEE Trans. Energy Convers. 2011, 26, 737–743. [Google Scholar] [CrossRef]
  43. Tang, X.; Mao, X.; Lin, J.; Koch, B. Li-ion battery parameter estimation for state of charge. In Proceedings of the American Control Conference (ACC), San Francisco, CA, USA, 29 June–1 July 2011; pp. 941–946.
  44. Waag, W.; Käbitz, S.; Sauer, D.U. Experimental investigation of the lithium-ion battery impedance characteristic at various conditions and aging states and its influence on the application. Appl. Energy 2013, 102, 885–897. [Google Scholar] [CrossRef]
  45. Stroe, D.; Swierczynski, M.; Stan, A.-I.; Teodorescu, R.; Andreasen, S. Experimental investigation on the internal resistance of lithium iron phosphate battery cells during calendar ageing. In Proceedings of the 39th Annual Conference of the IEEE Industrial Electronics Society (IECON 2013), Vienna, Austria, 10–13 November 2013; pp. 6734–6739.
  46. Hafsaoui, J.; Scordia, J.; Sellier, F.; Aubret, P. Development of an electrochemical battery model and its parameters identification tool. Int. J. Automot. Eng. 2012, 3, 27–33. [Google Scholar]
  47. Bard, A.; Inzelt, G.; Scholz, F. (Eds.) Electrochemical Dictionary, 2nd ed.; Springer: Berlin, Germany, 2012.
Figure 1. Lithium iron phosphate/graphite (LFP/C) battery during the characterization procedure. EIS: electrochemical impedance spectroscopy.
Batteries 02 00037 g001
Figure 2. Test sequence for characterization of the LFP/C battery. OCV: open-circuit voltage; SOC: state-of-charge; and HPPC: hybrid pulse power characterization.
Batteries 02 00037 g002
Figure 3. Discharging capacity of the LFP/C battery measured during the preconditioning test (1C-rate, T = 25 °C).
Batteries 02 00037 g003
Figure 4. Dependence of the discharged capacity on temperature and load current.
Batteries 02 00037 g004
Figure 5. The OCV-SOC characteristic of the LFP/C battery measured at 25 °C.
Batteries 02 00037 g005
Figure 6. Pulse profile for measuring the internal resistance of the LFP/C battery.
Batteries 02 00037 g006
Figure 7. Theoretical voltage and current of Li-ion battery during impedance measurement with the current pulse technique.
Batteries 02 00037 g007
Figure 8. Measured voltage response of the LFP battery at discharging current pulses of different C-rates (SOC = 50%, T = 25 °C).
Batteries 02 00037 g008
Figure 9. Measured impedance of the LFP/C battery during 18 s charging and discharging current pulse (1C-rate, T = 25 °C).
Batteries 02 00037 g009
Figure 10. Dependence of the impedance spectra on the SOC; T = 25 °C.
Batteries 02 00037 g010
Figure 11. Dependence of the impedance spectra on the temperature; SOC = 50%.
Batteries 02 00037 g011
Figure 12. Basic configuration of an EEC-based performance model for Li-ion batteries.
Batteries 02 00037 g012
Figure 13. Equivalent electrical circuit (EEC) configuration based on ZARC elements used for fitting the measured impedance spectra of the LFP/C battery. CPE: constant phase element.
Batteries 02 00037 g013
Figure 14. Measured and fitted impedance spectrum using the EEC presented in Figure 13.
Batteries 02 00037 g014
Figure 15. Basic electrical configuration of the performance model of the LFP/C battery.
Batteries 02 00037 g015
Figure 16. Measured non-linear dependence of the charge transfer resistance and of the corresponding over-voltage on the current of the LFP/C battery (note: positive current stands for charging).
Batteries 02 00037 g016
Figure 17. Dependence of the voltage correction factor on the SOC and current for T = 25 °C.
Batteries 02 00037 g017
Figure 18. Block diagram implementation of the performance model for the LFP/C battery.
Batteries 02 00037 g018
Figure 19. Two-dimensional look-up table implementation of Rs of the EEC.
Batteries 02 00037 g019
Figure 20. Measured and estimated voltage profiles during pulse discharging of the LFP/C battery (Ibat = 2.5 A, T = 25 °C).
Batteries 02 00037 g020
Figure 21. Distribution of the relative error obtained during pulse discharging verification case.
Batteries 02 00037 g021
Figure 22. Dynamic current profile used for verification of the LFP/C battery performance model.
Batteries 02 00037 g022
Figure 23. Measured and estimated voltage profiles during dynamic pulse charging and discharging of the LFP/C battery (Ibat = 2.5 A, T = 25 °C).
Batteries 02 00037 g023
Figure 24. Distribution of the relative error obtained during dynamic pulse charging and discharging verification case.
Batteries 02 00037 g024
Figure 25. Field-measured current profile used for the verification of the performance model.
Batteries 02 00037 g025
Figure 26. Measured and estimated voltage profiles obtained for the field-measured current profile at T = 25 °C.
Batteries 02 00037 g026
Figure 27. Distribution of the relative error obtained during the field-measured profile verification case.
Batteries 02 00037 g027
Table 1. Voltage measured at 20%, 50%, and 80% SOC after various relaxation time periods and corresponding OCV errors.
Relaxation TimeSOC = 20%SOC = 50%SOC = 80%
Voltage (V)OCV Error (%)Voltage (V)OCV Error (%)Voltage (V)OCV Error (%)
1 s3.1572.803.2302.033.2702.00
15 min3.2360.373.2920.153.3250.37
1 h3.2410.233.2950.073.3350.07
2 h3.2430.173.2950.053.3360.04
24 h3.24803.29703.3370
Table 2. Performance model accuracy for different load profiles. PFR: primary frequency regulation.
ProfileMean Error, |ε|Maximum Error, εmaxR2
Pulse discharging6.8 mV3.66%0.9917
Dynamic profile6.4 mV4.89%0.9255
PFR profile8.4 mV4.54%0.7724

