
Test Method for Thermal Characterization of Li-Ion Cells and Verification of Cooling Concepts


Abstract
:
1. Introduction
2. Experimental
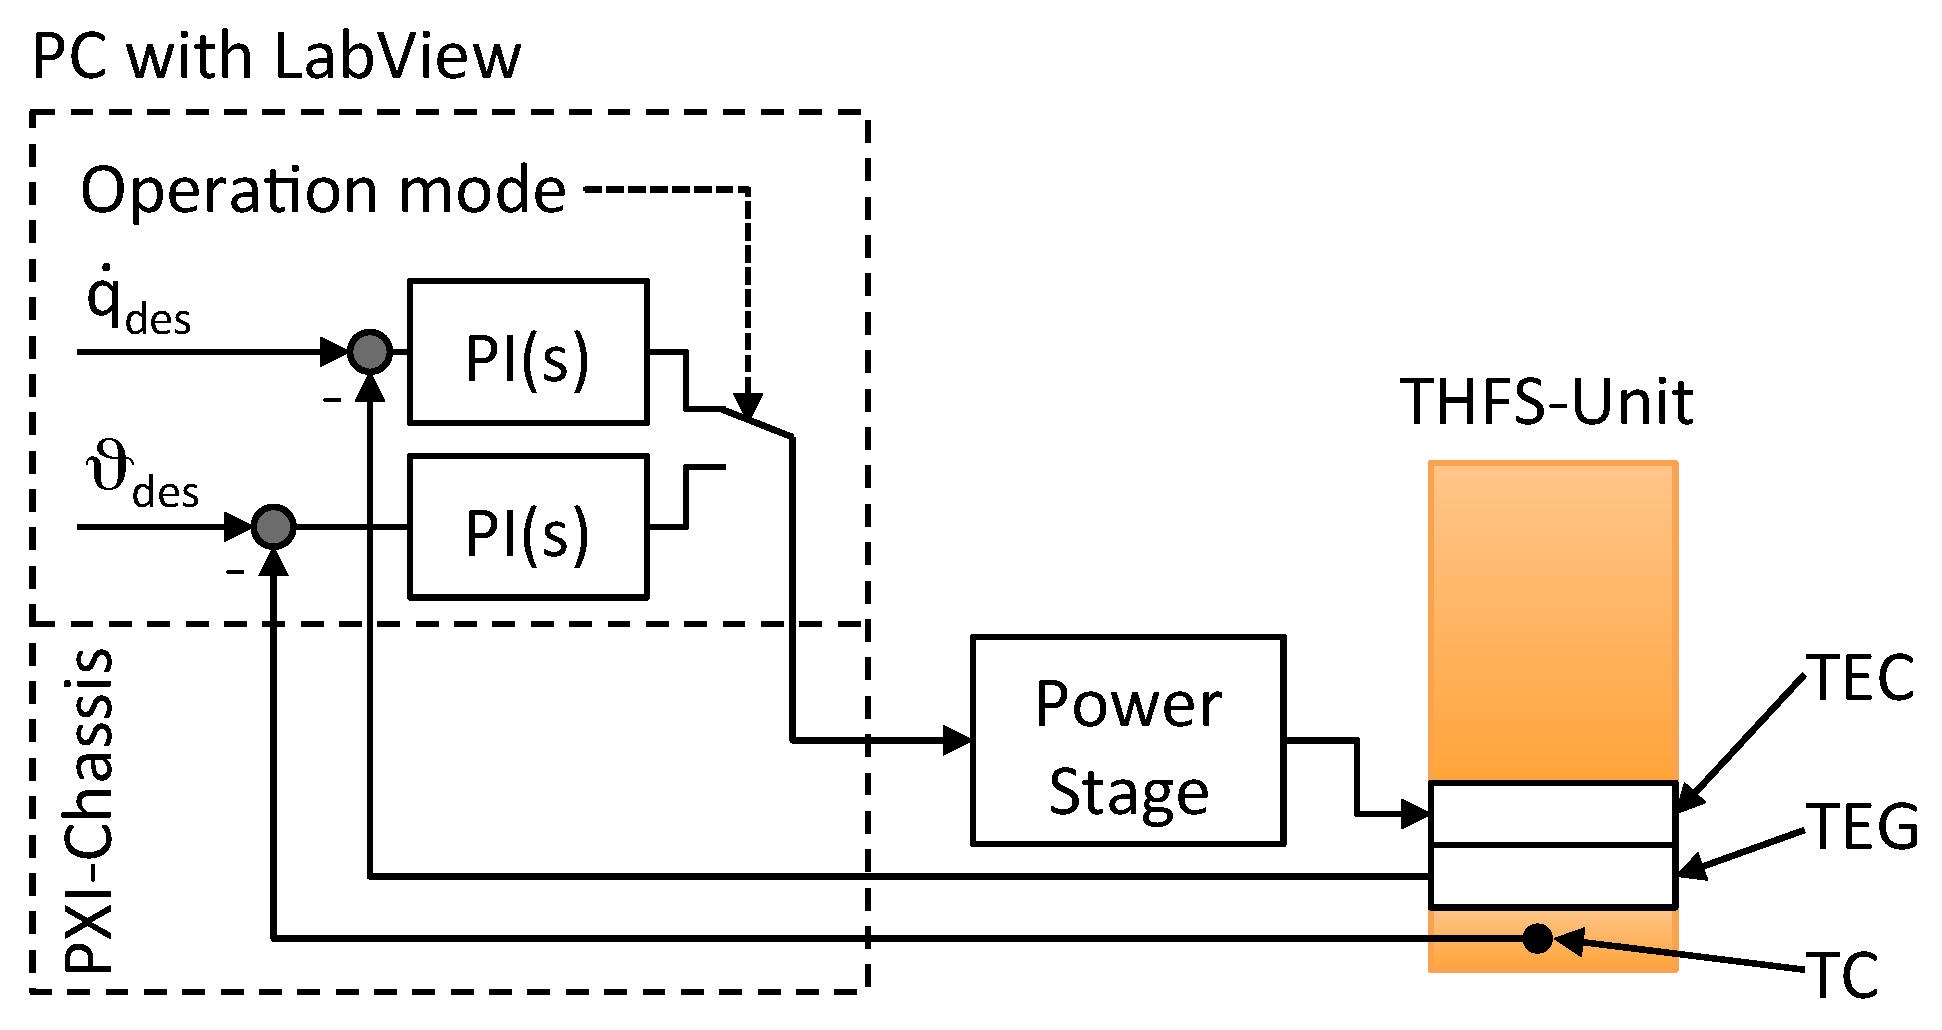
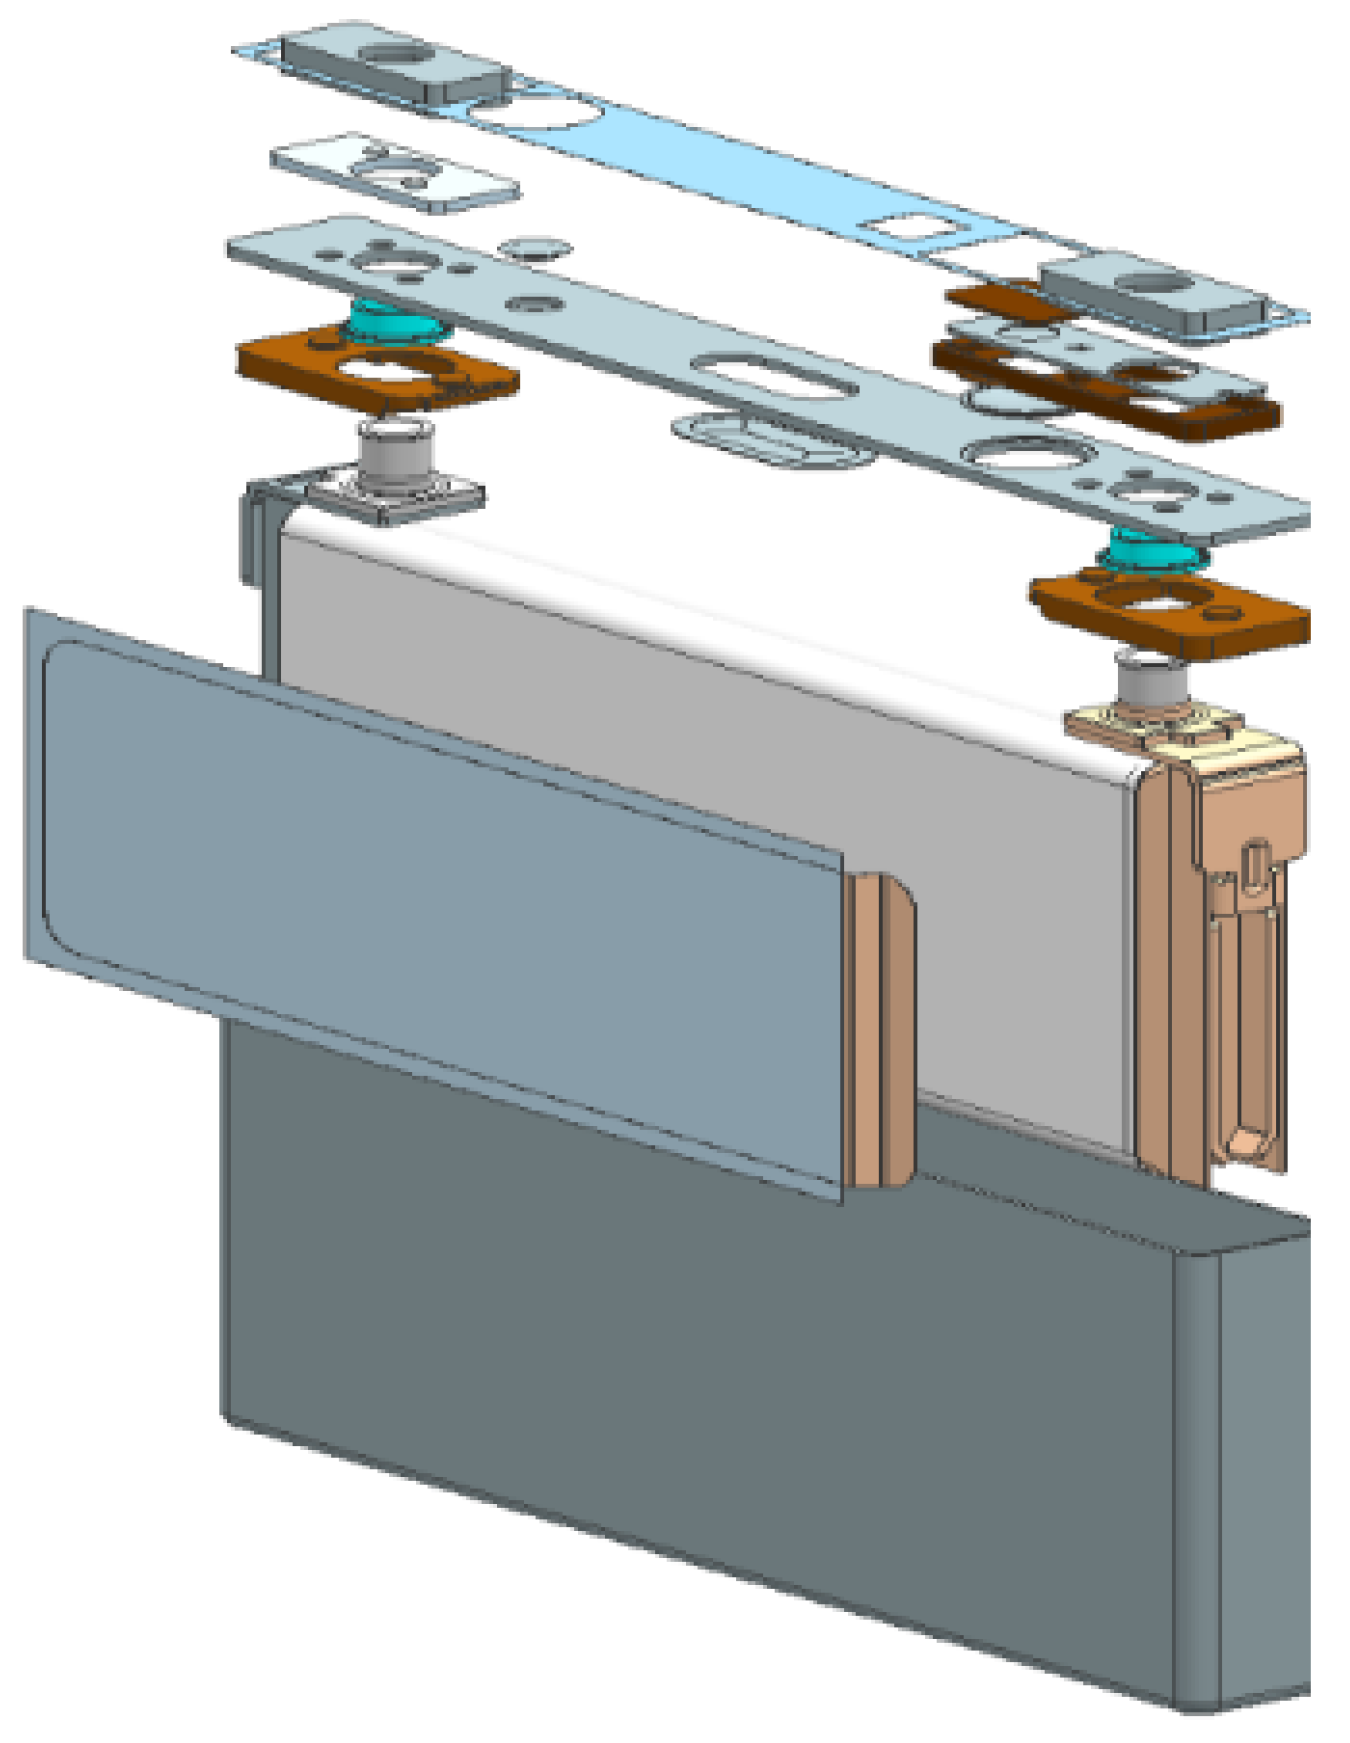
2.1. System Overview
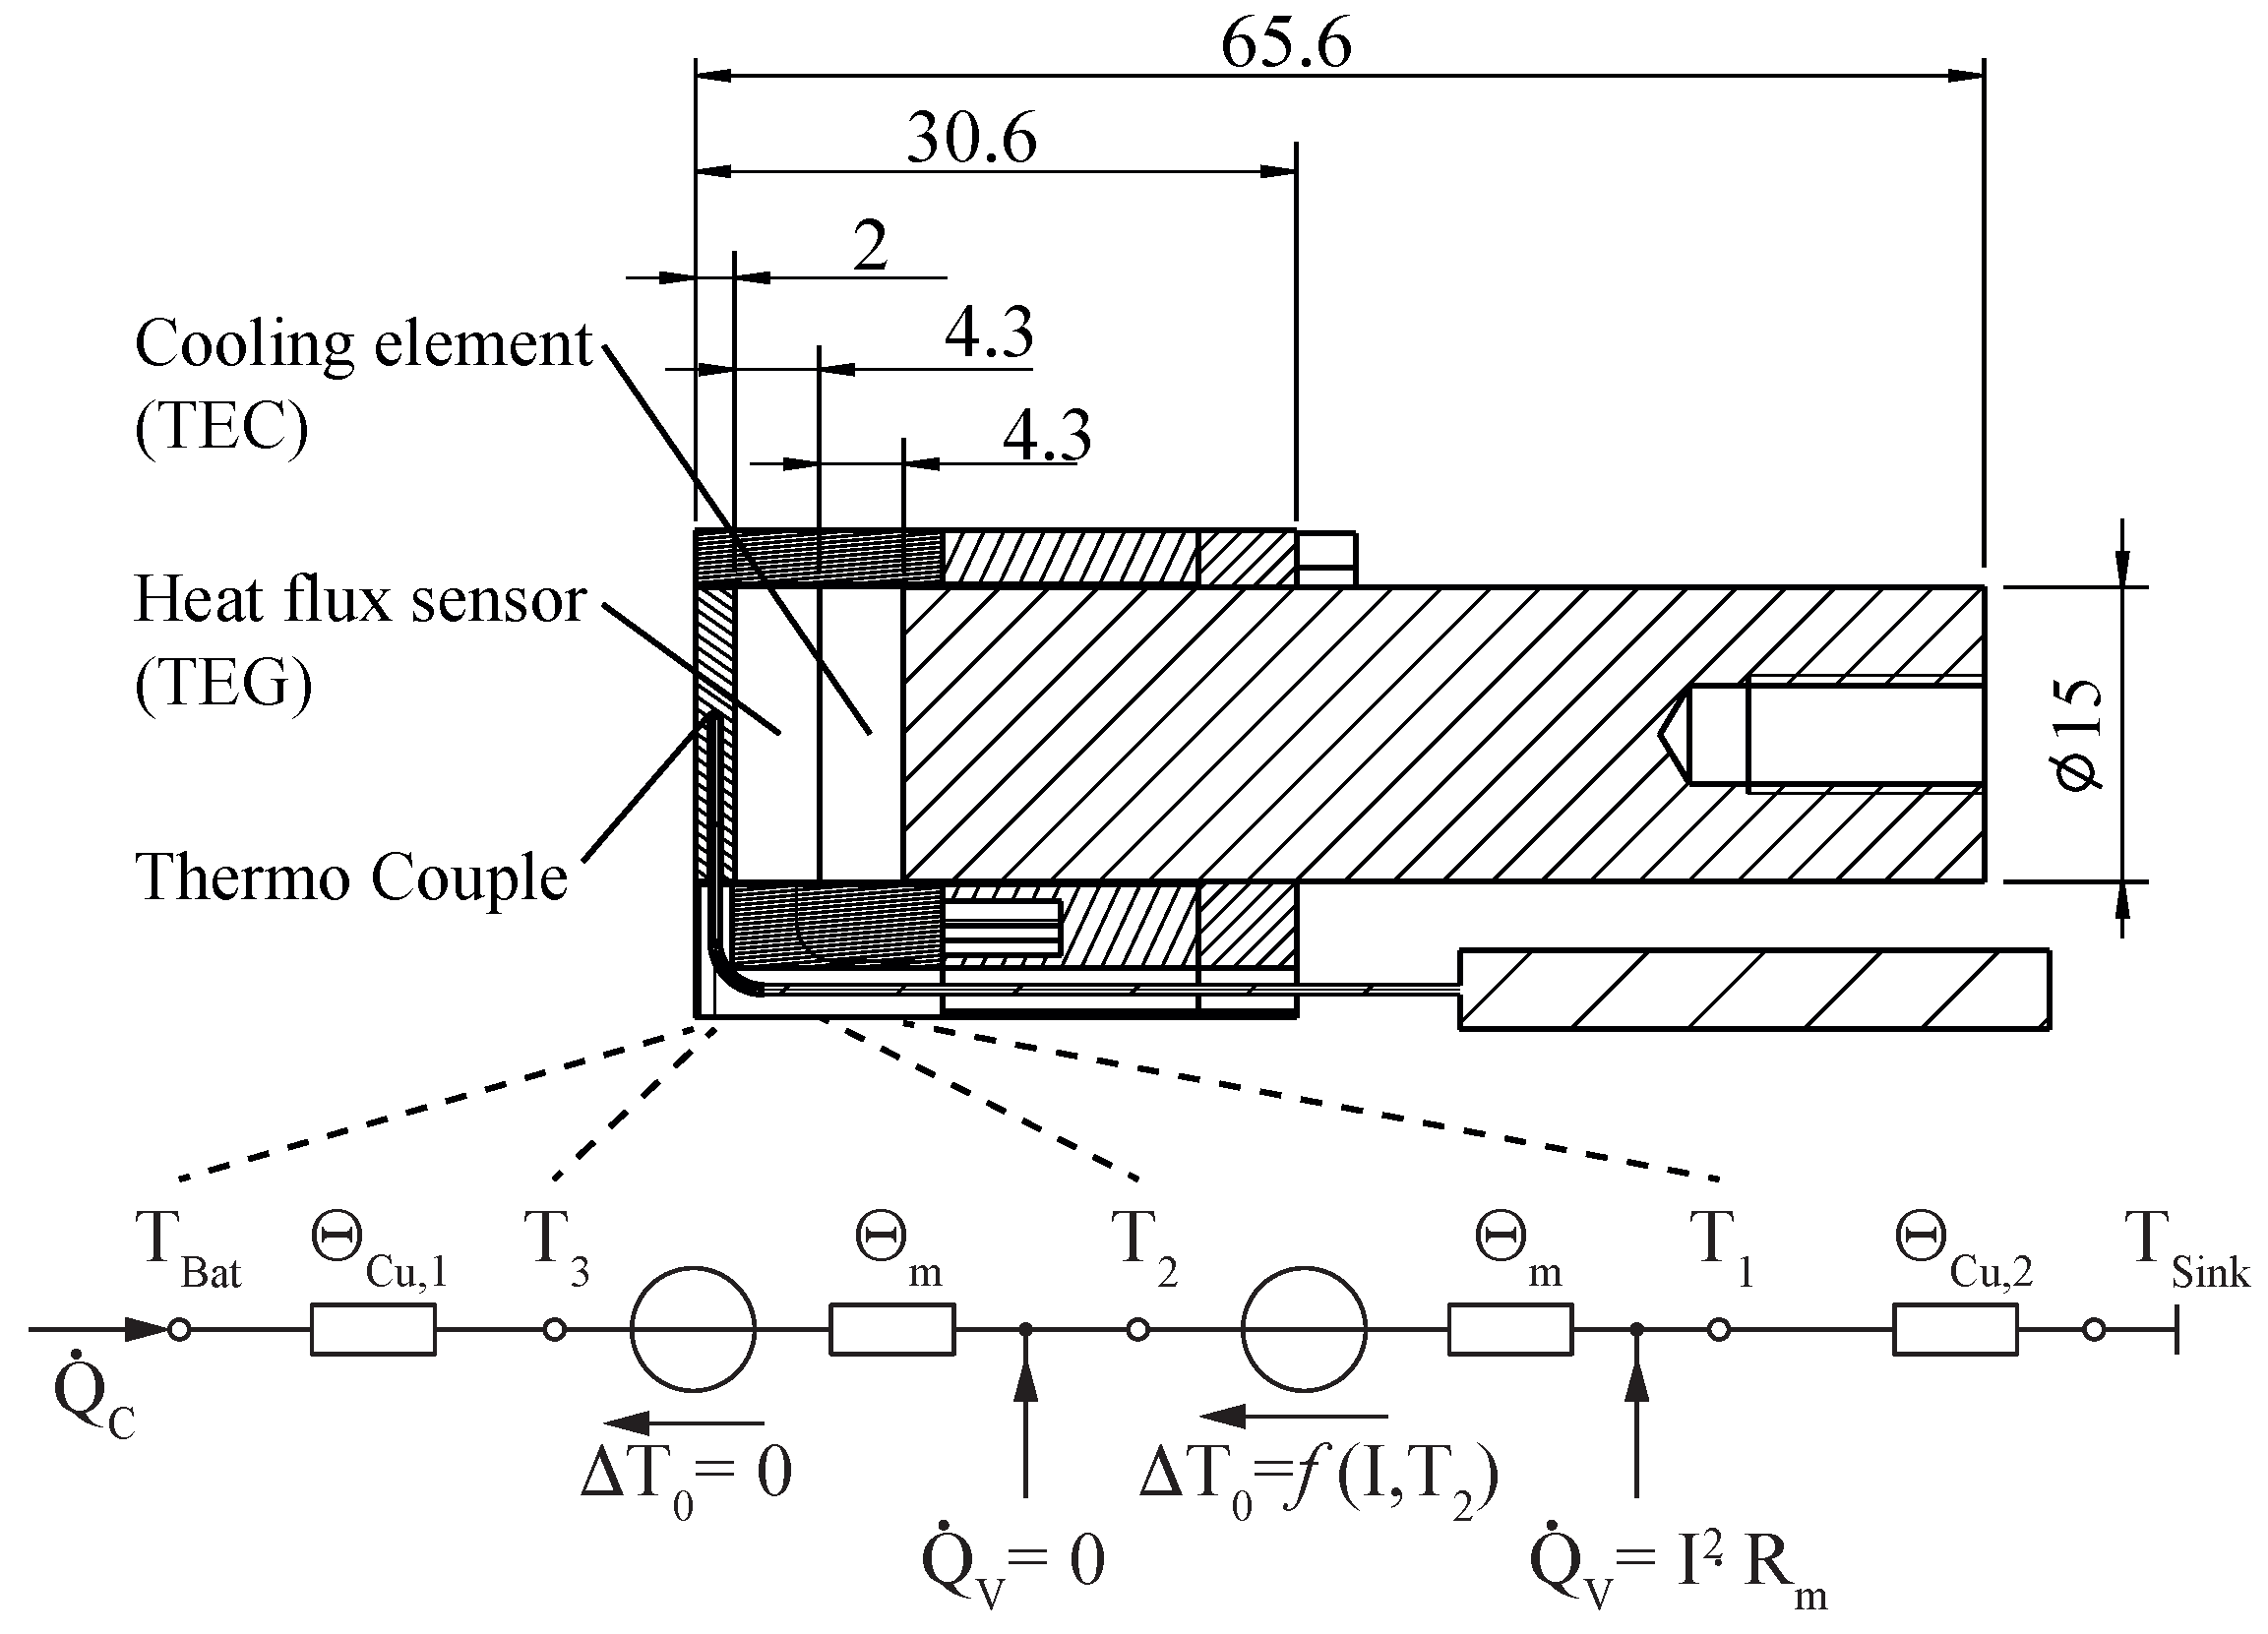
2.2. Temperature/Heat Flux Sensor Unit
3. Results and Discussion
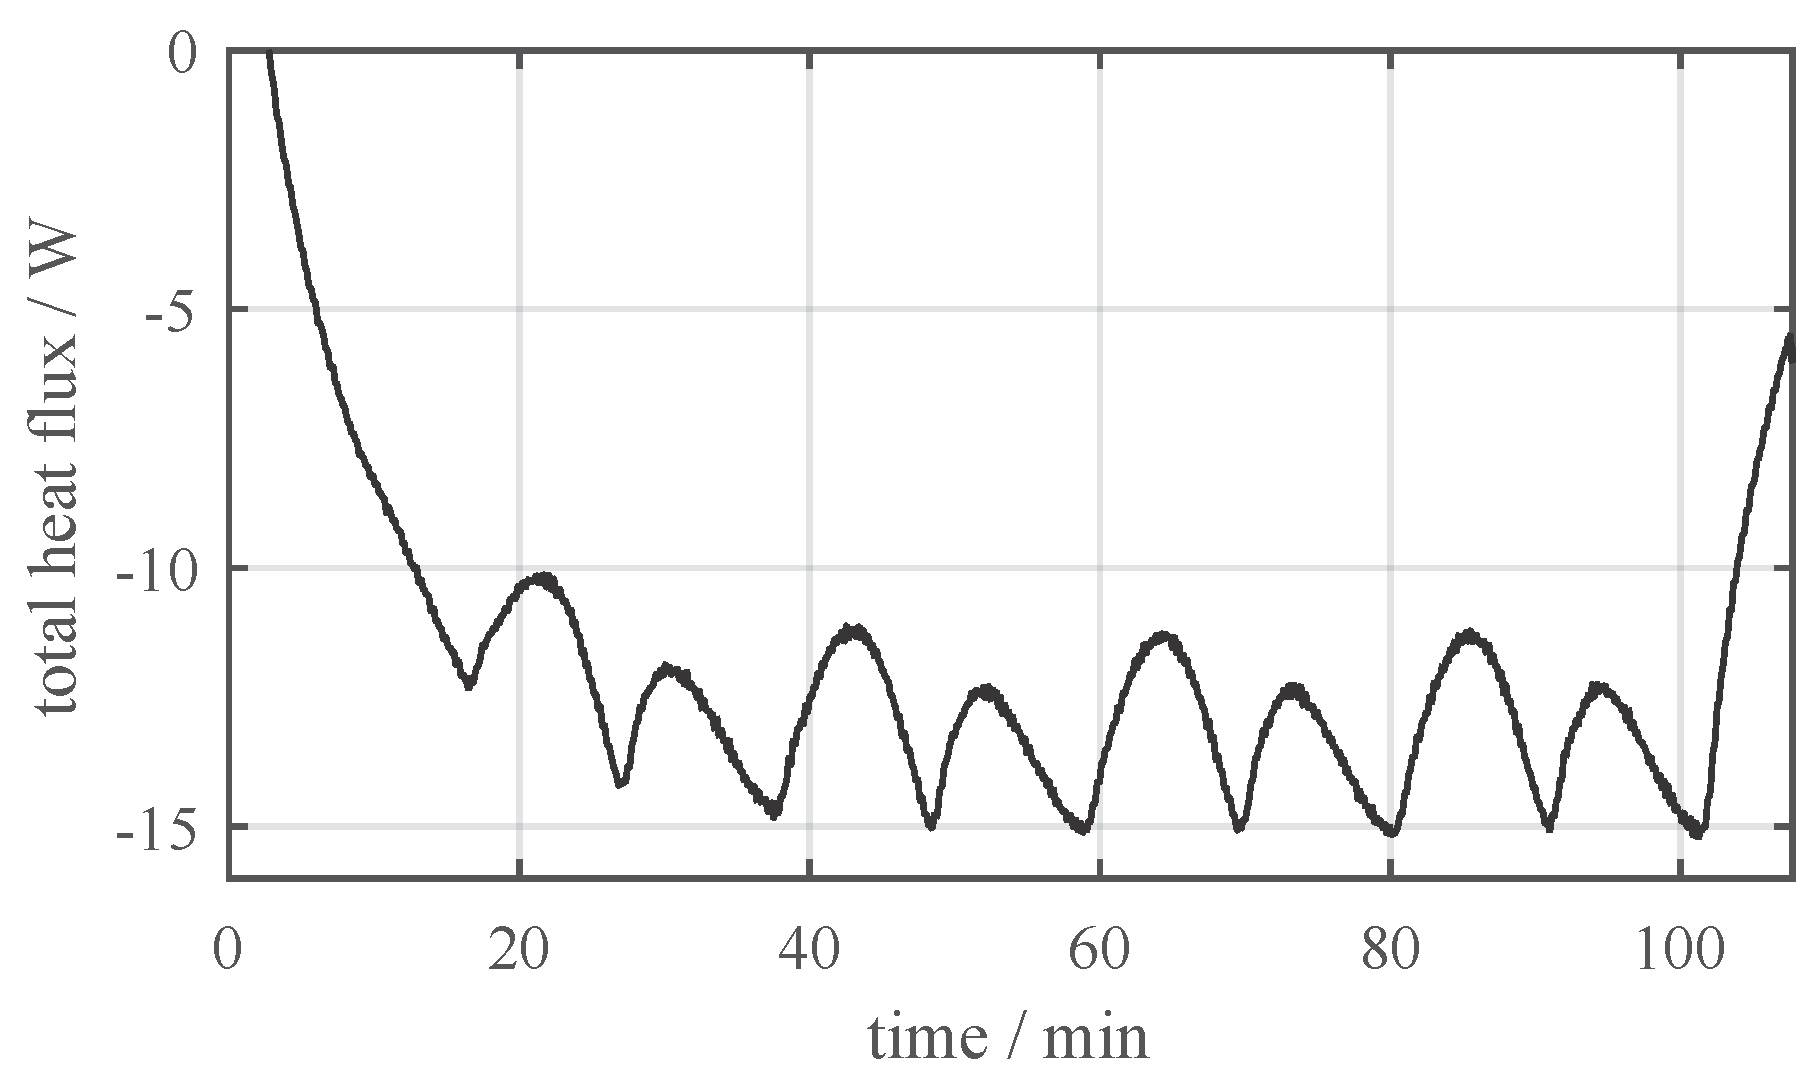
3.1. Thermal Characterization
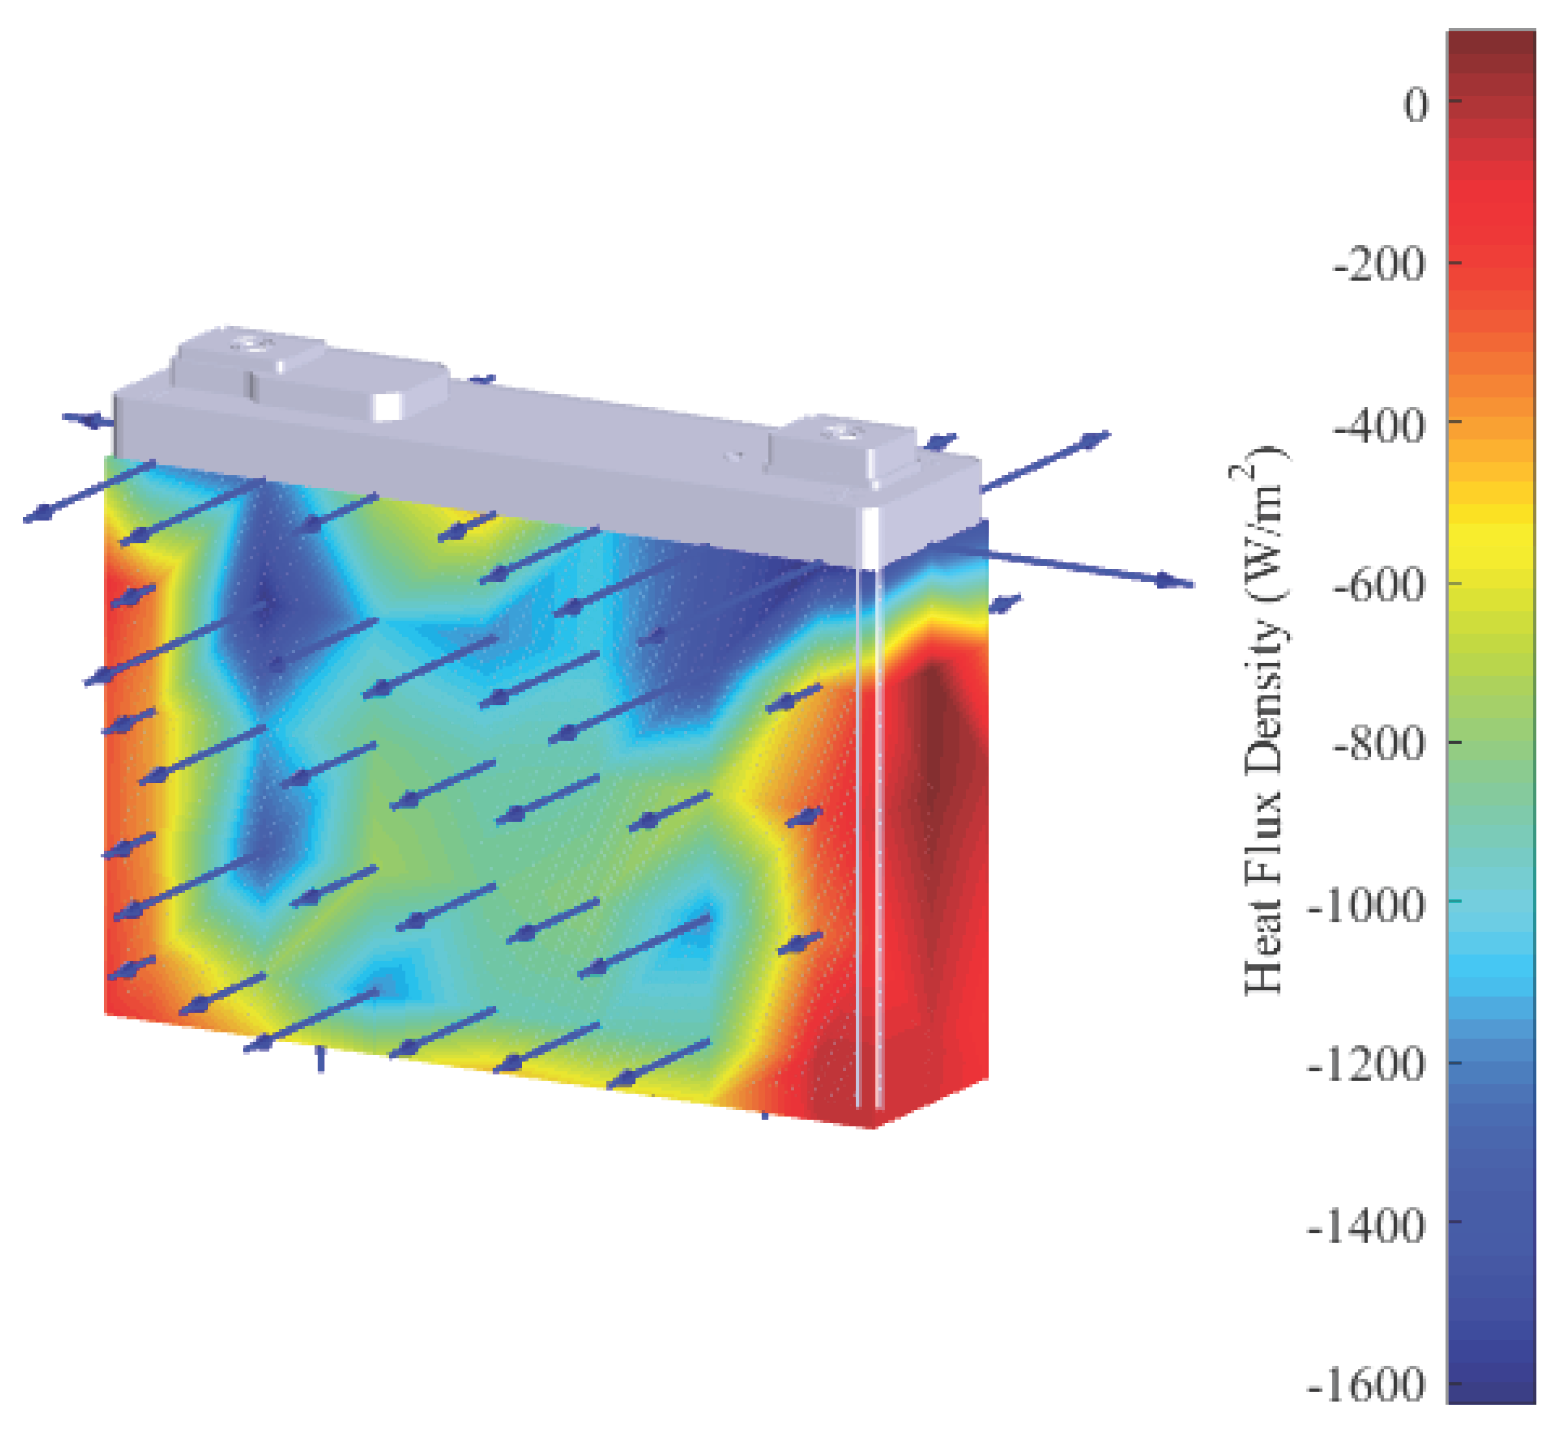
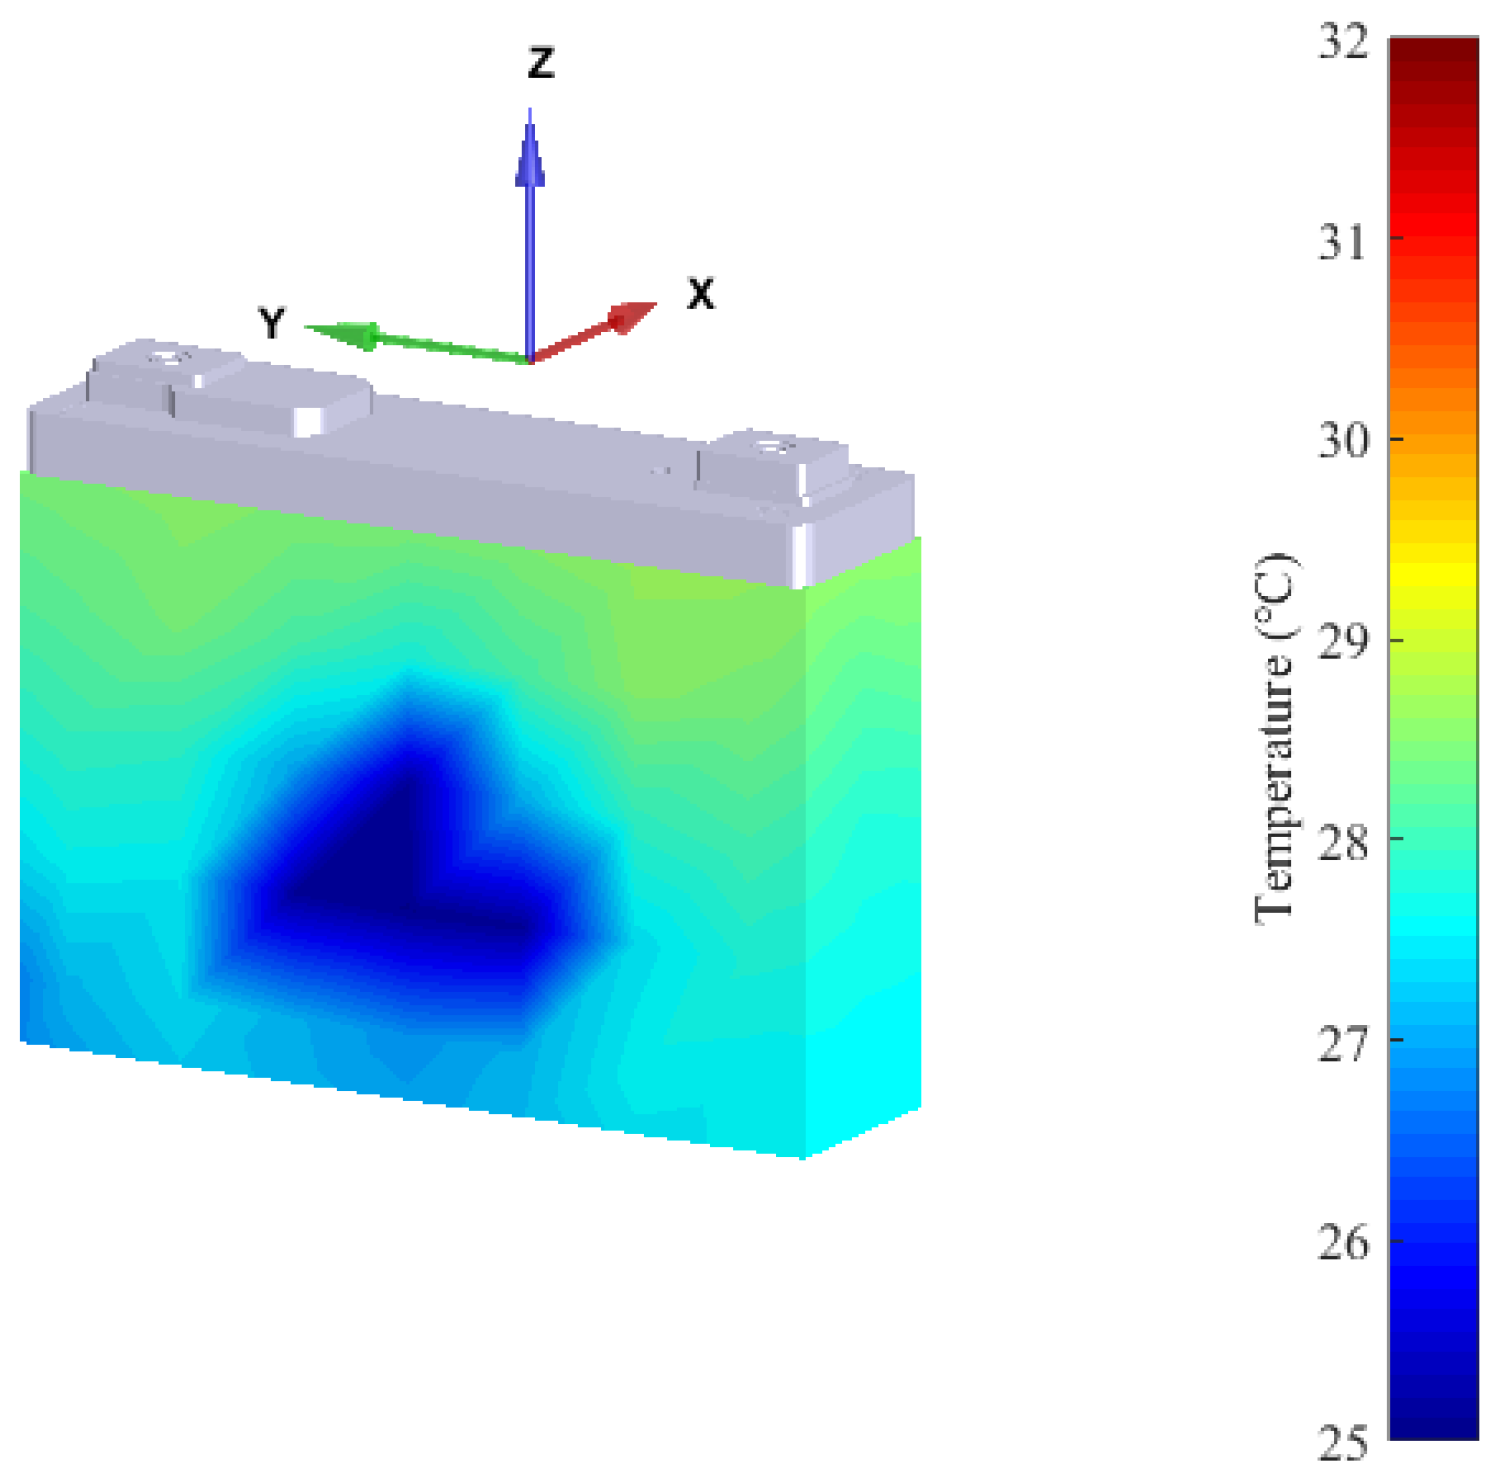
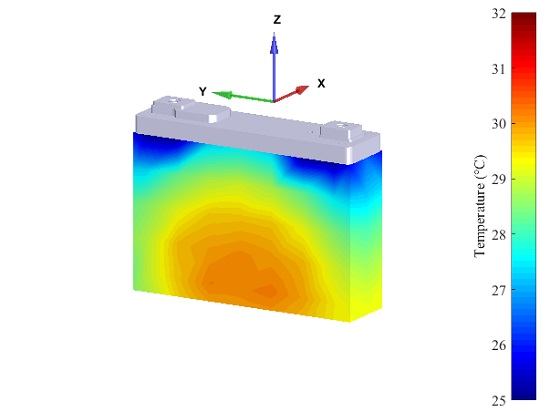
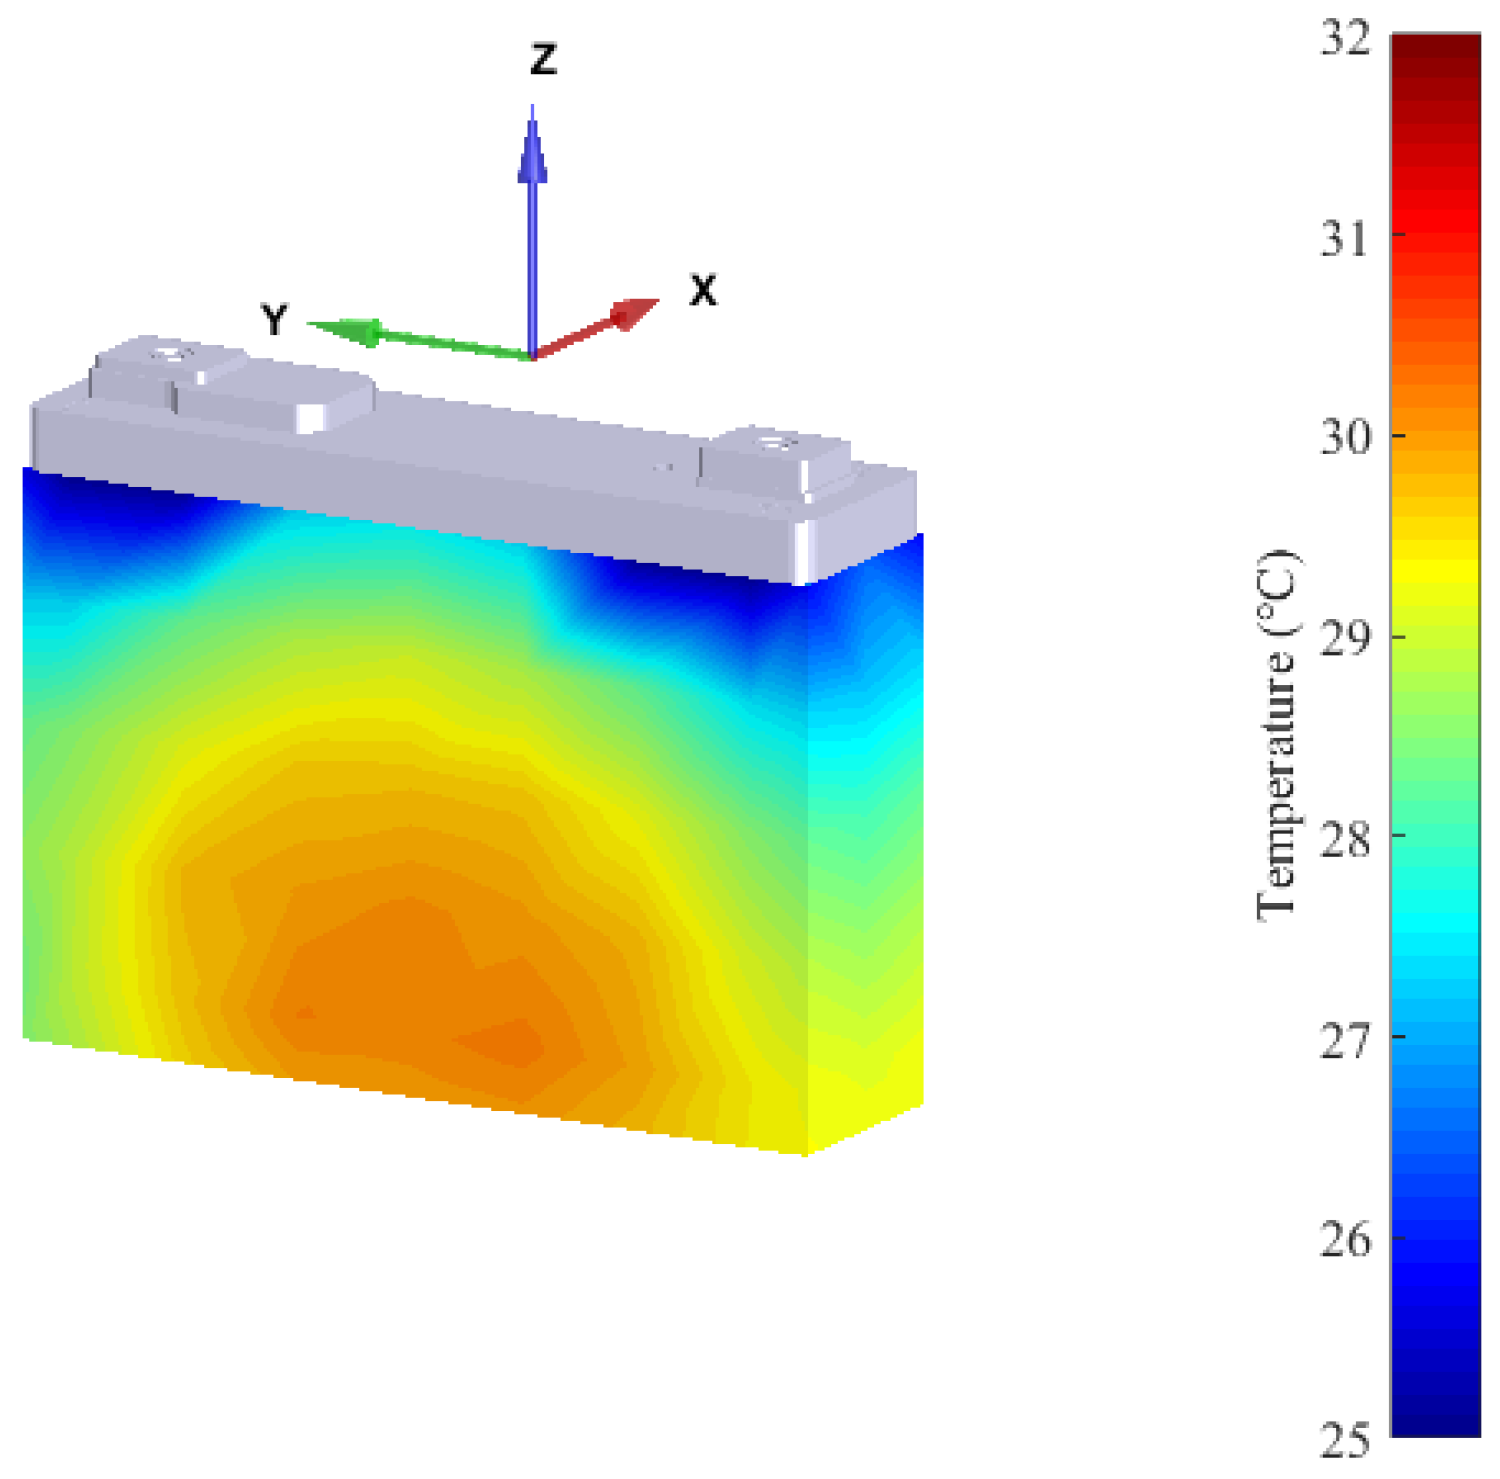
- The heat flux density on the side faces as well as on the bottom side are close to zero.
- The main part of the heat is almost uniformly released through the large front and rear side.
- The largest heat flux density was measured in close proximity to the positive terminal of the battery cell (see top right corner in Figure 5).
3.2. Cooling Strategies
4. Conclusions
Acknowledgments
Author Contributions
Conflicts of Interest
References
- Sasaki, T.; Ukyo, Y.; Novák, P. Memory effect in a lithium-ion battery. Nat. Mater. 2013, 12, 569–575. [Google Scholar] [CrossRef] [PubMed]
- Waldmann, T.; Wilka, M.; Kasper, M.; Fleischhammer, M.; Wohlfahrt-Mehrens, M. Temperature dependent ageing mechanisms in lithium-ion batteries—A Post-Mortem study. J. Power Sources 2014, 262, 129–135. [Google Scholar] [CrossRef]
- Bloom, I.; Jones, S.A.; Polzin, E.G.; Battaglia, V.S.; Henriksen, G.L.; Motloch, C.G.; Wright, R.B.; Jungst, R.G.; Case, H.L.; Doughty, D.H. Mechanisms of impedance rise in high-power, lithium-ion cells. J. Power Sources 2002, 111, 152–159. [Google Scholar] [CrossRef]
- Vetter, J.; Novák, P.; Wagner, M.R.; Veit, C.; Möller, K.C.; Besenhard, J.O.; Winter, M.; Wohlfahrt-Mehrens, M.; Vogler, C.; Hammouche, A. Ageing mechanisms in lithium-ion batteries. J. Power Sources 2005, 147, 269–281. [Google Scholar] [CrossRef]
- Troxler, Y.; Wu, B.; Marinescu, M.; Yufit, V.; Patel, Y.; Marquis, A.J.; Brandon, N.P.; Offer, G.J. The effect of thermal gradients on the performance of lithium-ion batteries. J. Power Sources 2014, 247, 1018–1025. [Google Scholar] [CrossRef]
- Gogoana, R.; Pinson, M.B.; Bazant, M.Z.; Sarma, S.E. Internal resistance matching for parallel-connected lithium-ion cells and impacts on battery pack cycle life. J. Power Sources 2014, 252, 8–13. [Google Scholar] [CrossRef]
- Abdul-Quadir, Y.; Laurila, T.; Karppinen, J.; Jalkanen, K.; Vuorilehto, K.; Skogström, L.; Paulasto-Kröckel, M. Heat generation in high power prismatic Li-ion battery cell with LiMnNiCoO2 cathode material. Int. J. Energy Res. 2014, 38, 1424–1437. [Google Scholar] [CrossRef]
- Bernardi, D.; Pawlikowski, E.; Newman, J. A general energy balance for battery systems. J. Electrochem. Soc. 1985, 132, 5–12. [Google Scholar] [CrossRef]
- Chen, K.; Unsworth, G.; Li, X. Measurements of heat generation in prismatic Li-ion batteries. J. Power Sources 2014, 261, 28–37. [Google Scholar] [CrossRef]
- Veth, C.; Dragicevic, D.; Merten, C. Thermal characterizations of a large-format lithium ion cell focused on high current discharges. J. Power Sources 2014, 267, 760–769. [Google Scholar] [CrossRef]
- Lin, C.; Xu, S.; Li, Z.; Li, B.; Chang, G.; Liu, J. Thermal analysis of large-capacity LiFePO4 power batteries for electric vehicles. J. Power Sources 2015, 294, 633–642. [Google Scholar] [CrossRef]
- Murashko, K.A.; Mityakov, A.V.; Pyrhönen, J.; Mityakov, V.Y.; Sapozhnikov, S.S. Thermal parameters determination of battery cells by local heat flux measurements. J. Power Sources 2014, 271, 48–54. [Google Scholar] [CrossRef] [Green Version]
- Mckinnon, C.; Bernardini, R.R.; Thresher, W.; Ruis, S.L.; Yarbrough, D.W. Commercial bismuth telluride-based Peltier plates for use as heat flux transducers. AIRAH Ecolibrium 2010, 32–36. [Google Scholar]
- Rowe, D.M. CRC Handbook of Thermoelectrics; CRC Press: Boca Raton, FL, USA, 1995. [Google Scholar]
- Lineykin, S.; Ben-Yaakov, S. Modeling and analysis of thermoelectric modules. IEEE Trans. Ind. Appl. 2007, 43, 505–512. [Google Scholar] [CrossRef]
- Liu, G.; Ouyang, M.; Lu, L.; Li, J.; Han, X. Analysis of the heat generation of lithium-ion battery during charging and discharging considering different influencing factors. J. Therm. Anal. Calorim. 2014, 116, 1001–1010. [Google Scholar] [CrossRef]
- Pavoni, F. The Lithium-Battery Value Chain. Available online: http://www.icatconf.com/Sunumlar/SESSION4/3_LiB-Market-Overview-SHORT_2012-08-03_TR%20version.pdf (accessed on 4 January 2017).
- Damay, N.; Forgez, C.; Bichat, M.P.; Friedrich, G. Thermal modeling of large prismatic LiFePO4/graphite battery. Coupled thermal and heat generation models for characterization and simulation. J. Power Sources 2015, 283, 37–45. [Google Scholar] [CrossRef]


| Parameter | Description | Value |
|---|---|---|
| Thermal resistance of peltier element | 20.3 K | |
| Ohmic resistance of peltier element | 1.3 Ω | |
| Seebeck coefficient | 13 m | |
| Thermal resistance of left copper part | 0.03 K | |
| Thermal resistance of right copper part | 0.30 K |
| Position | Heat Flux Density | Surface Area |
|---|---|---|
| Side face (negative) | 219 W | 5625 |
| Side face (positive) | 295 W | 5625 |
| Bottom side | 119 W | 7875 |
| Front side | 964 W | 21,875 |
| Rear side | 952 W | 21,875 |
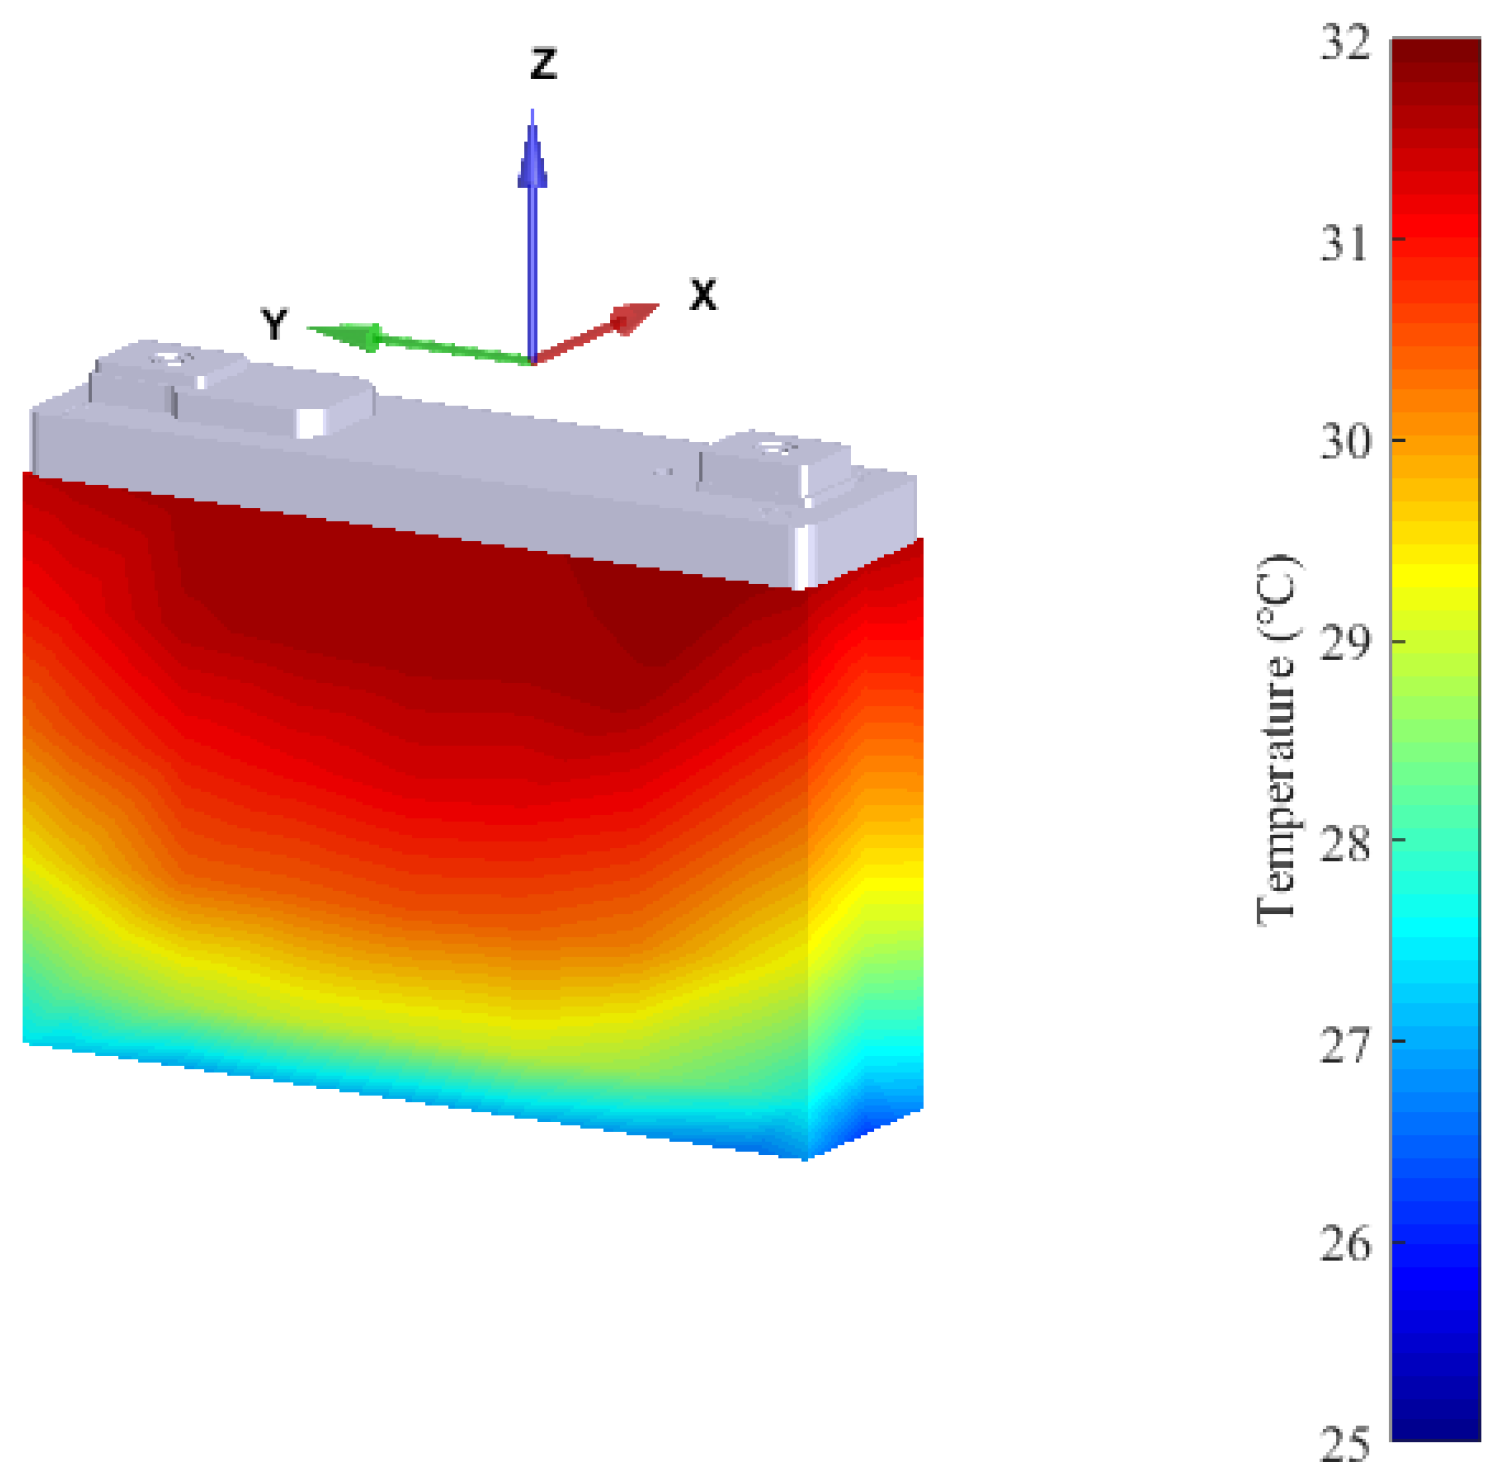
| Sensor z-coordinate | Front Side@y = 0 mm | Side-Face@y = 86.5 mm |
|---|---|---|
| mm | 31.6 | 31.5 |
| mm | 31.6 | 30.7 |
| mm | 31.2 | 30.0 |
| mm | 30.4 | 29.0 |
| mm | 28.9 | 27.6 |
| mm | 25.1 | 25.3 |
© 2017 by the authors; licensee MDPI, Basel, Switzerland. This article is an open access article distributed under the terms and conditions of the Creative Commons Attribution (CC BY) license (http://creativecommons.org/licenses/by/4.0/).
Share and Cite
Christen, R.; Rizzo, G.; Gadola, A.; Stöck, M. Test Method for Thermal Characterization of Li-Ion Cells and Verification of Cooling Concepts. Batteries 2017, 3, 3. https://doi.org/10.3390/batteries3010003
Christen R, Rizzo G, Gadola A, Stöck M. Test Method for Thermal Characterization of Li-Ion Cells and Verification of Cooling Concepts. Batteries. 2017; 3(1):3. https://doi.org/10.3390/batteries3010003
Chicago/Turabian StyleChristen, Rouven, Gerhard Rizzo, Alfred Gadola, and Max Stöck. 2017. "Test Method for Thermal Characterization of Li-Ion Cells and Verification of Cooling Concepts" Batteries 3, no. 1: 3. https://doi.org/10.3390/batteries3010003