
Influence of Using Metallic Na on the Interfacial and Transport Properties of Na-Ion Batteries
by
 , ,
, ,
Maider Zarrabeitia
1,2 ,
,
Miguel Ángel Muñoz-Márquez
1,*,
Francesco Nobili
3,
Teófilo Rojo
1,2 and
Montse Casas-Cabanas
1 1
CIC energiGUNE, Parque Tecnológico de Álava, Albert Einstein 48, 01510 Miñano, Spain
2
Departamento de Química Inorgánica, Universidad del País Vasco UPV/EHU, P.O. Box 664, 48080 Leioa, Spain
3
Scuola di Scienze e Tecnologie—Sezione Chimica, Università di Camerino, Via S. Agostino 1, 62032 Camerino, Italy
*
Author to whom correspondence should be addressed.
Batteries 2017, 3(2), 16; https://doi.org/10.3390/batteries3020016
Submission received: 30 March 2017
/
Revised: 26 April 2017
/
Accepted: 2 May 2017
/
Published: 10 May 2017
(This article belongs to the Special Issue Physical Properties of Sodium-Ion Battery Materials)
Abstract
:Na2Ti3O7 is a promising negative electrode for rechargeable Na-ion batteries; however, its good properties in terms of insertion voltage and specific capacity are hampered by the poor capacity retention reported in the past. The interfacial and ionic/electronic properties are key factors to understanding the electrochemical performance of Na2Ti3O7. Therefore, its study is of utmost importance. In addition, although rather unexplored, the use of metallic Na in half-cell studies is another important issue due to the fact that side-reactions will be induced when metallic Na is in contact with the electrolyte. Hence, in this work the interfacial and transport properties of full Na-ion cells have been investigated and compared with half-cells upon electrochemical cycling by means of X-ray photoelectron spectroscopy (conventional XPS and Auger parameter analysis) and electrochemical impedance spectroscopy. The half-cell has been assembled with C-coated Na2Ti3O7 against metallic Na whilst the full-cell uses C-coated Na2Ti3O7 as negative electrode and NaFePO4 as positive electrode, delivering 112 Wh/kganode+cathode in the 2nd cycle. When comparing both types of cells, it has been found that the interfacial properties, the OCV (open circuit voltage) and the electrode–-electrolyte interphase behavior are more stable in the full-cell than in the half-cell. The electronic transition from insulator to conductor previously observed in a half-cell for Na2Ti3O7 has also been detected in the full-cell impedance analysis.
1. Introduction
Rechargeable Na-ion batteries (NIBs) are becoming one of the most promising technologies for stationary applications, while Li-ion batteries (LIBs) are more focused on the consumer electronics market and electric vehicle industry [1,2]. However, in NIBs, to find an optimum negative electrode is a challenge [3]. Among negative electrode materials for rechargeable NIBs, the most studied are hard carbons (HC), phosphorus/carbon composites and Na alloys with Si, Ge, Sn and Sb elements [3,4,5,6]. However, they exhibit safety hazards and/or high cost which reduces the interest to use them as negative electrode in NIBs. Metal oxides are another possible negative electrode and, amongst them, the Na2Ti3O7 is one of the most promising ones because of its good specific capacity close to 200 mAh/g, non-toxicity, abundant resources, fast processing and low cost. Moreover, it is the oxide with the lowest Na+ insertion/extraction potential at 0.3 V vs. Na+/Na [7,8]. The main advantage of this low insertion voltage is the possibility of delivering both high energy densities and high power densities; the former when used as a negative electrode vs. a positive electrode with a high Na+ insertion/extraction potential in a full-cell, the latter by precluding Na plating at high C-rates. However, its main drawback is the capacity retention [9,10,11] for which the best result was achieved by controlling the parameters of the solid-state synthesis method, achieving ~78% of capacity retention after 100 cycles [12]. There are several factors proposed to contribute to this underperformance: (i) surface corrosion, owing to the formation of Na2CO3 during the synthesis; (ii) instability of the Solid Electrolyte Interphase (SEI) upon electrochemical cycling; (iii) polyvinylidene fluoride (PVdF) degradation, due to the Na+-induced dehydrifluorination reaction of the PVdF, which will lead to hydrofluoric acid (HF) formation; and (iv) poor electronic conductivity of Na2Ti3O7 which is an insulator [12,13,14]. Besides, the instability of metallic Na in organic electrolytes has been recently reported and, since metallic Na is employed as counter and reference electrodes in the so-called half-cells, this could be another factor which can influence the capacity fading [15]. Iermakova et al. showed that in a symmetric Na/Na cell, the measured charge during reduction was larger than during oxidation, which has been related with irreversible electrolyte decomposition and/or electrical contact loss between metallic Na and current collector. Moreover, electrochemical impedance spectroscopy (EIS) experiments concluded that the interfacial resistance associated to the SEI and charge transfer (RSEI+RCT) increased upon time in the Na/Na cell, in contrast with the interfacial resistance stability displayed by equivalent Li/Li cells. This means that the SEI layer in the Na/Na cell was continuously growing up and/or had an unstable behavior. Additionally, when the same experiments were carried out in a HC/Na cell, a similar behavior was observed and the HC-electrolyte interface became more resistive upon time, while the same interface remains constant in a HC/Li cell [15]. This suggests that metallic Na can influence the stability and composition of the SEI layer as well as the electrochemical properties of the Na-intercalation material under study. Indeed, a different behavior of the studied Na-insertion material between half- and full-cell configurations was found in several works [16]. In fact, in the last few years, most of the published works were focused on full-cells, often using HC as negative electrode [17,18,19,20,21]. Nevertheless, there are also a few full-cell studies using Na2Ti3O7 as negative electrode [22,23]. The most relevant result was published by Xu et al., for which a C-coated Na2Ti3O7 / P2-Na0.80Li0.12Ni0.22Mn0.66O2 full-cell was assembled delivering a 105 mAh/ganode after 25 cycles and 100 Wh/kganode+cathode with an average voltage of 3.1 V.
In the current work, in order to observe the influence of metallic Na on the formed SEI/SPI (Solid Permeable Interphase, which is formed in the positive electrode and also often called SEI) layers and on the ionic/electronic conductivity of C-coated Na2Ti3O7, the composition and stability of the SEI/SPI layers and transport properties of the C-coated Na2Ti3O7 have been studied by means of X-ray photoelectron spectroscopy (XPS) and EIS and compared to previous results obtained in a half-cell [13].
2. Results and Discussion
2.1. Galvanostatic Experiments in a Full-Cell
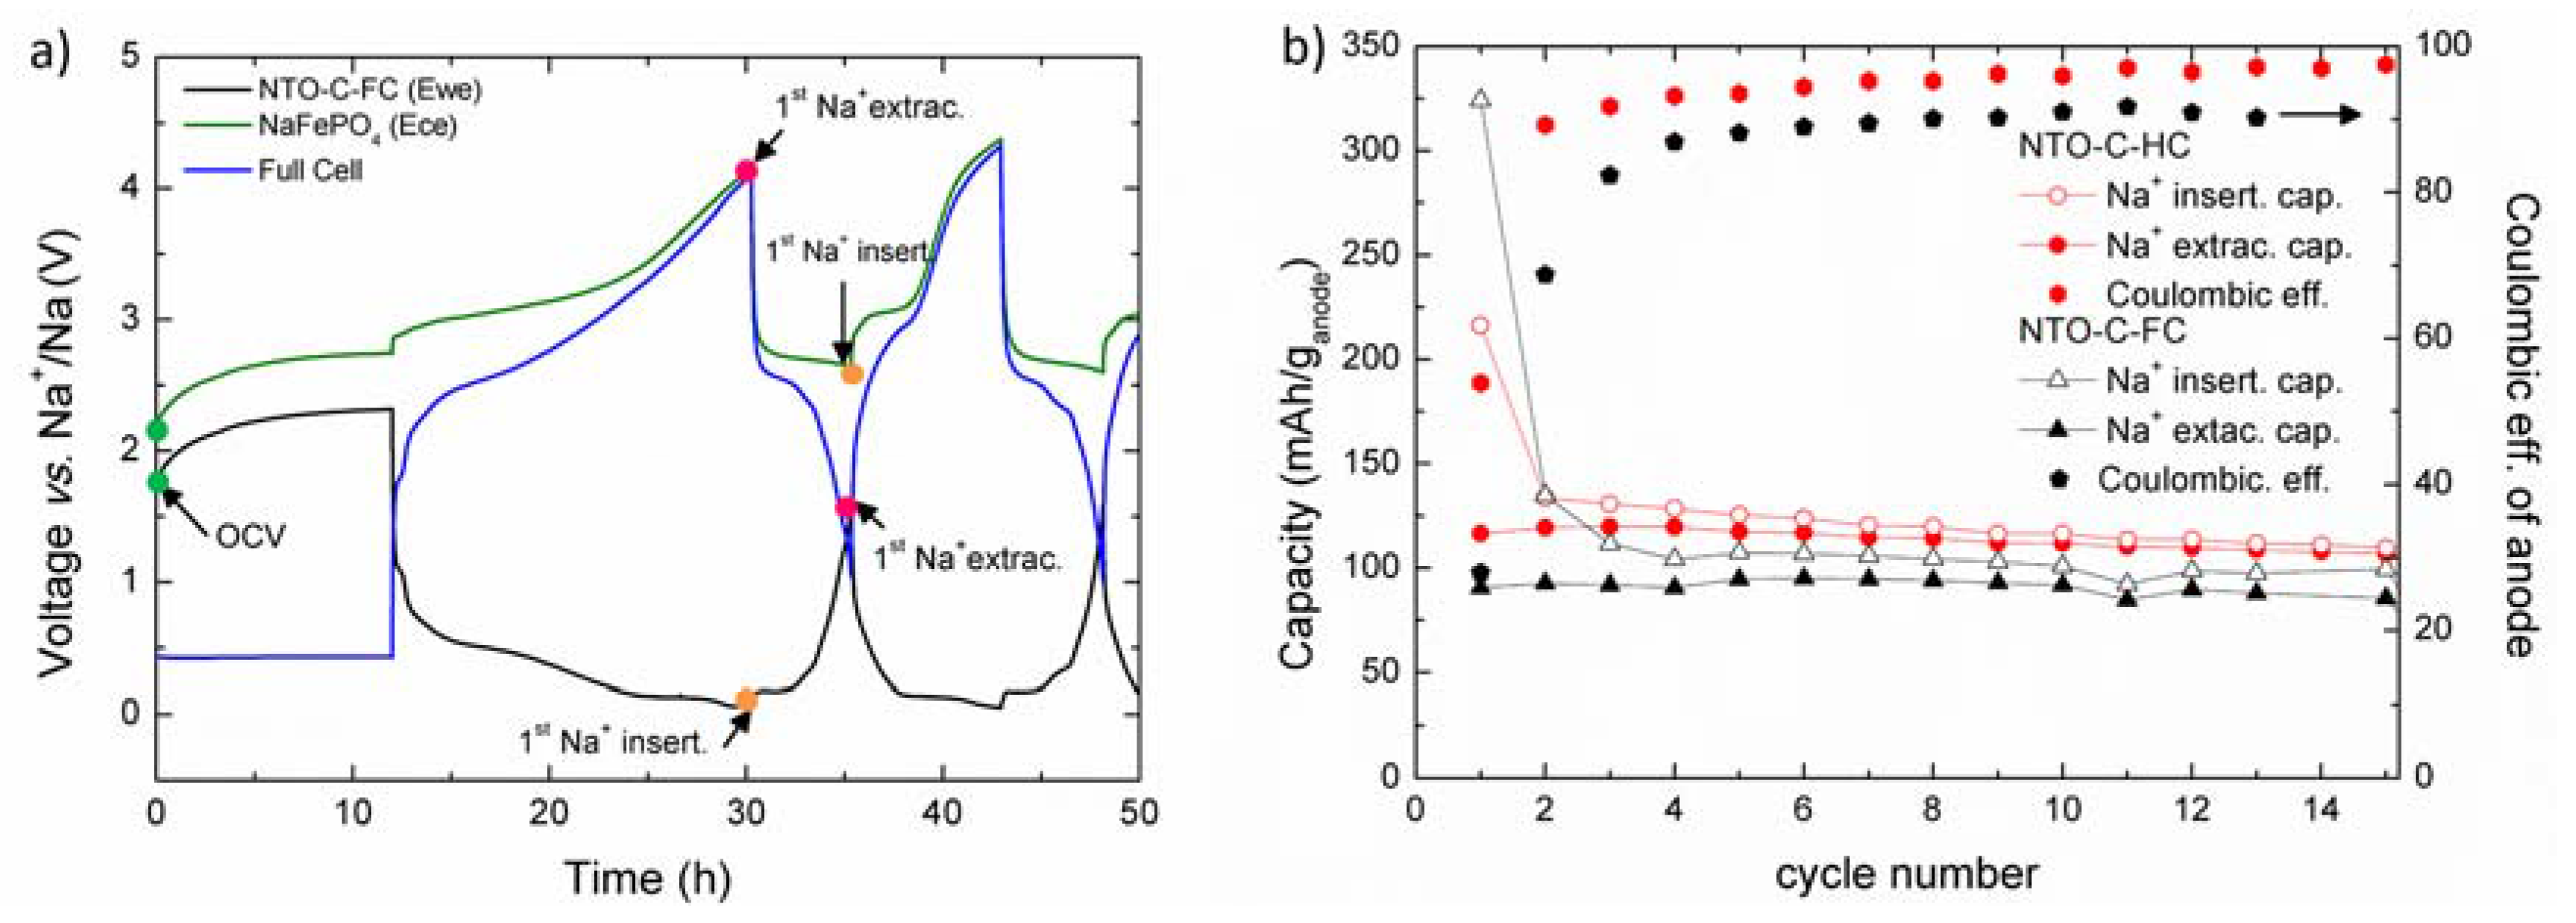
The galvanostatic experiments in a C-coated Na2Ti3O7/NaFePO4 full-cell (the former called NTO-C-FC hereinafter) were performed using a three-electrode configuration. Figure 1a shows the voltage profile of the NTO-C-FC (black curve), NaFePO4 (green curve) and the curve of the full-cell (blue curve). In Figure 1b, the comparison between the discharge and charge capacity of the C-coated Na2Ti3O7 electrodes in half-cells and full-cells is gathered. The irreversibility of the first cycle is larger in a full-cell (233.7 mAh/ganode) than in a half-cell (100.1 mAh/g), which might be because a thicker SEI layer is formed; however, this will be later discussed on the basis of the XPS results. Nevertheless, in the following cycles, the negative electrode delivers similar capacities for the full and half-cell; showing a stable capacity around 100 mAh/ganode in the 15th cycle. The energy density of the full-cell has been calculated to be 112 Wh/kganode+cathode in the 2nd cycle. Regarding the coulombic efficiency, the full-cell consistently reported slightly lower values than the half-cell. However, the full-cell coulombic efficiency increased gradually upon cycling until >90%, which can be related with the cell configuration: the pressure and contact between negative and positive electrode is more critical in three-electrode cell configuration than in two-electrode one.
2.2. Study of the SEI/SPI Layers by Conventional XPS Experiments
The SEI and SPI layer evolution upon electrochemical cycling of NTO-C-FC and NaFePO4 electrodes, when they are assembled in a full-cell, has been investigated by XPS at different charge states (open circuit voltage (OCV) (green), 1st Na+ insertion (orange) and 1st Na+ extraction (pink)) as highlighted in Figure 1a.
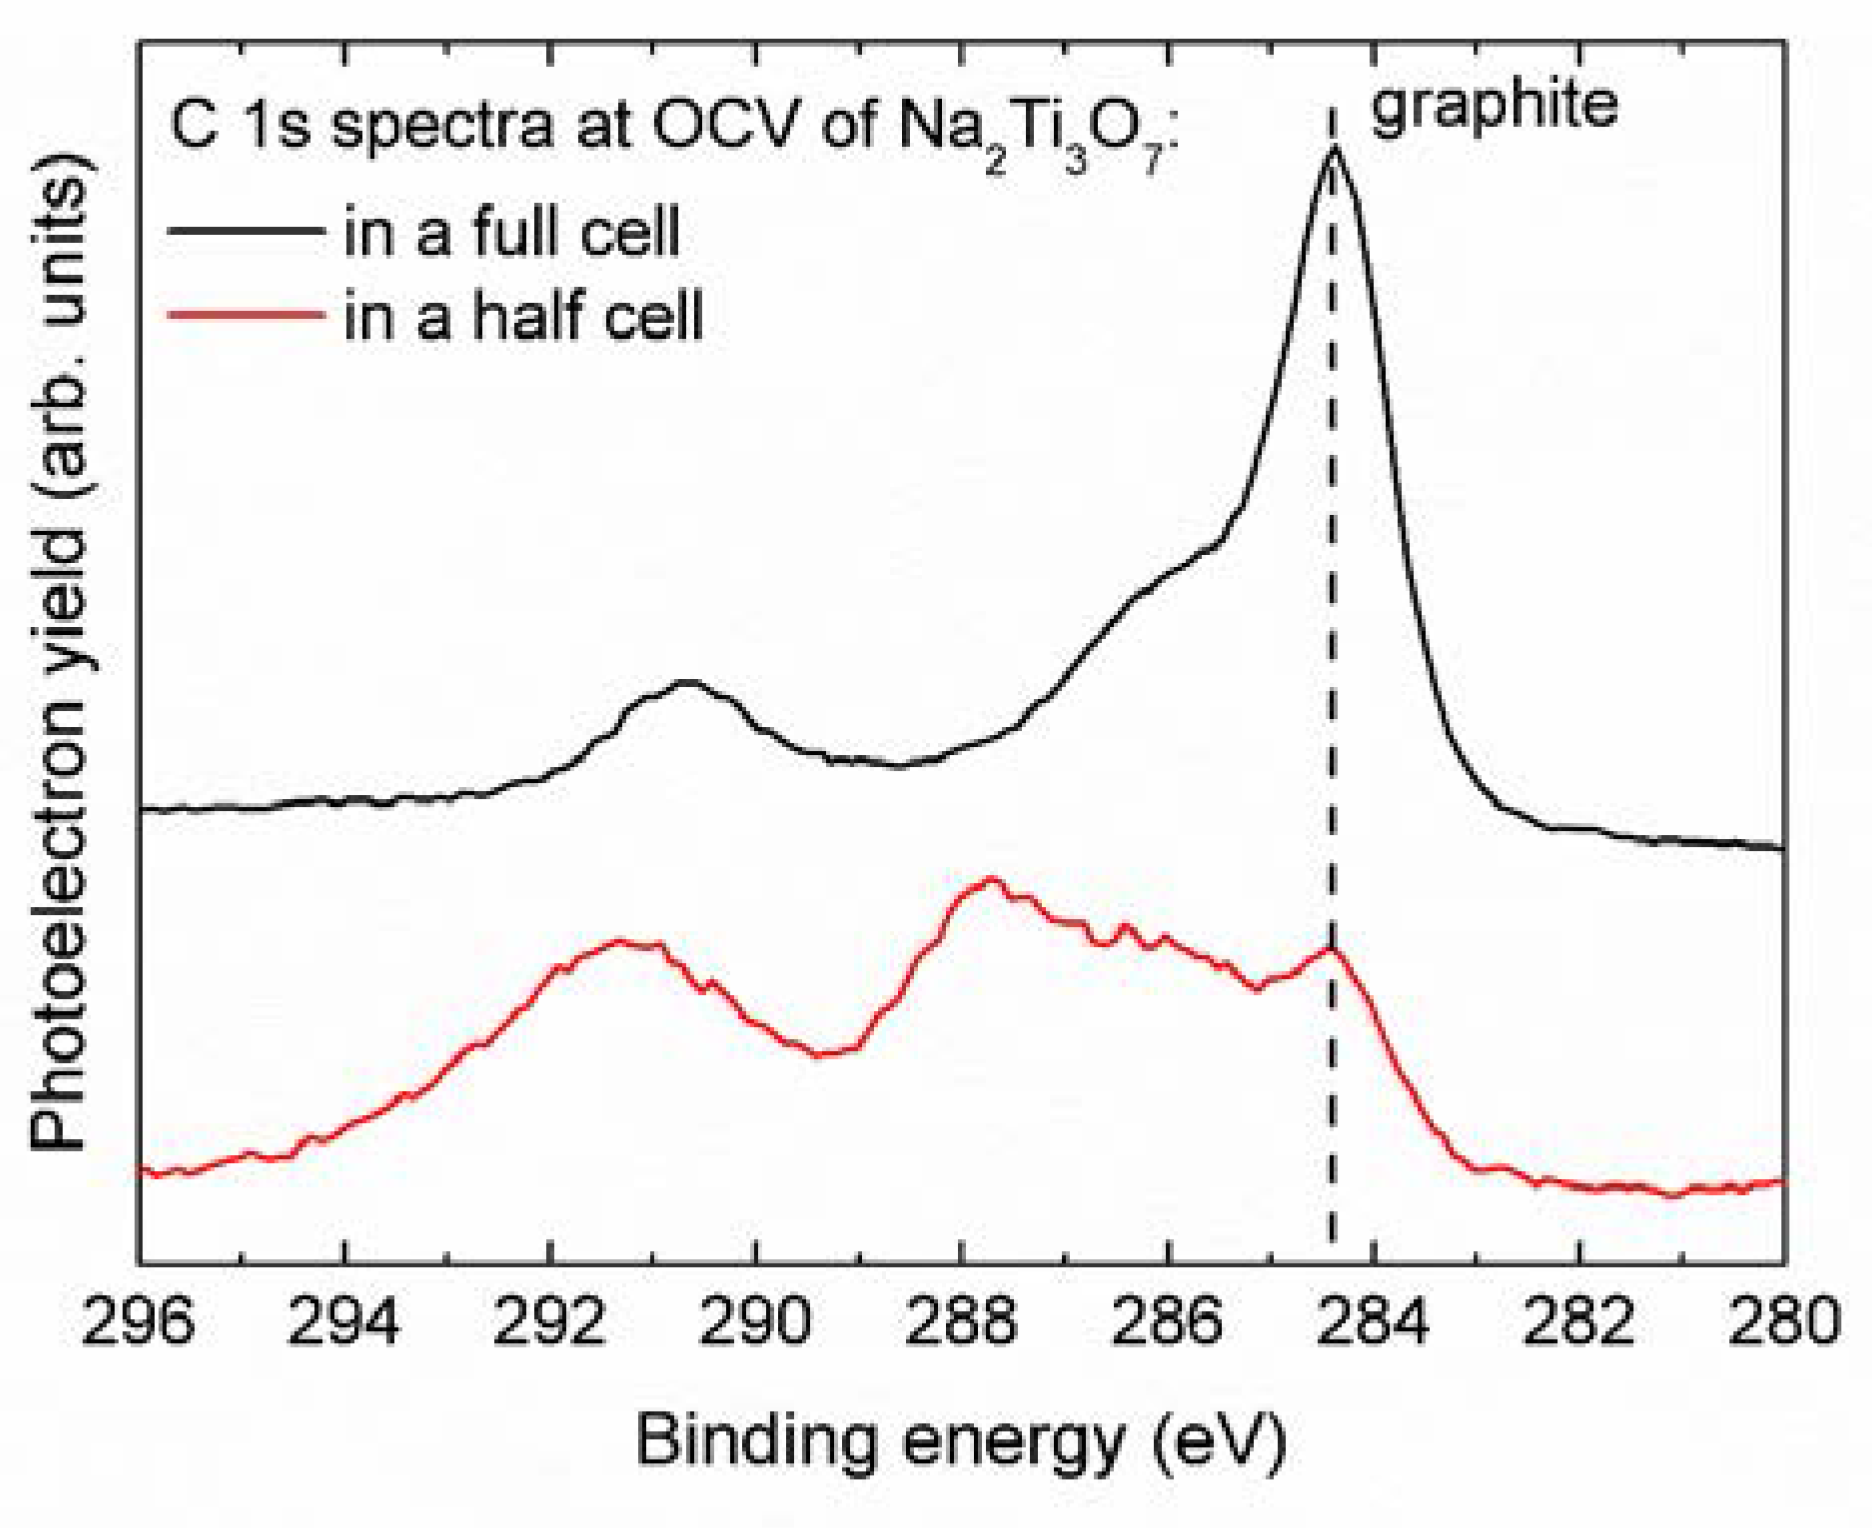
Figure 2 shows the C 1s (a) and O 1s (b) photoemission lines of NTO-C-FC and NaFePO4 electrodes. Both photoemission lines provide information about the electrolyte decomposition products and stability of the SEI (NTO-C-FC)/SPI (NaFePO4) layers upon electrochemical cycling. The different components of the C-based compounds in the C 1s spectra have been assigned on the basis of previous XPS studies of C-based materials [24]. The main component of the C 1s peak in the OCV electrode of NTO-C-FC appears at 284.4 eV and corresponds to a graphitic-like compound, in contrast with the C-coated Na2Ti3O7 electrode at OCV when it is assembled in a half-cell (see Figure S1 in the Supplementary Information) for which the graphitic component is less intense due to the formation of a surface layer result of electrolyte decomposition. This behavior is in agreement with our previous results in not C-coated Na2Ti3O7 electrode at OCV when it is assembled also in a half-cell (hereinafter called NTO-HC) [13]. Hence, this result means that in the NTO-C-FC electrodes, when metallic Na is avoided, the decomposition of the electrolyte at OCV is almost negligible on the surface of the Super C65 and/or C-coating, but when metallic Na is in the media, the electrolyte decomposition already starts before applying any current to the cell, which can influence negatively on the electrochemical properties of Na2Ti3O7.
After the 1st Na+ insertion in the NTO-C-FC electrode, the intensity of the graphite peak at 284.4 eV is reduced due to the SEI layer formation on top of Super C65 and/or C-coating. Nevertheless, the graphite component does not completely vanish as happens in the NTO-HC electrode [13]. Hence, there are two possibilities: (i) the thickness of the SEI layer formed in NTO-C-FC is lower (<5 nm) than in the NTO-HC electrode and/or (ii) the SEI layer does not cover completely the carbon-based species, namely Super C65 and C-coating. Besides, upon Na+ extraction, the graphitic-like signal slightly increases, suggesting the possible dissolution of some SEI species and/or cracking of the SEI layer.
Moreover, during Na+ insertion, when the SEI layer is forming, peaks at ~286 eV, 288 eV and 290–291 eV appear, which correspond to poly(ethylene oxide) oligomer (PEO) from ethylene carbonate (EC) polymerization, sodium alkyl carbonates (NaCO3R, R = different long-chain alkyl groups), sodium carbonate (Na2CO3) and/or –CF2 group from PVdF (the last two compounds are overlapped), respectively (see Table 1) [17,25,26]. During Na+ extraction, the signal of PEO (~286 eV) decreases only marginally in NTO-C-FC when compared with the behavior observed in the NTO-HC electrode, which displays a large PEO decrease. This difference could be due to the fact that in the NTO-C-FC case, PEO is dissolving in the electrolyte at a much lower rate, therefore leading to a higher stability of the SEI layer when a full-cell is considered.
On the other hand, the C 1s photoelectron spectra of NaFePO4 electrodes (Figure 2a, right panel) proves that the SPI layer is also formed on the positive electrode, although NaFePO4 operates inside the electrochemical stability window of the electrolyte [27]. However, if compared with the SEI layer, the thickness of the SPI layer is almost negligible, at least on the top of Super C65 additive, since the intensity of the graphitic-like signal (284.4 eV) remains almost constant upon cycling as confirmed by the atomic concentration values of graphitic-like signal gathered in Table S1 of Supplementary Information. Moreover, analogously to the SEI layer of the NTO-C-FC electrode, the thin SPI layer is mainly composed by PEO (~286 eV) Na2CO3 (290–291 eV) and NaCO3R (288 and 290–291 eV). During Na+ insertion into NaFePO4, the concentration of graphitic-like compounds, as well as the signal corresponding to PEO, remain almost constant, demonstrating that the SPI suffers a small variation upon electrochemical cycling on the surface of Super C65 [28]. The trend of Na2CO3 concentration is difficult to be observed due to the overlapping with the –CF2 signal from PVdF. After quantification of the different species, it seems that the NaCO3R is the compound which suffers more change upon cycling, displaying a concentration increase upon Na+ extraction from NaFePO4.
Regarding the O 1s photoelectron spectra of NTO-C-FC electrode (Figure 2b, left panel), the peak at ~531 eV, which corresponds to Na2Ti3O7, is detected in all states of charge for NTO-C-FC electrodes with no changes in the atomic concentration upon electrochemical cycling. The photoemission peak deconvolution is illustrated in Figure S2 of Supplementary Information and the obtained concentration values are gathered in Table S2. Hence, taking into account the evolution of the Na2Ti3O7 concentration in the O 1s spectra and also the behavior of the graphitic-like component in the C 1s spectra, it can be concluded that the SEI layer is predominantly formed on the surface of Super C65 and/or C-coating with a thickness lower than 2.5 nm, which was estimated from the inelastic mean free path (IMFP) of C 1s photoelectrons [29], and it is in agreement with the values calculated by Tanuma et al. [30]. This phenomenon is already observed in other intercalation materials, for which the SEI layer is mainly formed on the surface of carbon and not on the active material [28]. Additionally, such a thin SEI layer does not fully account for the high irreversible capacity observed in Figure 1a. Therefore, additional side-reactions in the cell are governing the observed irreversibility.
The NTO-C-FC electrode at OCV shows a peak at ~532 eV from residual Na2CO3 due to the interaction with moisture. That component increases during Na+ insertion on C-coated Na2Ti3O7 along with the formation of the SEI layer [17]. Furthermore, some NaCO3R (~534 eV and ~532.5 eV) and PEO (~533 eV) species can be observed [17,25]. However, it is difficult to unambiguously determine the PEO and alkyl-carbonate evolution due to the small differences in binding energy and overlapping of the peaks. Even so, the quantification of the species suggests that Na2CO3 is formed upon cycling whilst the NaCO3R concentration remains almost constant and the PEO is dissolved in the electrolyte.
According to the O 1s photoemission line, the surface of NaFePO4 electrode at OCV (Figure 2b, right panel) shows a peak at ~531 eV, which corresponds to PO43- groups from the active material and a less intense contribution from Na2CO3 [25,31]. During the electrochemical cycling, the peak corresponding to Na2CO3 increases, while the PO43- component slightly decreases, being still visible, suggesting that the formed SPI is very thin (much lower than 2.5 nm; also estimated from the IMFP of C 1s photoelectrons) [30].
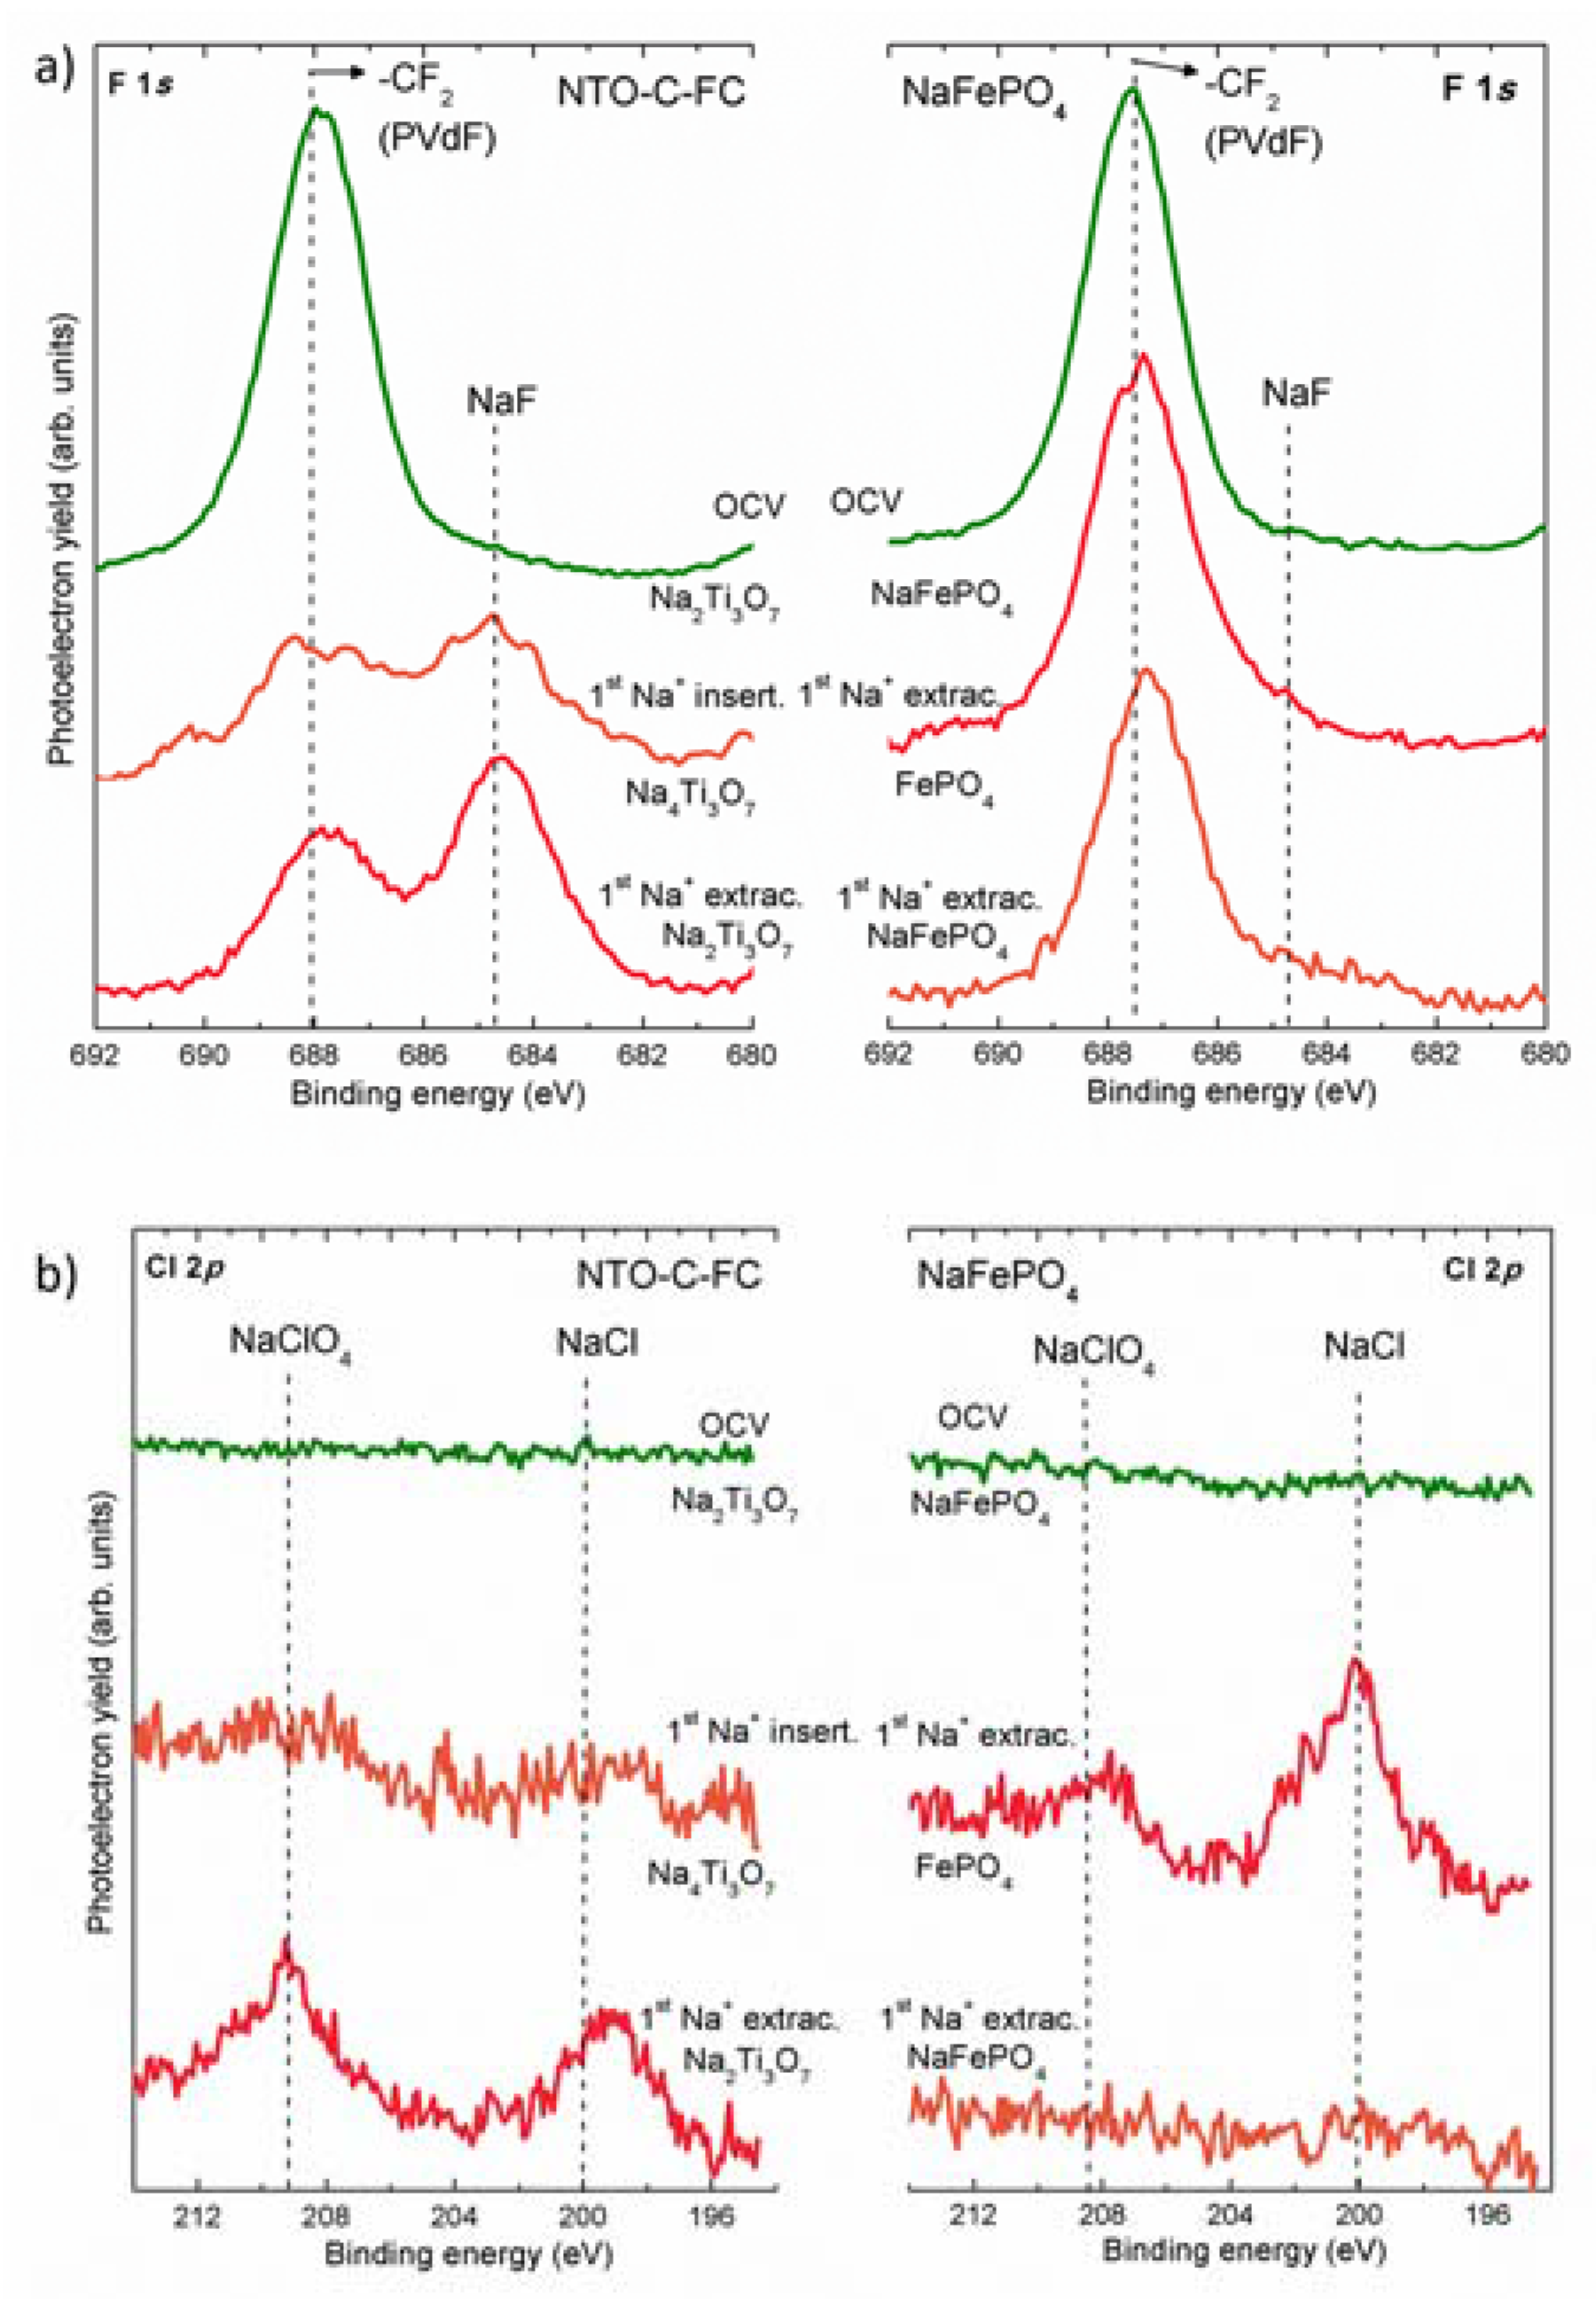
F 1s spectra are shown in Figure 3a, where the experimental results prove that the main contribution from F-based species at OCV in the NTO-C-FC electrode (Figure 3a, left panel) corresponds to –CF2 (688 eV) from PVdF, which confirms the stability of the electrolyte at this state of charge, in agreement with the conclusions extracted from the C 1s data [26]. During Na+ insertion, the PVdF component is reduced and a peak at ~685 eV is developed, which is assigned to NaF and its formation is due to the dehydrofluorination of PVdF when it reacts with Na+ [32,33,34]. However, the –CF2 signal is still present, suggesting that the SEI layer is thin, in agreement with the previous results obtained from C 1s and O 1s peaks. Moreover, the intensity of the NaF component slightly increases during Na+ extraction in Na4Ti3O7, probably due to the fact that more NaF is formed upon Na+ extraction than upon insertion, which would agree with the behavior that is observed in other Na- and Li-based cathode materials [35,36].
Regarding the F 1s spectra of NaFePO4 electrodes (Figure 3a, right panel), the main component is the –CF2 signal (688 eV) at all states of charge and has an almost constant intensity which agrees with a stabile SPI layer.
Finally, Cl 2p spectra (Figure 3b) are where eventual NaClO4 reduction reactions are detected. In contrast to what is observed for NTO-HC electrodes, in the case of NTO-C-FC electrodes, NaClO4 does not exhibit any reduction reaction at OCV [13]. Besides, during Na+ insertion into Na2Ti3O7, NaCl is formed in the SPI layer, while during Na+ extraction, NaCl is found in the SEI layer. This is proof of the NaCl migration from one electrode to the other upon electrochemical cycling.
2.3. Auger Parameter Determination
The Na Auger parameter has been determined for NTO-FC-C and NaFePO4 electrodes, so it can be compared with the results already obtained for NTO-HC electrodes [13]. The Auger parameter allows to have a complete picture of the SEI/SPI layers which cannot be obtained from conventional XPS analysis due to the overlapping of components and the partial surface charging of the electrodes under study [37]. In this case, the Auger parameter is calculated for Na; therefore, it will only provide information about the composition of the outermost surface region. This limitation relies in the definition of the Auger parameter itself, which is the energy difference (eV) between the Na 1s photoemission line and the Na KL23L23 Auger line. Owing to the high binding energy of the Na 1s photoemission line, which will result in low kinetic energy photoelectrons with a very short IMFP, only the first 1–5 nm of the surface will be proved [30]. The exact positions of the Na 1s (binding energy) and Na KL23L23 (kinetic energy) peaks have been determined using the CasaXPS software [38].
The Auger parameters determined at OCV, and after the 1st Na+ insertion and extraction on NTO-C-FC and NaFePO4, are shown in Figure 4. This figure reveals that, at all states of charge, the main component of the outermost SEI and SPI layers is Na2CO3 (~2061.3 eV) [39,40], with some minor traces of NaCO3R, in agreement with analyzed data from O 1s photoelectron spectra (Figure 2b). Hence, the composition of the outermost region of SEI and SPI layers is found to be stable, which is in agreement with a slight variance of the spectra between the 1st Na+ insertion and extraction states and with the almost constant values of SEI resistance (RSEI) obtained by EIS that will be discussed in the following section.
2.4. Study of the Ionic/Electronic Properties by EIS
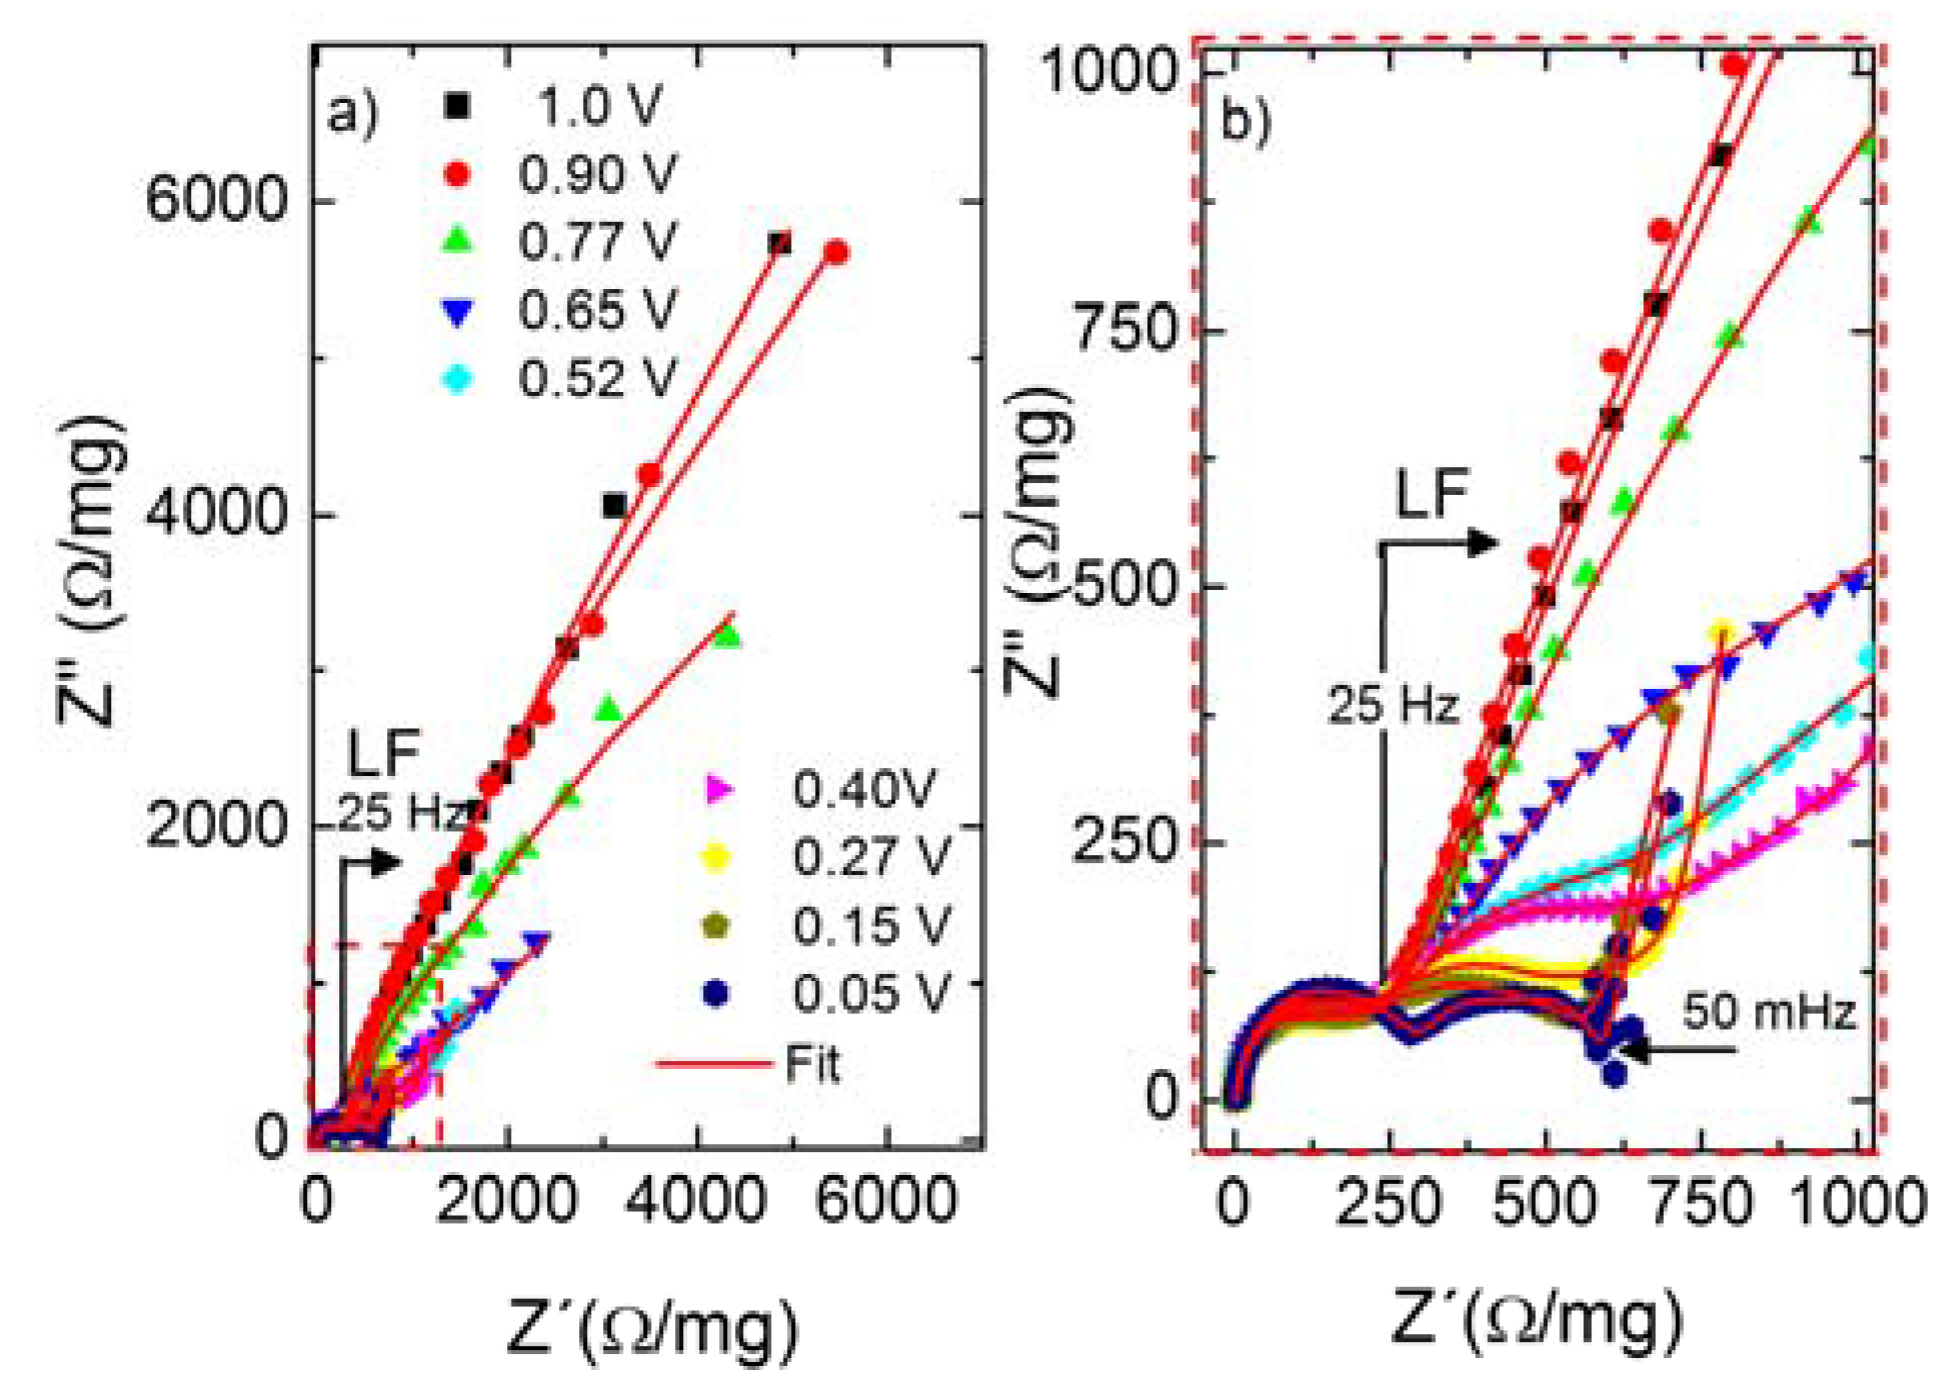
The Nyquist plots of the NTO-C-FC electrode upon the first Na+ insertion into Na2Ti3O7 are shown in Figure 5, where the same behavior previously measured for NTO-HC electrode can be observed [14]. The semicircle observed at frequencies below 25 Hz corresponds to the bulk electronic resistance (Relec). This electronic resistance reveals a very large arc (Relec = 46921.2 Ohm/mg, black squares) when no Na+ is inserted into the electrode. However, as Na+ ions are inserted into Na2+xTi3O7 (0 < x ≤ 2) and the voltage decreases, Relec is reduced (see Table 2), getting closer to the real axis and developing the straight line which corresponds to the diffusion of Na+ into the crystal, as confirms the low radius of the arc (see Figure 5, dark blue hexagon). This behavior was linked to the electronic transition from insulator to conductor during the insertion of Na+ in NTO-HC and, consistently, also NTO-C-FC exhibits the same transition [14]. Figure 5b is a zoom-out of the impedance data presented in Figure 5a, for which the charge-transfer (RCT) and SEI layer (RSEI) resistances appear overlapped above 25 Hz, leading to a slightly distorted feature, at least at low potential values.
The impedance data shown in Figure 5 have been fitted by Boukamp software [41] with the same equivalent circuit used to fit the EIS data collected from NTO-HC electrode [14]. However, for a good fit of the impedance of NTO-C-FC electrode, it was necessary to introduce an extra parallel line between a resistance and a capacitor, labelled as (RC) in Boukamp’s notation. Such RC will be related with an additional resistance associated to Na+ diffusion through the C-coating layer [42]. The obtained values are gathered in Table 2.
The used equivalent circuit perfectly fits the impedance data in Figure 5, and the fitted values show that (i) Relec abruptly decays during Na+ insertion and/or when the voltage is decreasing due to a transition towards electronic conductor; (ii) RC-coating exhibits higher values at the beginning of the electrochemical cycling than at the end of the Na+ insertion, since the SEI layer is forming on the surface of the C-coating and, hence, a high resistance will be observed during this formation process (although at further lower voltage the SEI layer will become more homogeneous and/or smooth decreasing the RC-coating as confirmed by the α value which goes from 0.88 to 0.96, corresponding α = 1, to an ideally smooth surface); (iii) RCT is more stable in NTO-C-FC than in NTO-HC electrodes [14], most probably due to the fact that the C-coating protects the active material and favors the charge-transfer kinetics [42]; (iv) RSEI shows almost constant resistance values during the first insertion in NTO-C-FC, in contrast to what is observed for the NTO-HC electrode, suggesting that the SEI layer in a full-cell is more stable than when metallic Na is used, in agreement with XPS results; and, finally, (v) Rsol exhibits constant values. Besides, as occurs with the NTO-HC electrode, NTO-C-FC suffers an electronic transition from insulator to conductor as demonstrated by the relationship between Relec and RCT. At potentials above the insertion plateau (~0.3 V vs. Na+/Na), the ratio Relec:RCT is larger than 1, whilst below the insertion plateau, the Relec:RCT ratio is smaller than 1. This means that at the beginning of the intercalation process, kinetics are limited by the bulk electronic conductivity showing an insulator behavior, but once the amount of inserted Na+ increases significantly, the material becomes electronic conductor and the kinetics are limited by the interfacial charge-transfer step.
3. Materials and Methods
3.1. Synthesis of C-Coated Na2Ti3O7 and NaFePO4
Na2Ti3O7 was synthesized by solid-state method, mixing TiO2 anatase (Alfa Aesar) and NaOH (Fisher Chemical) in stoichiometric amount and heated up to 750 °C for 20 h (sample NTO) [9]. The synthesis was carried out in air but the atmosphere was changed to Ar while cooling. The sample was coated with carbon by mixing NTO with phthalocyanine (Acros Organic) in a 1:1 weight ratio and was pyrolyzed at 700 °C during 5 h under Ar atmosphere (sample NTO-C-FC). More details can be found in ref [12].
NaFePO4 was synthesized by chemical delithiation of commercial C-coated LiFePO4, mixing with NO2BF4 (Sigma Aldrich) in a molar ratio of 1:2.5 in CH3CN (Sigma Aldrich) obtaining FePO4. The chemical sodiation of FePO4 was carried out by mixing with NaI (Sigma-Aldrich) in a molar ratio of 3:1 also in CH3CN [43].
3.2. Electrochemical Experiments
For the electrochemical study of the full-cell with C-coated Na2Ti3O7/NaFePO4: NTO-C-FC electrodes were prepared by mixing 70% active material with 20% carbon Super C65 (Timcal) and 10% PVdF (Solef) in N-methyl-2-pyrrolidone (NMP, Sigma Aldrich). NaFePO4 electrodes were prepared in the weight ratio of 80% active material, 10% carbon Super C65 (Timcal) and 10% PVdF (Solef) also dissolved in NMP. Both slurries were casted on battery grade Aluminium foil and the laminates were dried under vacuum overnight at 120 °C. The electrodes were punched, taking into account a mass ratio of 1:4 (NTO-C-FC: NaFeO4) and pressed at 5 tons before assembling in a full-cell in an Ar-filled glove box. The galvanostatic performance was tested firstly in three-electrode Swagelok cells in order to check if the mass ratio was the correct one using as reference electrode metallic Na. For the following galvanostatic measurements, only two electrode cells were considered, without reference electrode. The employed separator was glass fibre (Whattman GF B 55) and the electrolyte 1 M NaClO4 in EC:PC (propylene carbonate). The applied current density was 0.1C, taking into account the theoretical capacity of Na2Ti3O7 (1C = 178 mA/g) and in the voltage window of 0.2–3.9 V vs. Na+/Na.
EIS was performed through potentiostatic intermittent titration technique (PITT) for which the impedance data were collected every 25 mV; a sinusoidal perturbation of 5 mV was applied in the frequency range of 100 kHz–5 mHz and 4 h of equilibrium conditions were employed at constant potential. The impedance dispersion data were fitted by Boukamp’s Equivalent Circuit software [41].
All electrochemical measurements were carried out at room temperature in a Bilogic VMP3 Multi-Channel Potentiostat/Galvanostat.
3.3. XPS Experiments
The SEI and SPI layers of NTO-C-FC and NaFePO4, respectively, were studied by XPS with a Phoibos 150 spectrometer at different states of charge (OCV, 1st Na+ insertion and 1st Na+ extraction states) using a non-monochromatic Mg Kα (hν = 1253.6 eV) X-ray source and analyzing the C 1s, F 1s, O 1s, Cl 2p and Na 1s photoemission lines as well as the NaKL23L23 Auger peaks. The electrode preparation was carried out by stopping the full-cell at the required potential, rinsing the electrodes with PC and drying them in an Ar glove box before being inserted into the XPS vacuum chamber by an Ar-filled transfer system. The spectra were recorded with high resolution scans at low power (100 W, 20 eV pass energy, and 0.1 eV energy step). The calibration of the binding energy was performed taking into account as reference the graphitic signal at 284.4 eV and the corrections from the Auger parameter analysis [44,45].
4. Conclusions
The promising Na2Ti3O7 negative electrode material delivers 112 Wh/kganode+cathode in the 2nd cycle and 100 mAh/ganode after 15 cycles when it is assembled in a full-cell using NaFePO4 as positive electrode. The formed SEI layer on the C-coated Na2Ti3O7, in absence of metallic Na, is composed by PEO, Na2CO3 and NaCO3R with an overall thickness below 2.5 nm. The SEI is more stable upon electrochemical cycling when tested in a full-cell than in a half-cell. The main difference is observed at OCV, where the electrolyte decomposition reactions do not appear in the full-cell in contrast to the half-cell, for which the SEI is already formed once the electrode is in contact with metallic Na. Hence, metallic Na is a catalyzer for the decomposition reactions of the electrolyte. Regarding the SPI layer formed on NaFePO4, it can be concluded that it has the same composition as the SEI layer, being, however, more stable and thinner. The ionic/electronic properties were also studied and the stable RSEI values demonstrate the stability of the SEI layer in the full-cell, in agreement with the XPS results and in contrast to what is observed for the half cell. Moreover, EIS experiments showed also the electronic transition from insulator to conductor that the Na2Ti3O7 negative electrode suffers upon Na+ insertion reaction. Hence, taking into account the results presented here, it can be concluded that metallic Na is not a good counter electrode and it is necessary to find new Na-intercalation materials to use as counter electrode in order to investigate the real electrochemical, interfacial and transport properties of the studied Na-intercalation electrode materials.
Acknowledgments
Zarrabeitia, M. thanks the Basque Government for her PhD Fellowship (Grant no. PRE_2013_1_668) and the Basque Country University for her Postdoctoral grant. The Basque Government (Etortek 10 CIC Energigune) and the “Ministerio de Economía y Competitividad” of the Spanish Government (ENE2013-44330-R) are also acknowledged for financial support.
Author Contributions
M.A.M.M., F.N. and M.C.C. designed the experiments. M.Z. performed the experiments, analyzed the data and wrote the manuscript. M.A.M.M. supervised the data analysis and edited the manuscript. F.N. took part on the EIS analysis. T.R. supervised the project.
Conflicts of Interest
The authors declare no conflict of interest.
Appendix A
Figure A1.
C 1s photoemission lines of C-coated Na2Ti3O7 electrode at OCV charge state when it is assembled in a full cell (black) and in a half-cell (red).
Figure A1.
C 1s photoemission lines of C-coated Na2Ti3O7 electrode at OCV charge state when it is assembled in a full cell (black) and in a half-cell (red).


Table A1.
The calculated concentration values (at. %) of the species observed in the C 1s spectrum at different charge states of NaFePO4 electrodes.
Table A1.
The calculated concentration values (at. %) of the species observed in the C 1s spectrum at different charge states of NaFePO4 electrodes.
| OCV (at. %) | 1st Na+ Extraction (at. %) | 1st Na+ Insertion (at. %) | |
|---|---|---|---|
| Graphite | 41.2 | 32.25 | 36.2 |
| Hydrocarbons | 20.3 | 23.3 | 28.7 |
| PEO | 16.7 | 18.0 | 18.6 |
| Na2-xCO3R + PVdF | 16.3 | 10.6 | 8.9 |
| NaCO3R | 5.5 | 12.8 | 7.6 |
Figure A2.
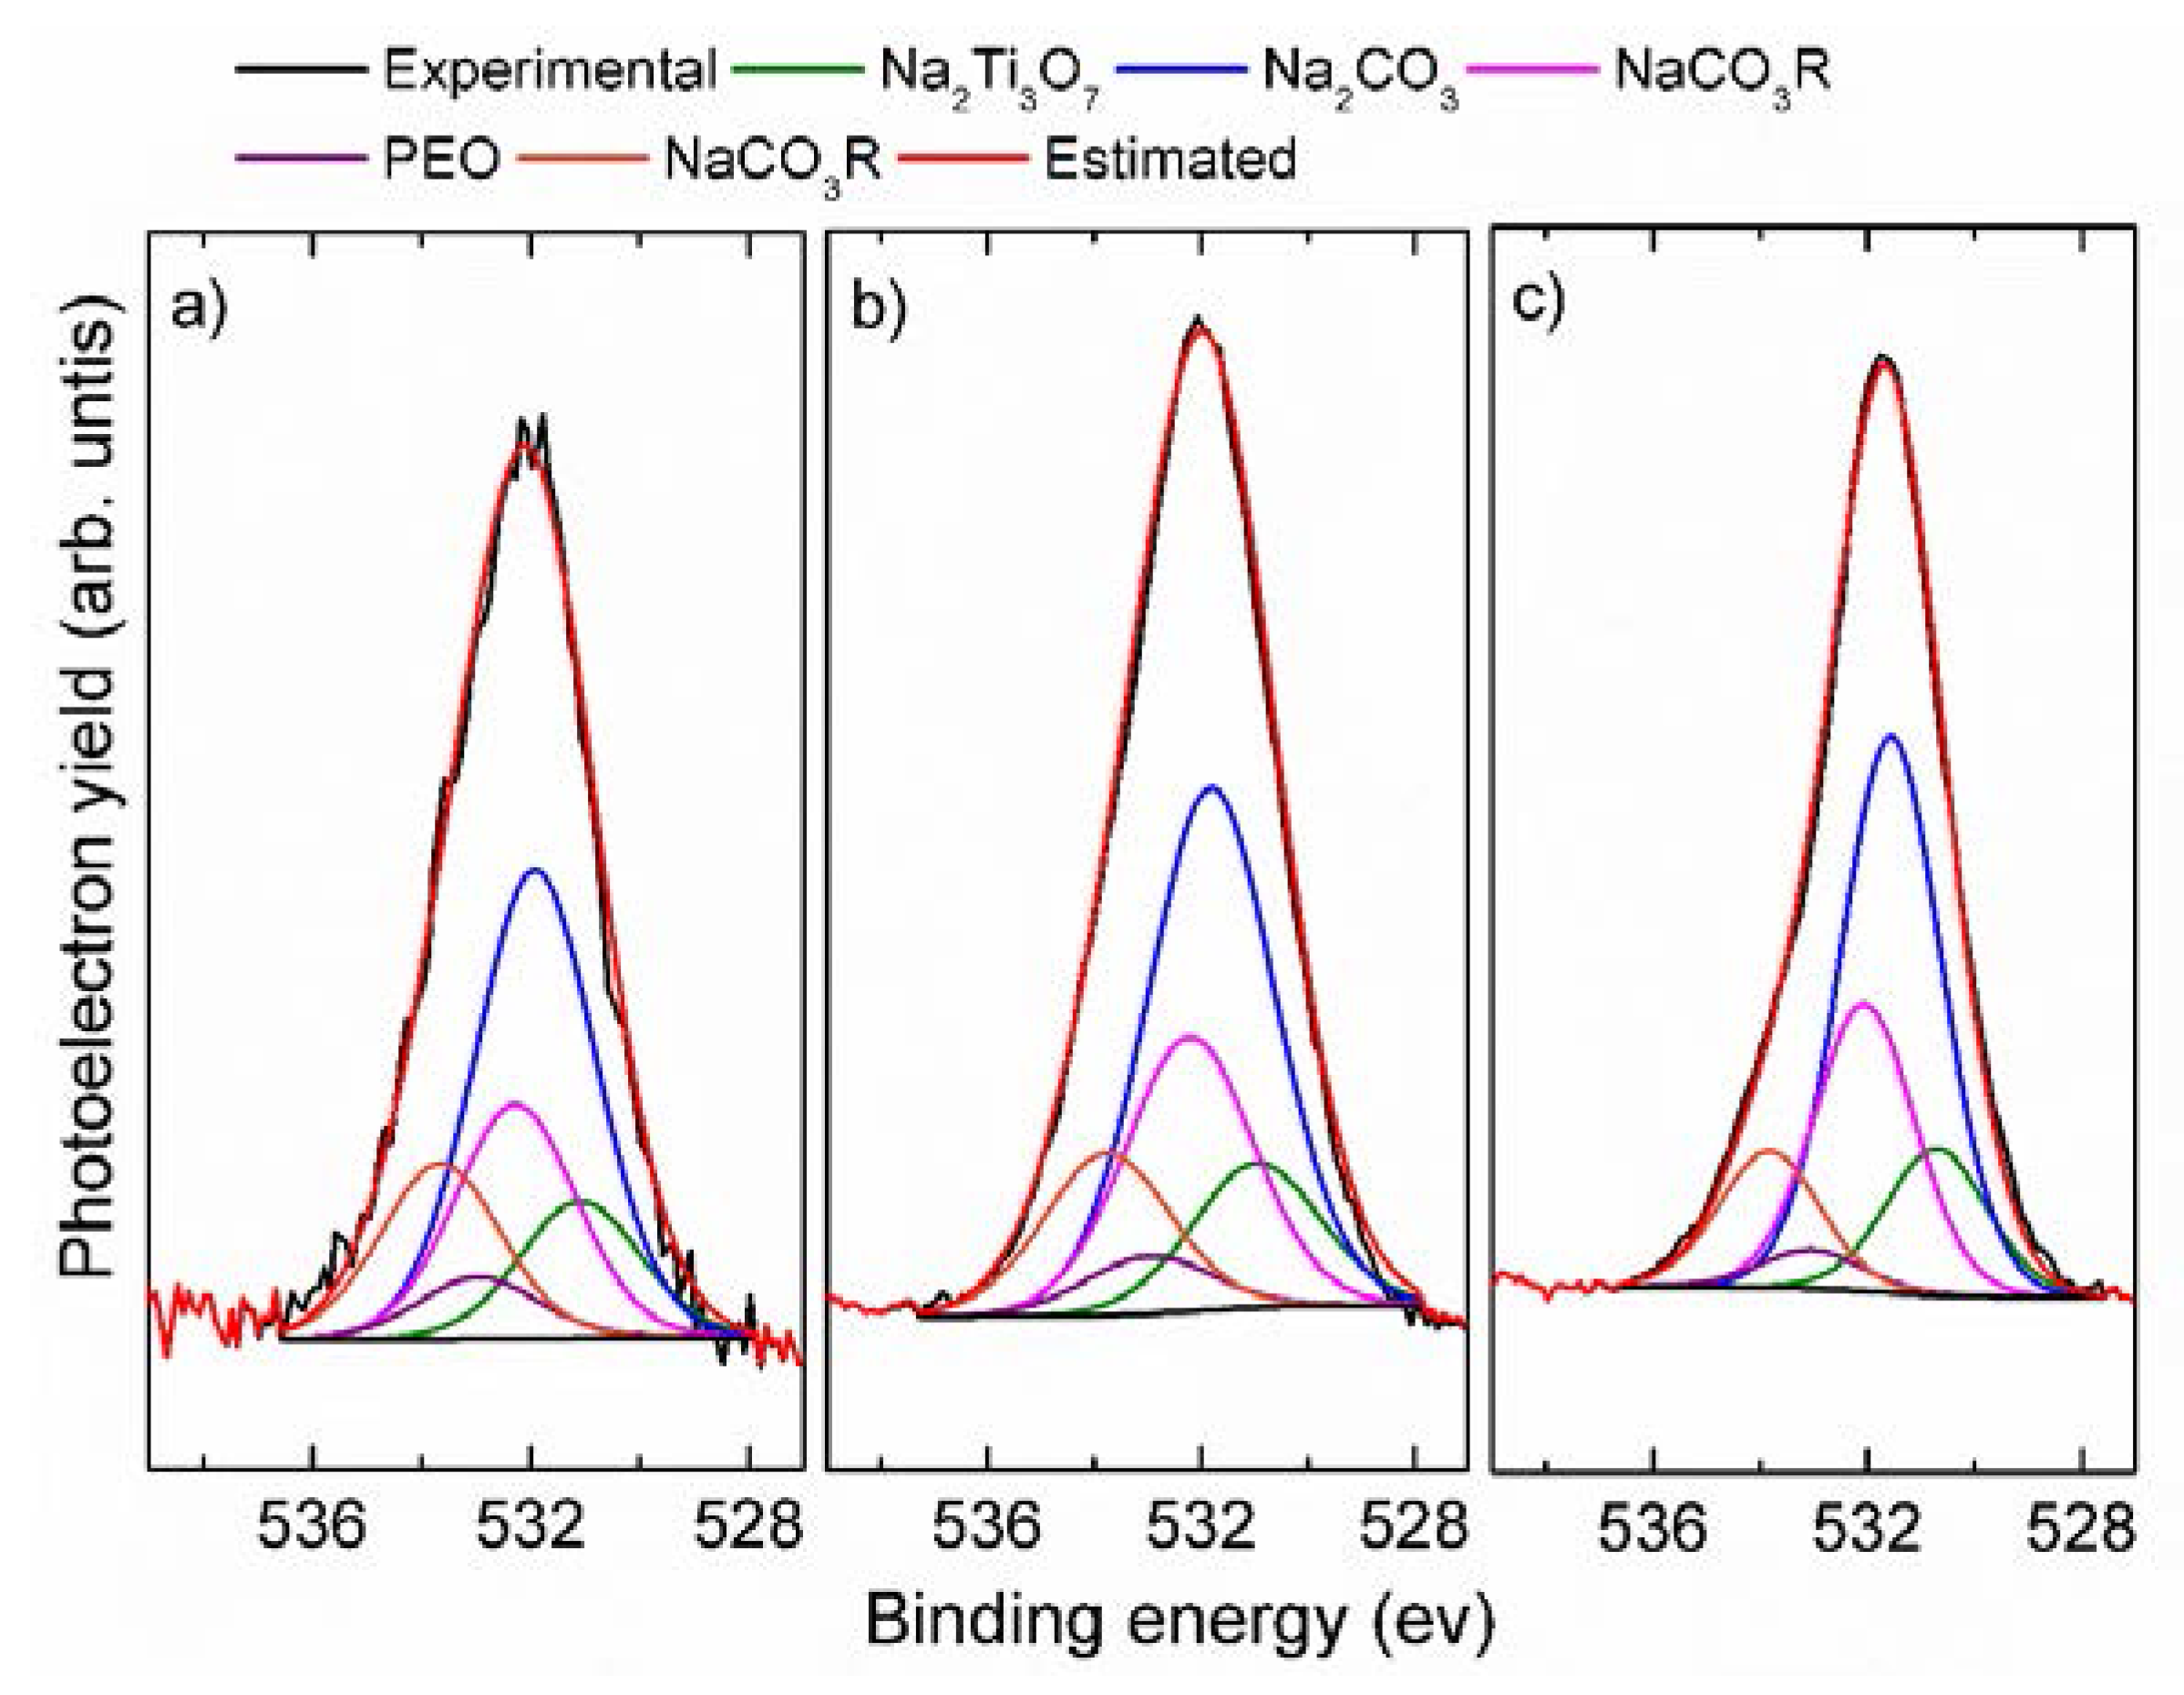
O 1s spectra of the Na2Ti3O7 electrode and their convolution (black: experimental, green: Na2Ti3O7, blue: Na2CO3, magenta and orange: NaCO3R, purple: PEO and red estimated spectrum) at different charge state a) OCV, b) 1st Na+ insertion and c) 1st Na+ extraction.
Figure A2.
O 1s spectra of the Na2Ti3O7 electrode and their convolution (black: experimental, green: Na2Ti3O7, blue: Na2CO3, magenta and orange: NaCO3R, purple: PEO and red estimated spectrum) at different charge state a) OCV, b) 1st Na+ insertion and c) 1st Na+ extraction.

Table A2.
The calculated concentration values (at. %) of the species observed in the O 1s spectrum at different charge states of NTO-C-FC electrodes.
Table A2.
The calculated concentration values (at. %) of the species observed in the O 1s spectrum at different charge states of NTO-C-FC electrodes.
| OCV (at. %) | 1st Na+ insertion (at. %) | 1st Na+ extraction (at. %) | |
|---|---|---|---|
| Na2Ti3O7 | 12.7 | 12.5 | 12.6 |
| Na2CO3 | 43.6 | 45.0 | 47.8 |
| NaCO3R | 38.0 | 37.6 | 36.3 |
| PEO | 5.7 | 4.9 | 3.3 |
References
- Palomares, V.; Serras, P.; Villaluenga, I.; Hueso, K.B.; Carretero-González, J.; Rojo, T. Na-ion batteries, recent advances and present challenges to become low cost energy storage systems. Energy Environ. Sci. 2012, 5, 5884–5901. [Google Scholar] [CrossRef]
- Palomares, V.; Casas-Cabanas, M.; Castillo-Martínez, E.; Han, M.H.; Rojo, T. Update on Na-based battery materials. A growing research path. Energy Environ. Sci. 2013, 6, 2312–2337. [Google Scholar] [CrossRef]
- Luo, W.; Shen, F.; Bommier, C.; Zhu, H.; Ji, X.; Hu, L. Na-ion battery anodes: materials and electrochemistry. Acc. Chem. Res. 2016, 49, 231–240. [Google Scholar] [CrossRef] [PubMed]
- Ellis, B.L.; Nazar, L.F. Sodium and sodium-ion energy storage batteries. Curr. Opin. Solid St. M. 2012, 16, 168–177. [Google Scholar] [CrossRef]
- Kang, H.; Liu, Y.; Cao, K.; Zhao, Y.; Jiao, L.; Wang, Y.; Yuan, H. Update on anode materials for Na-ion batteries. J. Mater. Chem. A 2015, 3, 17899–17913. [Google Scholar] [CrossRef]
- Kim, Y.; Ha, K.H.; Oh, S.M.; Lee, T. High-capacity anode materials for sodium-ion batteries. Chem. Eur. J. 2014, 20, 11980–11992. [Google Scholar] [CrossRef] [PubMed]
- Senguttuvan, P.; Rousse, G.; Seznec, V.; Tarascon, J.M.; Palacín, M.R. Na2Ti3O7: Lowest voltaje ever reported oxide insertion electrode for sodium ion batteries. Chem. Mater. 2011, 23, 4109–4111. [Google Scholar] [CrossRef]
- Doeff, M.M.; Cabana, J.; Shirpour, M. Titanate anodes for sodium ion batteries. J. Inorg. Organomet. Polym. 2014, 24, 5–14. [Google Scholar] [CrossRef]
- Rudola, A.; Saravanan, K.; Mason, C.W.; Balaya, P. Na2Ti3O7: An intercalation based anode for sodium-ion battery applications. J. Mater. Chem. A 2013, 1, 2653–2662. [Google Scholar] [CrossRef]
- Pan, H.; Lu, X.; Yu, X.; Hu, Y.S.; Li, H.; Yang, X.Q.; Chen, L. Sodium storage and transport properties in layered Na2Ti3O7 for room-temperature sodium-ion batteries. Adv. Energy Mater. 2013, 3, 1186–1194. [Google Scholar] [CrossRef]
- Nava-Avendaño, J.; Morales-García, A.; Ponrouch, A.; Rousse, G.; Frontera, C.; Senguttuvan, P.; Tarascon, J.M.; Arroyo-de Dompablo, M.E.; Palacín, M.R. Taking steps forward in understanding the electrochemical behavior of Na2Ti3O7. J. Mater. Chem. A 2015, 3, 22280–22286. [Google Scholar] [CrossRef]
- Zarrabeitia, M.; Castillo-Martínez, E.; López Del Amo, J.M.; Eguía-Barrio, A.; Muñoz-Márquez, M.A.; Rojo, T.; Casas-Cabanas, M. Identification of the critical synthesis parameters for enhanced cycling stability of Na-ion anode material Na2Ti3O7. Acta Mater. 2016, 104, 125–130. [Google Scholar] [CrossRef]
- Muñoz-Márquez, M.A.; Zarrabeitia, M.; Castillo-Martínez, E.; Eguía-Barrio, A.; Rojo, T.; Casas-Cabanas, M. Composition and evolution of the Solid Electrolyte Interphase in Na2Ti3O7 electrodes for Na-ion batteries: XPS and Auger parameter analysis. ACS Appl. Mater. Interfaces 2015, 7, 7801–7808. [Google Scholar] [CrossRef] [PubMed]
- Zarrabeitia, M.; Nobili, F.; Muñoz-Márquez, M.A.; Rojo, T.; Casas-Cabanas, M. Direct observation of electronic conductivity transitions and solid electrolyte interphase stability of Na2Ti3O7 electrodes for Na-ion batteries. J. Power Sources 2016, 330, 78–83. [Google Scholar] [CrossRef]
- Iermakova, D.I.; Dugas, R.; Palacín, M.R.; Ponrouch, A. On the comparative stability of Li and Na metal anode interfaces in conventional alkyl carbonate electrolytes. J. Electrochem. Soc. 2015, 162, A7060–A7066. [Google Scholar] [CrossRef]
- Yabuuchi, N.; Kubota, K.; Dahbi, M.; Komaba, S. Research development on sodium-ion batteries. Chem. Rev. 2014, 114, 11636–11682. [Google Scholar] [CrossRef] [PubMed]
- Komaba, S.; Murata, W.; Ishikawa, T.; Yabuuchi, N.; Ozeki, T.; Nakayama, T.; Ogata, A.; Gotoh, K.; Fujiware, K. Electrochemical Na insertion and Solid Electrolyte Interphase for Hard-Carbon electrodes and application to Na-ion batteries. Adv. Funct. Mater. 2011, 21, 3859–3867. [Google Scholar] [CrossRef]
- Kim, D.; Lee, E.; Slater, M.; Lu, W.; Rood, S.; Johnson, C.S. Layered Na[Ni1/3Fe1/3Mn1/3]O2 cathodes for Na-ion battery application. Electrochem. Commun. 2012, 18, 66–69. [Google Scholar] [CrossRef]
- Jian, Z.; Han, W.; Yang, H.; Hu, Y.S.; Zhou, J.; Zhou, Z.; Li, J.; Chen, W.; Chem, D.; Chen, L. Superior electrochemical performance and storage mechanism of Na3V2(PO4)3 cathode for room-temperature sodium-ion batteries. Adv. Energy Mater. 2013, 3, 156–160. [Google Scholar] [CrossRef]
- Ponrouch, A.; Dedryvère, R.; Monti, D.; Demet, A.E.; Ateba Mba, J.M.; Croguennec, L.; Masquelier, C.; Johansson, P.; Palacín, M.R. Towards high energy density sodium ion batteries through electrolyte optimization. Energy Environ. Sci. 2013, 6, 2361–2369. [Google Scholar] [CrossRef]
- Nose, M.; Nakayama, H.; Nobuhara, K.; Yamarguchi, H.; Nakanishi, S.; Iba, H. Na4Co3(PO4)2P2O7: a novel storage material for sodium-ion batteries. J. Power Sources 2013, 234, 175–179. [Google Scholar] [CrossRef]
- Xu, J.; Ma, C.; Balasubramanian, M.; Meng, Y.S. Understanding Na2Ti3O7 as an ultra-low voltaje anode material for a Na-ion battery. Chem. Commun. 2014, 50, 12564–12567. [Google Scholar] [CrossRef] [PubMed]
- Mukherjee, S.; Bates, A.; Schuppert, N.; Son, B.; Kim, J.G.; Choi, J.S.; Choi, M.J.; Lee, D.H.; Kwon, O.; Jasinski, J.; et al. A study of a novel NA ion battery and its anodic degradation using sodium rich Prussian blue cathode coupled with different titanium based oxide anodes. J. Power Sources 2015, 286, 276–289. [Google Scholar] [CrossRef]
- Blyth, R.I.R.; Buqa, H.; Netzer, F.P.; Ramset, M.G.; Besenhard, J.O.; Golob, P.; Winter, M. XPS studied of graphite electrode materials for lithium ion batteries. App. Surf. Sci. 2000, 167, 99–106. [Google Scholar] [CrossRef]
- Andersson, A.M.; Henningson, A.; Siegbahn, H.; Jansson, U.; Edström, K. Electrochemically lithiated graphite characterized by photoelectron spectroscopy. J. Power Sources 2003, 119, 522–527. [Google Scholar] [CrossRef]
- Beamson, G.; Briggs, D. High Resolution XPS of Organic Polymers: The Scienta ESCA300 Database; John Wiley & Sons, Ltd: Chichester, UK, 1992. [Google Scholar]
- Bhide, A.; Hofmann, J.; Katharina Dürr, A.; Janek, J.; Adelhelm, P. Electrochemical stability of non-aqueous electrolytes for sodium-ion batteries and their compatibility with Na0.7CoO2. Phys. Chem. Chem. Phys. 2014, 16, 1987–1998. [Google Scholar] [CrossRef] [PubMed]
- Membreño, N.; Park, K.; Goodenogh, J.B.; Stevenson, K.J. Electrode/electrolyte interface of composite α-Li3V2(PO4)3 cathodes in a nonaqueous electrolyte for lithium ion batteries and the role of the carbon additive. Chem. Mater. 2015, 27, 3332–3340. [Google Scholar] [CrossRef]
- Tanuma, S. Calculations of electron inelastic mean free paths. Surf. Interface Anal. 1991, 17, 911–926. [Google Scholar] [CrossRef]
- Tanuma, S.; Powell, C.J.; Penn, D.R. Calculations of electron inelastic mean free paths. IX. Data for 41 elemental solids over the 50 eV to 30 KeV range. Surf. Interface Anal. 2011, 43, 689–713. [Google Scholar] [CrossRef]
- Malmgren, S.; Ciosek, K.; Hahlin, M.; Gustafsson, T.; Gorgoi, M.; Rensmo, H. Comparing anode and cathode electrode/electrolyte interface composition an morphology using soft and hard X-ray photoelectron spectroscopy. Electrochim. Acta 2013, 97, 23–32. [Google Scholar] [CrossRef]
- Ji, L.; Gu, M.; Shao, Y.; Li, X.; Engelhard, M.H.; Arey, B.W.; Wang, W.; Nie, Z.; Xiao, J.; Wang, C.; et al. Controlling SEI formation on SnSb-porous carbon nanofibres for improved Na ion storage. Adv. Mater. 2014, 26, 2901–2908. [Google Scholar] [CrossRef] [PubMed]
- Bodenes, L.; Darwiche, A.; Monconduit, L.; Martínez, H. The solid electrolyte interphase a key parameter of the high performance of Sb in sodium-ion batteries: comparative X-ray photoelectron spectroscopy study of Sb/Na-ion and Sb/Li-ion batteries. J. Power Sources 2015, 273, 14–24. [Google Scholar]
- Lahiri, A.; Olschewski, M.; Gustus, R.; Borisenko, N.; Endres, F. Surface modification of battery electrodes via electroless deposition with improved performance for Na-ion batteries. Phys. Chem. Chem. Phys. 2016, 18, 14782–14786. [Google Scholar] [CrossRef] [PubMed]
- Doubaji, S.; Philippe, B.; Saadoune, I.; Gorgoi, M.; Gustafsson, T.; Solhy, A.; Valvo, M.; Rensmo, H.; Edström, K. Passivation layer and cathodic redox reactions in sodium-ion batteries probed by HAXPES. ChemSusChem. 2016, 9, 97–108. [Google Scholar] [CrossRef] [PubMed]
- Cherkashinin, G.; Nikolwski, K.; Ehrenberg, H.; Jacke, S.; Dimesso, L.; Jaegermann, W. The stability of the SEI layer, surface composition and the oxidation state of transition metals at the electrolyte-cathode interface impacted by electrochemical cycling: X-ray photoelectron spectroscopy investigation. Phys. Chem. Chem. Phys. 2012, 14, 12321–12331. [Google Scholar] [CrossRef] [PubMed]
- Wagner, C.D.; Joshi, A. The Auger parameter, its utility and advantages: A review. J. Electron. Spectrosc. 1988, 47, 283–313. [Google Scholar] [CrossRef]
- Walton, J.; Wincott, P.; Fairley, N.; Carrick, A. Peak Fitting with CasaXPS: A Casa Pocket Book; Accolyte Sicence: Knutsford, UK, 2010. [Google Scholar]
- Wagner, C.D.; Riggs, W.M.; Davis, L.E.; Moulder, J.F.; Muilenberg, G.E. Handbook of X-ray Photoelectron Spectroscopy; Perkin-Elmer Corporation, Physical Electronics Division: Eden Prairie, Minnesota, 1979; p. 170. [Google Scholar]
- NIST X-ray Photoelectron Spectroscopy Database. Available online: http://srdata.nist.gov/xps (accessed on 28 March 2017).
- Boukamp, B.A. A nonlinear least squares fit procedure for analysis of immittance data of electrochemical systems. Solid State Ion. 1986, 20, 31–44. [Google Scholar] [CrossRef]
- Barsoukov, E.; Macdonald, J.R. Batteries. In Impedance Spectroscopy Theory, Experiment and Application, 2nd ed.; John Wiley & Sons Inc.: Hoboken, NJ, USA, 2005. [Google Scholar]
- Casas-Cabanas, M.; Rodattis, V.V.; Saurel, D.; Kubiak, P.; Carretero-González, J.; Palomares, V.; Serras, P.; Rojo, T. Crystal chemistry of Na insertion/deinsertion in FePO4-NaFePO4. J. Mater. Chem. 2012, 22, 17421–171423. [Google Scholar] [CrossRef]
- Xia, X.; Obrovac, M.N.; Dahn, J.R. Comparison of the reactivity of NaxC6 and LixC6 with non-aqueous solvents and electrolytes. Electrochem. Solid-State Lett. 2011, 14, A130–A133. [Google Scholar] [CrossRef]
- Doeff, M.M.; Ma, Y.; Visco, S.J.; De Jonghe, L.C. Electrochemical insertion of sodium into carbon. J. Electrochem. Soc. 1993, 140, L169–L170. [Google Scholar] [CrossRef]
Figure 1.
(a) Voltage profile of the full-cell NTO-C-FC/NaFePO4 (blue curve), negative electrode NTO-C-FC (black curve) and positive electrode NaFePO4 (green curve); orange/pink points highlight the charge states where X-ray photoelectron spectroscopy (XPS) experiments have been performed. (b) Comparison between half-cell (red) and full-cell (black) of the capacity and coulombic efficiency determined by the C-coated Na2Ti3O7 negative electrode active material.

Figure 2.
(a) C 1s and (b) O 1s photoemission lines of NTO-C-FC (left panels) and NaFePO4 (right panels) at open circuit voltage (OCV), 1st Na+ insertion and 1st Na+ extraction.
Figure 2.
(a) C 1s and (b) O 1s photoemission lines of NTO-C-FC (left panels) and NaFePO4 (right panels) at open circuit voltage (OCV), 1st Na+ insertion and 1st Na+ extraction.
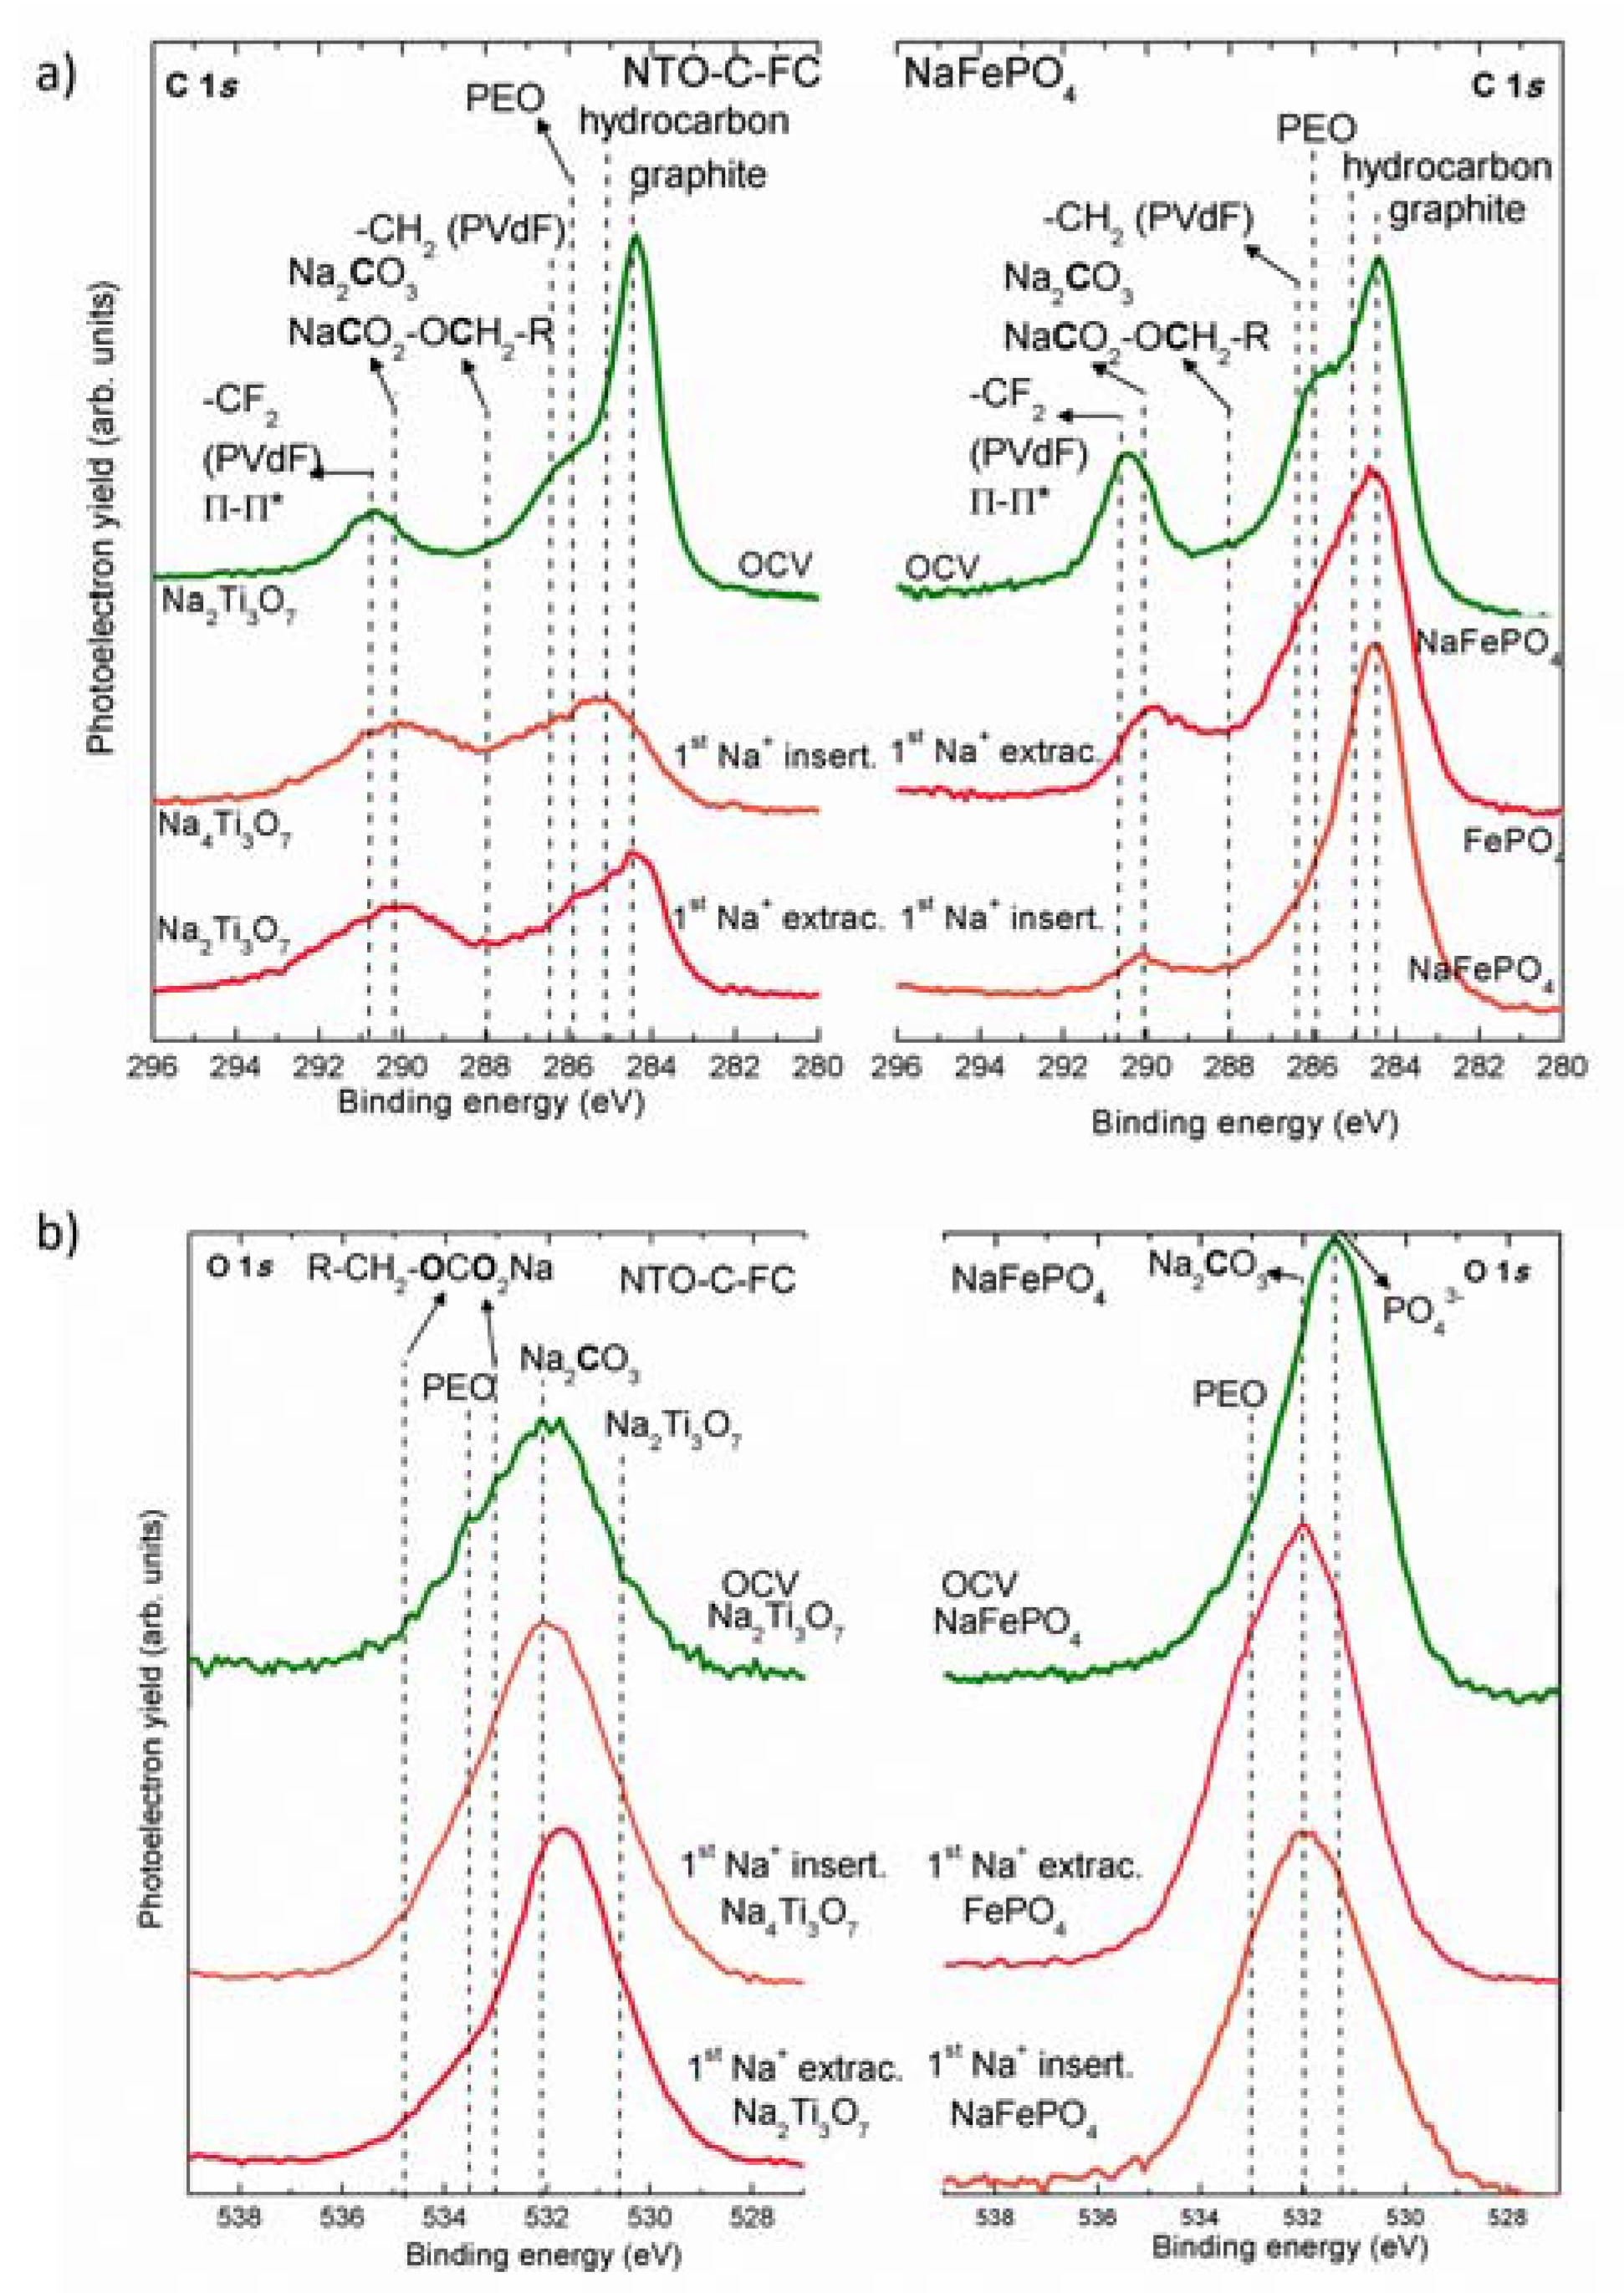
Figure 3.
(a) F 1s and (b) Cl 2p photoemission line of NTO-C-FC (left panels) and NaFePO4 (right panels) at OCV, 1st Na+ insertion and 1st Na+ ions extraction.
Figure 3.
(a) F 1s and (b) Cl 2p photoemission line of NTO-C-FC (left panels) and NaFePO4 (right panels) at OCV, 1st Na+ insertion and 1st Na+ ions extraction.

Figure 4.
Na Auger parameter at different states of electrochemical cycling (OCV and 1st Na+ insertion and extraction) of NTO-C-FC and NaFePO4 samples. Reference values are obtained from [39,40] and measured in our laboratory (*).
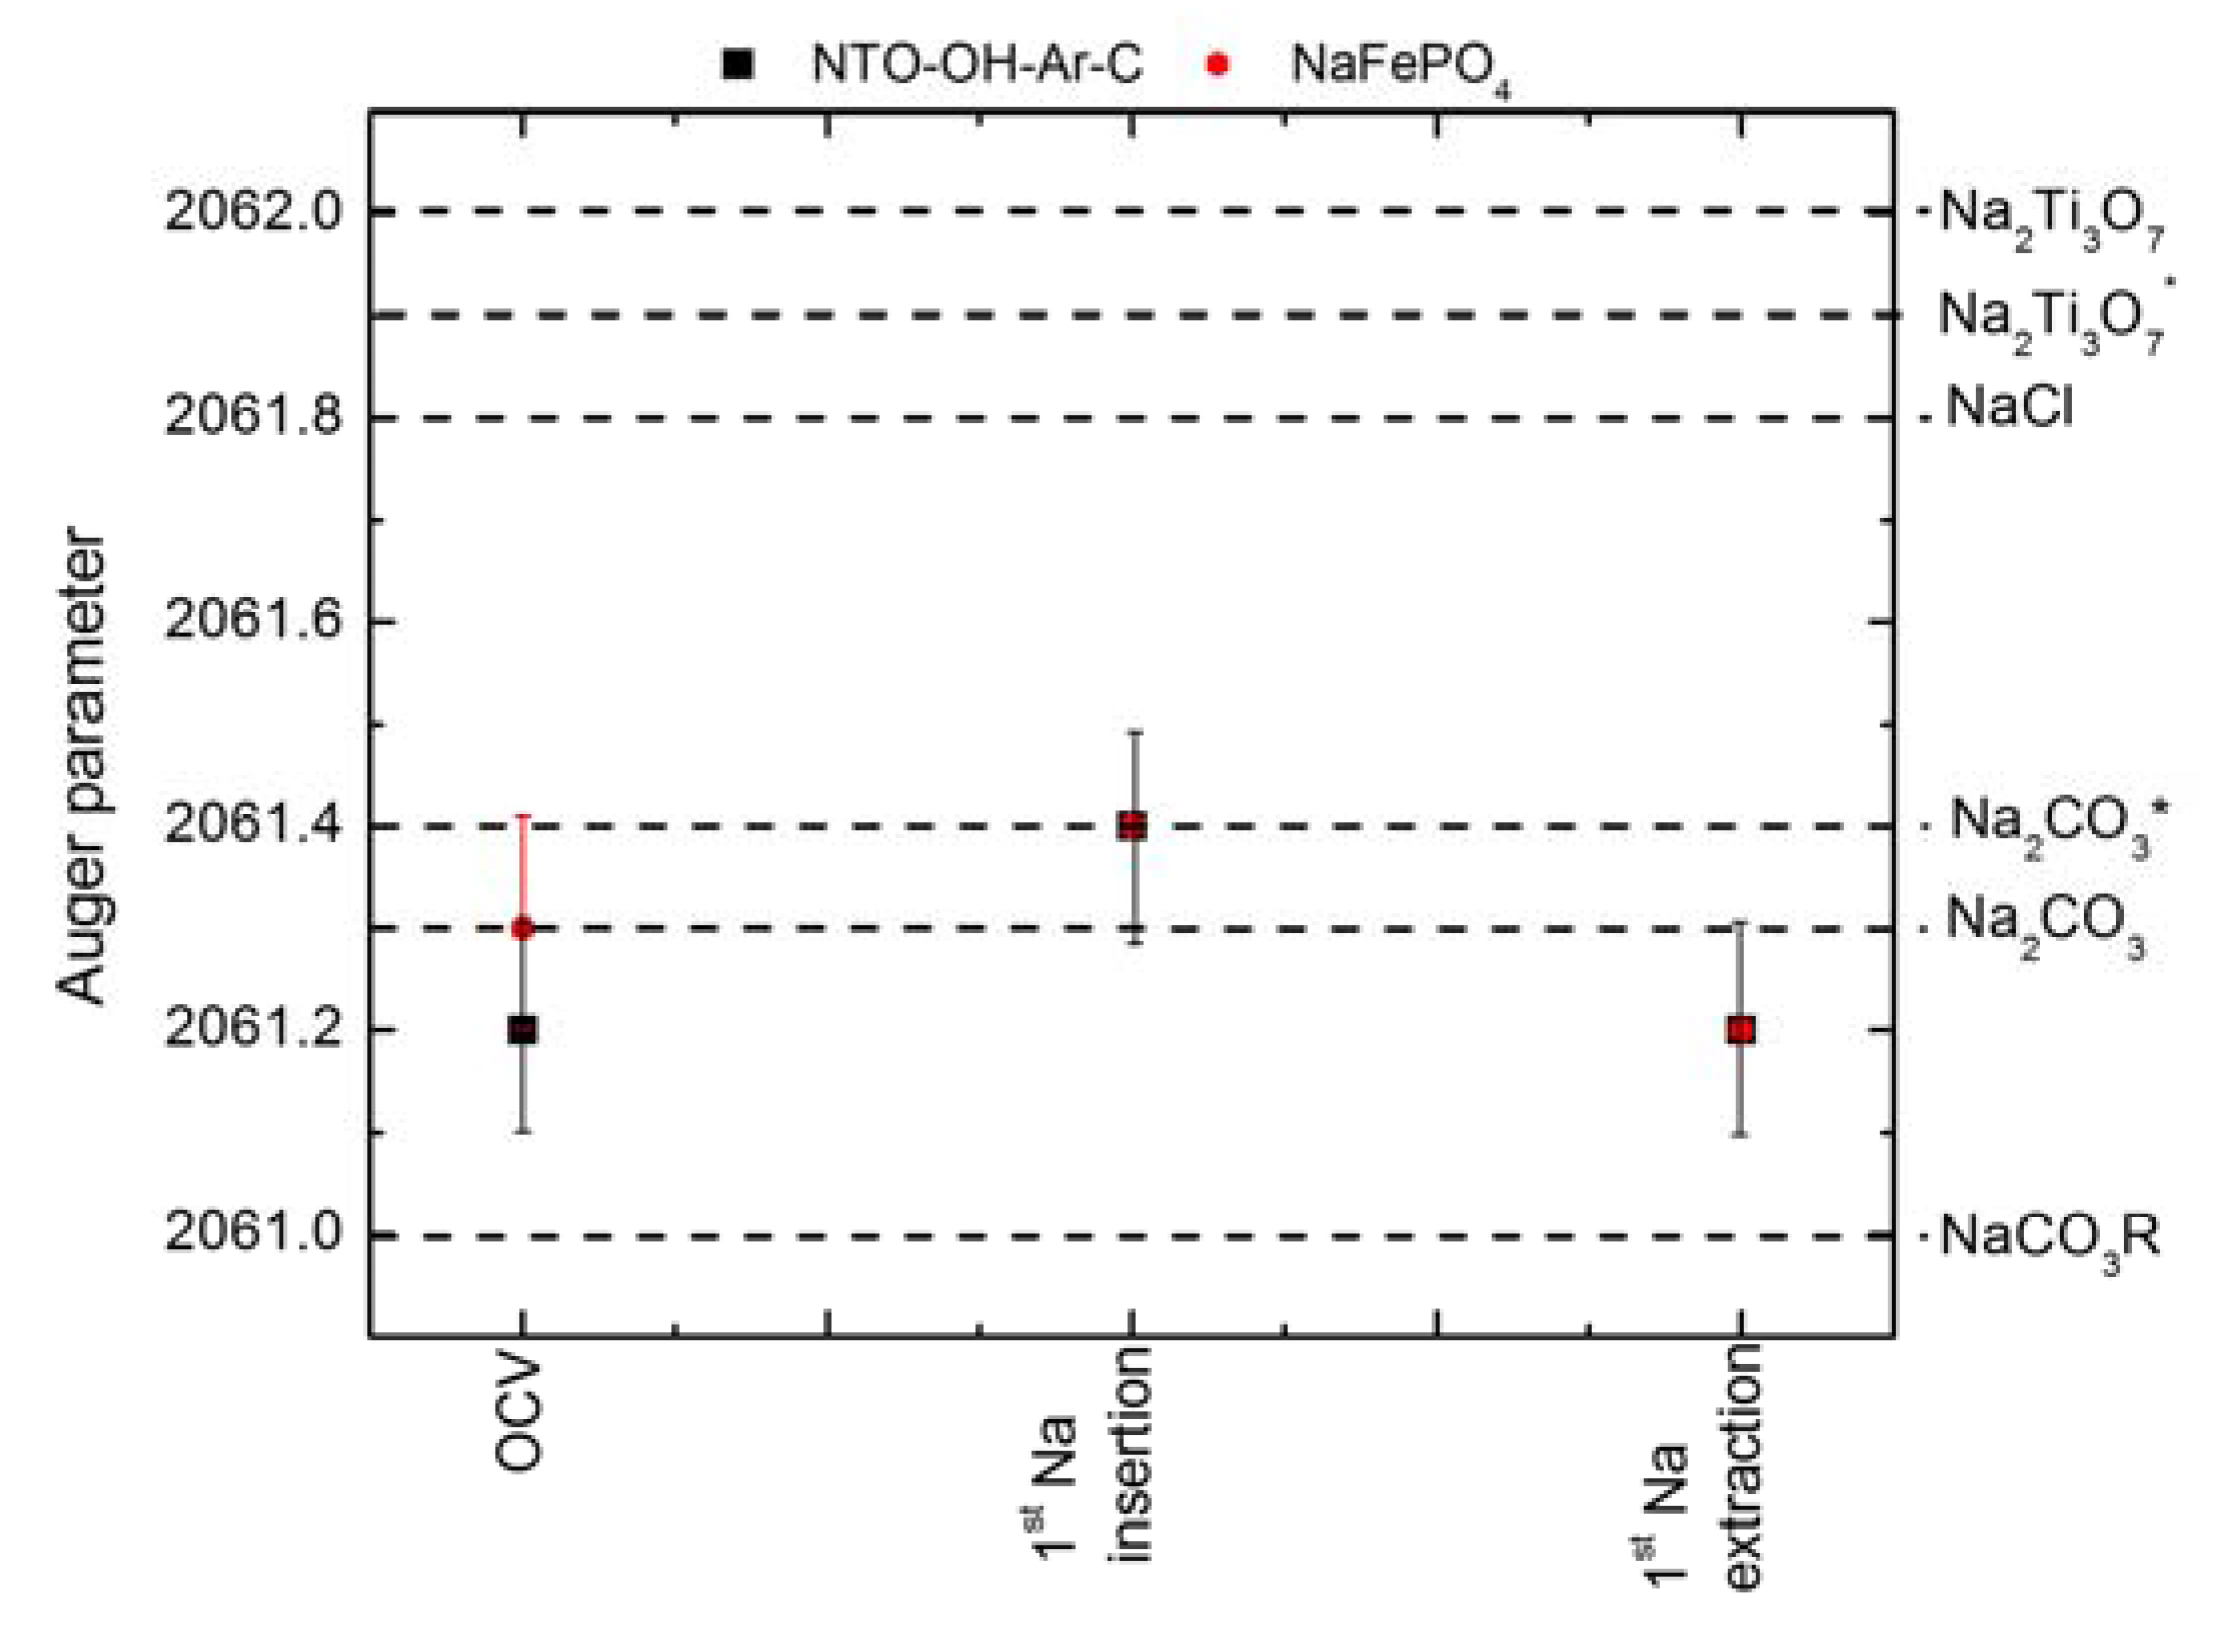
Figure 5.
Nyquist plots of NTO-C-FC upon 1st Na+ insertion at 1.0 V, 0.90 V, 0.77 V, 0.65 V, 0.52 V, 0.40 V, 0.27 V, 0.15 V and 0.05 V vs. Na+/Na. (a) Impedance data in all frequency ranges (100 kHz to 5 mHz) and (b) zoom-out of the impedance data selected in the red area of the left panel.
Figure 5.
Nyquist plots of NTO-C-FC upon 1st Na+ insertion at 1.0 V, 0.90 V, 0.77 V, 0.65 V, 0.52 V, 0.40 V, 0.27 V, 0.15 V and 0.05 V vs. Na+/Na. (a) Impedance data in all frequency ranges (100 kHz to 5 mHz) and (b) zoom-out of the impedance data selected in the red area of the left panel.

Table 1.
Assignments of the binding energy of the Solid Electrolyte Interphase (SEI) layer species of C 1s and O 1s spectra.
Table 1.
Assignments of the binding energy of the Solid Electrolyte Interphase (SEI) layer species of C 1s and O 1s spectra.
| Species | Binding Energy (eV) | Peak Evolution | |
|---|---|---|---|
| C 1s | O 1s | ||
| Graphitic-like | 284.4 | -- | Decreases during Na+ insertion |
| Na2Ti3O7 | -- | 531 | Constant at all states |
| PEO | 286 | 533 | More at Na+ insertion than at extraction |
| Na2CO3 | 290–291 | 532 | More formation upon Na+ insertion and remains constant during the extraction |
| NaCO3R | 288 & 290–291 | 534 & 532.5 | Increases upon Na+ insertion |
| –CF2 (PVdF) | 290–291 | -- | Observed at all states but probably decreases upon Na+ insertion |
Table 2.
Resistance values from the impedance fits upon the 1st Na+ insertion into Na2Ti3O7 and the χ2 values.
Table 2.
Resistance values from the impedance fits upon the 1st Na+ insertion into Na2Ti3O7 and the χ2 values.
| V vs. Na+/Na | Rele (Ohm/mg) | RCcoating (Ohm/mg) | RCT (Ohm/mg) | RSEI (Ohm/mg) | Rsol (Ohm/mg) | χ2 |
|---|---|---|---|---|---|---|
| 1.0 | 46,921.2 | 682.5 | 149.3 | 75.9 | 2.5 | 1.9 × 10⁻³ |
| 0.90 | 38,215.3 | 1372.5 | 143.0 | 69.3 | 2.4 | 2.23 × 10⁻³ |
| 0.77 | 14,096.1 | 1003.4 | 117.2 | 112.1 | 2.1 | 1.51 × 10⁻³ |
| 0.65 | 1108.4 | 572.6 | 114.9 | 126.9 | 2.3 | 1.72×10⁻³ |
| 0.52 | 885.0 | 396.8 | 140.2 | 86.7 | 2.5 | 1.97 × 10⁻³ |
| 0.40 | 579.9 | 409.8 | 124.2 | 105.1 | 2.5 | 1.27 × 10⁻³ |
| 0.27 | 237.6 | 309.8 | 108.9 | 79.8 | 2.5 | 8.7 × 10⁻⁴ |
| 0.15 | 123.3 | 189.7 | 201.8 | 57.8 | 2.3 | 5.9 × 10⁻⁵ |
| 0.05 | 132.0 | 135.7 | 217.8 | 89.5 | 2.8 | 4.5 × 10⁻³ |
Relec = bulk electronic, RC-coating = C-coating, RCT = charge-transfer, RSEI = SEI layer and Rsol = electrolyte resistances.
© 2017 by the authors. Licensee MDPI, Basel, Switzerland. This article is an open access article distributed under the terms and conditions of the Creative Commons Attribution (CC BY) license (http://creativecommons.org/licenses/by/4.0/).
Share and Cite
MDPI and ACS Style
Zarrabeitia, M.; Muñoz-Márquez, M.Á.; Nobili, F.; Rojo, T.; Casas-Cabanas, M. Influence of Using Metallic Na on the Interfacial and Transport Properties of Na-Ion Batteries. Batteries 2017, 3, 16. https://doi.org/10.3390/batteries3020016
AMA Style
Zarrabeitia M, Muñoz-Márquez MÁ, Nobili F, Rojo T, Casas-Cabanas M. Influence of Using Metallic Na on the Interfacial and Transport Properties of Na-Ion Batteries. Batteries. 2017; 3(2):16. https://doi.org/10.3390/batteries3020016
Chicago/Turabian StyleZarrabeitia, Maider, Miguel Ángel Muñoz-Márquez, Francesco Nobili, Teófilo Rojo, and Montse Casas-Cabanas. 2017. "Influence of Using Metallic Na on the Interfacial and Transport Properties of Na-Ion Batteries" Batteries 3, no. 2: 16. https://doi.org/10.3390/batteries3020016
Note that from the first issue of 2016, this journal uses article numbers instead of page numbers. See further details here.