
Performance Comparison between AB5 and Superlattice Metal Hydride Alloys in Sealed Cells


1
BASF/Battery Materials—Ovonic, 2983 Waterview Drive, Rochester Hills, MI 48309, USA
2
Department of Chemical Engineering and Materials Science, Wayne State University, Detroit, MI 48202, USA
*
Author to whom correspondence should be addressed.
Batteries 2017, 3(4), 35; https://doi.org/10.3390/batteries3040035
Submission received: 27 September 2017
/
Revised: 11 October 2017
/
Accepted: 17 October 2017
/
Published: 6 November 2017
(This article belongs to the Special Issue Nickel Metal Hydride Batteries 2017)
Abstract
:High-power cylindrical nickel metal/hydride batteries using a misch metal-based Al-free superlattice alloy with a composition of La11.3Pr1.7Nd5.1Mg4.5Ni63.6Co13.6Zr0.2 were fabricated and evaluated against those using a standard AB5 metal hydride alloy. At room temperature, cells made with the superlattice alloy showed a 40% lower internal resistance and a 59% lower surface charge-transfer resistance compared to cells made with the AB5 alloy. At a low temperature (−10 °C), cells made with the superlattice alloy demonstrated an 18% lower internal resistance and a 60% lower surface charge-transfer resistance compared to cells made with the AB5 alloy. Cells made with the superlattice alloy exhibited a better charge retention at −10 °C. A cycle life comparison in a regular cell configuration indicated that the Al-free superlattice alloy contributes to a shorter cycle life as a result of the pulverization from the lattice expansion of the main phase.
1. Introduction
Nickel/metal hydride (Ni/MH) batteries have been serving consumer portable electronics, hybrid electric vehicles, and stationary applications for more than 30 years [1,2,3,4,5,6]. Until now, the misch metal (Mm)-based AB5 metal hydride (MH) alloy was the mainstream negative electrode active material [7]. In the last decade, the Mm-based superlattice MH alloy began to take over the market share because of its higher capacities; better high-rate dischargeability; and superior low-temperature, high-temperature, and charge retention performances compared to the conventional AB5 MH alloy [2,3,4,5,6,8]. The superlattice MH alloy is composed of more than one phase with alternating A2B4 and AB5 building slabs along the c-direction of the unit cell [2]. There can be one (AB3), two (A2B7), three (A5B19), or more AB5 units between two A2B4 slabs. Depending on the stacking sequence, either the hexagonal or rhombohedral structures are possible. The A-site of the superlattice MH alloy contains both rare-earth (RE) and alkaline earth (usually Mg) elements. While almost all academic research has focused on the single RE element (La or Nd)-based superlattice MH alloys (for reviews, see [9,10,11]), commercial applications have adopted the Mm composition for a higher cycle stability [2,12]. In the past, a few papers about the substitution works performed in the Mm-based superlattice alloy family with Al [13], Mn [14,15], Fe [16,17], Co [18,19,20], and Ce [21] were published, but a systematic performance comparison between a Mm-based superlattice MH alloy and a standard AB5 MH alloy is absent. Therefore, we conducted a series of battery performance evaluations in the sealed cells made with both materials and report the results here.
2. Experimental Setup
Both the AB5 and superlattice alloys were prepared by Eutectix (Troy, Michigan, USA) with a conventional 250 kg induction melting furnace [22]. The ingot was placed in a retort and annealed at 960 °C in vacuum (AB5) or 1 atm atmosphere of Ar (superlattice) for 8 h. The annealed ingots were crushed and ground into the size of −200 mesh. A Philips X’Pert Pro X-ray diffractometer (XRD; Amsterdam, the Netherlands) and a JEOL-JSM6320F scanning electron microscope (SEM; Tokyo, Japan) were used to study the alloys’ microstructures. A Suzuki Shokan multi-channel pressure–concentration–temperature system (PCT; Tokyo, Japan) was used to study the gaseous-phase hydrogen storage characteristics. Electrochemical properties were evaluated with negative electrodes made by dry compacting the annealed alloy powder onto an expanded nickel substrate. A CTE MCL2 Mini cell testing system (Chen Tech Electric MFG. Co., Ltd., New Taipei, Taiwan) was used to study the alloys’ half-cell characteristics.
For the sealed-cell performance evaluation, a C-size cylindrical high-power design was chosen. Negative (0.193 mm thick) and positive electrodes (two thicknesses: 0.300 and 0.361 mm) were made using the dry-compaction and wet-paste methods [23], respectively. Positive electrode paste was composed of 89% standard AP50 [24] with a composition of Ni0.91Co0.045Zn0.045(OH)2 (BASF—Ovonic, Rochester Hills, Michigan, USA), and 5 wt % Co and 6% Co(OH)2 powders on a nickel foam substrate. A Freudenberg FS2225 fluorinated acrylic acid grafted polyethylene/polypropylene non-woven fabric (Freudenberg Group, Weinheim, Germany) was used as the separator. In this high-power cell design, a high negative-to-positive capacity ratio cell design (about 1.7) was used to ensure a large amount of overcharge reservoir [25]. A 30 wt % KOH solution with LiOH (1.5 wt %) additive was used as the electrolyte. A six-cycle activation process using a Maccor battery cycler (Maccor, Tulsa, Oklahoma, USA) was conducted for each cell [26]. The battery performance testing procedures can be found in an earlier publication [27].
3. Results and Discussion
3.1. Alloy Properties Comparison
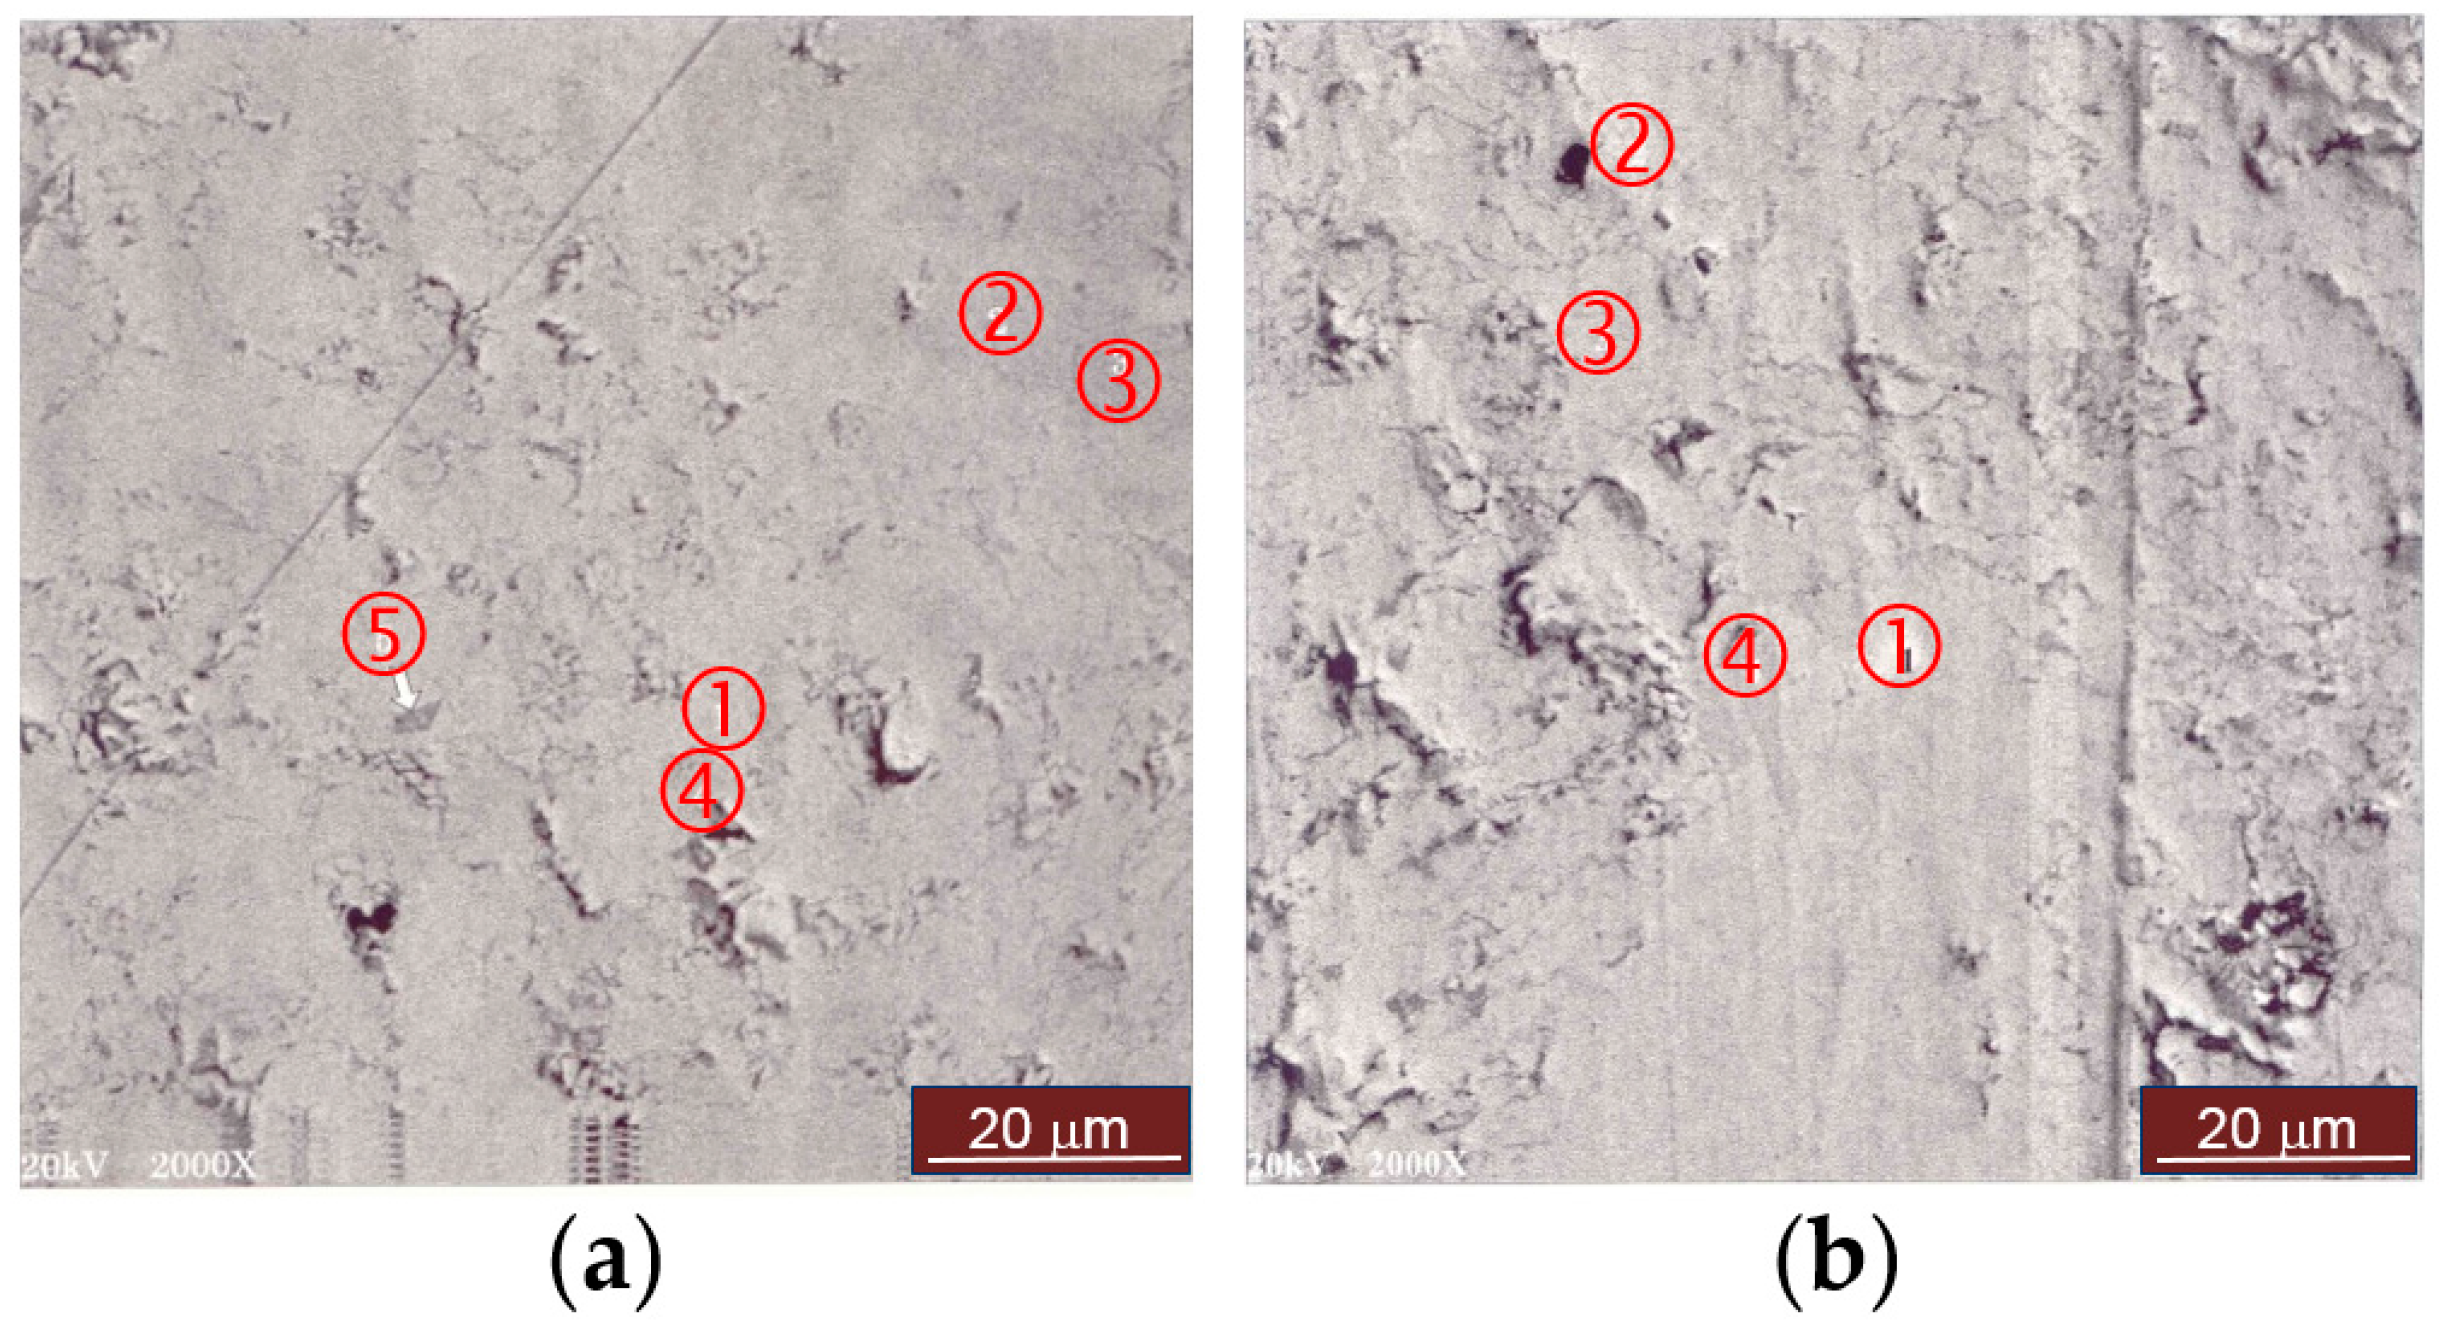
Alloy A, the most popular AB5 alloy used in the industry with a composition of La10.5Ce4.3Pr0.5Nd1.4Ni60Co12.7Mn5.9Al4.7, was used as the control in this comparison work. Alloy B with a composition of La11.3Pr1.7Nd5.1Mg4.5Ni63.6Co13.6Zr0.2, which shows the lowest charge-transfer resistance in a comparative study [28], was the superlattice alloy under the current study. In this composition, Pr and Nd were added to reduce the corrosion nature of the alloy, Ce and Mn were not included in the consideration of cycle stability and self-discharge [2,21], Co was added for low-temperature performance enhancement [19], and a very small amount of Zr was added for scavenging residual oxygen in the chamber. The B/A stoichiometry of 3.42 was chosen through an optimization study judging the electrochemical performance. While annealed alloy A has only one CaCu5 phase, as seen from its XRD pattern (Figure 10a in [28]), alloy B shows a multi-phase structure in both pristine and annealed conditions (Figure 1). Phase abundances calculated from the XRD data are listed in Table 1. After annealing, the abundance of the desirable Nd2Ni7 phase [29] increased from 0 to 56.7 wt %; the unwanted CaCu5 phase [30] decreased from 32.7 to 1.6 wt %; and LaMgNi4 and other superlattice phases, such as CeNi3, NdNi3, Sm5Ni19 and Ni5Co19, still existed. SEM analysis was used to confirm the XRD findings, and two representative backscattering electron micrographs for pristine and annealed alloy B are shown in Figure 2. X-ray energy-dispersive spectroscopy (EDS) was used to study the chemical compositions of a few spots in Figure 2, and the results are summarized in Table 2. In the pristine sample, the AB5 phase (spots 2 and 3) can be identified by its relatively bright contrast due to the higher content of low-atomic weight nickel. Later, the AB5 phase was removed by annealing. The superlattice phases are difficult to separate by contrast in the micrographs because of their similar chemical composition and stoichiometry. The microstructural analyses conclude that while annealed alloy A has only one CaCu5 structure, alloy B (before or after annealing) is a superlattice-based (>95 wt %) multi-phase alloy.
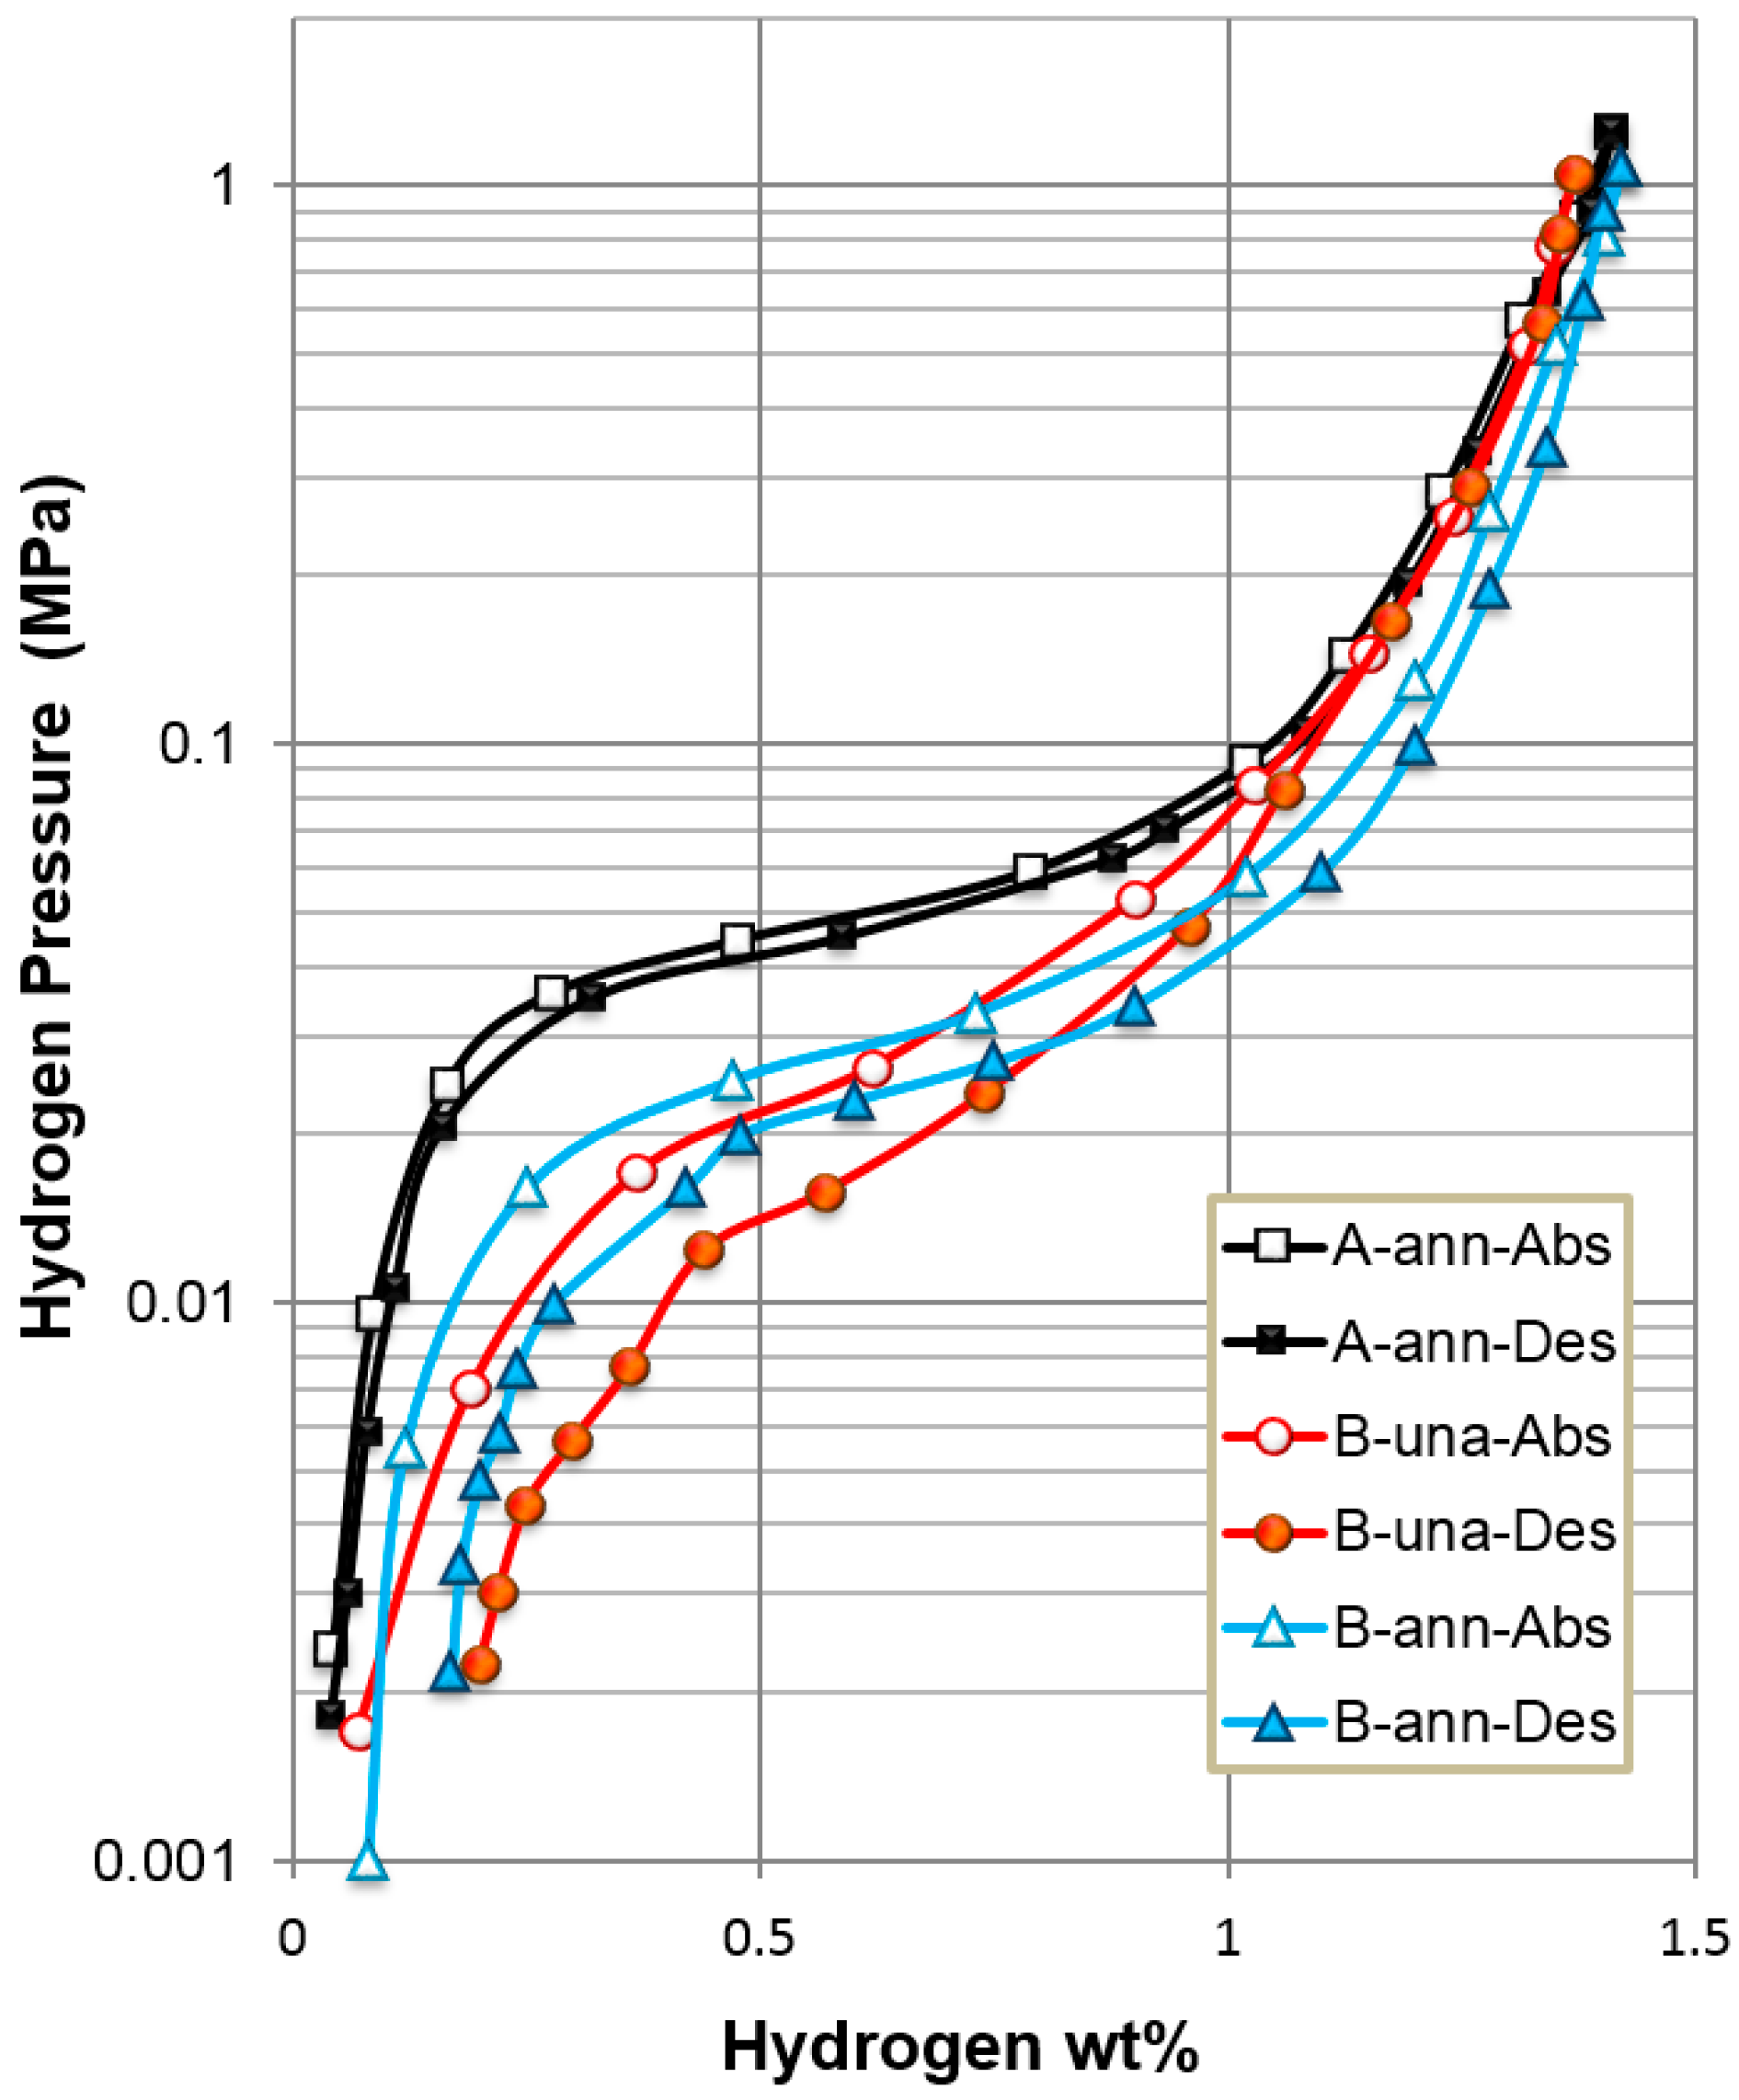
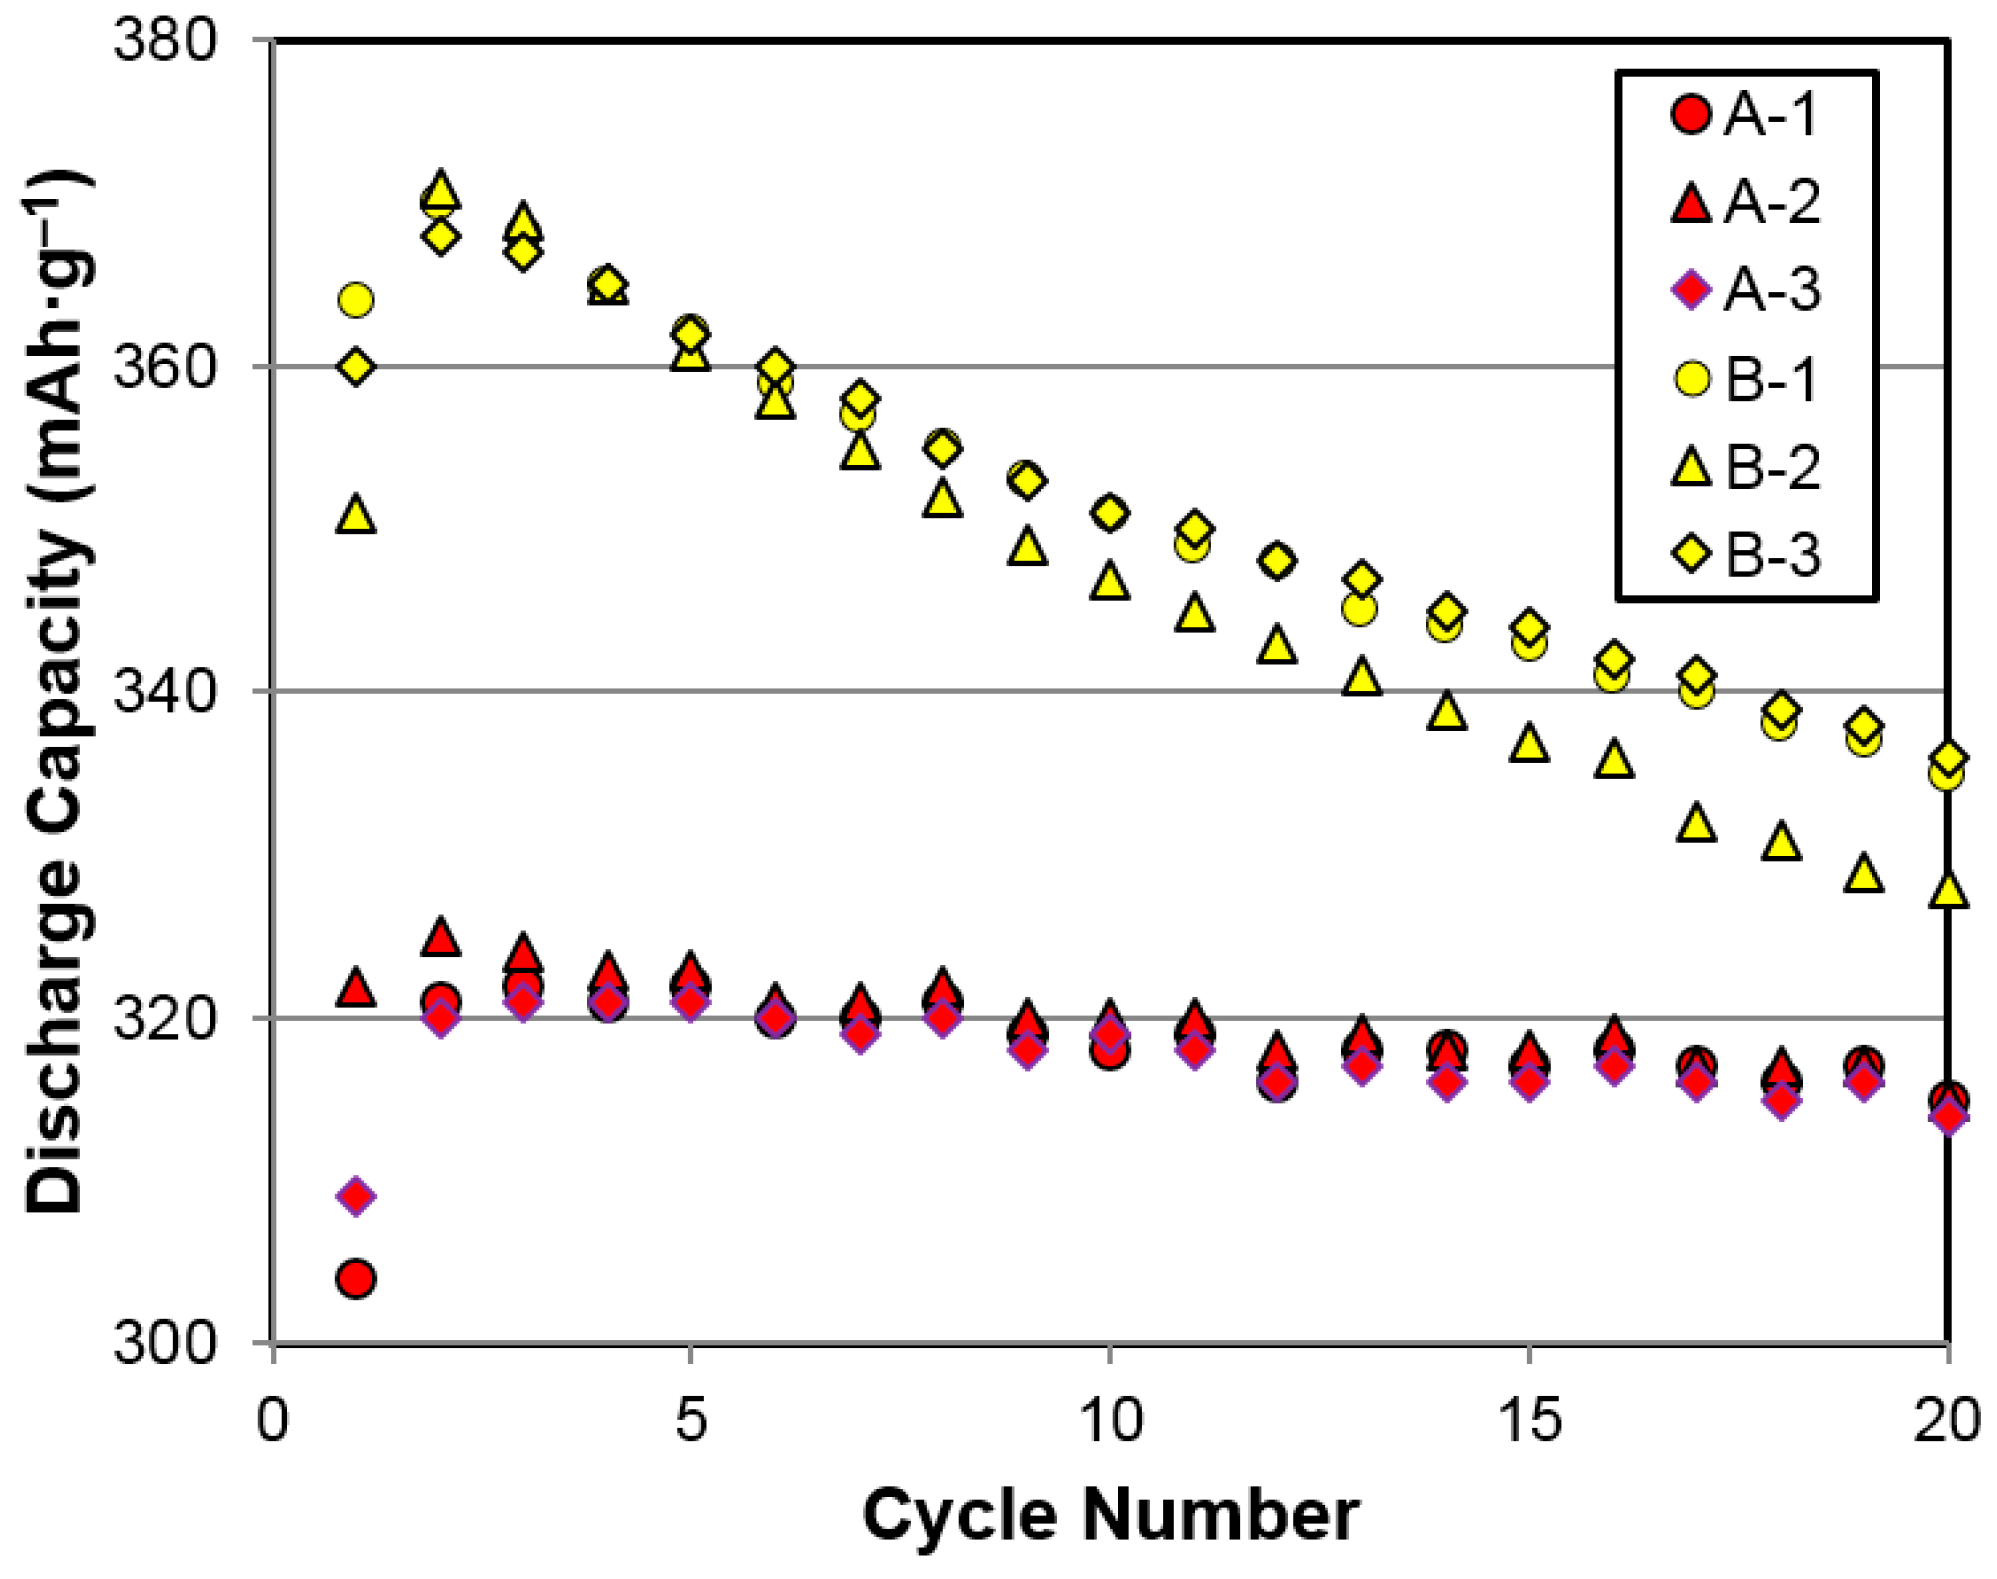
Both the gaseous phase and electrochemical hydrogen storage characteristics of alloys A (AB5) and B (superlattice) were studied. In the gaseous phase, PCT isotherms measured at 30 °C for both alloys are plotted in Figure 3. Annealed alloy A has a higher plateau pressure and a higher reversible capacity than pristine and annealed alloy B. Annealing in alloy B flattens the isotherm, increases the storage capacity, and reduces the hysteresis, as reported previously [31]. Electrochemical testing results from the first 20 cycles of annealed alloys A and B are compared in Figure 4. Annealed alloy B exhibits a higher initial capacity, but it degrades quickly in the flooded KOH solution compared to annealed Alloy A. The higher oxidation rate in the Mg-containing superlattice alloys is well known, and many electrode fabrication methods have been proposed to overcome this shortcoming [32]. As a result, a commercial cell capable of 6000 cycles with a superlattice alloy has been demonstrated [8]. Gaseous phase and electrochemical hydrogen storage properties of annealed alloys A and B are summarized in Table 3. Plateau pressure is defined as the equilibrium pressure corresponding to a 0.75 wt % storage capacity in the desorption isotherm, and the PCT hysteresis is defined as ln (absorption pressure/desorption pressure) at the same storage capacity. Although the gaseous phase capacities of the two alloys are similar, the superlattice alloy shows a higher electrochemical discharge capacity, which is close to the theoretical limit converted from the gaseous phase capacity (381 mAh·g−1 using the conversion of 1 wt % = 268 mAh·g−1) because of the synergetic effect among the constituent phases [33]. The higher PCT hysteresis in annealed alloy B predicts a higher pulverization rate during repetitive cycling [34].
3.2. Sealed-Cell Performance
Fifty C-size cylindrical cells in a high-power design were made with annealed alloys A (cell A) and B (cell B). After the formation process, the discharge capacities were 2.7 and 3.1 Ah from cells A and B, respectively, with a 0.6 A discharge current. Cell B shows a higher energy density (50.4 vs 41.0 Wh·kg−1) than cell A because of its higher active material capacity, which allows for the matching with a thicker positive electrode (0.361 vs 0.300 mm).
3.2.1. High-Rate
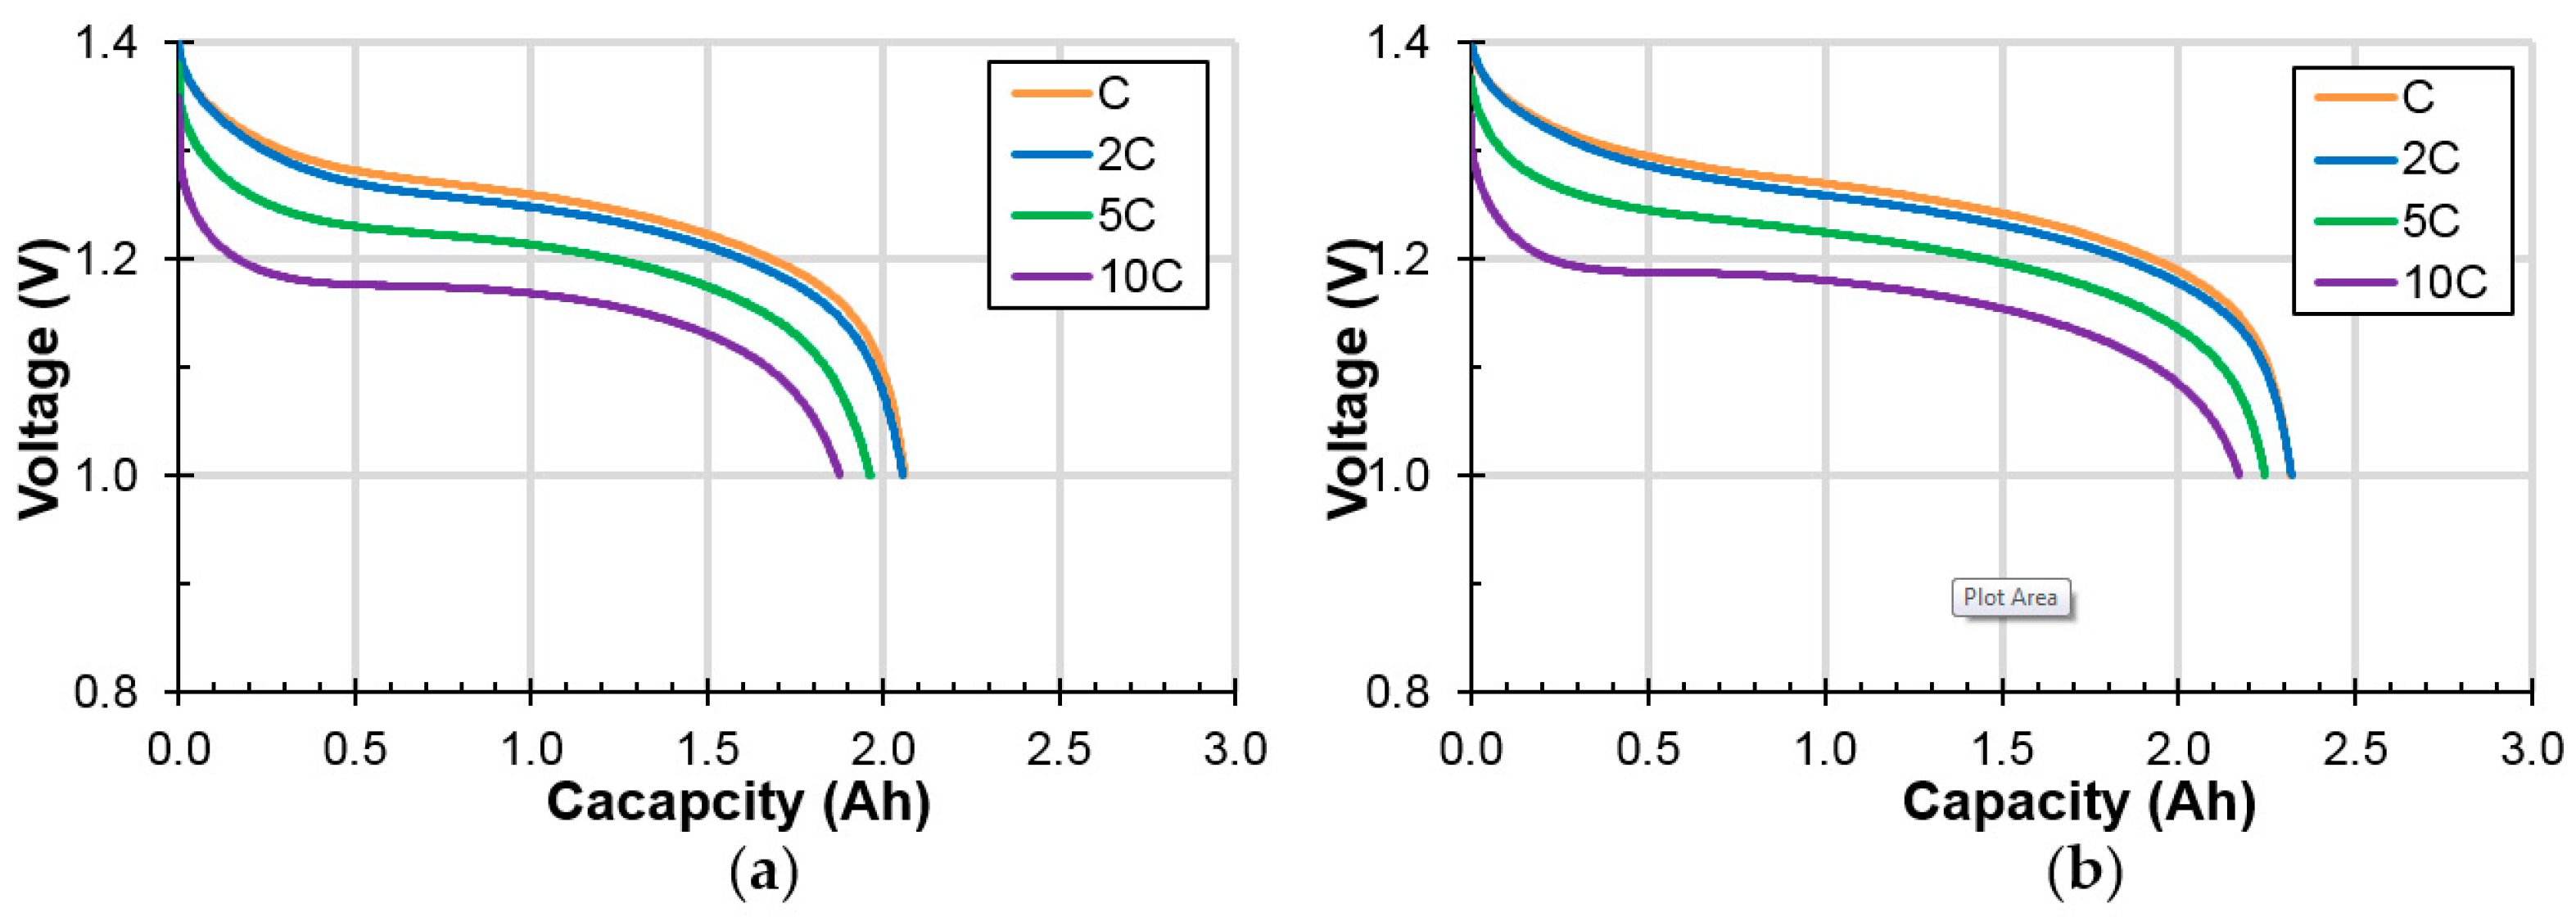
Room temperature (RT) discharge voltage profiles with four different rates (C, 2C, 5C, and 10C) for cells A and B are shown in Figure 5. The cell voltage (V) decreases with the increase in the discharge current (i) following the formula:
where Voc and Rint are the open-circuit voltage (when i = 0) and internal resistance, respectively. Voltage suppression due to the increase in the discharge current is less severe in cell B compared to cell A, which indicates a lower Rint in cell B. Normalized discharge capacities (to those obtained with a 0.2C discharge rate) of cells A and B (set of four each) are listed in Table S1 and indicate a slightly lower high-rate dischargeability of cell B (average value of 84.1% in cell B vs 87.6% in cell A at a 10C rate). However, the capacities of cell B are higher than those of cell A at all discharge rates.
V = Voc − iRint
3.2.2. Low Temperature
Low-temperature performances of cells A and B were evaluated by measuring the capacities at −10 °C with different discharge rates (C, 2C, 5C, and 10C). The resulting discharge voltage profiles are plotted in Figure 6. Voltage suppression due to the increase in the discharge current is more severe at a lower temperature. Only about 50% of the capacity is obtained at −10 °C with C and 2C discharge rates. The cells deliver almost no capacity with further increases in the discharge rate. Normalized −10 °C discharge capacities (to those obtained at RT with a 0.2C discharge rate) of cells A and B (set of four each) are listed and indicate a slightly better low-temperature performance of cell B (average value of 51.6% in cell B vs 49.0% in cell A at a 1C rate).
3.2.3. Charge Retention
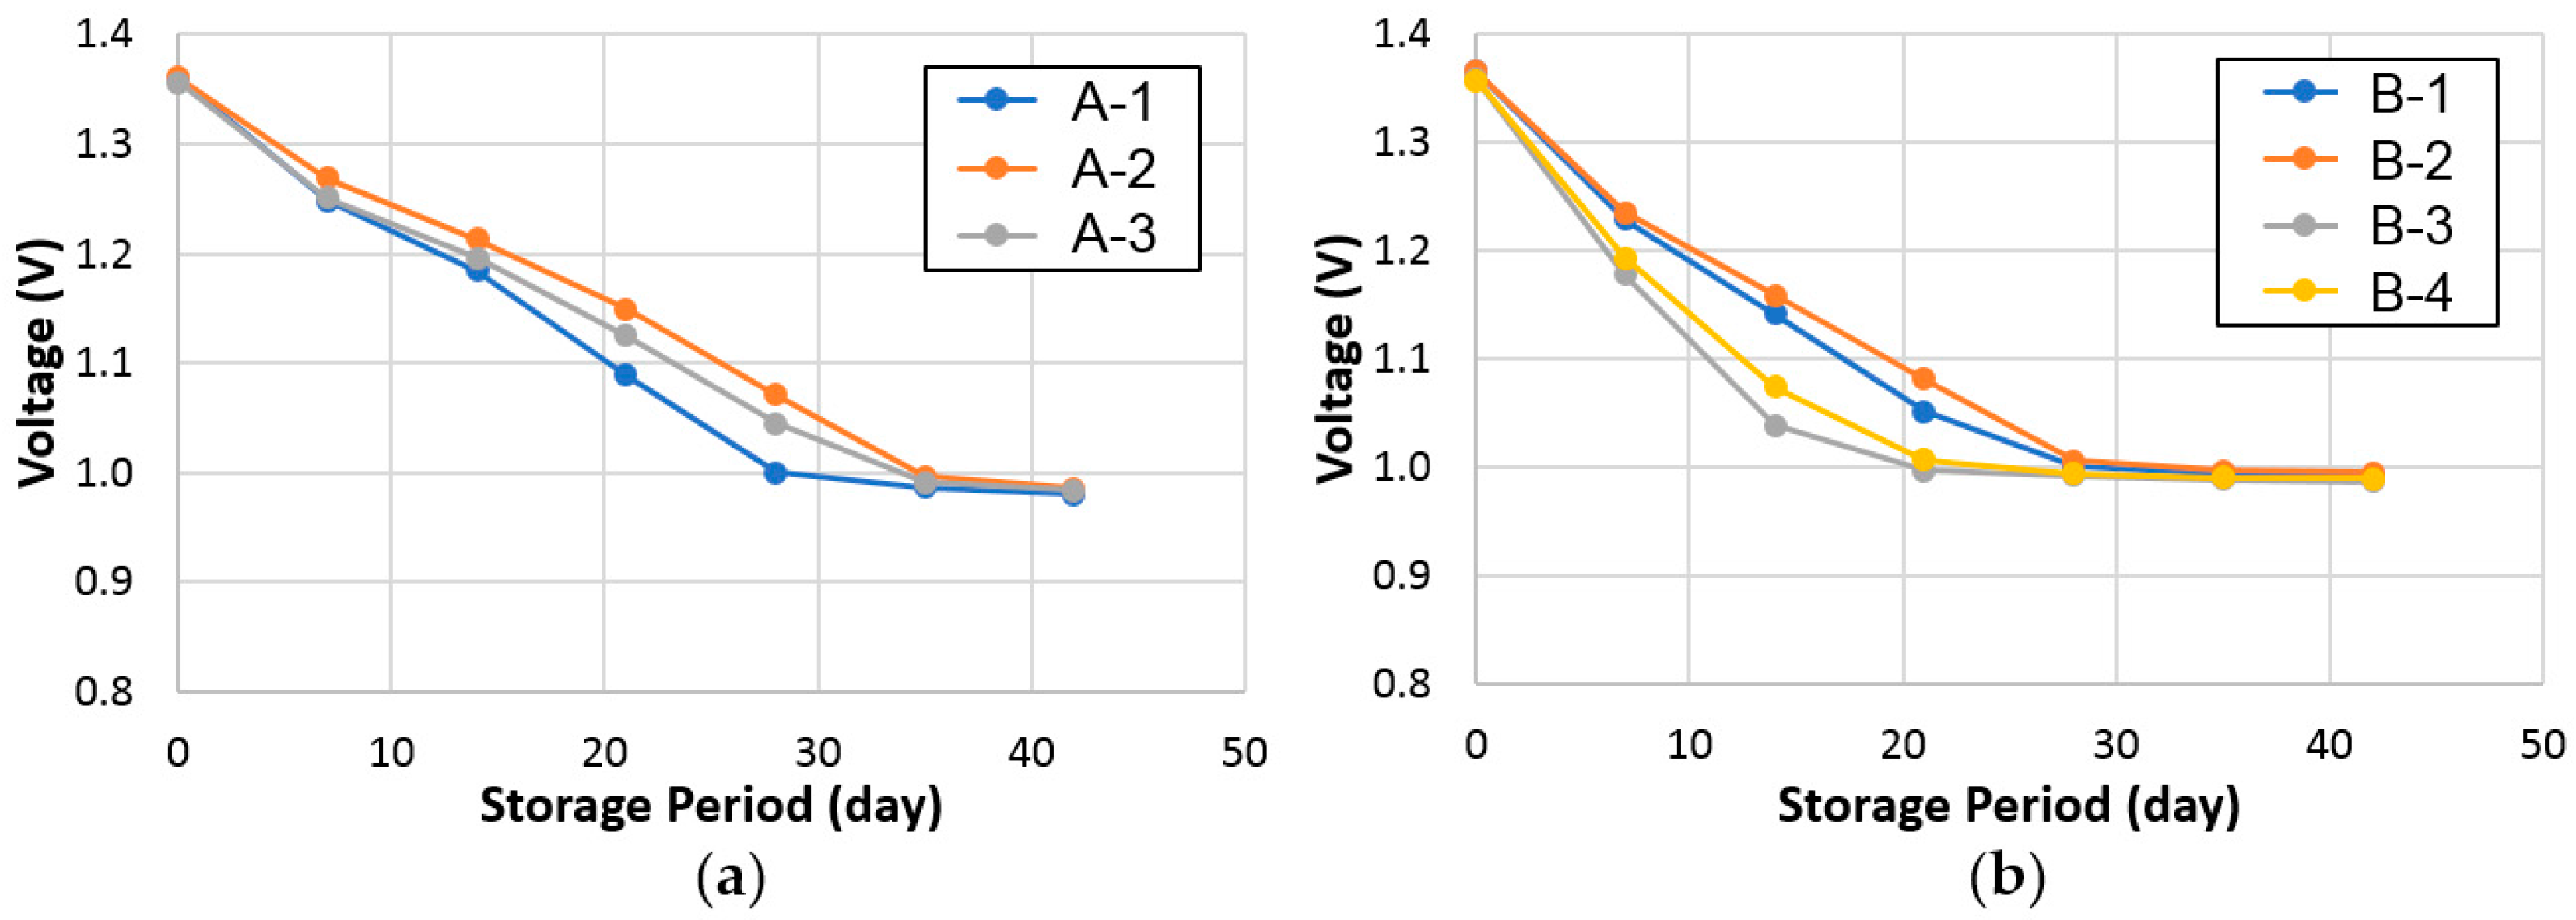
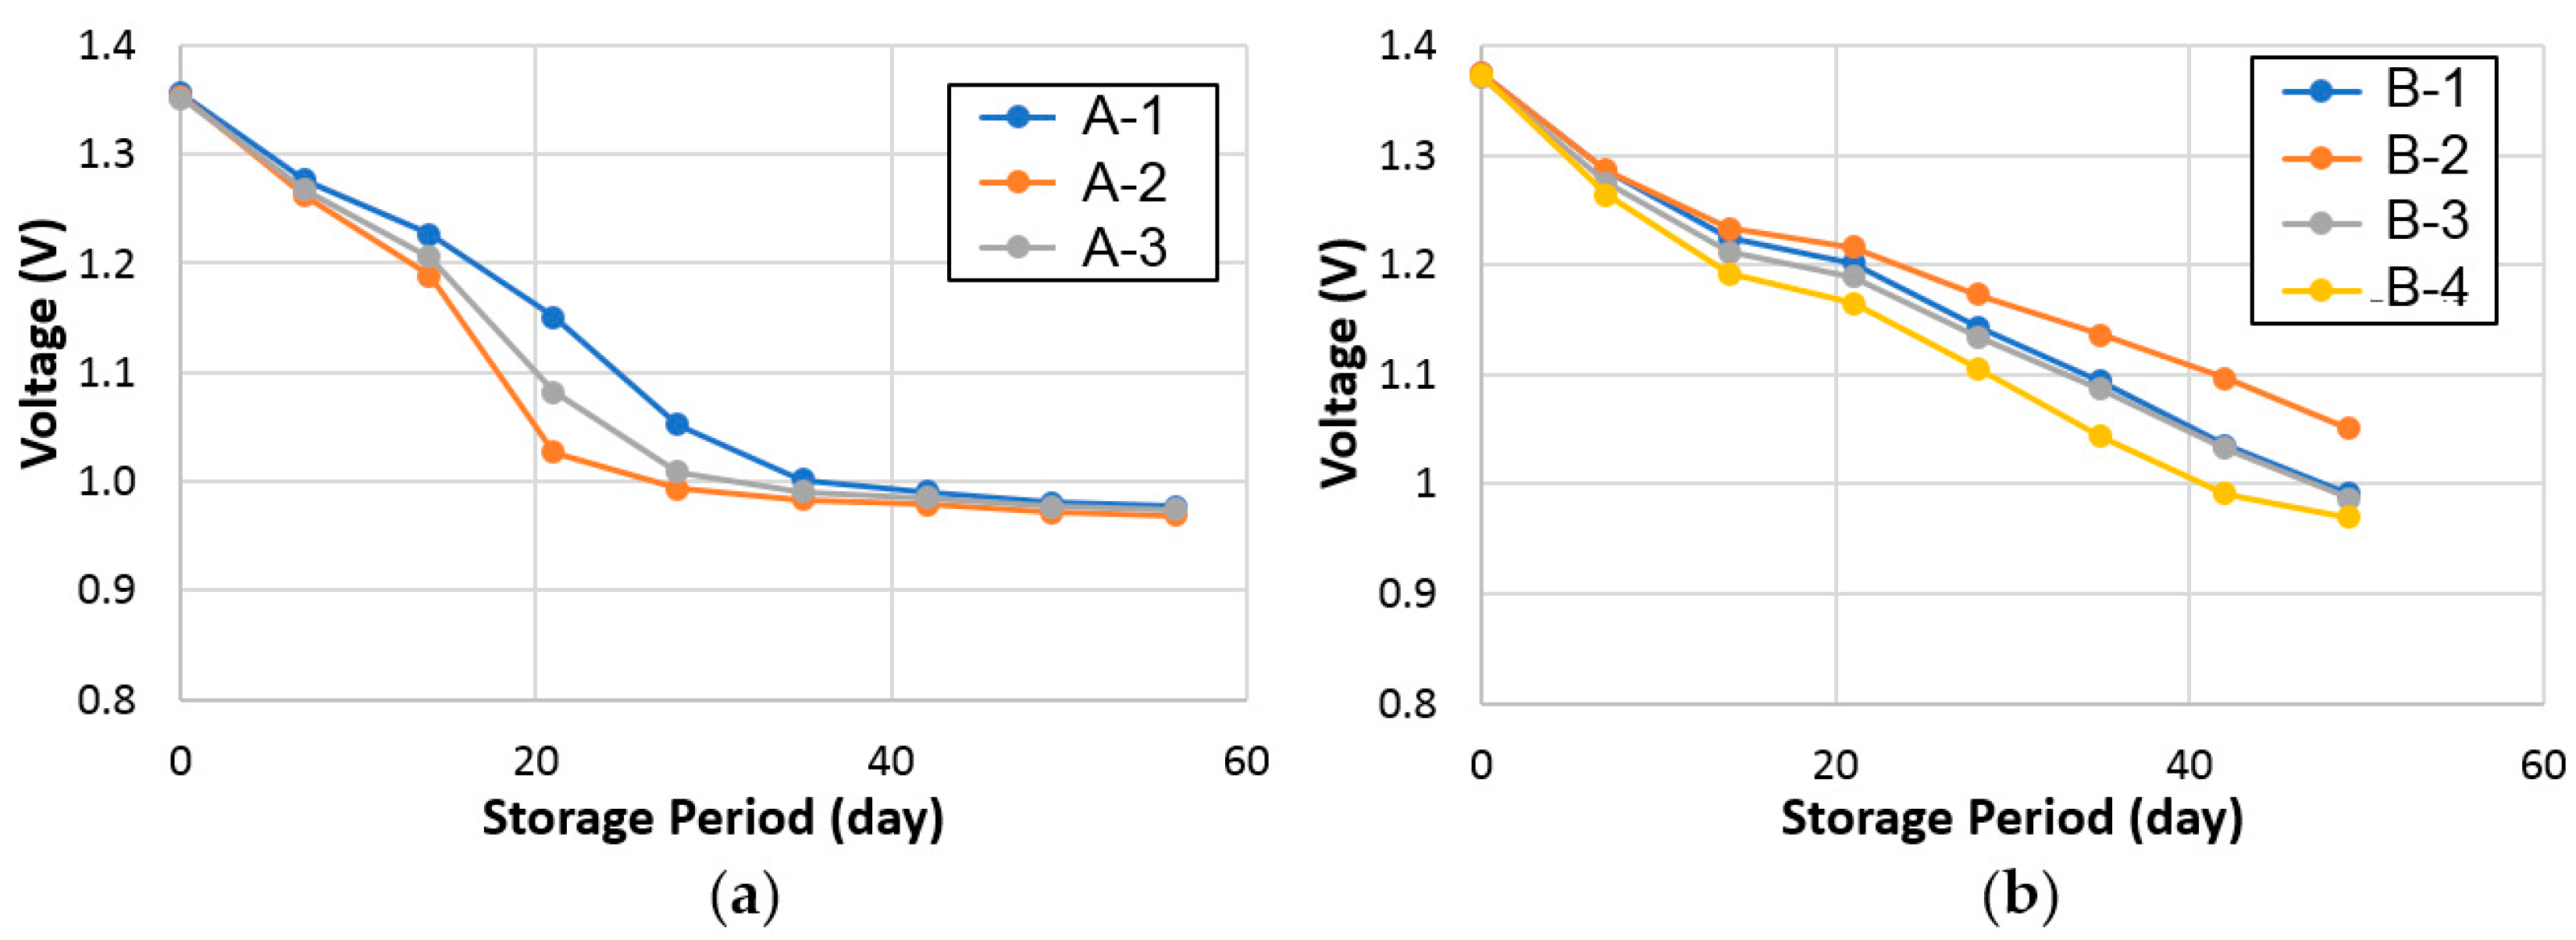
Charge-retention behaviors of cells A and B were evaluated by both the RT and −10 °C standing voltage stabilities at an 80% state-of-charge, and the results are plotted in Figure 7 and Figure 8, respectively. On average, cell A demonstrates a marginally better charge-retention performance at RT but a worse performance at −10 °C compared to cell B.
3.2.4. Internal Resistance
Internal resistance (Rint) was measured by a pulse method using the formula:
Rint = ∆V/∆i
Both 1 and 10 s pulses were used to measure Rints from cells A and B, and data obtained at both RT and −10 °C are listed in Table 4. RT Rints decreases slightly with the increase in the discharge rate. Cell B shows a lower Rints in all measurements.
3.2.5. Surface Charge-Transfer Resistance
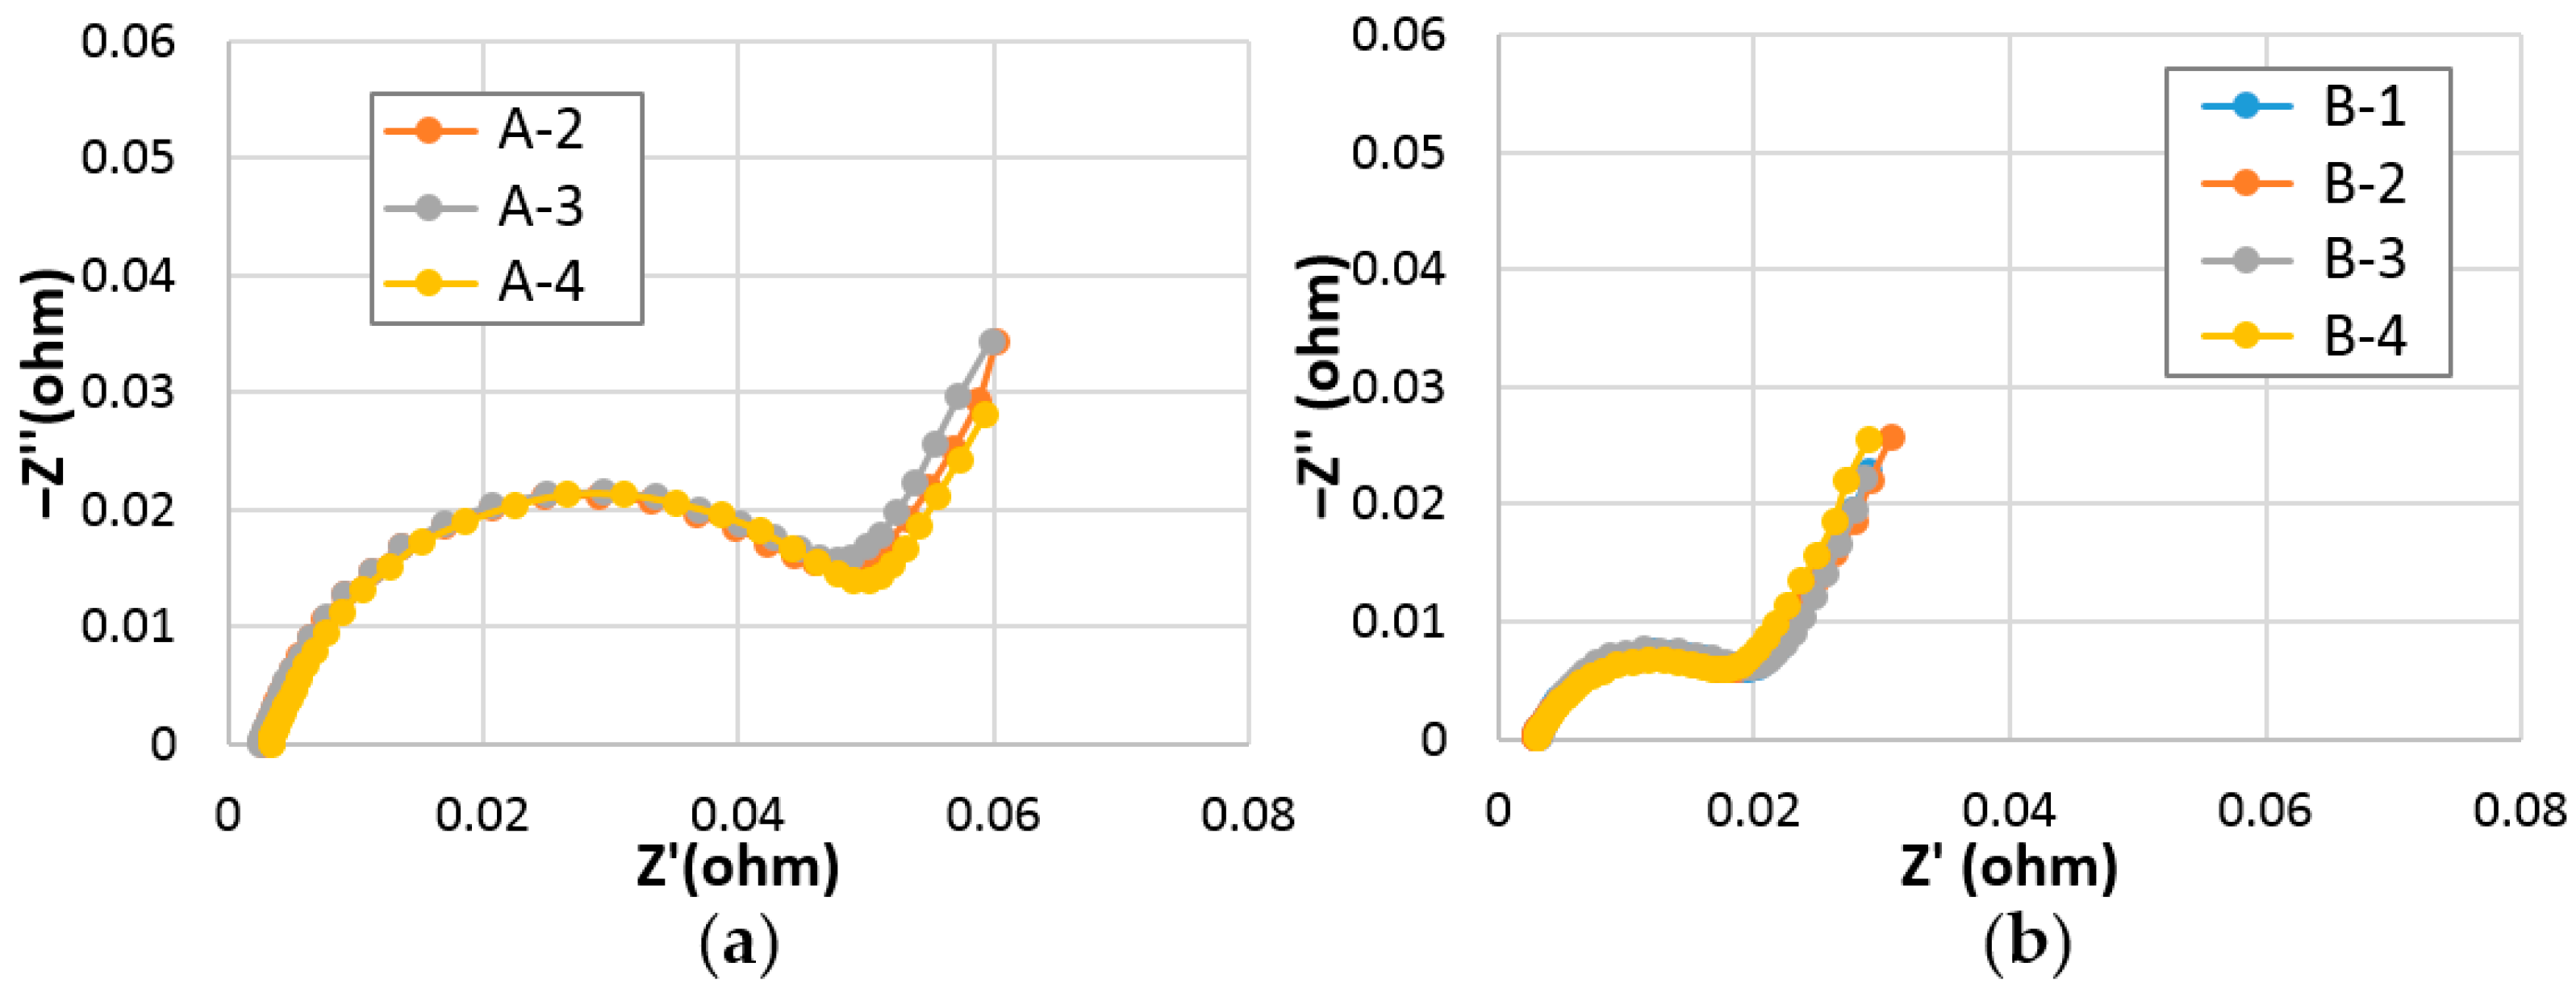
Out of many factors contributing to Rint, ohmic resistance (R0) and surface charge-transfer resistance (Rct) can be deduced from the Cole-Cole plot obtained by the alternating current (AC) impedance measurement [35]. Cole-Cole plots of cells A and B measured at RT and −10 °C are shown in Figure 9 and Figure 10, respectively. Calculated R0 and Rct values, and double-layer capacitances (C) of cells A and B are listed in Table S2. While R0 values in both sets are similar, Rct values in cell B are lower than those in cell A at both RT and −10 °C. Part of the reason for the lower Rct values in cell B is due to the larger surface reactive area (A) of the superlattice alloy from the connection:
where ε and d are the dielectric constant of electrolyte and the alloy surface dipole thickness. Another reason for the lower Rct values in cell B is the higher surface catalytic ability of the superlattice alloy [28].
C = εA/d
3.2.6. Cycle Life
Because the high-power design is usually associated with shallow charge/discharge cycling, a regular C-size configuration with a nominal capacity of 4.5 Ah was used to study the cycle life performance. Cells were built with annealed alloys A and B and tested under a C/2 charge to a −∆V of 3 mV and a C/2 discharge to a cutoff voltage of 0.9 V at RT, and the results are plotted in Figure 11. Without the protective binder commonly used in the commercial cells made with the superlattice alloys [32], the cell made with the superlattice MH alloy (alloy B) only shows half of the cycle life of a cell made with the conventional AB5 MH alloy (alloy A). Earlier studies on the failure mode of a Mm-based Al-free superlattice MH alloy indicated that the pulverization of the main phase is the main cause of capacity degradation [30].
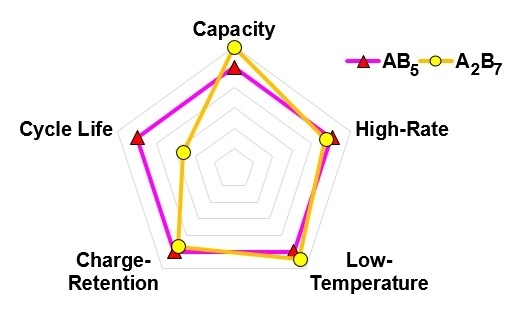
3.2.7. Comparison
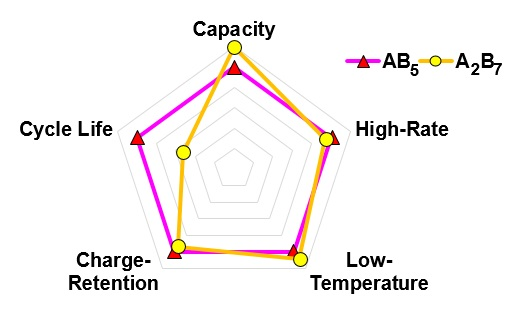
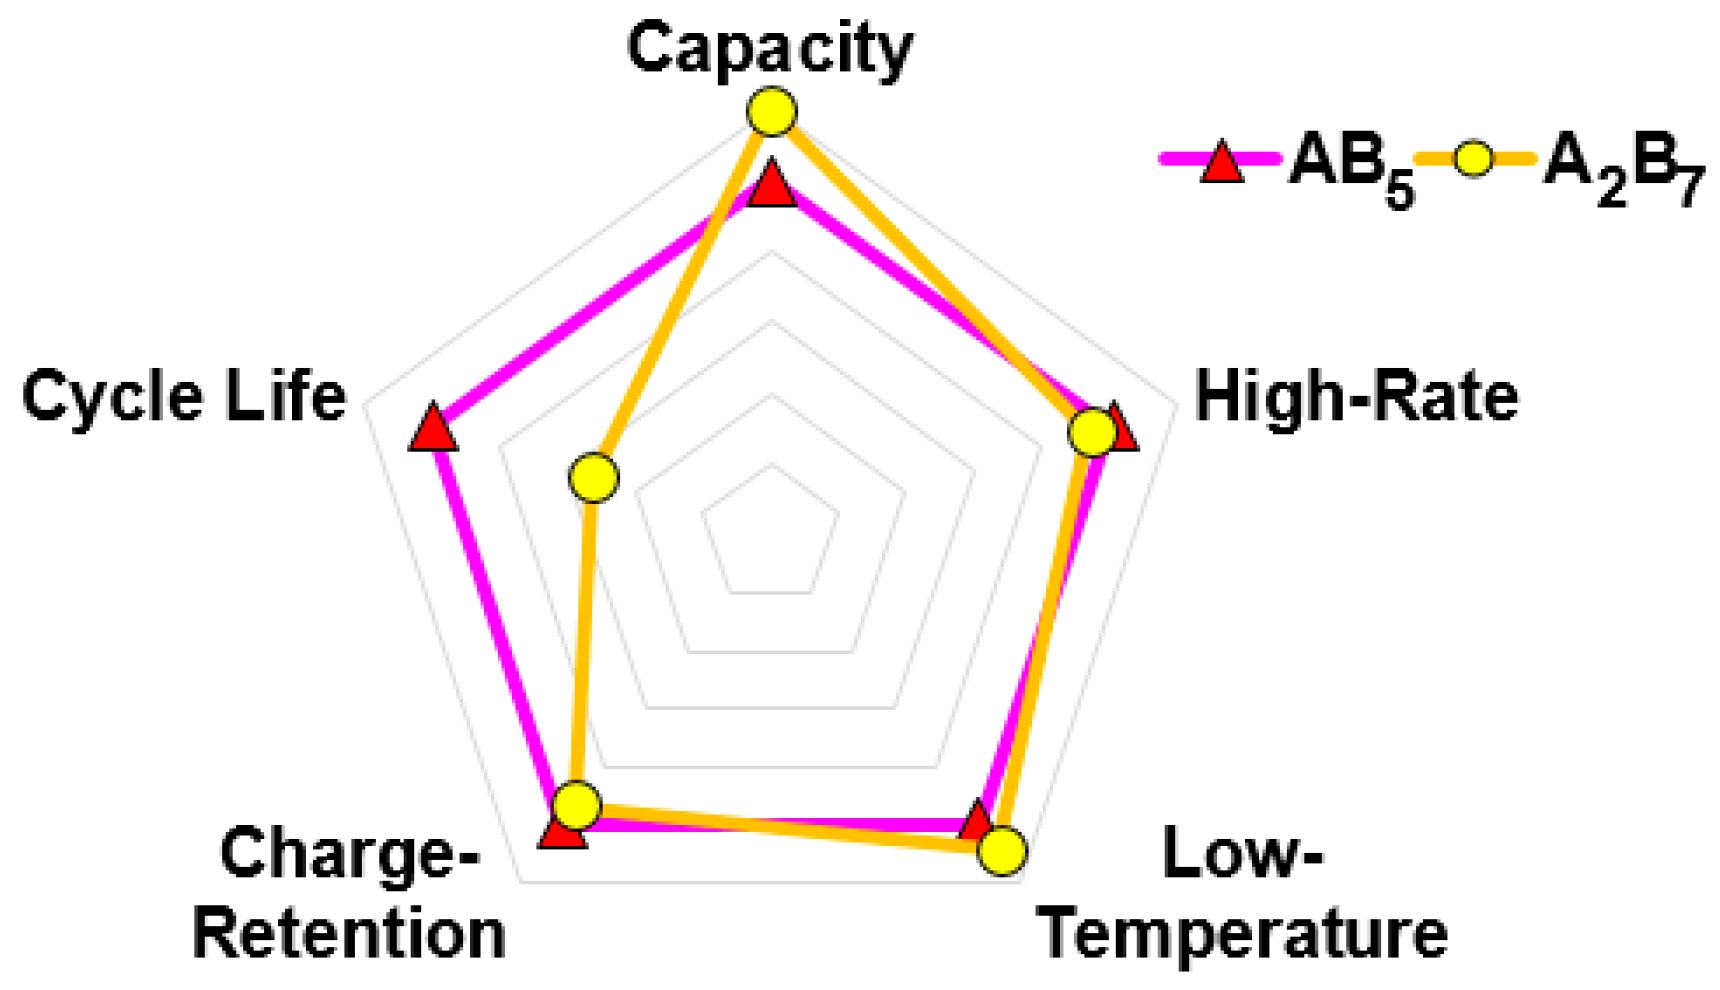
A battery performance comparison between cells made with the AB5 (cell A) and Al-free A2B7-based superlattice (cell B) MH alloys is summarized in Figure 12. Cell B has a higher capacity and a better low-temperature performance; however, it demonstrates slightly worse high-rate dischargeability and charge retention, and its cycle life is only half that of cell A. Despite the lower Rint and Rct in cell B, it still shows a lower normalized capacity at a higher rate, which may be associated with the relatively low Voc at RT caused by alloy B’s relatively low equilibrium plateau pressure (Figure 2). In another article, cells made with an Al-containing superlattice MH alloy showed a comparable cycle life and better peak power and charge-retention performance compared to those made with the AB5 alloy [19]. Therefore, the inferior cycle life observed in the superlattice alloy is only limited to the Al-free composition used in this study. Combined with the use of a hydrophobic binder in the negative-electrode paste [32], the Al-containing superlattice alloy showed even better cycle stability [8].
4. Conclusions
Electrochemical performances of a misch metal-based Al-free superlattice metal hydride alloy were compared to those of a standard AB5 metal hydride alloy in a high-power C-size cell configuration. In the sealed cell, the superlattice alloy showed higher energy densities, lower internal resistances, lower surface charge-transfer resistances at both RT and −10 °C compared to the AB5 alloy. For the charge-retention performance, the superlattice alloy was slightly worse at RT but outperformed the AB5 alloy at −10 °C. The cycle stability of the superlattice alloy tested in a regular cell configuration is inferior to that of the AB5 alloy mainly because of alloy pulverization.
Supplementary Materials
The following are available online at https://www.mdpi.com/2313-0105/3/4/35/s1, Table S1: Discharge capacities normalized to those obtained at a 0.2C rate from four Cells A and four Cells B measured at both room temperature and −10 °C. All numbers are in %. SD denotes standard deviation, Table S2: Ohmic resistances (R0 in W), surface charge-transfer resistances (Rct in W), and double-layer capacitances (C in Farad) from Cells A and B measured at both room temperature (RT) and −10 °C. SD denotes standard deviation.
Acknowledgments
The authors would like to thank the following individuals from BASF—Ovonic for their help: Su Cronogue, Taihei Ouchi, Jean Nei, Shiuan Chang, Nathan English, Sui-ling Chen, Cheryl Setterington, David Pawlik, Allen Chan, and Ryan J. Blankenship.
Author Contributions
John M. Koch designed and performed the experiments. Kwo-Hsiung Young prepared the alloys and the manuscript. Chaolan Hu and Benjamin Reichman conducted the AC impedance measurements and interpreted the data.
Conflicts of Interest
The authors declare no conflict of interest.
Abbreviations
| Ni/MH | Nickel/metal hydride |
| Mm | Misch metal |
| MH | Metal hydride |
| RE | Rare-earth |
| XRD | X-ray diffractometer |
| SEM | Scanning electron microscope |
| PCT | Pressure–concentration–temperature |
| EDS | Energy-dispersive spectroscopy |
| HEX | Hexagonal |
| CUB | Cubic |
| RHO | Rhombohedral |
| Abs | Absorption |
| Des | Desorption |
| RT | Room temperature |
| V | Cell voltage |
| i | Current |
| Voc | Open-circuit voltage |
| Rint | Internal resistance |
| R0 | Ohmic resistance |
| Rct | Charge-transfer resistance |
| C | Double-layer capacitance |
| A | Surface reactive area |
| ε | Dielectric constant of electrolyte |
| d | Alloy surface dipole thickness |
References
- Zelinsky, M.A.; Koch, J.M.; Young, K. Performance comparison of rechargeable batteries for stationary applications (Ni/MH vs. Ni-Cd and VRLA). Tatteries 2017. submitted. [Google Scholar]
- Young, K.; Cai, X.; Chang, S. Reviews on Chinese Patents regarding the nickel/metal hydride battery. Batteries 2017, 3, 24. [Google Scholar] [CrossRef]
- Yasuoka, S.; Magari, Y.; Murata, T.; Tanaka, T.; Ishida, J.; Nakamura, H.; Nohma, T.; Kihara, M.; Baba, Y.; Teraoka, H. Development of high-capacity nickel-metal hydride batteries using superlattice hydrogen-absorbing alloys. J. Power Sour. 2006, 156, 662–666. [Google Scholar] [CrossRef]
- Teraoka, H. Development of Low Self-Discharge Nickel-Metal Hydride Battery. Available online: http://www.scribd.com/doc/9704685/Teraoka-Article-En (accessed on 9 April 2016).
- Kai, T.; Ishida, J.; Yasuoka, S.; Takeno, K. The effect of nickel-metal hydride battery’s characteristics with structure of the alloy. In Proceedings of the 54th Battery Symposium in Japan, Osaka, Japan, 6–9 October 2013; p. 210. [Google Scholar]
- Teraoka, H. Development of Ni-MH EThSS with Lifetime and Performance Estimation Technology. In Proceedings of the 34th International Battery Seminar & Exhibit, Fort Lauderdale, FL, USA, 20–23 March 2017. [Google Scholar]
- Teraoka, H. Ni-MH Stationary Energy Storage: Extreme Temperature & Long Life Developments. In Proceedings of the 33th International Battery Seminar & Exhibit, Fort Lauderdale, FL, USA, 21–24 March 2016. [Google Scholar]
- Teraoka, H. Development of Highly Durable and Long Life Ni-MH Batteries for Energy Storage Systems. In Proceedings of the 32th International Battery Seminar & Exhibit, Fort Lauderdale, FL, USA, 9–12 March 2015. [Google Scholar]
- Liu, Y.; Cao, Y.; Huang, L.; Gao, M.; Pan, H. Rare earth-Mg-Ni-based hydrogen storage alloys as negative electrode materials for Ni/MH batteries. J. Alloy. Compd. 2011, 509, 675–686. [Google Scholar] [CrossRef]
- Young, K.; Nei, J. The current status of hydrogen storage alloy development for electrochemical applications. Materials 2013, 6, 4574–4608. [Google Scholar] [CrossRef] [PubMed]
- Liu, J.; Han, S.; Li, Y.; Zhang, L.; Zhao, Y.; Yang, S.; Liu, B. Phase structures and electrochemical properties of La–Mg–Ni-based hydrogen storage alloys with superlattice structure. Int. J. Hydrogen Energy 2016, 41, 20261–20275. [Google Scholar] [CrossRef]
- Takasaki, T.; Nishimura, K.; Saito, M.; Fukunaga, H.; Iwaki, T.; Sakai, T. Cobalt-free nickel-metal hydride battery for industrial applications. J. Alloy. Compd. 2013, 580, S378–S381. [Google Scholar] [CrossRef]
- Yasuoka, S.; Ishida, J.; Kai, T.; Kajiwara, T.; Doi, S.; Yamazaki, T.; Kishida, K.; Inui, H. Function of aluminum in crystal structure of rare earth-Mg-Ni hydrogen-absorbing alloy and deterioration mechanism of Nd0.9Mg0.1Ni3.4 and Nd0.9Mg0.1Ni3.3Al0.2 alloys. Int. J. Hydrogen Energy 2017, 42, 11574–11583. [Google Scholar] [CrossRef]
- Young, K.; Wong, D.F.; Wang, L.; Nei, J.; Ouchi, T.; Yasuoka, S. Mn in misch-metal based superlattice metal hydride alloy—Part 1 Structural, hydrogen storage and electrochemical properties. J. Power Sour. 2015, 277, 426–432. [Google Scholar] [CrossRef]
- Young, K.; Wong, D.F.; Wang, L.; Nei, J.; Ouchi, T.; Yasuoka, S. Mn in misch-metal based superlattice metal hydride alloy—Part 2 Ni/MH battery performance and failure mechanism. J. Power Sour. 2015, 277, 433–442. [Google Scholar] [CrossRef]
- Young, K.; Ouchi, T.; Nei, J.; Yasuoka, S. Fe-substitution for Ni in misch metal-based superlattice hydrogen absorbing alloys—Part 1. Structural, hydrogen storage, and electrochemical properties. Batteries 2016, 2, 34. [Google Scholar] [CrossRef]
- Meng, T.; Young, K.; Nei, J.; Koch, J.M.; Yasuoka, S. Fe-substitution for Ni in misch metal-based superlattice hydrogen absorbing alloys—Part 2. Ni/MH battery performance and failure mechanisms. Batteries 2017, 3, 28. [Google Scholar] [CrossRef]
- Wang, L.; Young, K.; Meng, T.; Ouchi, T.; Yasuoka, S. Partial substitution of cobalt for nickel in mixed rare earth metal based superlattice hydrogen absorbing alloy—Part 1 structural, hydrogen storage and electrochemical properties. J. Alloy. Compd. 2016, 660, 407–415. [Google Scholar] [CrossRef]
- Wang, L.; Young, K.; Meng, T.; English, N.; Yasuoka, S. Partial substitution of cobalt for nickel in mixed rare earth metal based superlattice hydrogen absorbing alloy—Part 2 battery performance and failure mechanism. J. Alloy. Compd. 2016, 664, 417–427. [Google Scholar] [CrossRef]
- Meng, T.; Young, K.; Koch, J.; Ouchi, T.; Yasuoka, S. Failure mechanisms of nickel/metal hydride batteries with cobalt-substituted superlattice hydrogen-absorbing alloy anodes at 50 °C. Batteries 2016, 2, 20. [Google Scholar] [CrossRef]
- Yasuoka, S.; Ishida, J.; Kishida, K.; Inui, H. Effects of cerium on the hydrogen absorption-desorption properties of rare earth-Mg-Ni hydrogen-absorbing alloys. J. Power Sour. 2017, 346, 56–62. [Google Scholar] [CrossRef]
- Young, K.; Chang, S.; Lin, X. C14 Laves phase metal hydride alloys for Ni/MH batteries applications. Batteries 2017, 3, 27. [Google Scholar] [CrossRef]
- Chang, S.; Young, K.; Nei, J.; Fierro, C. Reviews on the U.S. Patents regarding nickel/metal hydride batteries. Batteries 2016, 2, 10. [Google Scholar] [CrossRef]
- Young, K.; Wang, L.; Yan, S.; Liao, X.; Meng, T.; Shen, H.; May, W.C. Fabrications of high-capacity alpha-Ni(OH)2. Batteries 2017, 3, 6. [Google Scholar] [CrossRef]
- Young, K.; Wu, A.; Qiu, Z.; Tan, J.; Mays, W. Effects of H2O2 addition to the cell balance and self-discharge of Ni/MH batteries with AB5 and A2B7 alloys. Int. J. Hydrogen Energy 2012, 37, 9882–9891. [Google Scholar] [CrossRef]
- Young, K.; Koch, J.M.; Wan, C.; Denys, R.V.; Yartys, V.A. Cell performance comparison between C14- and C15-predominated AB2 metal hydride alloys. Batteries 2017, 3, 29. [Google Scholar] [CrossRef]
- Yan, S.; Meng, T.; Young, K.; Nei, J. A Ni/MH pouch cell with high-capacity Ni(OH)2. Tatteries 2017. submitted. [Google Scholar]
- Meng, T.; Young, K.; Hu, C.; Reichman, B. Effects of alkaline pre-etching to metal hydride alloys. Batteries 2017, 3, 30. [Google Scholar] [CrossRef]
- Young, K.; Ouchi, T.; Koch, J.M.; Lien, Y. Comparison among constituent phases in superlattice metal hydride alloys for battery applications. Tatteries 2017. submitted. [Google Scholar] [CrossRef]
- Zhou, X.; Young, K.; West, J.; Regalado, J.; Cherisol, K. Degradation mechanisms of high-energy bipolar nickel metal hydride battery with AB5 and A2B7 alloys. J. Alloy. Compd. 2013, 580, S373–S377. [Google Scholar] [CrossRef]
- Young, K.; Ouchi, T.; Huang, B. Effects of various annealing conditions on (Nd, Mg, Zr)(Ni, Al, Co)3.74 metal hydride alloys. J. Power Sour. 2014, 248, 147–153. [Google Scholar] [CrossRef]
- Ouchi, T.; Young, K.; Moghe, D. Reviews on the Japanese Patent Applications regarding nickel/metal hydride batteries. Batteries 2016, 2, 21. [Google Scholar] [CrossRef]
- Young, K.; Ouchi, T.; Meng, T.; Wong, D.F. Studies on the synergetic effects in multi-phase metal hydride alloys. Batteries 2016, 2, 15. [Google Scholar] [CrossRef]
- Osumi, Y. Suiso Kyuzou Goukin; Agune Technology Center: Tokyo, Japan, 1999; p. 218. (In Japanese) [Google Scholar]
- Zhang, L. AC impedance studies on sealed nickel metal hydride batteries over cycle life in analog and digital operations. Electrochim. Acta 1998, 43, 3333–3342. [Google Scholar] [CrossRef]
Figure 1.
X-ray diffractometer (XRD) patterns using Cu-Kα as the radiation source for (a) pristine, and (b) annealed alloy B.
Figure 1.
X-ray diffractometer (XRD) patterns using Cu-Kα as the radiation source for (a) pristine, and (b) annealed alloy B.
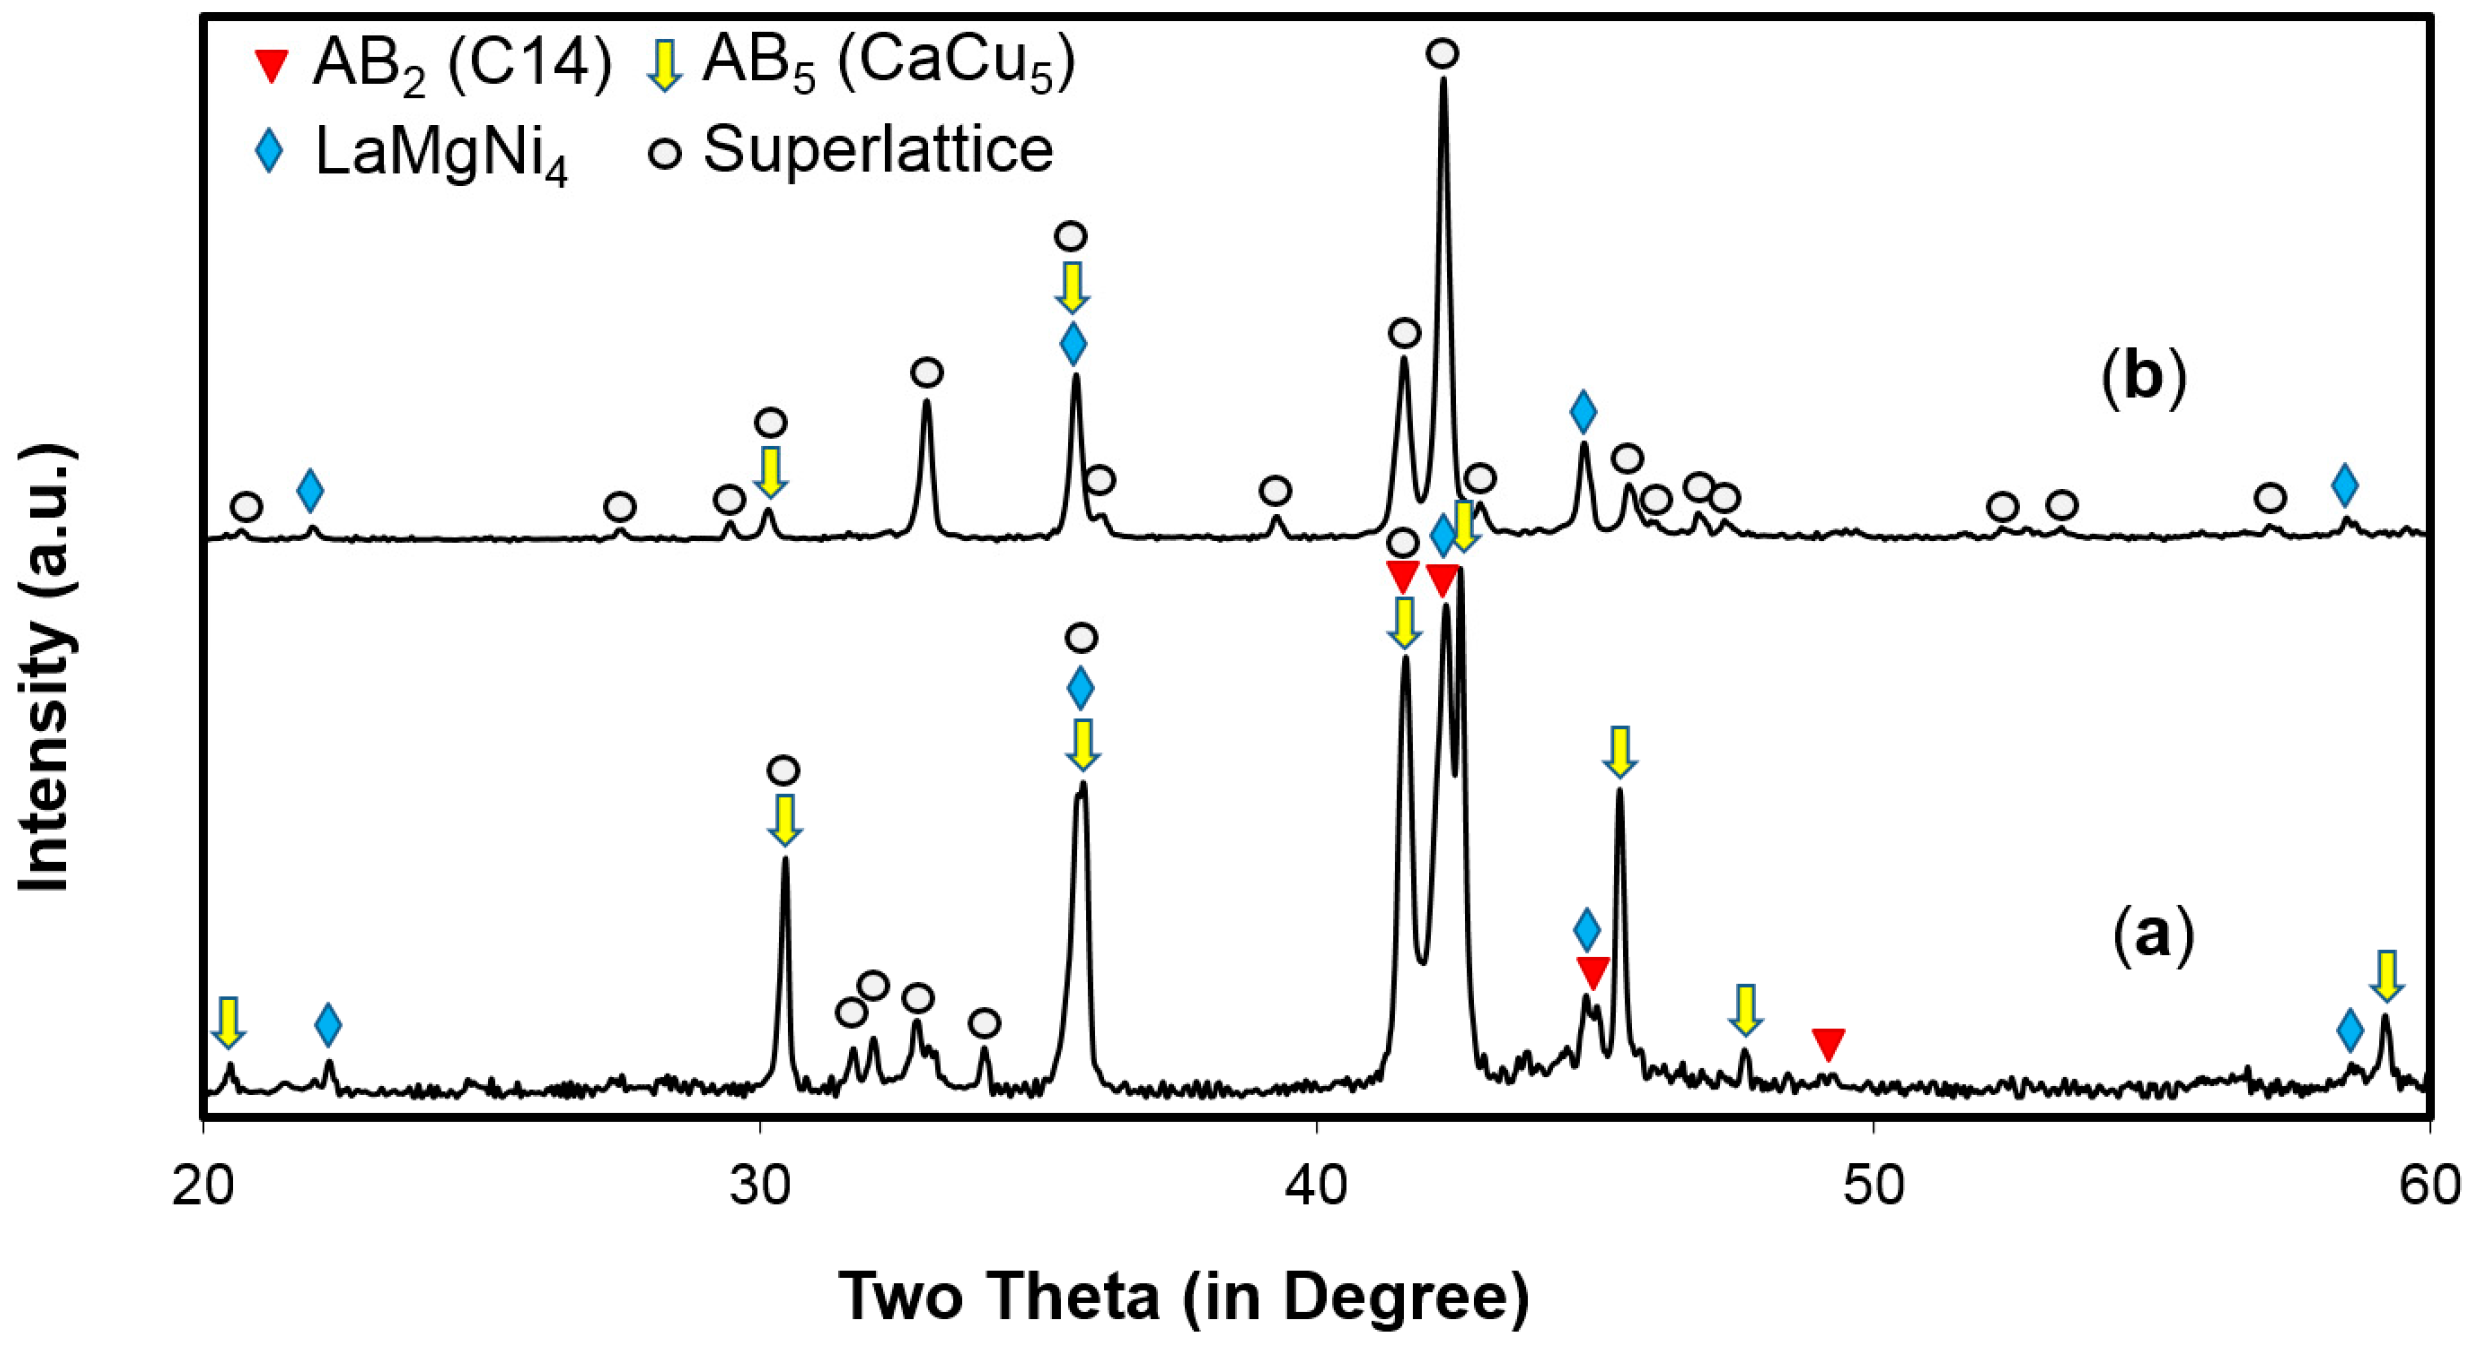
Figure 2.
Scanning electron microscope (SEM) backscattering electron micrographs of (a) pristine, and (b) annealed alloy B.
Figure 2.
Scanning electron microscope (SEM) backscattering electron micrographs of (a) pristine, and (b) annealed alloy B.

Figure 3.
Pressure–concentration–temperature (PCT) isotherms measured at 30 °C. A-ann, B-una, and B-ann are annealed alloy A, pristine alloy B, and annealed alloy B, respectively. Abs and Des denote absorption and desorption, respectively.
Figure 3.
Pressure–concentration–temperature (PCT) isotherms measured at 30 °C. A-ann, B-una, and B-ann are annealed alloy A, pristine alloy B, and annealed alloy B, respectively. Abs and Des denote absorption and desorption, respectively.

Figure 4.
Half-cell capacities measured using the three-electrode cell setup for annealed alloys A and B.
Figure 4.
Half-cell capacities measured using the three-electrode cell setup for annealed alloys A and B.

Figure 5.
Discharge voltage profiles at different discharge rates of (a) cell A, and (b) cell B measured at room temperature.
Figure 5.
Discharge voltage profiles at different discharge rates of (a) cell A, and (b) cell B measured at room temperature.

Figure 6.
Discharge voltage profiles at different discharge rates of (a) cell A, and (b) cell B measured at −10 °C.
Figure 6.
Discharge voltage profiles at different discharge rates of (a) cell A, and (b) cell B measured at −10 °C.
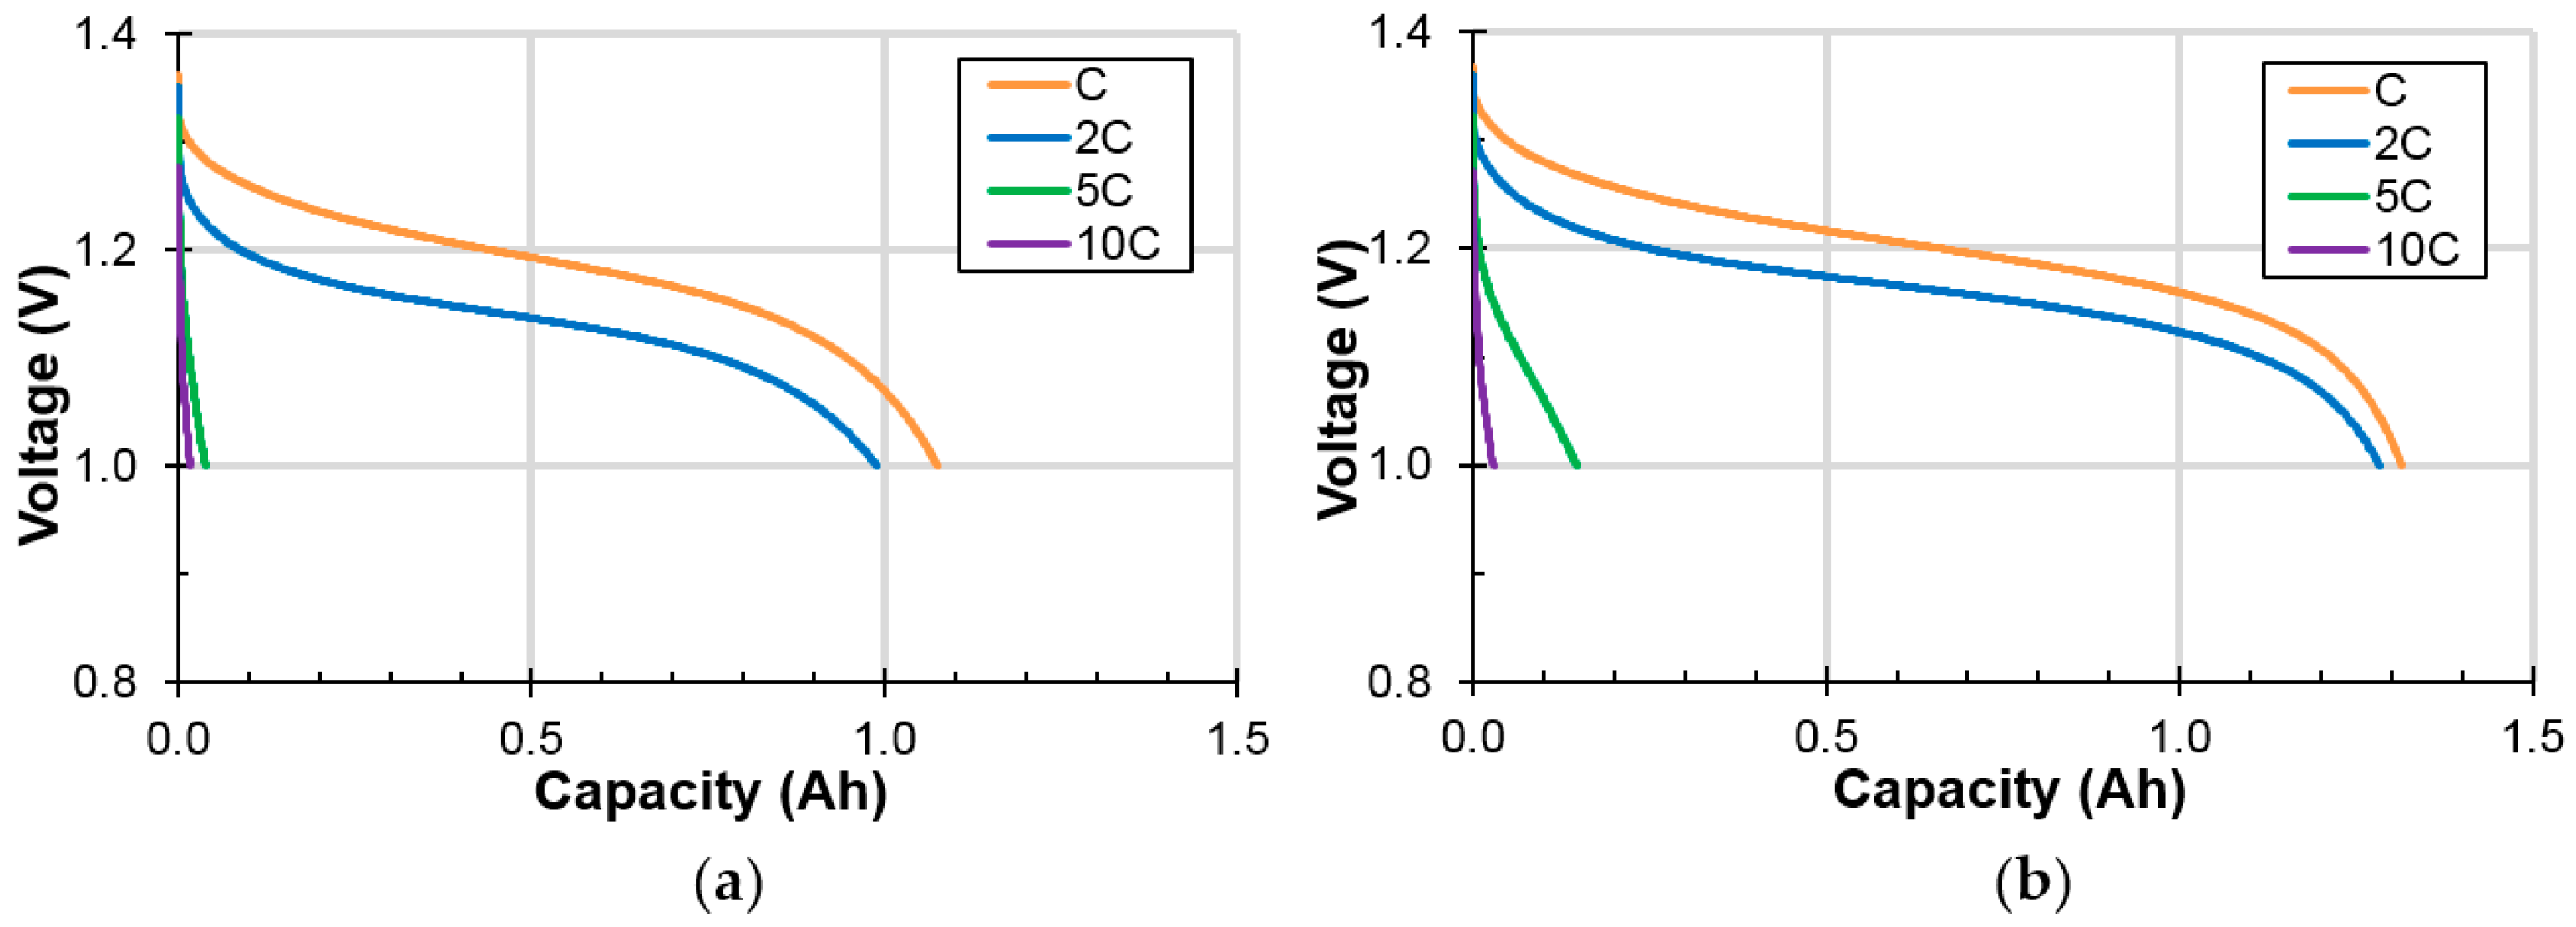
Figure 7.
Open-circuit voltages of (a) cell A (set of three), and (b) cell B (set of four) stored at room temperature.
Figure 7.
Open-circuit voltages of (a) cell A (set of three), and (b) cell B (set of four) stored at room temperature.
Figure 8.
Open-circuit voltages of (a) cell A (set of three), and (b) cell B (set of four) stored at −10 °C.
Figure 8.
Open-circuit voltages of (a) cell A (set of three), and (b) cell B (set of four) stored at −10 °C.

Figure 9.
Cole-Cole plots of (a) cell A (set of four), and (b) cell B (set of four) measured at room temperature.
Figure 9.
Cole-Cole plots of (a) cell A (set of four), and (b) cell B (set of four) measured at room temperature.
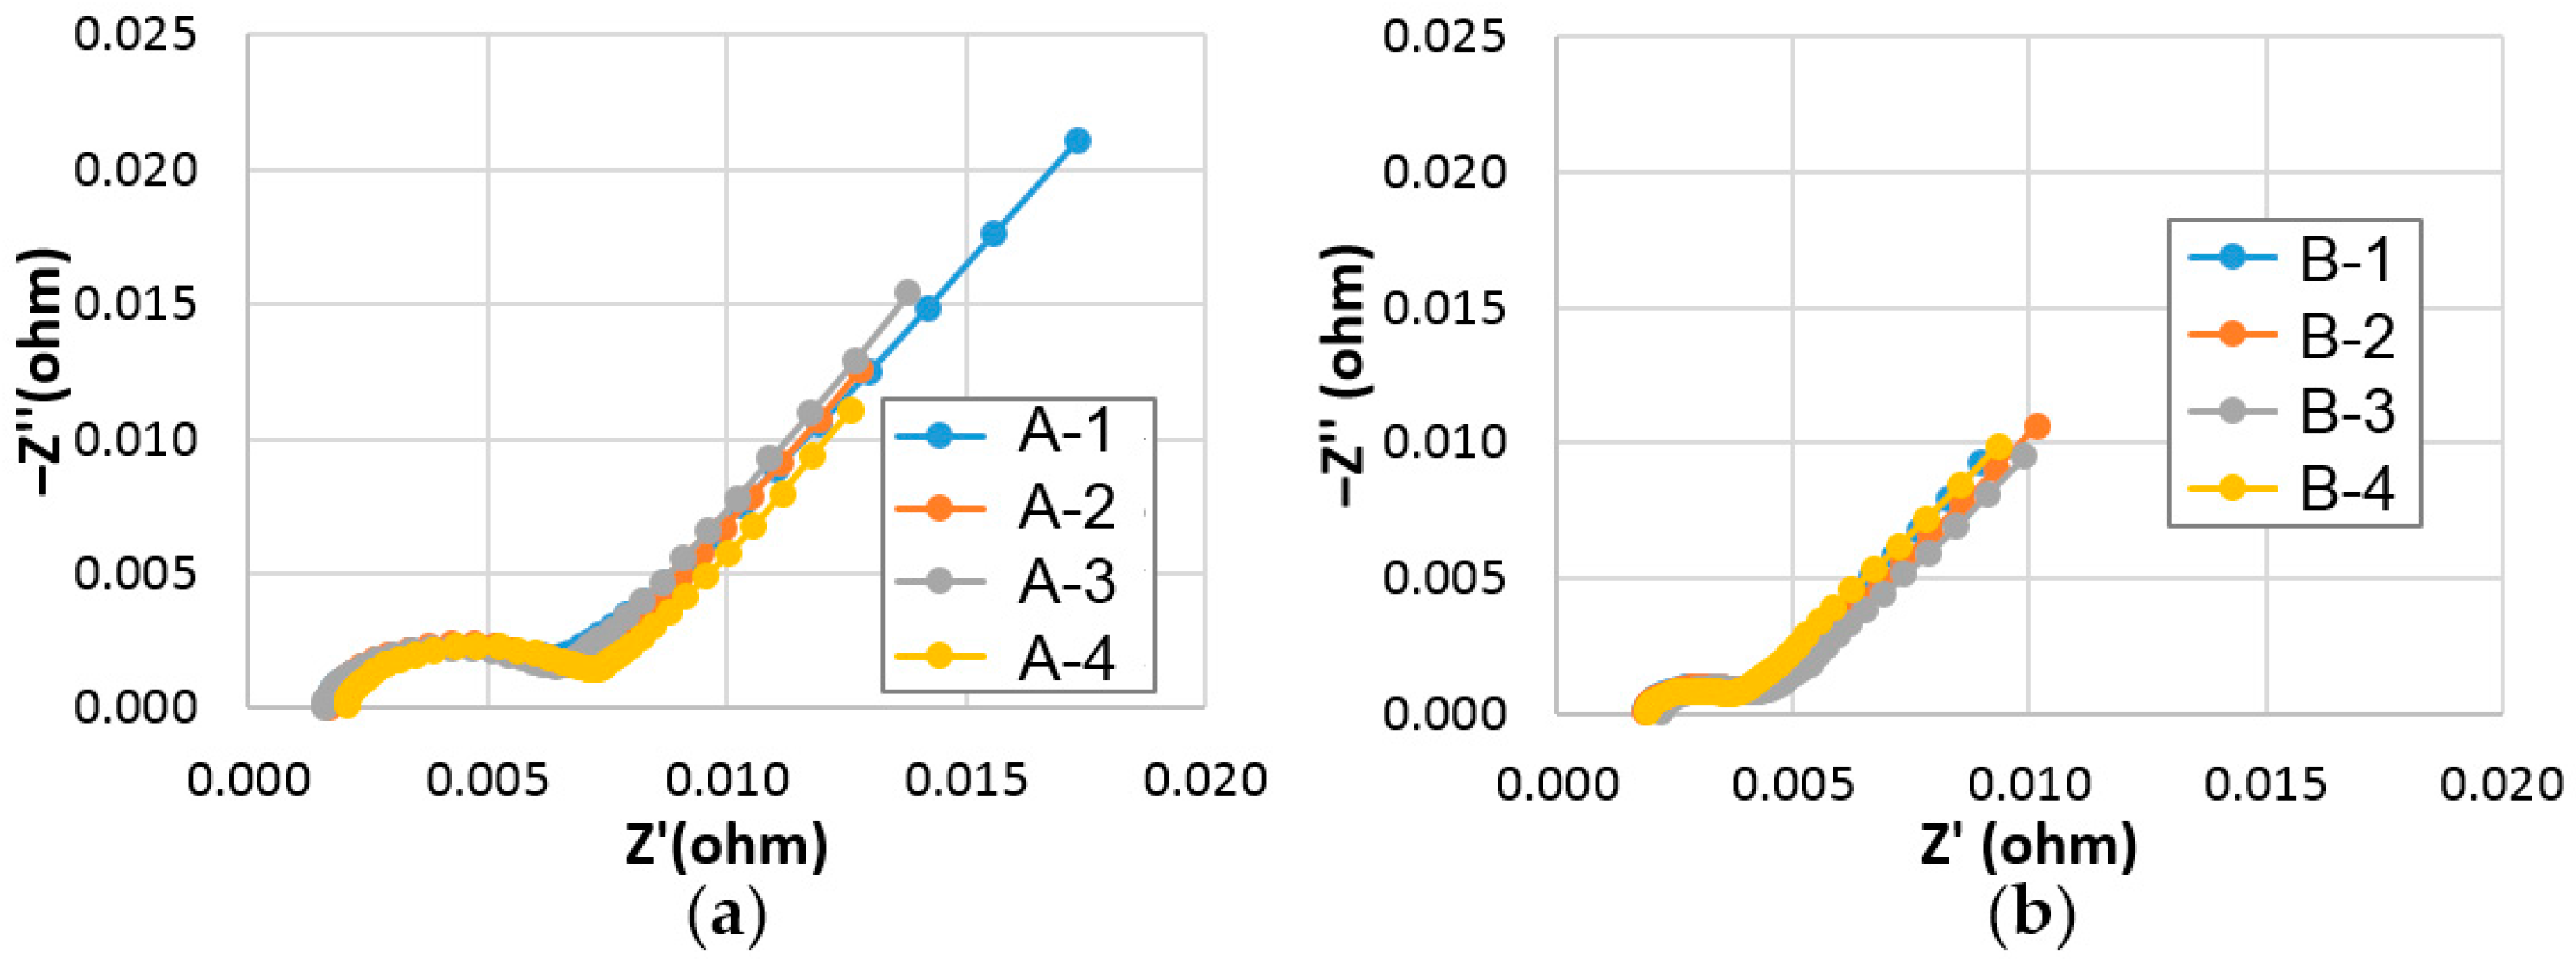
Figure 10.
Cole-Cole plots of (a) cell A (set of three), and (b) cell B (set of four) measured at −10 °C.
Figure 10.
Cole-Cole plots of (a) cell A (set of three), and (b) cell B (set of four) measured at −10 °C.

Figure 11.
Room temperature cycle life (C/2-C/2) comparison between regular C-size cells (not high-power) made with annealed alloys A and B.
Figure 11.
Room temperature cycle life (C/2-C/2) comparison between regular C-size cells (not high-power) made with annealed alloys A and B.
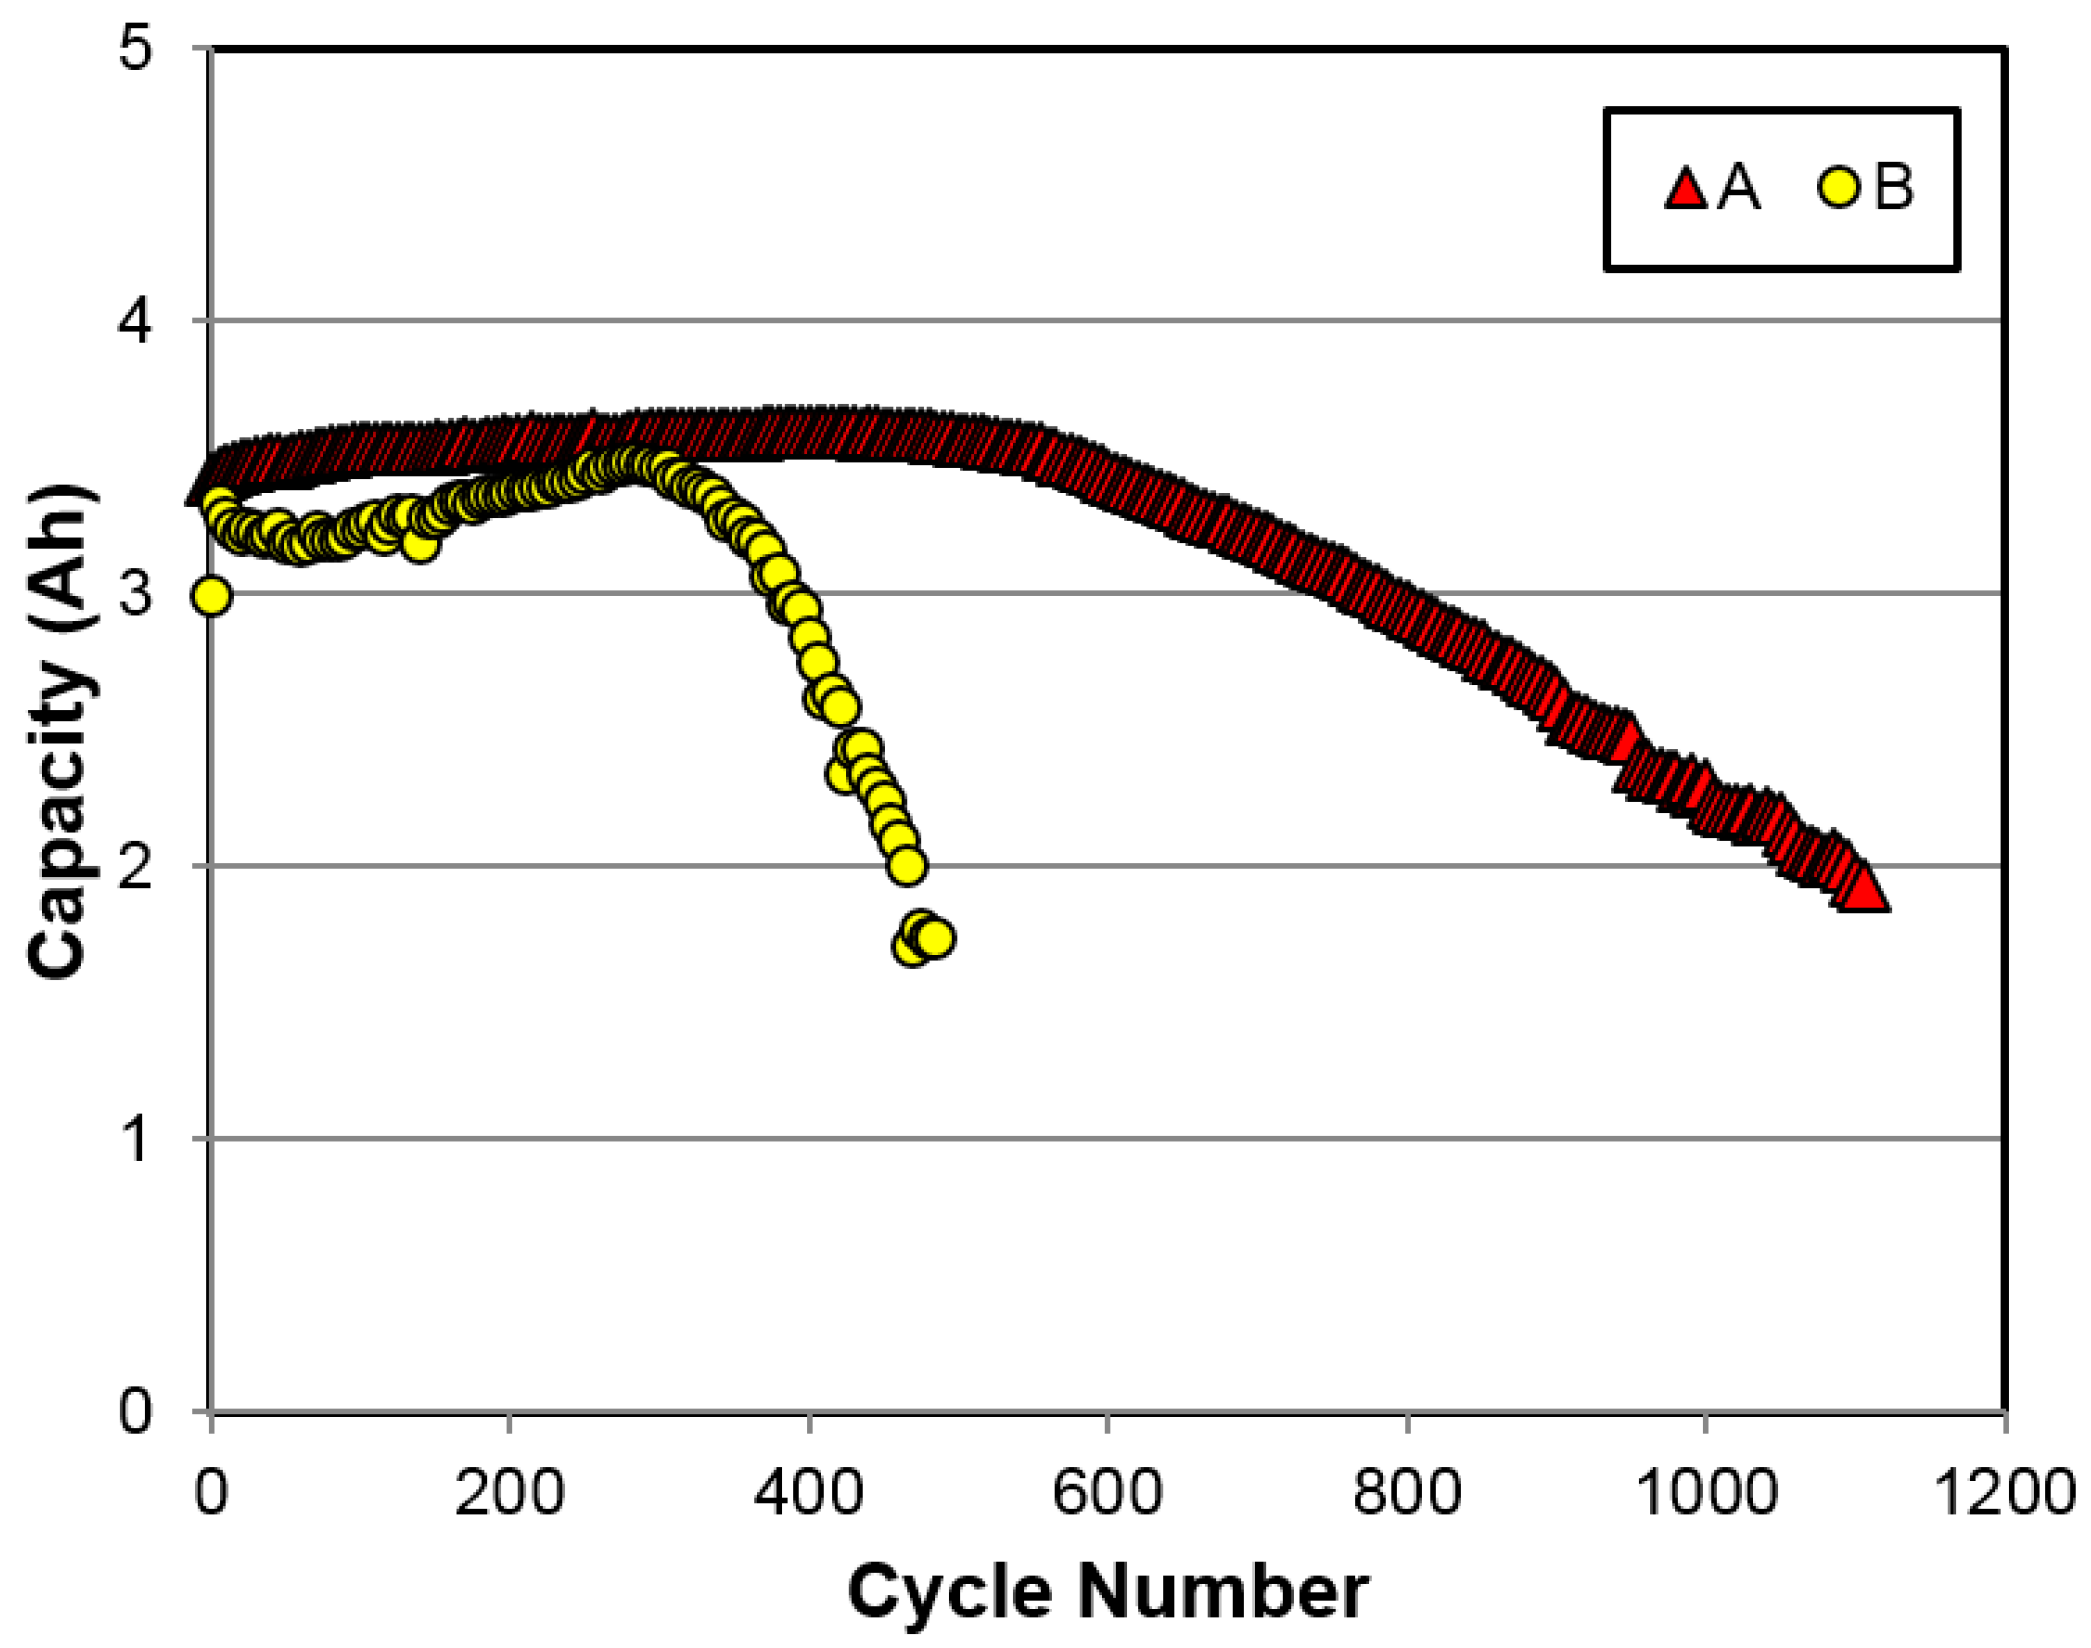
Figure 12.
Sealed-cell performance comparison between cells made with the conventional AB5 and new A2B7-based superlattice MH alloys.
Figure 12.
Sealed-cell performance comparison between cells made with the conventional AB5 and new A2B7-based superlattice MH alloys.


Table 1.
Phase abundances (in wt %) of alloy B before and after annealing determined by the X-ray diffractometer (XRD) analysis. HEX, CUB, and RHO are hexagonal, cubic, and rhombohedral, respectively.
Table 1.
Phase abundances (in wt %) of alloy B before and after annealing determined by the X-ray diffractometer (XRD) analysis. HEX, CUB, and RHO are hexagonal, cubic, and rhombohedral, respectively.
| Stoichiometry | AB2 | AB3 | A2B7 | A5B19 | AB5 | ||||
|---|---|---|---|---|---|---|---|---|---|
| Structure | HEX | CUB | HEX | RHO | HEX | RHO | HEX | RHO | HEX |
| Phase | MgZn2 | LaMgNi4 | CeNi3 | NdNi3 | Nd2Ni7 | Pr2Ni7 | Sm5Ni19 | Nd5Co19 | CaCu5 |
| Pristine alloy B | 7.9 | 5.7 | 2.0 | 19.3 | 0.0 | 13.1 | 1.6 | 17.7 | 32.7 |
| Annealed alloy B | 0.0 | 3.2 | 7.5 | 7.4 | 56.9 | 0.0 | 6.4 | 17.0 | 1.6 |
Table 2.
Energy-dispersive spectroscopy (EDS) results from selected spots in Figure 2. All numbers are percentages.
Table 2.
Energy-dispersive spectroscopy (EDS) results from selected spots in Figure 2. All numbers are percentages.
| Location | La | Pr | Nd | Mg | Ni | Co | Zr | B/A | Phase |
|---|---|---|---|---|---|---|---|---|---|
| Figure 2a-1 | 13.6 | 0.7 | 4.5 | 6.6 | 62.6 | 11.9 | 0.1 | 2.93 | Superlattice |
| Figure 2a-2 | 11.1 | 1.2 | 5.3 | 0.9 | 67.2 | 14.1 | 0.2 | 4.41 | AB5 |
| Figure 2a-3 | 9.5 | 0.9 | 5.6 | 0.4 | 69.1 | 14.4 | 0.1 | 5.10 | AB5 |
| Figure 2a-4 | 11.1 | 0.8 | 5.2 | 18.7 | 57.5 | 6.5 | 0.2 | 1.79 | LaMgNi4 |
| Figure 2a-5 | 5.5 | 0.4 | 3.5 | 0.0 | 17.8 | 3.2 | 69.6 | 9.64 | ZrO2 |
| Figure 2b-1 | 86.0 | 0.0 | 4.5 | 0.8 | 6.4 | 0.8 | 1.5 | 0.1 | La metal |
| Figure 2b-2 | 16.3 | 0.7 | 4.1 | 4.0 | 61.5 | 13.2 | 0.2 | 2.98 | Superlattice |
| Figure 2b-3 | 14.4 | 0.9 | 4.4 | 12.4 | 60.3 | 7.5 | 0.1 | 2.11 | LaMgNi4 |
| Figure 2b-4 | 13.2 | 0.7 | 4.7 | 14.2 | 60.4 | 6.7 | 0.1 | 2.04 | LaMgNi4 |
Table 3.
Gaseous phase and electrochemical hydrogen storage properties of annealed alloys A and B.
| Alloy | Full H-Storage | Reversible H-Storage | Plateau Pressure | PCT Hysteresis | Discharge Capacity |
|---|---|---|---|---|---|
| Annealed alloy A | 1.41% | 1.37% | 0.058 MPa | 0.10 | 310 mAh·g−1 |
| Annealed alloy B | 1.42% | 1.25% | 0.025 MPa | 0.23 | 370 mAh·g−1 |
Table 4.
Internal resistances (Rint, in mΩ·m2) measured with 1 and 10 s pulsed discharges with different discharge rates (1, 2, 5, and 10C) at both room temperature (RT) and −10 °C.
Table 4.
Internal resistances (Rint, in mΩ·m2) measured with 1 and 10 s pulsed discharges with different discharge rates (1, 2, 5, and 10C) at both room temperature (RT) and −10 °C.
| Condition | 1C | 2C | 5C | 10C |
|---|---|---|---|---|
| Cell A RT 1 s | 0.144 | 0.142 | 0.138 | 0.130 |
| Cell A RT 10 s | 0.194 | 0.192 | 0.182 | 0.168 |
| Cell A −10 °C 1 s | 0.405 | 0.369 | 0.289 | 0.244 |
| Cell A −10 °C 10 s | 0.516 | 0.492 | 0.499 | — |
| Cell B RT 1 s | 0.087 | 0.087 | 0.087 | 0.085 |
| Cell B RT 10 s | 0.127 | 0.127 | 0.124 | 0.118 |
| Cell B −10 °C 1 s | 0.334 | 0.312 | 0.262 | 0.219 |
| Cell B −10 °C 10 s | 0.468 | 0.444 | 0.453 | — |
© 2017 by the authors. Licensee MDPI, Basel, Switzerland. This article is an open access article distributed under the terms and conditions of the Creative Commons Attribution (CC BY) license (http://creativecommons.org/licenses/by/4.0/).
Share and Cite
MDPI and ACS Style
Koch, J.M.; Young, K.-H.; Nei, J.; Hu, C.; Reichman, B. Performance Comparison between AB5 and Superlattice Metal Hydride Alloys in Sealed Cells. Batteries 2017, 3, 35. https://doi.org/10.3390/batteries3040035
AMA Style
Koch JM, Young K-H, Nei J, Hu C, Reichman B. Performance Comparison between AB5 and Superlattice Metal Hydride Alloys in Sealed Cells. Batteries. 2017; 3(4):35. https://doi.org/10.3390/batteries3040035
Chicago/Turabian StyleKoch, John M., Kwo-Hsiung Young, Jean Nei, Chaolan Hu, and Benjamin Reichman. 2017. "Performance Comparison between AB5 and Superlattice Metal Hydride Alloys in Sealed Cells" Batteries 3, no. 4: 35. https://doi.org/10.3390/batteries3040035
Note that from the first issue of 2016, this journal uses article numbers instead of page numbers. See further details here.