Fast Thermal Runaway Detection for Lithium-Ion Cells in Large Scale Traction Batteries


1
Deutsche ACCUMOTIVE GmbH & Co., KG, Neue Straße 95, 73230 Kirchheim u. Teck (Nabern), Germany
2
Electrical Energy Storage Systems, Institute for Photovoltaics, University of Stuttgart, Pfaffenwaldring 47, 70569 Stuttgart, Germany
*
Author to whom correspondence should be addressed.
Batteries 2018, 4(2), 16; https://doi.org/10.3390/batteries4020016
Submission received: 23 February 2018
/
Revised: 6 March 2018
/
Accepted: 20 March 2018
/
Published: 27 March 2018
Abstract
:Thermal runaway of single cells within a large scale lithium-ion battery is a well-known risk that can lead to critical situations if no counter measures are taken in today’s lithium-ion traction batteries for battery electric vehicles (BEVs), plug-in hybrid electric vehicles (PHEV) and hybrid electric vehicles (HEVs). The United Nations have published a draft global technical regulation on electric vehicle safety (GTR EVS) describing a safety feature to warn passengers in case of a thermal runaway. Fast and reliable detection of faulty cells undergoing thermal runaway within the lithium-ion battery is therefore a key factor in battery designs for comprehensive passenger safety. A set of various possible sensors has been chosen based on the determined cell thermal runaway impact. These sensors have been tested in different sized battery setups and compared with respect to their ability of fast and reliable thermal runaway detection and their feasibility for traction batteries.
1. Introduction
With revelation of the exhaust fume manipulation of several car manufacturers in 2015 [1,2], the need for emission free transportation is higher than ever. Battery electric vehicles (BEVs), plug-in hybrid electric vehicles (PHEVs) and hybrid electric vehicles (HEVs) offer such an emission free or reduced emission transportation possibility [3]. Lithium-ion batteries feature a high energy and power density and are therefore economically seen as the most suitable energy storage technology for BEVs and PHEVs, replacing more and more nickel metal hydride systems in HEVs [4]. Entering the transportation market safety of lithium-ion battery technology becomes increasingly important. Certain triggers and abuse conditions can lead lithium-ion cells into a thermal runaway and result in a rapid increase in temperature, as well as venting, flames, flying parts, and explosion [5]. A thermal runaway is hereby not limited to batteries with lithium-ion cells but is also reported for some supercapacitors [6] and could therefore as well be a problem in battery systems containing supercapacitors. However, this work focuses on lithium-ion cells. If this cell reaction propagates with time to adjacent cells, the impact on a battery level can become severe and cause major damage to the vehicle and its environment or passengers [7]. Therefore, to ensure passenger safety in BEVs, PHEVs and HEVs, the United Nations released a draft on electrical vehicle safety.
In the United Nations global technical regulation on electrical vehicle safety (GTR EVS) section I. E. 7 c 112, II. 5.3.3 and II. 7.2.3 [8], the requirement for a functional safety mechanism is described as being able to detect the thermal runaway of a single cell within a traction battery, warn the driver about the error and therefore give all passengers a couple minutes of time to safely leave the car before hazardous situations occur. To realize such a safety feature, it is crucial to firstly detect a thermal runaway of a single cell.
As a state-of-the-art method, Feng et al. [9] showed an algorithm on how to detect an internal short circuit of a cell potentially leading to thermal runaway based on current, voltage and temperature data via a parameter estimation. Additionally, Roscher et al. [10] described a method to detect individual faulty cells within a battery system, based on impedance and capacity information. The work described in this article focuses on sensors measuring direct and indirect impact of cell thermal runaway. It examines and rates different sensors on their feasibility to securely and quickly detect a thermal runaway event of a lithium-ion cell within a battery and on their ability to be deployed in commercial traction batteries.
2. Thermal Runaway Impact
The different stages and reactions contributing to the general thermal runaway process of a lithium ion cell have been examined and studied well [11,12,13,14,15,16]. When a lithium-ion cell goes into thermal runaway, a variety of effects occur at the cell itself spreading to its surrounding environment [7]. Observations from previous tests have shown that these effects are very similar for all cell types (cylindrical hard case, prismatic hard case, pouch cell). One of the most common effects is the loss of cell voltage on the tabs, as in the case of pouch cells, because the electrodes are short circuited or as in the case of hard case cells because safety mechanisms disconnect the electrodes from the tabs. A second effect is direct heat coming from the self heating of the cell [17] caused by internal chemical reactions of the anode, cathode and electrolyte [18] as well as internal discharges due to a melting separator. Depending on the battery system design, adjacent cells and battery parts get heated up by the damaged cell and thereby damaged as well. Another effect is the production of gas due to the chemical reactions mentioned above. This gas generation causes a build up of internal pressure, which leads to swelling of the cell, including the application of force onto adjacent parts in the system and can result in rupture of the cell encapsulation [19,20]. Once ruptured, the cell begins to vent and together with the produced gas a chaotic mixture of hot and glowing particles are ejected from the cell. These particles are usually ripped off of pieces of active material from the cell’s anode and cathode. Previous measurements on the gas/particle stream revealed temperatures ranging between K K. Analysis of the ejected gas showed high proportions of hydrogen and carbon monoxide. Therefore, flammability and the risk of explosion is given at a fuel concentration from [21]. The mentioned effects usually have their impact on the battery and its environment spread over a certain time. With the first cell going into thermal runaway, venting starts at the cell and subsequently from the battery. The thermal runaway process of a single cell usually decays after approximately 20 seconds to a minute, which has been observed in former tests. In the case of thermal coupling between cells without any thermal propagation counter measures, adjacent cells can then start to go into thermal runaway adding more heat to the battery system and producing additional venting gas. This propagation process can speed up, and, at a certain time, usually several minutes, the battery housing may lose integrity due to the amount of thermal energy. It is important to either prevent a thermal propagation or to give passengers enough lead time, usually in the frame of several minutes to safely leave their car.
3. Tested Sensors Set
Based on the different impacts of a cell thermal runaway described in Section 2, a set of sensors has been chosen to be evaluated as fast single cell thermal runaway detectors within a traction battery.
Table 1 gives an overview of the sensors that have been investigated. Sensor S1, the voltage sensor is first, as it is already implemented in most battery designs for reasons of cell supervision and safety [22]. The measured voltage will be the one from the first cell going into thermal runaway. Sensor S2 is a gas sensor made out of a tin dioxide (SnO) semiconductor. The gas sensor is sensitive to Methane (CH), Propane (CH) or carbon monoxide (CO), for example, and decreases its good conductivity in clear air when detecting gas. The mentioned gases are part of the venting gas composition ejected from a lithium-ion cell in thermal runaway [21,23,24,25]. Sensor S3 is a self-made smoke detector, based on the principles of a conventional photoelectric smoke detector consisting of an infra red (IR) LED and an element sensitive to the IR-radiation. Previous tests have shown a high concentration of dark smoke and grime ejected with the venting gas. In clear air, the IR radiation will not impinge on the sensor as the LED is pointed away, but with an increasing amount of smoke particles, and, therefore, occurring reflection of IR-light from the LED, the sensor will increase its detection signal. As a creep distance sensor, S4, a piece of printed circuit board (PCB) is used. The PCB features two 10 cm long and 2 mm wide line-shaped solder pads, placed approximately 1 mm apart. With a clean surface, the creep distance sensor has very high resistance between the two pads in the range of several mega ohms. With increasing pollution of the surface, the resistance drops in relation to the degree of pollution and outputs a signal via a voltage divider. A temperature sensor, S5, is realized through a type-K (NiCr-Ni) thermo couple and measures the temperature of air or venting gas. S6, a pressure sensor measuring absolute pressure in the range of kPa kPa, is used to determine the rise of internal battery pressure due to gas generation of a single cell. This sensor can only be used in tests with a closed battery housing, as, otherwise, pressure wouldn’t rise. The last sensor, S7, a single point thin film piezoresistive force sensor with the range of N N, is used to measure the force between a cell in thermal runaway and adjacent parts/cells caused by the cell swelling.
All sensors deliver an analog voltage signal, some others (S1, S5) can genuinely be easily transformed into a voltage signal with the help of a voltage divider circuit (S2–S4, S7) and the pressure sensor (S6) already gives out an analog voltage signal.
4. Experiment
To evaluate the eligibility, detection speed and feasibility of the sensors described in Section 3 and listed in Table 1, a series of three thermal runaway tests was conducted. The chosen cell types represent state-of-the-art automotive lithium-ion pouch cells with different energy densities. Different cell arrangements and setups represent different sized batteries. With this approach, the influence of energy density, battery system size and the scalability of the experiment can be determined.
Table 2 describes the three different experiment setups. All three setups were based on different battery system sizes and pouch cells. Dimensions of cell cavities ranged between: length mm mm; width mm mm; height mm mm.
Test V1 included a single pouch cell made of LiNiMnCoO (NMC) cathodes and graphite anodes, with a capacity of 20 Ah, cavity volume of roughly cm and a volumetric energy density of . The cell is placed inside of an aluminum housing with a venting opening. Test V2 included several pouch cells made of NMC cathodes and graphite anodes, each with a capacity of 65 Ah and with cavity volume of cm resulting in a volumetric energy density of . Each two cells were connected in parallel and these parallel packs were then connected in series (2p connection). The cells were arranged in one cell module and then encapsulated by an aluminum housing with a hole on the backside to allow venting. Test V3 was set up with cells made of NMC cathodes, graphite anodes, each with a capacity of 58 Ah and the cavity volume of cm resulting in a volumetric energy density of . The cells were connected as two in parallel (2p connection) and then arranged in two cell modules. These cell modules were placed in an aluminum housing with venting openings.
The sensor column of Table 2 indicates the sensors each experimental setup was equipped with. Test V1 and V3 come with a closed housing (venting opening is closed with a burst disc) and therefore a pressure sensor (S6) can be used, whereas test V2 has a partially open housing and hence a pressure sensor would not be very useful. As compensation, a force sensor was built in between the cells. All three tests were carried out with cells charged up to a state of charge before triggering the thermal runaway. Setup V2 and V3 were heated to a temperature of C beforehand. As Test V1 was triggered by a heat plate, preheating was obsolete.
Figure 1a–c display the different test setups with their cell arrangements and trigger methods. The housings are only partially shown for better visibility of the inner parts. Figure 1a depicts the setup for test V1. The cell (1) is placed on a round heater plate (2), which acts as thermal runaway trigger. A filler block (3), displayed transparently, is placed on top of the cell to decrease the void volume. The sensors are placed on the very top of the stack: S2 (6), S3 (8), S4 (9), S5 (7) and S6 (5). The cell voltage (S1) is measured externally. On the very back of the housing, there is a round opening, the venting hole (4), visible. It is closed with a burst membrane that opens at a pressure of kPa kPa.
Figure 1b describes the test setup of test V2. The cells are arranged in a module (11) and are held together by module jigs and frames. The first cell in the front is being penetrated by a nail (2) to initiate the thermal runaway. On the opposite side is a hole in the housing (4), which is visible and acts as a venting opening without a burst disc and is open from the beginning of the test onwards. The sensors for this tests are placed in the void volume (10) between cell module and venting opening. The additional force sensor S7 is placed between the fourth and fifth cell of the cell module.
Figure 1c shows the test setup of test V3. In this setup, the cells are ordered in two modules (11) and again each are held together with jigs and frames. The two modules are positioned next to each other and separated by a partition wall that acts as a rack. This wall does not separate the modules in an airtight manner. On the top of the housing in the back, two venting openings (4) are visible, both equipped with a burst disc. Sensors S1–S6 are placed in the left compartment in front of the left module, indicated by the yellow area (10). The first cell of the right module is being penetrated with a nail (2) to trigger the thermal runaway.
5. Measurements
The results of tests V1–V3 are shown in Figure 2, Figure 3 and Figure 4. The time axis of the three figures are not related to each other, as each test setup contained a different cell type with a different reaction to the thermal runaway trigger. The time axis was instead focused on the thermal runaway reactions.
Figure 2 describes the sensor readings of test V1. All sensors show a distinct reaction to the thermal runaway process within a detection window of s. The fastest and clearest signal is given by the gas sensor S2, followed by the smoke detector S3, which reacts shortly after S2. It is similarly distinct but does not give out a stable signal. The strong signal fluctuation of S3 after the initial detection can be explained by the inhomogeneous particle concentration within the gas stream. The more stable signal from s onwards could be explained by a polluted IR LED or photo detector. The creep distance (S4) and pressure (S6) sensor react at a similar time as the previous sensors but with a smoother and more gradual change in signal. With the opening of the burst disc, the pressure drops instantly and venting is visible outside of the housing. A second peak in pressure (S6) at time s could be explained with a partial blockage of the venting opening by bigger particles in the gas stream. The temperature signal (S5) rises about 5 s after the pressure signal (S6) and also shows a quite distinct reaction with an increase of K. The slow and late rise can be ascribed to the inertia of the temperature sensor and the small amount of produced gas and particles due to the small cell. A drop in the cell voltage measurement (S1) is the last reaction to the thermal runaway event, occurring s after the first reaction encountered by the gas sensor (S2). With the cell voltage dropping to V, the runaway reaction of the single cell has ended.
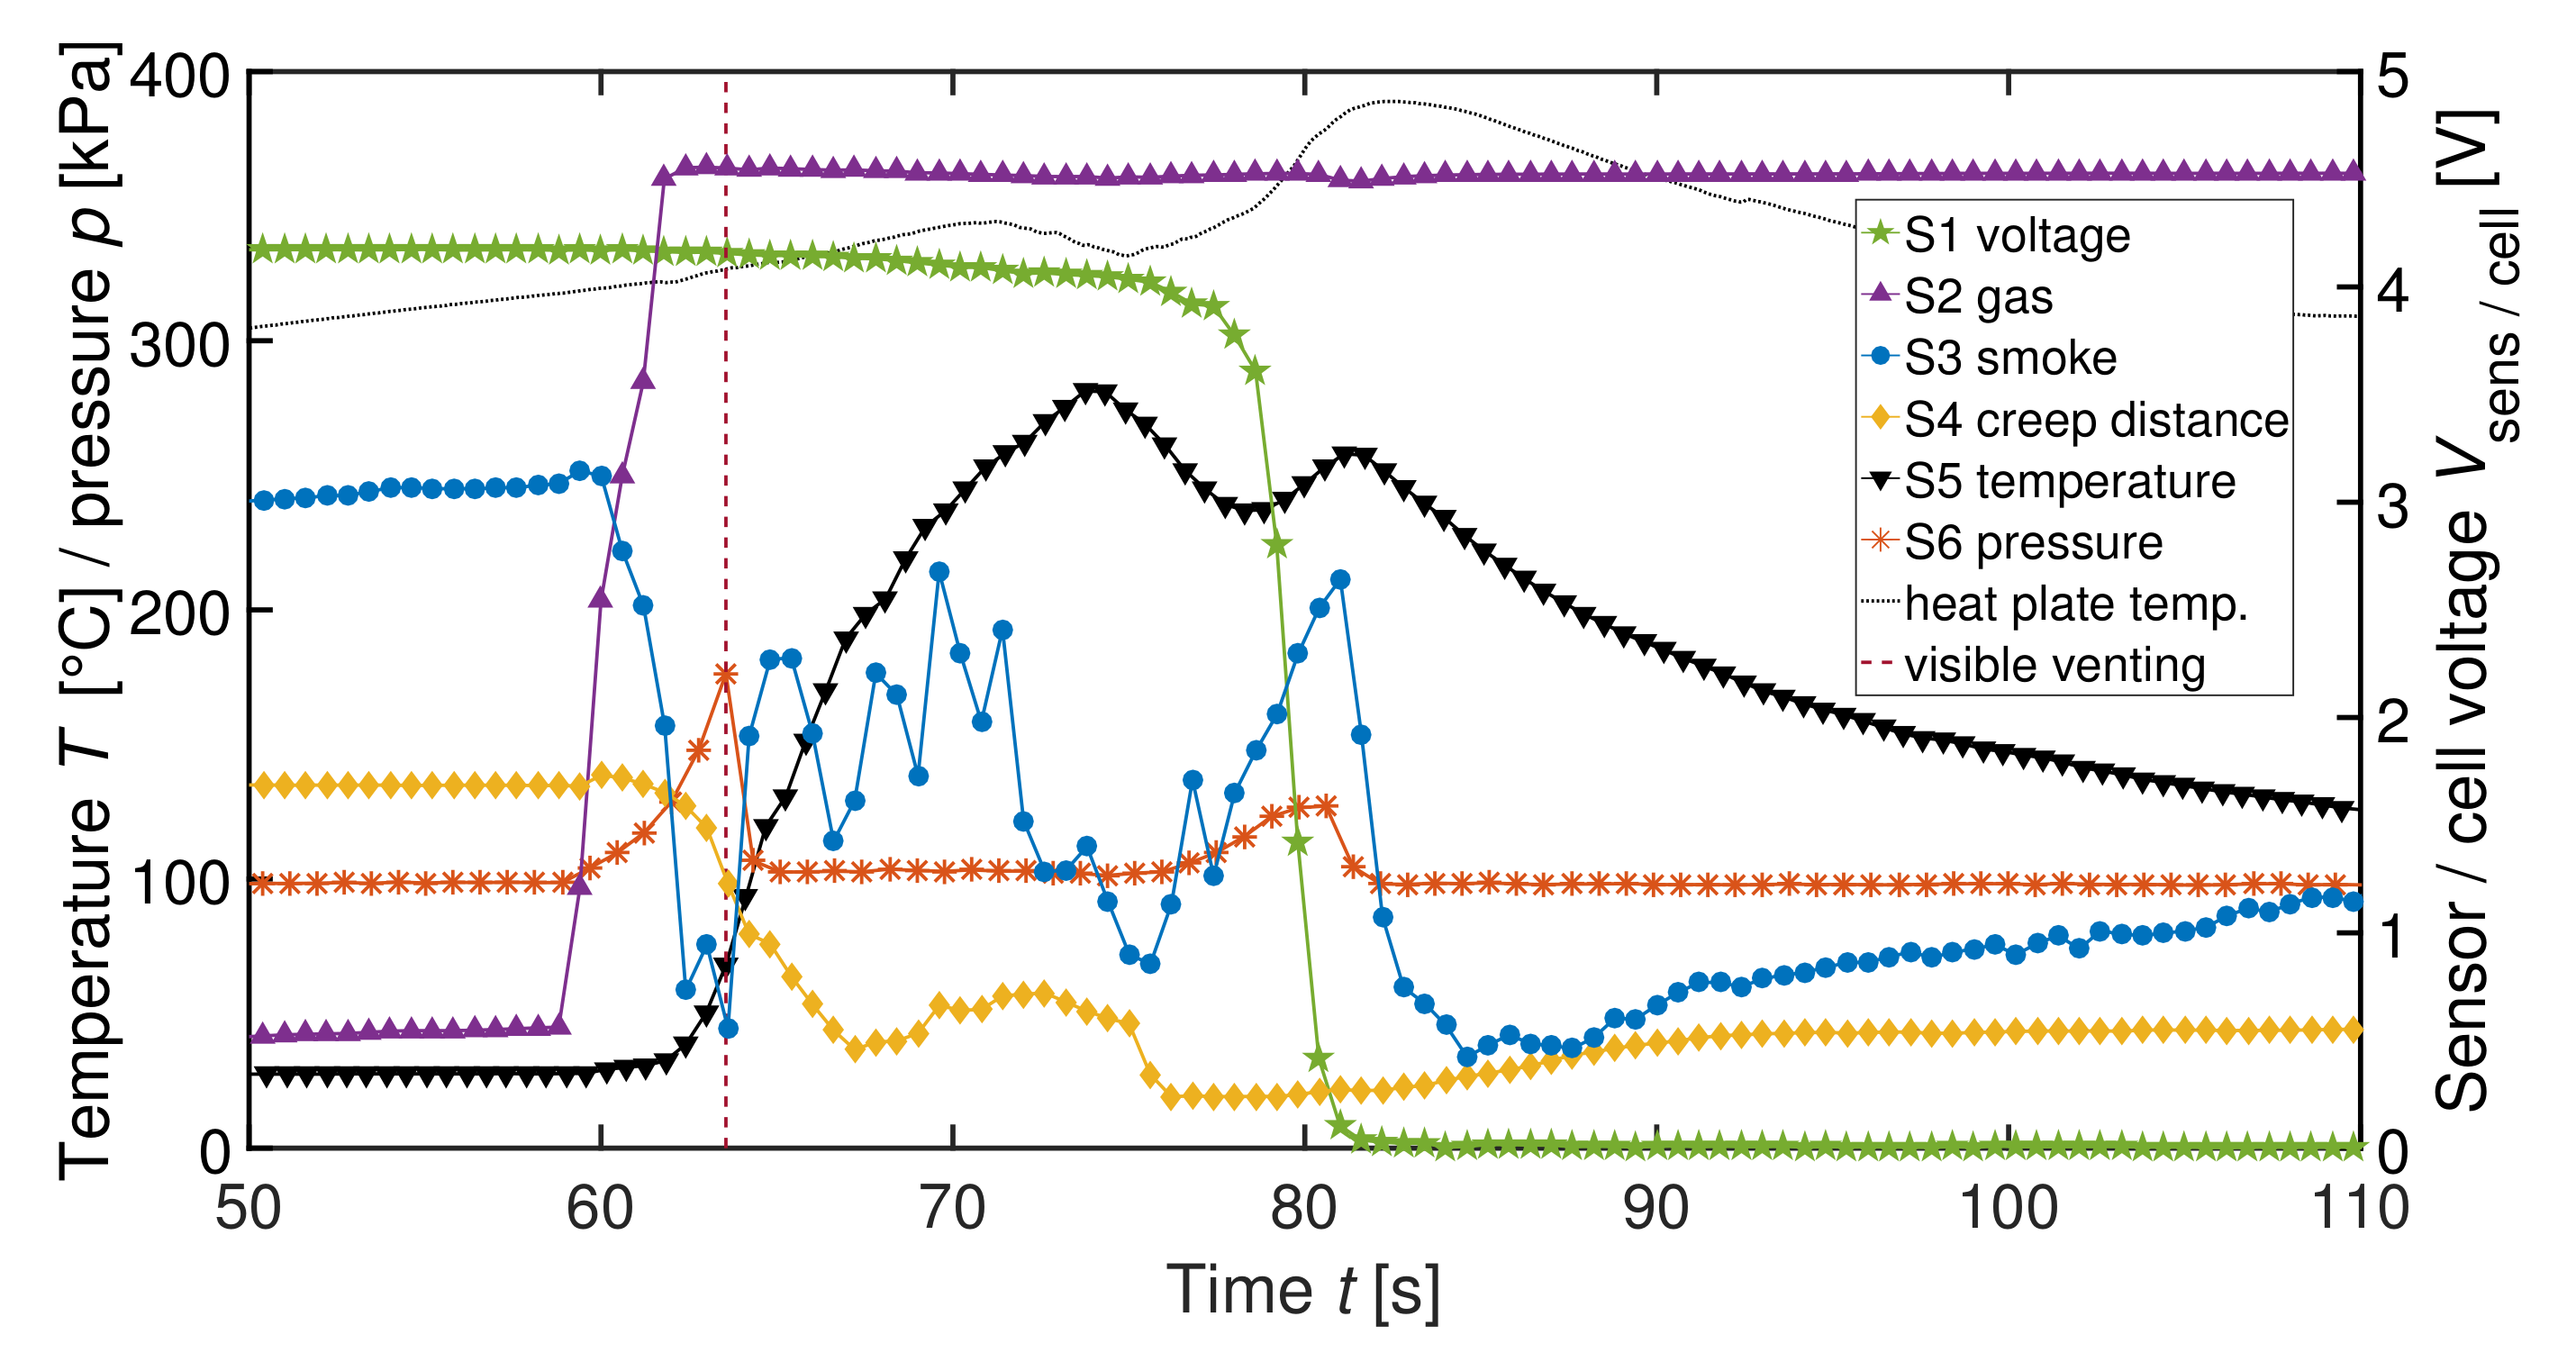
Figure 3 displays the measurements during test V2. Again, all sensors show a distinct reaction to the runaway process. The time frame of detection is s wide. The time difference to test V1 comes from a late drop in cell voltage (S1), which could be explained by either the different cell type or (refer to Table 2) different trigger mechanism. While the gas sensor S2 reacts expectedly similar to the one in test V1, and the smoke detector S3 shows a different behavior. After an initial jump in the signal, there is a smooth decrease down to V. The initial jump can be ascribed to a certain IR reflection on the housing walls that was disturbed with the first gas and smoke particles, which leads to a higher signal value. The related decrease in signal level was caused then with a further increase of gas stream and therefore a reflection on the gas and particles. Signal readings from the creep distance sensor S4 behave similar to the ones from Figure 2. The late but strong increase in temperature could come from the temperature sensors’ position not being initially hit by the gas stream. The increase of K is in the same range as the measurements in Figure 2. The additional force sensor shows a clear spike in compression force, even starting before the gas sensors’ (S2) reaction, due to a production of gas inside the cell causing swelling before the opening and venting of the cell.
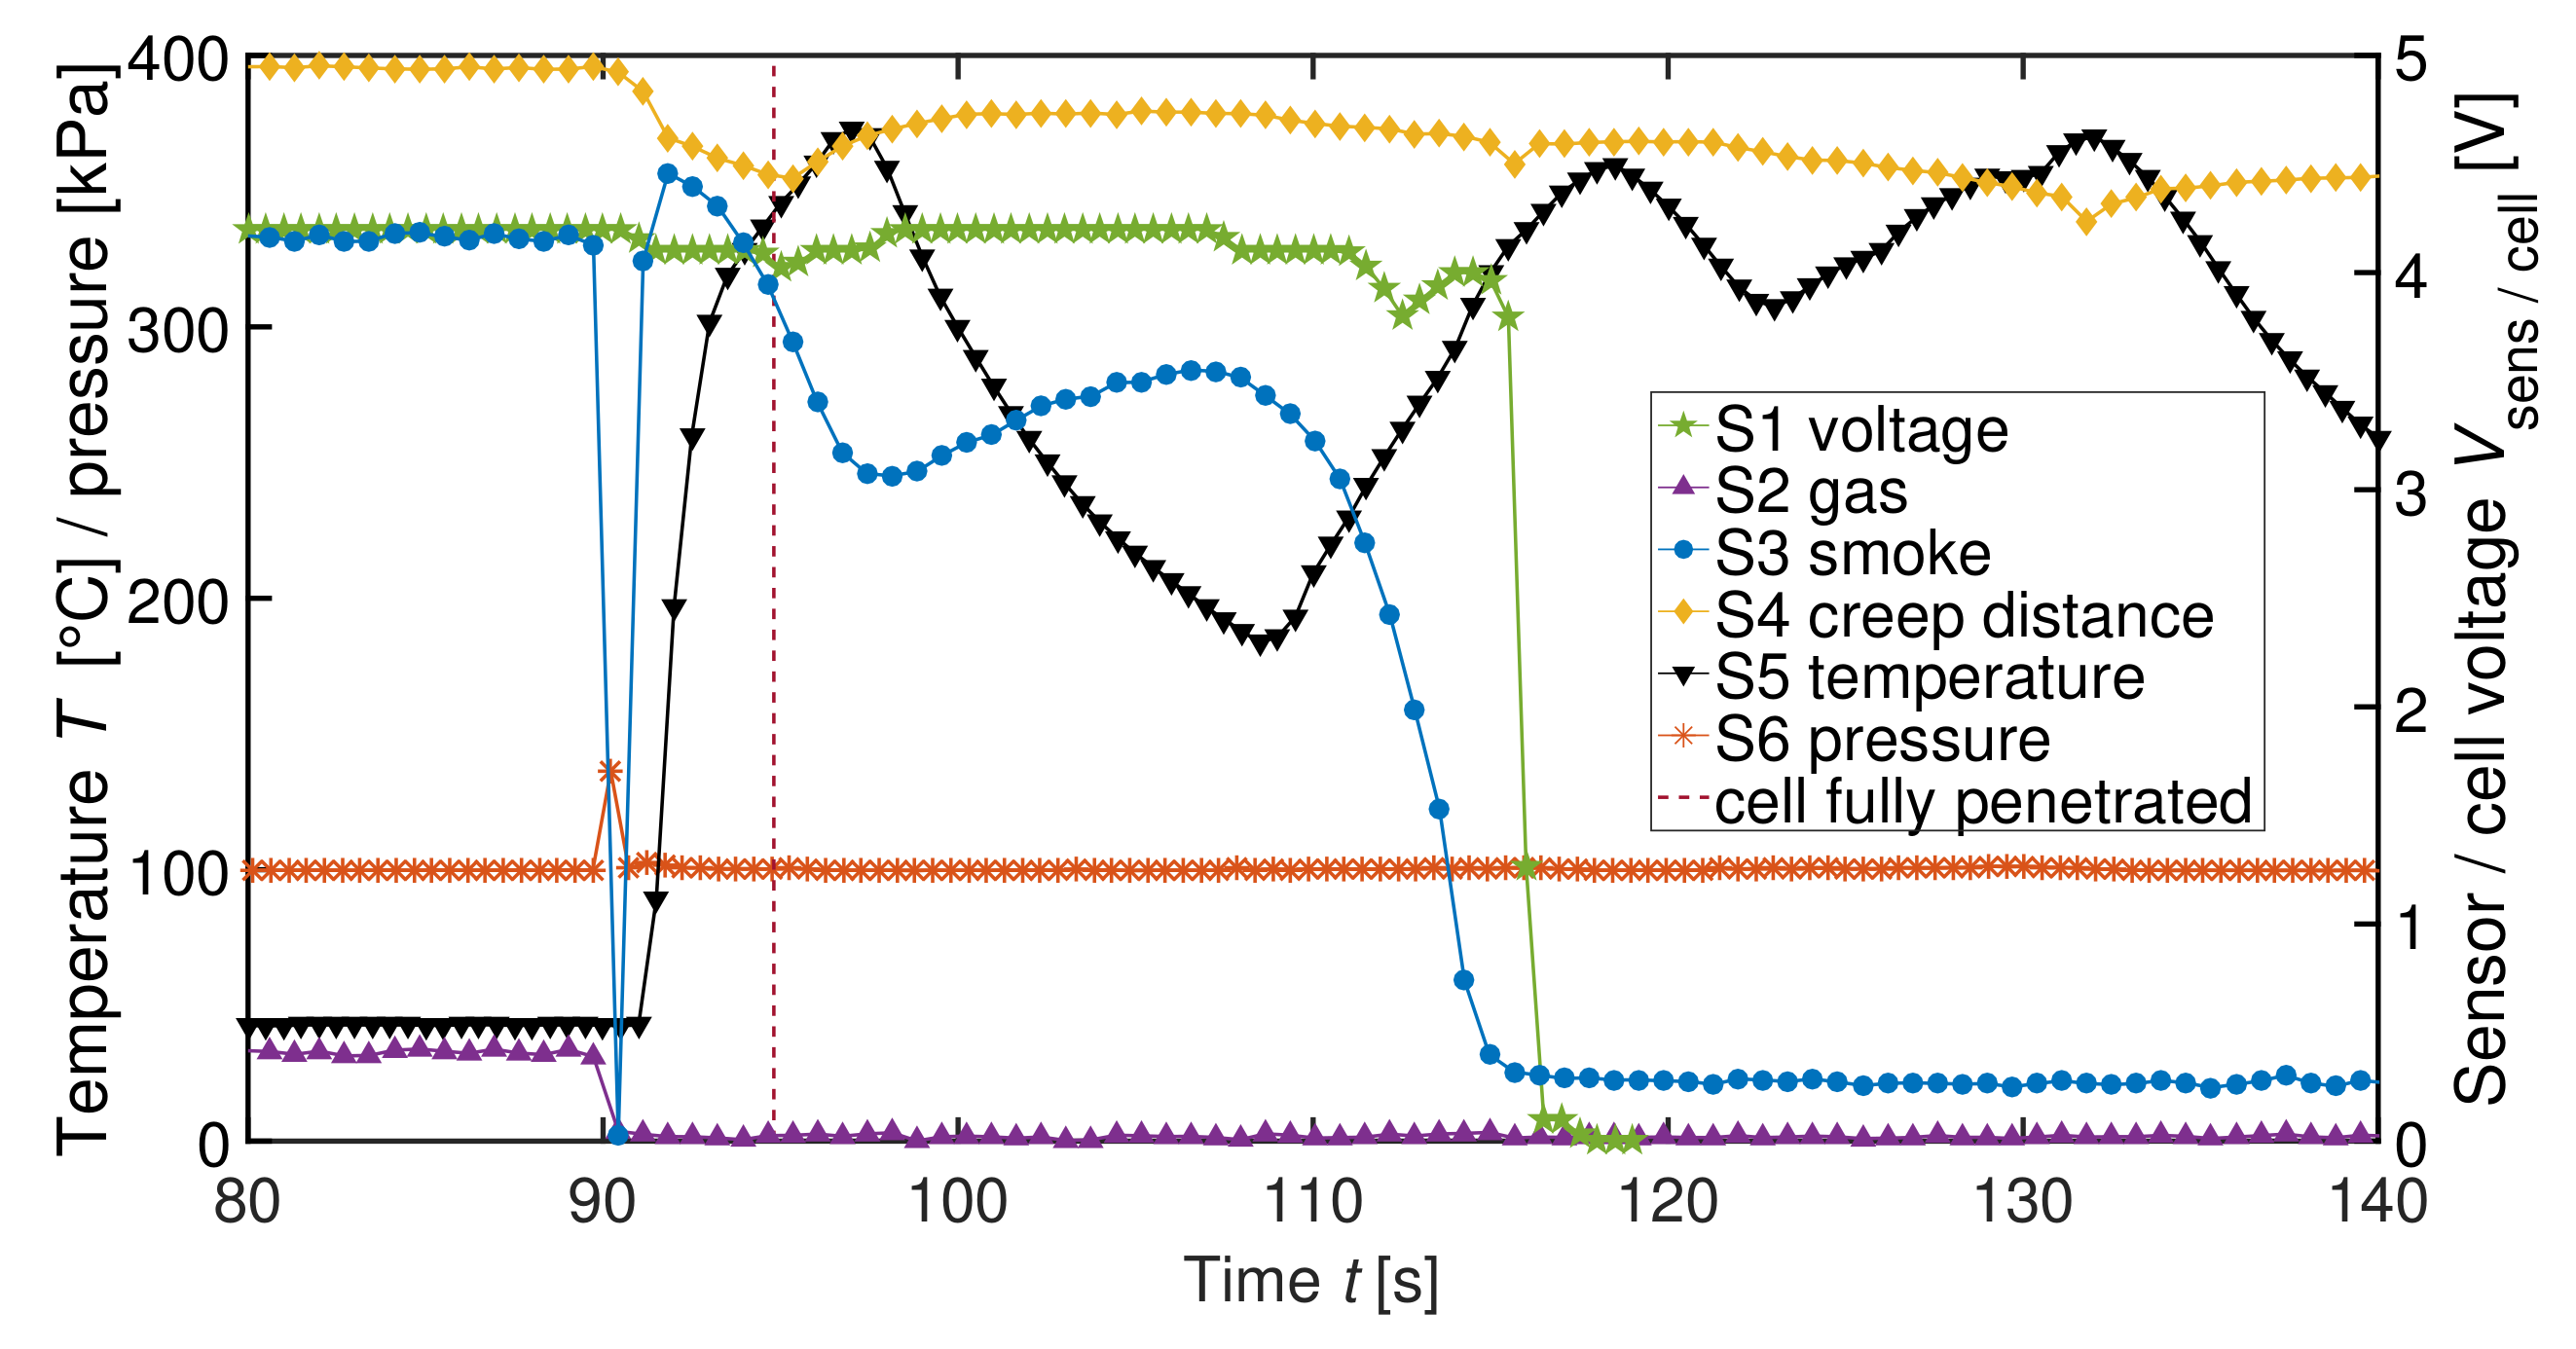
Figure 4 shows the signal sequences during test V3. All sensors showed the expected distinct reaction to the runaway process except for the gas sensor S2. Its signal sequence cannot be explained and has to be ascribed to a sensor error or broken wire due to the thermal runaway impact. Detection takes place in a time frame of s. The cell voltage S1 again shows the reaction latest, but it also shows some signal fragments in the time between s and s. This behavior in cell voltage has also been observed in other thermal runaways and thermal propagation experiments, and could result from the ongoing thermal runaway process and collapsing of the inner electrode/separator structure of the cell. Signals from the smoke detector S3 are similar to the ones described in Figure 3. The single spike at approximately s could either be a sensor error or a single particle of a relatively large size that was blown on top of the IR LED or sensor and completely blocked the signal for a short time. The creep distance sensor S4 exhibits a comparable signal sequence as in the measurements before. Temperature measured by sensor S5 rises as expected shortly after the other sensors show reactions. The second and third peak at s and s are due to the venting of following cells in the cell module. The temperature rise of K is again in the range of previous tests, and slight variations can be explained with the variation of the exact position of the temperature sensor and the different cell types. The pressure sensor S6 shows a short spike in pressure before the burst disc ruptures and opens the venting opening. The faster signal sequence in comparison with the readings from Figure 2 is due to a larger cell type and higher energy.
6. Discussion
The three conducted tests V1–V3 described in Section 4 have shown that all investigated sensors described in Section 3 are able to detect the thermal runaway of a lithium ion cell as a matter of principle independent of cell capacity, energy density and battery system size. Therefore, the results can be upscaled to even bigger battery systems with more cells and modules as they can be found in BEV and PHEV batteries.
Table 3 gives a brief overview over the seven sensors and their evaluation in three categories: detection speed—how fast can a thermal runaway be detected, signal clarity—how close does the signal come to a step function or how easy is it to evaluate the signal and the third, sensor feasibility—how easy can the sensor be deployed in a traction battery. The rating goes from (+) good, to (0) neutral to (-) bad.
Detection speed is crucial to thermal runaway, especially if the battery capacity is big enough to cause severe damage and if the battery is used close to humans or animals. This is definitely the case for large BEVs and PHEVs and in respect to the mentioned GTR EVS [8]. The more time a sensor needs to detect a thermal runaway, the greater the chance that the evaluation electronics and communication units are damaged or destroyed and further measures fail. Gas (S2), pressure (S6) and force (S7) have shown to react the fastest. While the force can be measured directly with the swelling of the cell, pressure follows as soon as the cell opens and releases venting gas, which will also be detected by the gas sensor. Temperature (S5) is rated with an (0) as it can take a while to rise, as seen in Figure 2 and also because the sensor position can delay the detection as seen in Figure 3. Voltage (S1), smoke (S3) and creep distance (S4) sensors needed the longest to show a detection in their output signal. Voltage signal (S1) can be even further delayed by having more cells in parallel.
Signal clarity has a great impact on how easy it is to evaluate the detection signal and therefore how eligible a sensor is. This includes how close an output signal comes to a step function (no detection—low level, detection—high level or vice versa) as well as how complicated the evaluation electronics or algorithm has to be. Voltage (S1) and gas sensor (S2) show a very clear step function. The step of roughly V for the voltage sensor, and roughly the same for the gas sensor with a voltage divider, is in a range that is easy to measure. Smoke (S3) and temperature (S5) come second with a rating of (0). While the smoke sensor shows a distinct no-detection-level and detection-level, it has an undefined transition period between these two levels. The temperature sensor (S5) has a constant no-detection-level but no clear detection-level. However, temperature jumps of C allow a clear detection. Signal evaluation, on the other hand, can be quite complex for thermo couples due to their small output signal change. Creep distance (S4), pressure (S6) and force (S7) are rated (-) for signal clarity. Their signals only show short spikes (S6 and S7) or only small changes in signal (S4). To detect the spikes reliably would require higher sampling frequency and complex evaluation algorithms to handle the small and indistinct signal changes.
Sensor feasibility covers factors such as sensor size, power consumption and general ability to be deployed. This is an important factor for traction batteries built in large numbers with high requirements for reliability and low fault detection. Voltage (S1), creep distance (S4) and pressure (S6) are rated the highest (+) in this category. A voltage measurement is usually already deployed in lithium-ion batteries for cell balancing and over- or undercharge protection. Pressure sensors are only approximately a square centimeter in size and available for printed circuit board (PCB) mounts. Pressure measurement does not depend on its position within the battery as long as there are no separate encapsulations within the battery as pressure travels with the speed of sound m s through the housing. The creep distance sensor (S4) can be produced as a thin foil PCB and therefore is cheap and space efficient. It additionally has the potential to detect electrolyte leakage and moisture intrusion, which could lead to a short circuit. Smoke sensor (S3), temperature (S5) and force sensor (S7) come second with a rating of (0). The smoke sensor can be assembled out of cheap and small parts such as resistors, LEDs and photo diodes on a PCB and can be driven in pulse mode, and therefore are very power efficient. However, reflections of the IR-light from housing and adjacent parts limit possible placements and can lead to faulty detections. If the sensor is not placed within the particle or smoke stream, a reliable thermal runaway detection could be prevented or delayed. The same holds for the temperature sensor. If it is not placed in the gas stream, then detection is greatly delayed. The used force sensors are built as foil PCBs and therefore are very thin. Their ability for thermal runaway detection can be limited or even extinguished if spring devices or soft mats between cells are used as anti cell swelling measures described by Majimaa et al. [26]. The gas sensor (S2) is rated with (-) in this category because of its comparably large size and huge power consumption due to its heating coil. Experience has also shown that these sensors often trigger faulty detections.
7. Conclusions
This work examines a sensor set, which is chosen based on evaluated thermal runaway impacts, and shows that each sensor was able to detect a thermal runaway independent from battery size or cell energy density. There is no clear single favourite sensor for a thermal runaway detection as each of them have their challenges and disadvantages, described in Section 6. Depending on the battery design, a combination of two or more sensors can help to create a detection system where disadvantages of single sensors are canceled out and reliability of the overall system is improved. Final considerations for the sensor selection should include lifetime stability, diagnosis capabilities, mountability and cost, which are strongly dependent on the battery design and mission profile.
Other battery types, such as stationary battery systems as operating reserves in electricity networks or stand-alone power systems, can have different requirements towards feasibility or detection speed, and, therefore, a different sensor solution has to be evaluated. The power consumption of a gas sensor might be not as important anymore and the disadvantages in detection speed of a smoke detector might be negligible making these sensors more suitable for such battery types.
Acknowledgments
The authors gratefully acknowledge the support from Dt. ACCUMOTIVE GmbH & Co. KG, Kirchheim u. Teck (Nabern), Germany.
Author Contributions
Sascha Koch and Robert Kuhn conceived and designed the experiment. Sascha Koch analyzed the data. Sascha Koch wrote the paper; and Robert Kuhn and Kai Peter Birke contributed to the manuscript designed and revised the paper.
Conflicts of Interest
The founding sponsors had no role in the design of the study; in the collection, analyses, or interpretation of data; in the writing of the manuscript, and in the decision to publish the results.
Abbreviations
The following abbreviations are used in this manuscript:
| BEV | Battery electric vehicle |
| PHEV | Plug in hybrid electrical vehicle |
| HEV | Hybrid electric vehicle |
| GTR EVS | Global technical regulation on electrical vehicle safety |
| SnO | Tin dioxide |
| CH | Methane |
| CH | Propane |
| CO | Carbon monoxide |
| IR | Infra red |
| LED | Light emitting diode |
| PCB | Printed circuit board |
| NMC | LiNiMnCoO |
| SOC | State of charge |
References
- Latif, A.A. Volkswagen brand: The fall of an auto empire. J. Glob. Bus. Adv. 2017, 10, 281–304. [Google Scholar] [CrossRef]
- Bergmann, J. When compliance fails. Compliance Elliance J. 2016, 2, 85–94. [Google Scholar]
- Scrosati, B.; Hassoun, J.; Sun, Y.K. Lithium-ion batteries. A look into the future. Energy Environ. Sci. 2011, 4, 3287–3295. [Google Scholar] [CrossRef]
- Kern, R.; Bindel, R.; Uhlenbrock, R. Durchgängiges Sicherheitskonzept für die Prüfung von Lithium-Ionen- Batteriesysteme. ATZ Elektron. 2009, 4, 22–29. [Google Scholar] [CrossRef]
- Barnett, B.; Ofer, D.; Sriramulu, S.; Stringfellow, R. Lithium-ion batteries, safety. In Batteries for Sustainability; Springer: New York, NY, USA, 2013; pp. 285–318. [Google Scholar]
- Brousse, T.; Taberna, P.L.; Crosnier, O.; Dugas, R.; Guillemet, P.; Scudeller, Y.; Zhou, Y.; Favier, F.; Bélanger, D.; Simon, P. Long-term cycling behavior of asymmetric activated carbon/MnO2 aqueous electrochemical supercapacitor. J. Power Sources 2007, 173, 633–641. [Google Scholar] [CrossRef] [Green Version]
- Wang, Q.; Ping, P.; Zhao, X.; Chu, G.; Sun, J.; Chen, C. Thermal runaway caused fire and explosion of lithium ion battery. J. Power Sources 2012, 208, 210–224. [Google Scholar] [CrossRef]
- Draft Global Technical Regulation on Electric Vehicle Safety, 2017. ECE/TRANS/WP.29/GRSP/2017/2. Available online: https://www.unece.org/fileadmin/DAM/trans/doc/2017/wp29grsp/GRSP-61-07.pdf (accessed on 23 August 2017).
- Feng, X.; Weng, C.; Ouyang, M.; Sun, J. Online internal short circuit detection for a large format lithium ion battery. Appl. Energy 2016, 161, 168–180. [Google Scholar] [CrossRef]
- Roscher, M.A.; Kuhn, R.M.; Döring, H. Error detection for PHEV, BEV and stationary battery systems. Control Eng. Prac. 2013, 21, 1481–1487. [Google Scholar] [CrossRef]
- Spotnitz, R.; Franklin, J. Abuse behavior of high-power, lithium-ion cells. J. Power Sources 2003, 113, 81–100. [Google Scholar] [CrossRef]
- Harris, S.; Timmons, A.; Pitz, W. A combustion chemistry analysis of carbonate solvents used in Li-ion batteries. J. Power sources 2009, 193, 855–858. [Google Scholar] [CrossRef]
- MacNeil, D.; Dahn, J. Test of reaction kinetics using both differential scanning and accelerating rate calorimetries as applied to the reaction of LixCoO2 in non-aqueous electrolyte. J. Phys. Chem. A 2001, 105, 4430–4439. [Google Scholar] [CrossRef]
- Maleki, H.; AlHallaj, S.; Selman, J.; Dinwiddie, R.; Wang, H. Thermal properties of lithium-ion battery and components. J. Elecrochem. Soc. 1999, 146, 947–954. [Google Scholar] [CrossRef]
- Yang, H.; Bang, H.; Amine, K.; Prakash, J. Investigations of the exothermic reactions of natural graphite anode for Li-ion batteries during thermal runaway. J. Elecrochem. Soc. 2005, 152, A73–A79. [Google Scholar] [CrossRef]
- Arai, H.; Tsuda, M.; Saito, K.; Hayashi, M.; Sakurai, Y. Thermal reactions between delithiated lithium nickelate and electrolyte solutions. J. Elecrochem. Soc. 2002, 149, A401–A406. [Google Scholar] [CrossRef]
- Feng, X.; Fang, M.; He, X.; Ouyang, M.; Lu, L.; Wang, H.; Zhang, M. Thermal runaway features of large format prismatci lithium ion battery using extended volume accelerating rate calorimetry. J. Power Sources 2014, 255, 294–301. [Google Scholar] [CrossRef]
- Feng, X.; He, X.; Ouyang, M.; Lu, L.; Wu, P.; Kulp, C.; Prasser, S. Thermal runaway propagation model for designing a safer battery pack with 25 Ah LiNixCoyMnzO2 large format lithium ion battery. Appl. Energy 2015, 154, 74–91. [Google Scholar] [CrossRef]
- Balakrishnan, P.; Ramesh, R.; Kumar, T.P. Safety mechanisms in lithium-ion batteries. J. Power Sources 2006, 155, 401–414. [Google Scholar] [CrossRef]
- Tobishima, S.; Yamaki, J. A consideration of lithium cell safety. J. Power Sources 1999, 81–82, 882–886. [Google Scholar] [CrossRef]
- Ponchaut, N.; Marr, K.; Colella, F.; Somadepalli, V.; Horn, Q. Thermal Runaway and Safety of Large Lithium-Ion Battery Systems. In Proceedings of the The Battcon 2015, Orlando, FL, USA, 12–14 May 2015; pp. 17.1–17.10. [Google Scholar]
- Lu, L.; Han, X.; Li, J.; Hua, J.; Ouyang, M. A review on the key issue for lithium-ion battery management in electric vehicles. J. Power Sources 2013, 226, 272–288. [Google Scholar] [CrossRef]
- Ohsaki, T.; Kishi, T.; Kuboki, T.; Takami, N.; Shimura, N.; Sato, Y.; Sekino, M.; Satoh, A. Overcharge reaction of lithium-ion batteries. J. Power Sources 2005, 146, 97–100. [Google Scholar] [CrossRef]
- Doughty, D.; Roth, E.; Crafts, C.; Nagasubramanian, G.; Henriksen, G.; Amine, K. Effects of additives on thermal stability of Li ion cells. J. Power Sources 2005, 146, 116–120. [Google Scholar] [CrossRef]
- Abraham, D.; Roth, E.; Kostecki, R.; McCarthy, K.; MacLaren, S.; Doughty, D. Diagnostic examination of thermally abused high-power lithium-ion cells. J. Power Sources 2006, 161, 648–657. [Google Scholar] [CrossRef]
- Majimaa, M.; Tadab, T.; Ujiieb, S.; Yagasakib, E.; Inazawaa, S.; Miyazakia, K. Design and characteristics of large-scale lithium ion battery. J. Power Sources 1999, 81–82, 877–881. [Google Scholar] [CrossRef]
Figure 1.
Drawings of the three different test setups. (a) Setup V1, (b) setup V2 and (c) setup V3. The housings are only partially shown for better visibility of the cells (1) and cell modules (11). Trigger device heat plate/nail (2), filler block (3), venting opening (4), pressure sensor (5), gas sensor (6), temperature sensor (7), smoke detector (8), creep distance sensor (9) and area with sensors (10).
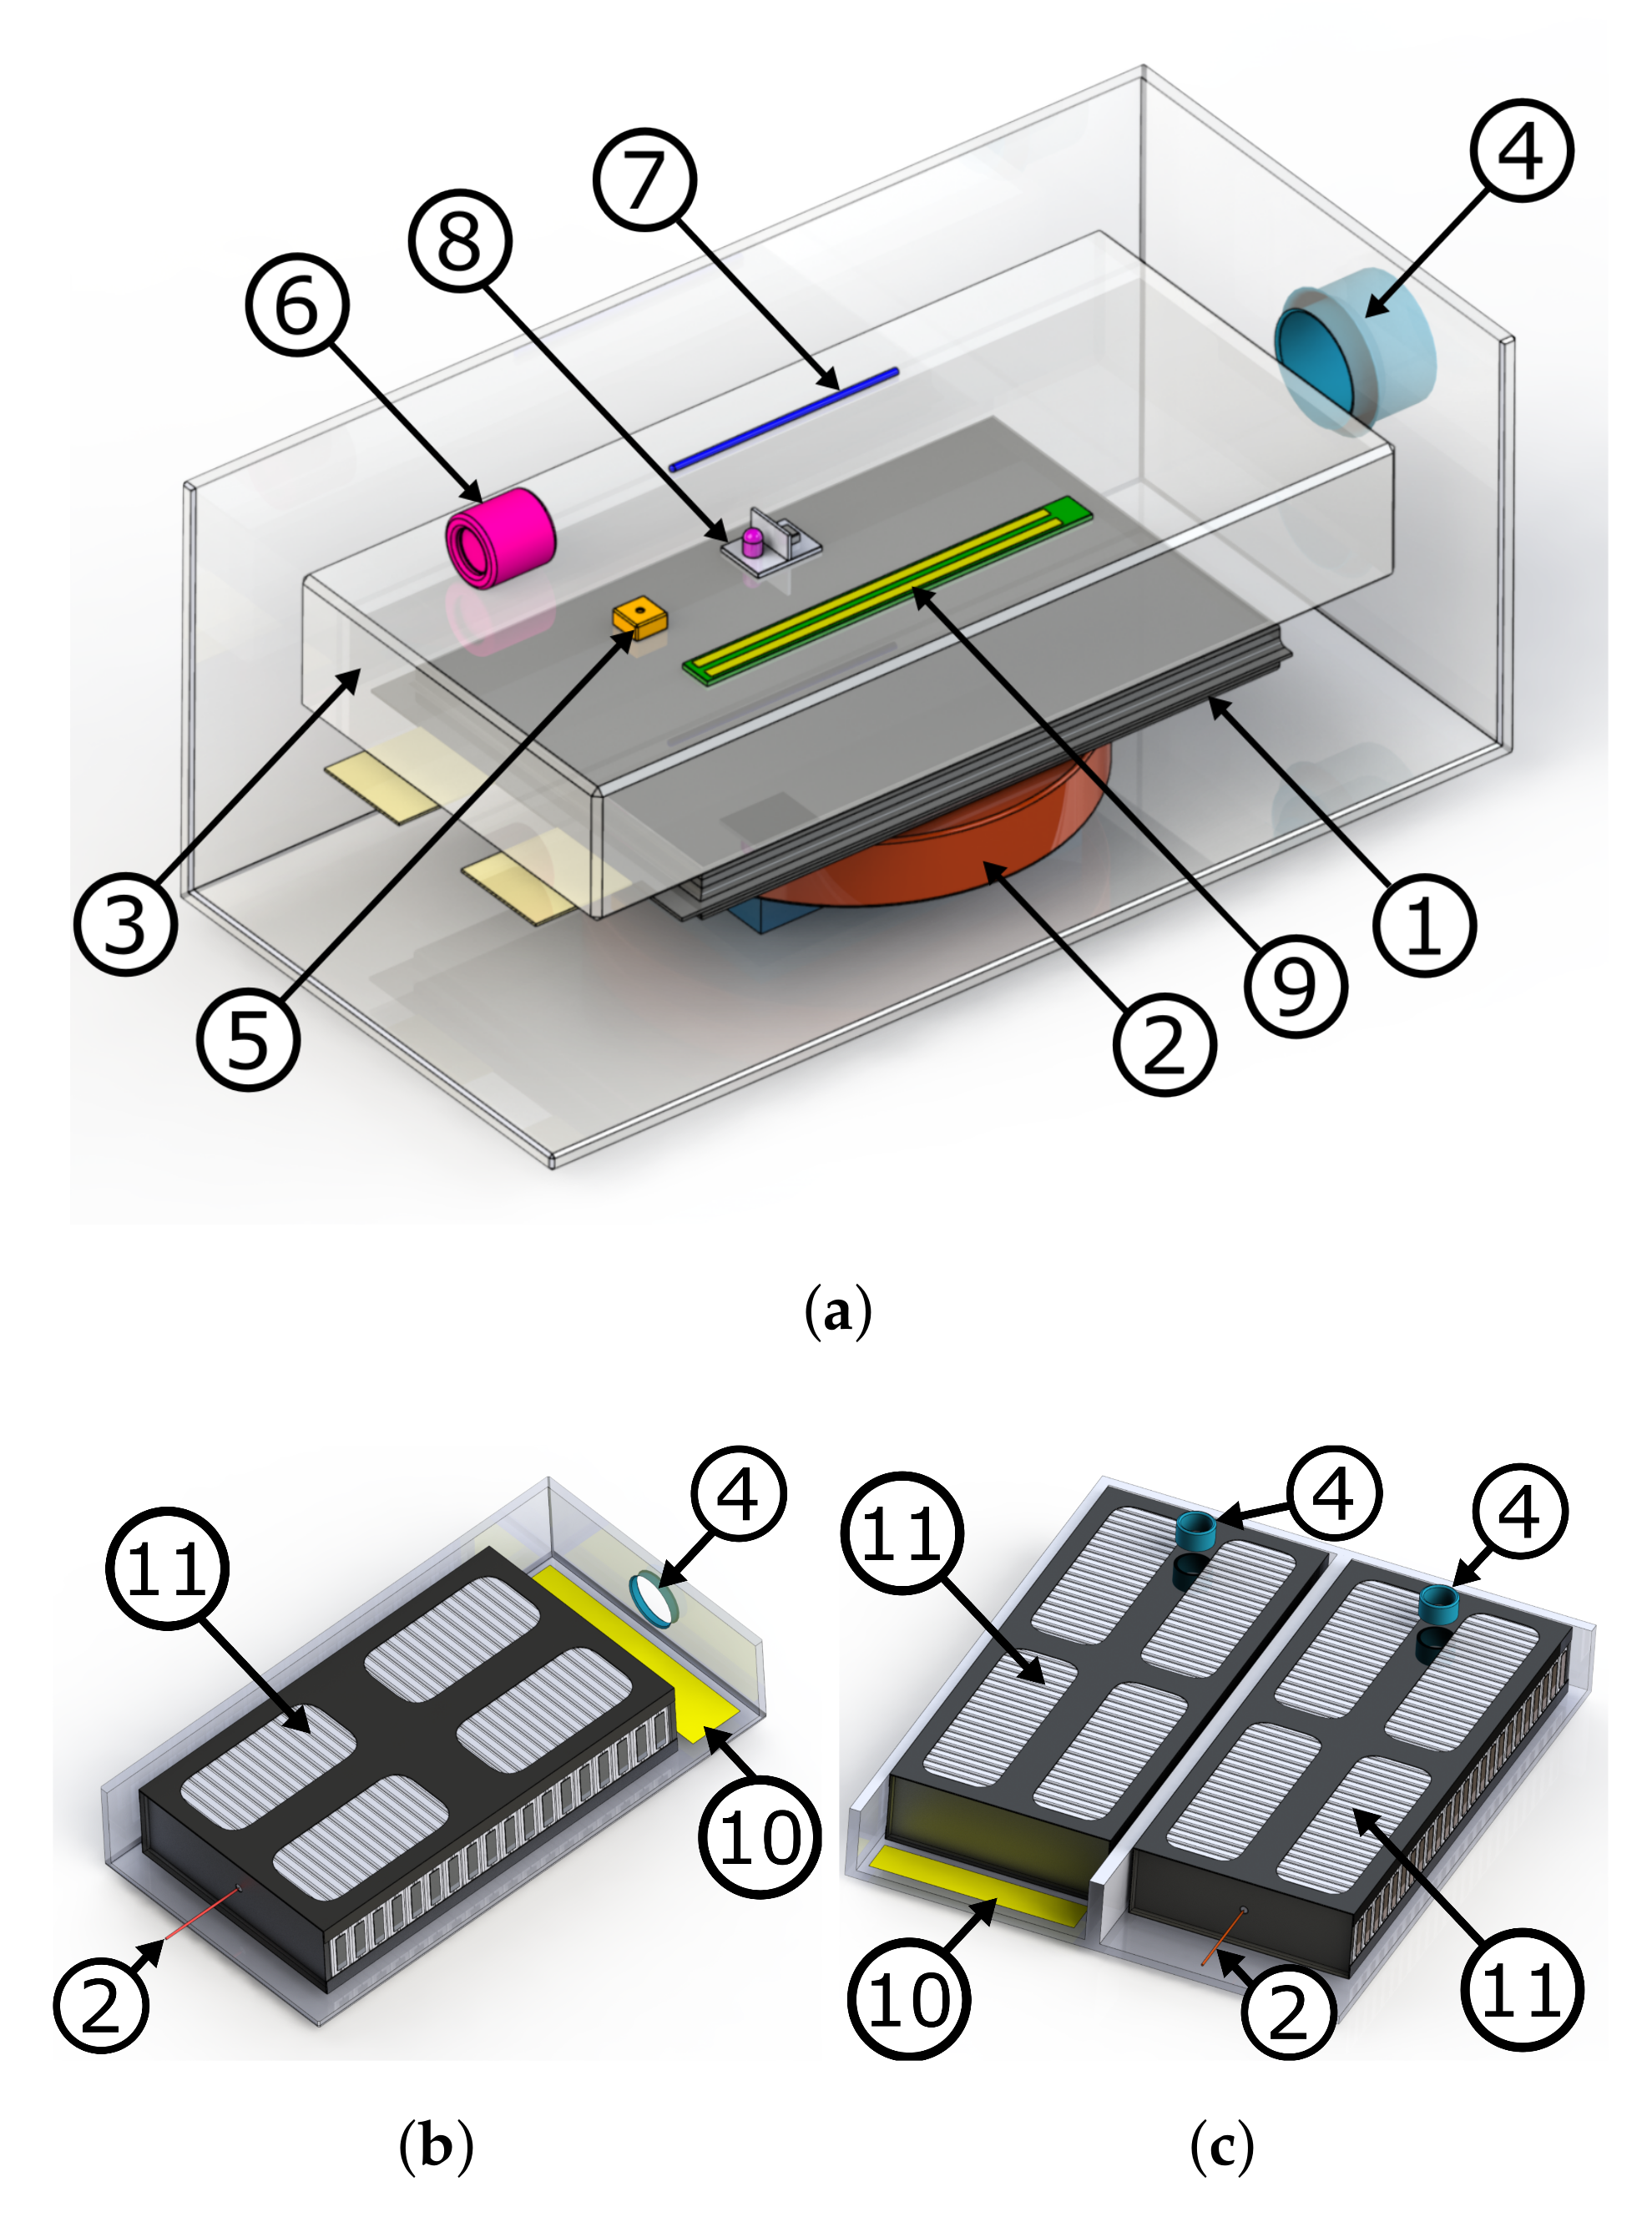
Figure 2.
Readings of the sensors in test V1. The dashed line labeled with “visible venting” indicates the time when a venting was visible outside of the battery housing. All sensors detect the thermal runaway effects of the cell within a time window of about s.
Figure 2.
Readings of the sensors in test V1. The dashed line labeled with “visible venting” indicates the time when a venting was visible outside of the battery housing. All sensors detect the thermal runaway effects of the cell within a time window of about s.

Figure 3.
Sensor readings during test V2. The dashed line indicates when the trigger cell is fully penetrated. The detection time window is about s wide, mainly stretched by the late drop in the cell voltage.
Figure 3.
Sensor readings during test V2. The dashed line indicates when the trigger cell is fully penetrated. The detection time window is about s wide, mainly stretched by the late drop in the cell voltage.
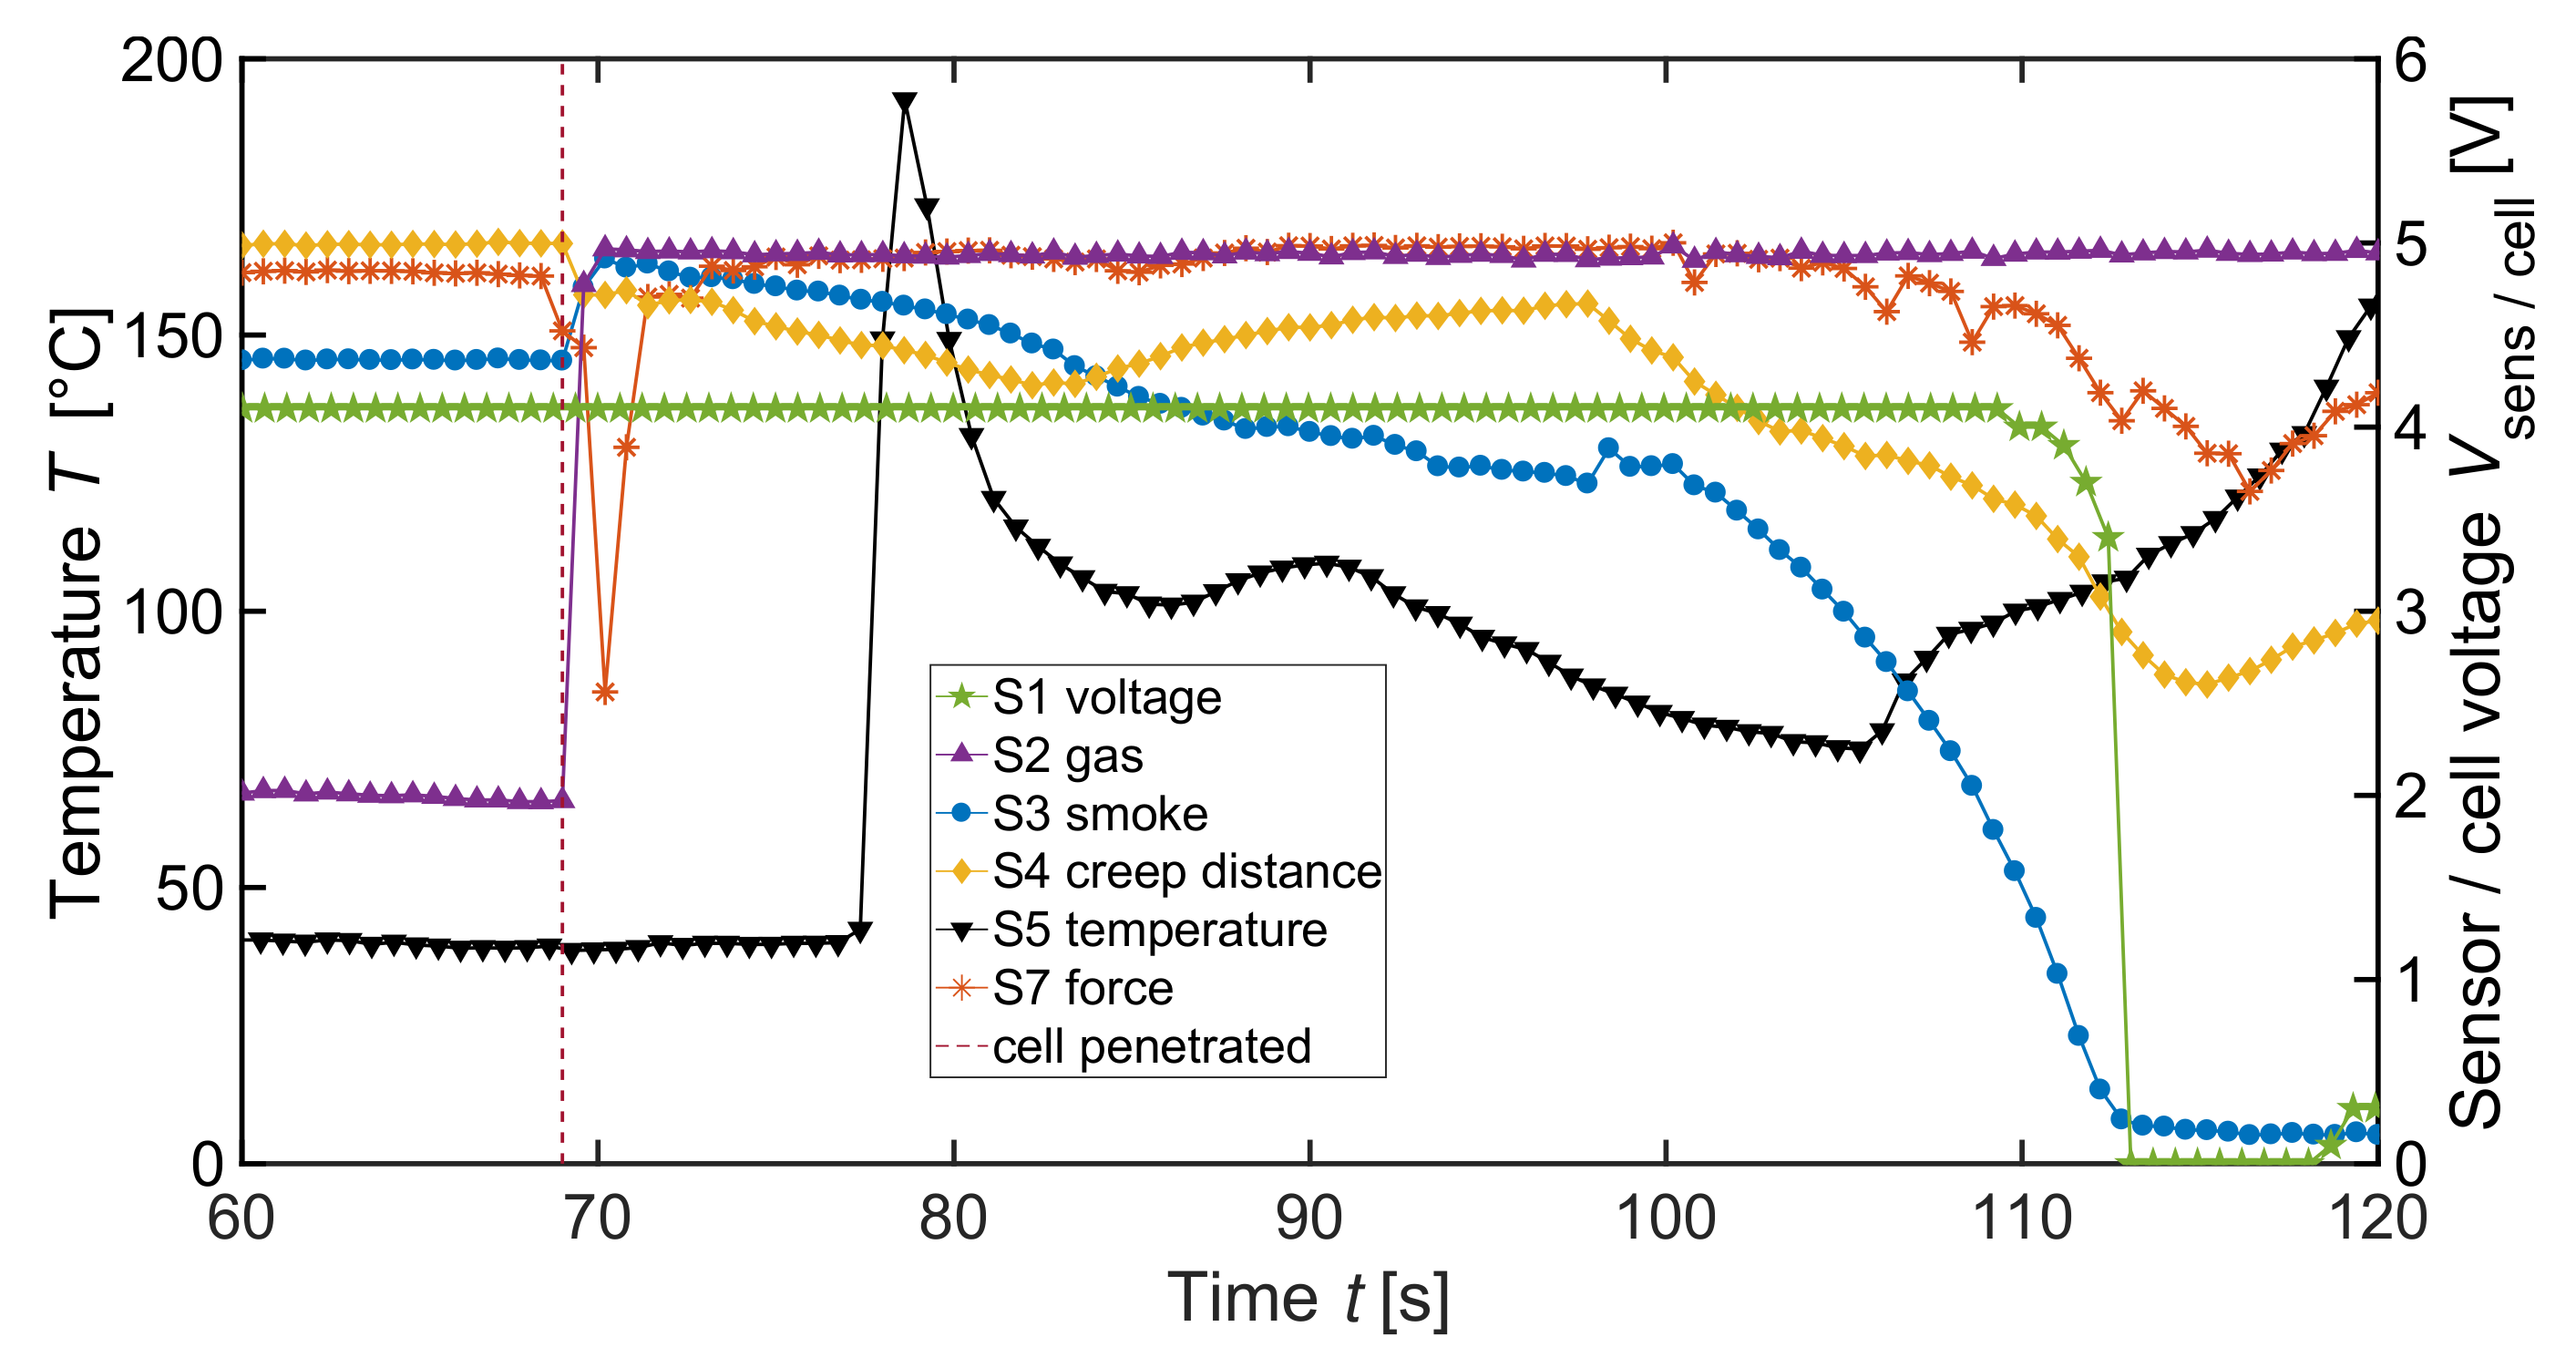
Figure 4.
Measurements of test V3. The dashed line again displays when the trigger cell is completely penetrated. The detection window is about s wide and therefore in the same range as in tests V1 and V2.
Figure 4.
Measurements of test V3. The dashed line again displays when the trigger cell is completely penetrated. The detection window is about s wide and therefore in the same range as in tests V1 and V2.


Table 1.
Overview over the investigated sensor set. All sensors deliver a voltage output signal or can easily be transformed into one by a voltage divider.
Table 1.
Overview over the investigated sensor set. All sensors deliver a voltage output signal or can easily be transformed into one by a voltage divider.
| Label | Sensor | Measured Physical Dimension |
|---|---|---|
| S1 | voltage sensor | voltage of first logical cell |
| S2 | gas detector | presence of chemicals |
| S3 | smoke detector | smoke particle density |
| S4 | creep distance sensor | electrical resistivity of surface |
| S5 | temperature sensor | gas temperature |
| S6 | pressure sensor | pressure |
| S7 | force sensor | force between cells |
Table 2.
Summary of conducted experiments. All tests have been carried out at a state of charge and test V2 and V3 have been executed at C. Sensor labels reffer to Table 1.
Table 2.
Summary of conducted experiments. All tests have been carried out at a state of charge and test V2 and V3 have been executed at C. Sensor labels reffer to Table 1.
| Test | Cell Volume | Cell Energy Density | Connection | Module Count | Trigger | Sensors |
|---|---|---|---|---|---|---|
| V1 | 210 cm | 350 Wh L | 1p | 1 | Heating | S1-S6 |
| V2 | 370 cm | 700 Wh L | 2p | 1 | Nail penetration | S1–S5, S7 |
| V3 | 390 cm | 540 Wh L | 2p | 2 | Nail penetration | S1-S6 |
Table 3.
Evaluation of the different sensors on three categories. Signal clarity describes how close the detection signal comes to a step function and how easy it is to evaluate it, whereas sensor feasibility evaluates how easy the sensor can be deployed. Grading goes from (+) good, to (0) neutral to (-) bad.
| Sensor | Detection Speed | Signal Clarity | Sensor Feasibility |
|---|---|---|---|
| S1 voltage | - | + | + |
| S2 gas | + | + | - |
| S3 smoke | - | 0 | 0 |
| S4 creep distance | - | - | + |
| S5 temperature | 0 | 0 | 0 |
| S6 pressure | + | - | + |
| S7 force | + | - | 0 |
© 2018 by the authors. Licensee MDPI, Basel, Switzerland. This article is an open access article distributed under the terms and conditions of the Creative Commons Attribution (CC BY) license (http://creativecommons.org/licenses/by/4.0/).
Share and Cite
MDPI and ACS Style
Koch, S.; Birke, K.P.; Kuhn, R. Fast Thermal Runaway Detection for Lithium-Ion Cells in Large Scale Traction Batteries. Batteries 2018, 4, 16. https://doi.org/10.3390/batteries4020016
AMA Style
Koch S, Birke KP, Kuhn R. Fast Thermal Runaway Detection for Lithium-Ion Cells in Large Scale Traction Batteries. Batteries. 2018; 4(2):16. https://doi.org/10.3390/batteries4020016
Chicago/Turabian StyleKoch, Sascha, Kai Peter Birke, and Robert Kuhn. 2018. "Fast Thermal Runaway Detection for Lithium-Ion Cells in Large Scale Traction Batteries" Batteries 4, no. 2: 16. https://doi.org/10.3390/batteries4020016
Note that from the first issue of 2016, this journal uses article numbers instead of page numbers. See further details here.