Article

Real-Time Implementation of an Extended Kalman Filter and a PI Observer for State Estimation of Rechargeable Li-Ion Batteries in Hybrid Electric Vehicle Applications—A Case Study

by
Roxana-Elena Tudoroiu
1,
Mohammed Zaheeruddin
2,
Sorin-Mihai Radu
3 and
Nicolae Tudoroiu
4,*
1
Department of Mathematics and Informatics, University of Petrosani, Petrosani 332006, Romania
2
Department of Building, Civil and Environmental Engineering, University Concordia from Montreal, Montreal, QC H3G 1M8, Canada
3
Department of Control, Computers, Electrical and Power Engineering, University of Petrosani, Petrosani 332006, Romania
4
Department of Engineering Technologies, John Abbott College, Saint-Anne-de-Bellevue, QC H9X 3L9, Canada
*
Author to whom correspondence should be addressed.
Batteries 2018, 4(2), 19; https://doi.org/10.3390/batteries4020019
Submission received: 8 March 2018 / Revised: 2 April 2018 / Accepted: 4 April 2018 / Published: 10 April 2018
(This article belongs to the Special Issue Battery Integration and Operation in Electro-Mobile Applications)

Abstract

:
The Li-Ion battery state-of-charge estimation is an essential task in a continuous dynamic automotive industry for large-scale and successful marketing of hybrid electric vehicles. Also, the state-of-charge of any rechargeable battery, regardless of its chemistry, is an essential condition parameter for battery management systems of hybrid electric vehicles. In this study, we share from our accumulated experience in the control system applications field some preliminary results, especially in modeling, control and state estimation techniques. We investigate the design and effectiveness of two state-of-charge estimators, namely an extended Kalman filter and a proportional integral observer, implemented in a real-time MATLAB environment for a particular Li-Ion battery. Definitely, the aim of this work is to find the most suitable estimator in terms of estimation accuracy and robustness to changes in initial conditions (i.e., the initial guess value of battery state-of-charge) and changes in process and measurement noise levels. By a rigorous performance analysis of MATLAB simulation results, the potential estimator choice is revealed. The performance comparison can be done visually on similar graphs if the information gathered provides a good insight, otherwise, it can be done statistically based on the calculus of statistic errors, in terms of root mean square error, mean absolute error and mean square error.

1. Introduction

Nowadays, the most advanced battery technologies existing in electric and hybrid electric vehicles (EVs/HEVs) from the automotive industry are the nickel-metal hydride (NiMH), lithium-ion (Li-Ion) and nickel-cadmium (NiCad) batteries. However, the Li-Ion battery surpasses NiCad and NiMH batteries, which are the two other equally strong players on the same market, due to its light weight, high energy density, long life cycle, relatively low self-discharge rate and low memory effect, as is mentioned also in [1,2,3,4]. Lithium-Ion batteries are used as energy storages in many electric devices, ranging from small battery packs used in cell phones or cameras to large battery systems for EVs or temporary energy storages for photovoltaic systems. Li-Ion batteries are the most suitable existing technology for EVs because they can output high energy and power per unit of battery mass, allowing them to be lighter and smaller than other rechargeable batteries. These features also explain why Li-Ion batteries are already integrated into cell phones, laptops, digital cameras/video cameras, and portable audio/game players. Also, Li-Ion batteries have a large potential to further increase energy density by using advanced anode and cathode materials [5]. Li-Ion batteries’ energy density is increasing rapidly. However, increasing in energy and power density performance are not enough; other improvements are required regarding the durability, safety and cost, as is mentioned in [5]. The Li-Ion batteries in HEVs/EVs are required to have reliable durability for deep repeated charging and discharging cycles in order to preserve longer life. During the deep cycles, the capacity of Li-Ion batteries decrease rapidly, but EVs will be charged after the battery’s stored energy is almost depleted. The durability test data obtained in all major Li-Ion HEVs/EVs battery development programs indicate that the battery operating life is typically only 2–4 years at present. In addition, all Li-Ion EVs batteries exhibit various degrees of sensitivity when subject to some of the abuse tests intended to simulate battery behavior and safety under high mechanical, thermal or electrical stresses. Also, the power of Li-Ion batteries is very sensitive to temperature variations, decreasing drastically in cold weather. Thus, they do not work well in extreme temperatures, and to overcome this problem a cooling and heating system is required to cool and to heat the Li-Ion batteries, hence, extending their life [5]. Related to safety, the Li-Ion batteries are vulnerable to short-circuiting and overcharging compared to NiMH and NiCad batteries. In the Li-Ion batteries during short circuits, “high electricity flows are created and the battery temperature increases to several hundred degrees within seconds, heating up neighboring cells and resulting in an entire battery combustion reaction”, as is stated in [5]. Furthermore, in [5] it is stated also that “when lithium ion batteries are unintentionally overcharged, the chemical structure of the anode and cathode are destroyed and some of the lithium ions form snowflake-shaped lithium metal deposits called “dendrites,” which can cause the battery to short circuit or, in a worse-case scenario, explode and catch fire”. Additionally, the impurities in the lithium metal can also contaminate the Li-Ion batteries and cause the formation of dendrites, potentially causing short circuits and explosions. To prevent battery overcharging, Li-Ion batteries have to be provided in packs with very accurate voltage control systems [5]. Li-Ion battery cells are relatively maintenance-free, but they do require a battery management system (BMS) and ventilation for cooling or liquid cooling, since high temperatures will degrade the batteries’ performance and life cycle. Despite their higher power density and a long life cycle that is about 2.5 times compared to lead-acid batteries, the Li-Ion batteries have other main drawbacks, namely their high cost, limited availability for retail sales, more sensitivity to overcharging or over-discharging than any other chemistry, limited laboratory testing and extrapolation regarding data for life cycle, usable energy and other performance specs. Related to these aspects, we can underline the high Li-Ion batteries cost, almost four to eight times greater than that of lead-acid and one to four times that of NiMH, as is mentioned also in [5], but even with price drops, Li-Ion technology is still slow for most HEVs/EVs conversions. Fortunately, the cost of Li-Ion batteries is “expected to decrease significantly because the batteries will be increasingly used for many applications, such as uninterruptible power supply (UPS), forklifts, consumer electronics and backup power supplies” as is stated in [5]. Thus, as the HEVs/EVs market grows and automotive industry production “scales up, the manufacturers will be able to enjoy economies of scale” [5]. Moreover, another essential aspect regarding the Li-Ion battery system is its high cell voltage related to high specific energy that makes it possible to use a smaller number of cells per battery pack, and thus a reduced cost and increased reliability. The basic requirements for all the HEVs/EVs applications that can be seen also as battery selection criteria, are represented by the high energy and power density, capacity, weight, size, low cost, long life (more than 1000 cycles), battery state-of-charge (SOC), memory effect, low self-discharging rate, “free” maintenance, and environmental impact. The Li-Ion battery design may be optimized for power or for capacity, and so the type of cells used, not just the size, must be selected to suit the application. The HEVs/EVs BMS generally operates in very harsh operating environments and the Li-Ion battery must withstand wide temperature ranges (−30 °C to +65 °C) as well as shock, vibration and abuse. Moreover, the Li-Ion battery is the single source of power, so it must be sized to deliver that power. The battery capacity has to be sufficient to achieve the required range but, since it is not desirable to fully discharge the battery, a margin of about 20% is needed, so that the depth of discharge (DOD), as it is defined in the next section, will not exceed 80%. A further margin of about 5% is also required to accept any regenerative braking charge when the battery has just been charged. More precisely, the Li-Ion battery should be tailored to provide the required capacity when the maximum SOC that is defined in the next section is 95% and the maximum DOD related to SOC is 80%. The continuous discharge rate for batteries optimized for capacity is typically about 1 C although some cells may tolerate pulse currents of up to 3 C or more for short periods. A HEV/EV Li-Ion battery will usually have one deep discharge per day with some intermediate peaks from regen braking and a typical Lithium-Ion HEV/EV battery lifetime may be from 500 to 2000 cycles. Low weight is essential for high capacity automotive HEVs/EVs batteries used in passenger vehicles, so Li-Ion batteries are the most suitable for these applications. Furthermore, the Li-Ion batteries of the newest generation are safer and less toxic than the same batteries in competition, related to its great potential to reduce greenhouse and other exhaust gas emission from transport. Protection circuits are also essential for all batteries using non-Lead acid chemistries. The upcoming advancement in Li-Ion batteries is in Lithium-air, and in nanotechnology batteries. The Lithium-air batteries will have a higher energy density due to oxygen being a lighter cathode and a freely available resource.
Summarizing, there are other battery technologies under investigation in research, but the progress in this direction is not moving as rapidly as automakers would like. For the projected future, HEVs and EVs are probably going to be powered by either NiMH or Li-Ion batteries. Like every new technology, battery prices will be finally lower, but it is going to take time, as right now, global battery manufacturing capacity is still fairly constrained. Li-Ion battery is obviously a better and more efficient way to power modern HEVs/EVs, but it is also more expensive. Various types of tailored improvements with regard to process, cell, and the overall component design along with increased production scale are expected to moderately but steadily increase performance and reduce cost over the coming 5 years according to the US National Research Council. These types of advances are also coupled to decreased material and energy use. Additionally, in a longer time perspective, battery recycling may offer both economic and environmental benefits.
Due to the diversity and the complexity of the HEV field, we are focused only on aspects concerning the modelling, design and implementation of two SOC estimators for a particular Li-Ion battery in MATLAB/SIMULINK simulation environments. The Li-Ion battery is the core component integrated in the battery management system of HEVs that plays an important role for “improving the battery performance, prolonging battery life, and ensuring its safety” [2], p. 1. This objective is accomplished by the BMS through continuously monitoring the main internal parameters of the Li-Ion battery, amongst them the current, voltage, SOC, and temperature. Finally, for commercial success, the lifetime of HEV cells must meet or exceed the lifetime of the vehicle. Replacing a battery pack every few years is not acceptable. In [6] is stated that “cell electro-chemistry and construction plays a dominant role in longevity, but good BMS algorithms can extend life as well by prohibiting pack use that over-stresses cells, thus preventing damage”. Furthermore, the SOC is an essential operational condition parameter for BMS that affects seriously the battery health and its life. Since the SOC cannot be measured directly, its estimation is a vital operation to prevent the dangerous situations when the battery is overcharged or over-discharged, and to considerably improve battery performance [2]. As an internal state of a battery, the SOC is defined as a remaining capacity of the battery (i.e., the available capacity of a battery), as a percentage of its rated capacity [1], p. 21, [2], p. 1, [5], p. 254. The common SOC estimation strategies are model-based, and grouped in Kalman filter estimation techniques, namely standard Kalman filter (KF), extended Kalman filter (EKF), unscented Kalman filter (UKF), ensemble Kalman filter (EnKF), particle filter (PF), as developed in [6,7,8,9,10], linear (Luenberger) and nonlinear observers, and sliding mode estimators including also its fuzzy improved version [11]. Hence, in this research article we investigate some technical aspects, specifically of Li-Ion battery modeling, designing and implementing in real time MATLAB R2017a version and Advanced Simulator (ADVISOR) for HEVs [12,13,14,15,16] environments two appropriate battery SOC estimation techniques. The remainder of this chapter is organized as follows. In Section 2, the widely-used 2RC-series cell Li-Ion battery electric equivalent model circuit (EMC) is introduced and state space equations are derived. In Section 3, we developed the design and the implementation in real time of two SOC estimators, such as: (1) a real time EKF SOC estimator; (2) a real time PI observer (PIO) SOC estimator. Also, the simulation results and the performance analysis on the proposed state estimators are carried out in the same section and an improved 3RC EMC Li-Ion battery model with time variable parameters dependent on the temperature and SOC is proposed. Section 4 concludes this research article.

2. Li-Ion Battery: Terminology, Electric Model Circuit and Validation Tests, a Case Study

This section is divided into several subsections to introduce the following interesting topics:
(1)
Battery selection criteria, identify the main disturbance and the factors that affect the battery performance
(2)
Battery terminology
(3)
BMS functions, hardware and software components
(4)
SOC direct measurement methods reported in the literature
(5)
Analytic battery models reported in the literature
(6)
Li-Ion battery model selection
(7)
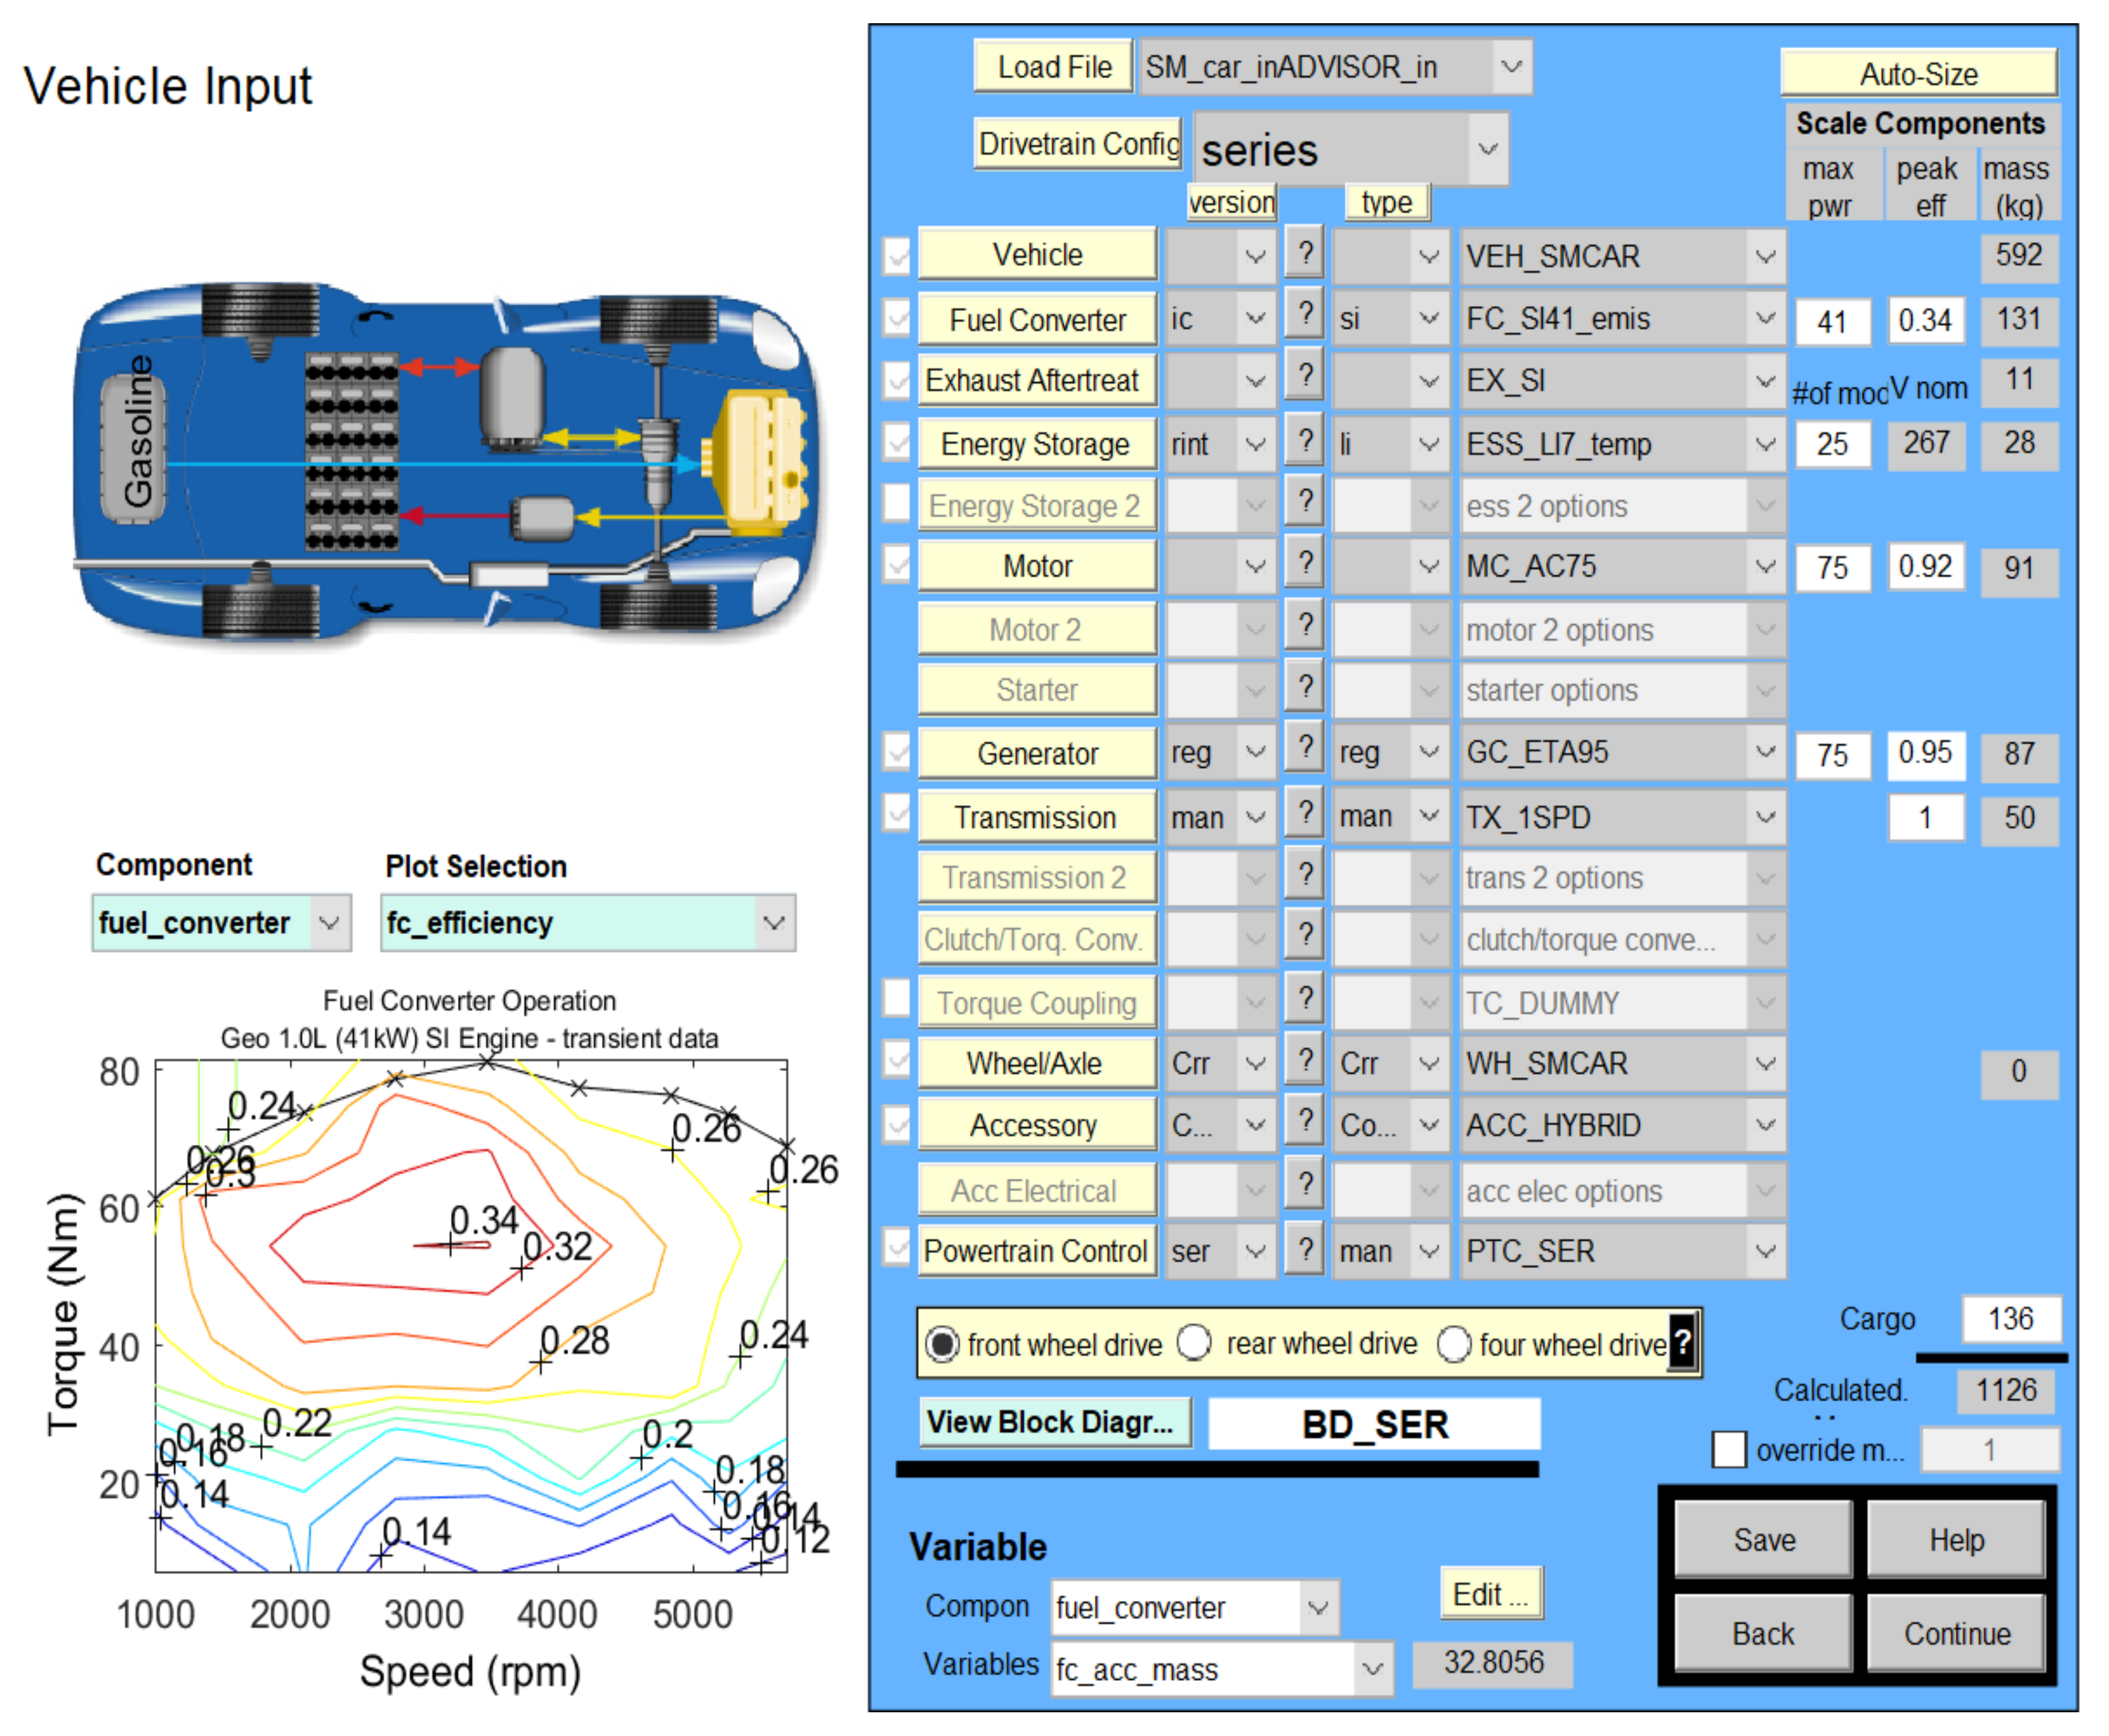
ADVISOR MATLAB platform model validation, a case study

2.1. Li-Ion Battery Model Selection, Disturbances and the Factors Which Affect the Battery Performance

For simulation purposes, a specific setup for second order 2RC EMC Li-Ion battery model parameters, based on the assumption that they are not dependent on temperature and SOC, is considered to prove the effectiveness of the proposed SOC estimation strategies. Since in “real life” the dynamic of the battery is seriously affected by temperature, an improvement is done by considering an increase in the order of the proposed model by connecting in series a new polarization RC battery cell, the so called 3RC EMC Li-Ion battery model described in [3,17], but this time the battery parameters are variable in time and dependent on temperature and updated dynamically based on a thermal model described in Section 3.1.2. The setup for 3RC EMC Li-Ion battery model parameters is accomplished from the generic EMC by changing only the values of the model parameters in a state-space equation. In this paper, for the case study we have chosen the commonly used 2RC series cells Li-Ion battery EMC as a model-based support, shown in Figure 1, well documented in [2,3,4,11], and also its improved version third order 3RC EMC with time varying parameters and dependent on the temperature is under consideration. Perhaps the first Li-Ion battery model 2RC EMC selection could be criticized by experts from the field since it is not realistic as long as in real life the parameters of Li-Ion battery, such as battery internal resistance and the polarization resistances and capacitances are strictly dependent on the environment temperature. The main reason for this selection was to benefit of the simplicity of RC second order EMC and its ability to be implemented in real time applications with an acceptable range of performance. Also, “this choice is due to the early popularity of BMS for portable electronics, where the approximation of the battery model with the proposed EMC is appropriate”, as is mentioned in [2,11]. This approach has been extended easily to Li-Ion batteries for the HVEs/EVs in the automotive industry and for many other similar energy storage applications [2,11,15]. The model is used only for simulation purposes, since we are interested in the “proof of concept” algorithmic considerations as motivated by the requirements imposed by the environment and the vehicle. Also, we have more flexibility to prove the effectiveness of the proposed SOC estimation strategies based on this simple model, in terms of estimation accuracy, speed convergence, robustness to different changes in battery model parameters (i.e., internal resistance, battery capacity affected by aging degradation and repeated charging and discharging cycles), to the current sensor noise level, and the real time implementation simplicity in a MATLAB simulation environment. The electrical circuit model is relatively accurate to capture the dynamic circuit characteristics of a battery cell, such as the open-circuit voltage, terminal voltage, transient response, and self-discharge. However, this model is unable to capture the nonlinear capacity behaviors, such as the rate capacity effect and recovery effect of the battery due to the use of a constant capacitance to represent the remaining usable capacity of the battery [18,19]. Nevertheless, considering the modeling errors, capacity variation, and the additional output sensor noise, the 2RC EMC Li-Ion battery model whose dynamics is given by the Equations (5) and (6) is not sufficient to model the entire dynamics of the Li-Ion battery. The disturbance denoted by v ( x , u , t ) in Section 3.2 describes the nonlinearities, unknown-inputs, and un-model dynamics of the battery and may be a nonlinear function of states, inputs and time, caused specially by the temperature and measurement current sensor noise level, as is mentioned in [2].
The Li-Ion batteries have a finite life due to the presence of the unwanted chemical or physical changes to the active materials of which they are made. These changes are usually irreversible and they affect the electrical performance of the battery cell [2]. The Li-Ion battery life can usually only be extended by preventing or reducing the cause of the unwanted parasitic chemical effects which occur in the battery cells. The Li-Ion batteries’ performance deteriorates over time whether the battery is used or not, known as “cycle fade”, and “calendar fade” respectively [2].
The main factors that affect the Li-Ion battery dynamics in realistic operating conditions are summarized with more details in [18]. Amongst these factors, we highlight the following:
  • Chemical changes: the battery is an electrochemical device which converts chemical energy into electrical energy or vice versa by means of controlled chemical reactions between a set of active chemicals. Typically, the desired chemical reactions inside the battery are usually accompanied by unwanted, parasitic chemical reactions which consume some of the active chemicals or impede their reactions. Even if the battery cell’s active chemicals remain unaffected over time, the battery cells can fail because unwanted chemical or physical changes to the seals keeping the electrolyte in place.
  • Depletion of the active chemicals: under different conditions of pressure, temperature, electric field and duration of the reaction, the active chemicals in a battery cell may break down or combine in many different ways.
  • Temperature effects: the battery operation has a strongly dependency on temperature, which is a crucial factor for safety consideration. Elevated temperatures during storage or use seriously affect the battery life since the chemical reactions inside the battery are driven by temperature. An increase in battery temperature leads to an increase in chemical reactions speed inside the battery cells. High temperatures provide an increased performance, but the rate of the unwanted chemical reactions will increase also affecting the battery life. The temperature affects both the shelf life and the life cycle of the battery, since the chemical reactions induce failures as a result of parasitic reactions within the battery cells. The thumb rule is that “for every 10 °C increase in temperature the reaction rate doubles”. Thus, an hour at 35 °C is equivalent to two hours at 25 °C in battery life, thus the heat is one of the strongest enemy for the battery; even small increases in temperature have a great impact on battery performance [18].
  • Pressure effects: an increased internal pressure within a battery cell is usually the consequence of increased temperature. The “excessive currents or a high ambient temperature will cause the battery cell temperature to rise and the resulting expansion of the active chemicals will in turn cause the internal pressure in the battery cell to rise. Overcharging also causes a rise in temperature, but more seriously, overcharging can also cause the release of gases resulting in an even greater build up in the internal pressure”, as is stated in [18]. An increased pressure tends to magnify the effects of high temperature by increasing the rate of the chemical actions in the battery cell.
  • Depth of discharge (DOD): is related to battery SOC as is defined in next Section 2.2 that at a given temperature and discharge rate is proportional with the amount of active chemicals transformed with each charge and discharge cycle. For almost all chemistries “the number of cycles yielded by a battery goes up exponentially the shallower the DOD”.
  • Charging level: the life cycle of Lithium-Ion batteries can be increased by reducing the charging cut off voltage, i.e., gives the battery a partial charge instead of fully charging it.
  • Charging rate: the battery life is also influenced by the charging rate. Essentially, at high discharge rates the battery capacity decreases since the transformation of the active chemicals are affected by the battery current drawn. The result is incomplete or unwanted chemical reactions, and thus, an associated decrease in capacity. This “may be accompanied by changes in the morphology of the electrode crystals such as cracking or crystal growth which adversely affect the internal impedance” of the battery cell, as is stated in [18]. Similar problems occur during battery charging cycles. There is a limitation as to how quickly the lithium ions can enter into the intercalation layers of the anode. Since the battery input current increases too much during the charging process, a “lithium plating” process takes place, and surplus ions are deposited on the anode in the form of lithium metal that results in an irreversible capacity loss. Conversely, maintaining the higher voltages needed for fast charging can lead to breakdown of the electrolyte which also results in capacity loss. Thus, with each battery charge/discharge cycle the accumulated irreversible capacity loss will increase [18].
  • Voltage effects: The practical voltage limits are the consequence of the onset of undesirable chemical reactions which take place beyond the safe operating conditions range. Protection circuits are “designed to keep the battery cell well within its recommended working range with limits set to include a safety margin” [18].
  • Cell aging effects: the “passage of current through the battery cell and the heating and cooling the cell is subjected to will cause small changes in the microstructure or morphology of the active chemicals” [18]. A battery “does not have infinite life time due to unwanted chemical reactions, including electrolyte decomposition, physical damage, and the loss of active materials in the battery” [18]. These are irreversible changes that usually cause unrecoverable capacity fade, and deteriorate the battery performance, such as increase of internal resistance and high self-discharge rate [18]. These aging effects of the battery ultimately will result in battery failure. The aging process is caused by complex operating conditions affected by the number of cycling, ambient temperature, DOD, and current rate [18]. Also, in [18] are summarized the following aging effects:
    High temperature accelerates the aging of the battery in both cycling and calendar modes;
    Large DOD variance speeds up the aging process;
    Arduous current cycle profile accelerates the aging process.
  • Coulombic efficiency (CE): it is not a standard definition for CE, but we can roughly define it as charge capacity at the end of the discharge cycle with the battery cell fully recharged divided by charge capacity at the beginning of the charge cycle. The CE is also called faradaic efficiency or current efficiency and describes the charge efficiency by which electrons are transferred in batteries. CE can be defined also as the ratio of the total charge extracted from the battery to the total charge put into the battery over a full cycle. Li-Ion battery has one of the highest CE ratings in rechargeable batteries class. It offers an efficiency that exceeds 99 percent. This, however, is only possible when the Li-Ion battery is charged at a moderate input current and at cool temperatures. Conversely, ultra-fast charging lowers the CE because of losses due to charge acceptance and heat, so also does a very slow charge in which self-discharge comes into play. The coulombic efficiency of Li-Ion improves with cycling, some start at 99.5 percent and reached 99.9 percent within 30 cycles [18]. The consistency on repeat tests is high, reflected in a very stable Li-Ion battery system. Unlike Li-Ion batteries, the Lead acid batteries reach a CE of about 90 percent, and nickel-based batteries have a CE lower than 90 percent. With fast charge, NiCad and NiMH may reach 90 percent but a slow charge reduces this to about 70 percent [18]. Lower charge acceptance when above 70 percent SOC and self-discharge that increases when the battery gets warm toward the end of charge are contributing factors for the low CE. Best efficiencies of Li-Ion batteries attain mid-range SOC of 30–70 percent [18]. All battery chemistry systems provide unique CE values that vary with charge rates and temperature. Also, the age has a considerable impact on CE. Precise measurements on Coulombic efficiency provides an excellent method of characterizing the essential aspects of Li-Ion battery cells and performance providing very quick answers with reasonably small samples. It enables technologies to be ranked by their Coulombic efficiency and is particularly useful as a lab tool for comparing the effects of alternative materials on cell performance.
  • Loss of electrolyte: any reduction in the volume of the battery cell’s active chemicals will reduce directly the cell’s electrical capacity.
  • Internal resistance: the internal resistance of the battery is affected by the following factors: conductor resistance, electrolyte resistance, ionic mobility, separator efficiency, reactive rates at the electrodes, and concentration polarization, temperature effects and changes in SOC. When a battery fails, it is typically since it has built up enough internal resistance that it can no longer supply a useful amount of power to an external load, according to the maximum power transfer between the source and the load, as is stated in [15]. The actual ageing process results in a gradual reduction in Li-Ion battery capacity over time. When a battery cell reaches its specified lifetime it does not stop working suddenly, the ageing process continues at the same rate as before so that a battery cell whose capacity had fallen to 80% after 1000 cycles will probably continue working to perhaps 2000 cycles when its effective capacity will have fallen to 60% of its original capacity [15]. Moreover, an alternative measure of the battery life cycle is related to the battery cell internal resistance. In this case the life cycle is defined as the number of cycles the battery can perform before its internal resistance increases by an agreed amount usually 1.3 times or double its initial value when is new [15].
  • Insulation resistance: it is well described in [15]. Also, in [15] the HEV is considered as a “complex production of mechanical-electrical integration”, for which the power supply typically being in the range 100–500 V is obtained by means of several series battery packs. The BMS hardware devices consisting of high voltage components, the traction battery, electrical motor and energy recycle device, the battery charger and its auxiliary device deal with a large current and insulation [15], thus, insulation issues must be under consideration from the design stage. As is stated in [15], the poor working conditions, such as shaking, corrosion, changes in temperature and humidity, “could cause fast aging of the power cable and insulation materials, or even brake the insulation, which would decrease the insulation strength and endanger personnel”. Thus, needs to ensure safety operating conditions for personnel are required to evaluate the insulation conditions for entire HEV’s BMS. The national standard (NS) 18384.3-2001, stipulates several safety requirements for HEVs, especially for insulation resistance state, measurement method, that are shown in [15]. According to NS, the insulation state of an EV is evaluated according to the ground insulation resistance of the DC positive and negative bus. The definition of traction battery insulation resistance in NS “is the relative resistance to maximum leakage current (in the worst condition) where there is a short between the traction battery and ground (electric chassis)”, as is mention in [15]. Thus, to ensure the insulation security of on-board BMS, it is necessary to detect the insulation resistance and raise an alarm in time.

2.2. Li-Ion Battery Terminology

In this subsection, we introduce the same battery terminology from [1] related to BMS specific terms that characterize the Li-Ion battery architecture and its performance.
From an architecture perspective, a battery cell is a complete battery with two terminals current leads, a closed compartment with two electrodes (positive (+) and negative (−)), separator, and electrolyte [1]. For effectiveness purposes, two or more identical battery cells are connected in different combinations (e.g., in series, parallel or in series and parallel), to form a battery module. Moreover, according to the battery specification design, a certain number of modules are connected to form a battery pack that is placed in a single compartment for thermal management. An EV might have more than one battery packs placed in an assigned location of the car. According to the common assessment standards applied in the BMS field, a battery cell is considered fully charged when its terminal voltage reaches the maximum voltage limit value after being charged a small current level. If the battery terminal voltage value is greater than this limit, a dangerous over-charging operating condition takes place. Similarly, a battery cell is considered fully discharged when its terminal voltage reaches the minimum voltage limit value after being drained at small current levels. If the battery terminal voltage value is smaller than this limit, a dangerous over-discharging operating condition affects the battery functionality and its life. The capacity of a battery is one of the most important battery selection parameters that is measured in Ampere-hours (Ah), defined as the total charge that can be discharged from a fully charged battery under specified conditions. The rated Ah capacity is the nominal capacity of a fully charged new battery under the conditions predefined by the catalogue specifications of the battery, e.g., the nominal condition could be defined as room temperature, as is mentioned in [1]. In describing batteries, discharge current is often expressed as a C-rate in order to normalize against battery capacity, which is often very different between batteries. A C-rate is a measure of the rate at which a battery is discharged relative to its maximum capacity. A 1 C rate means that the discharge current will discharge the entire battery in 1 hour. For a battery with a capacity of 100 Ampere-hours, this equates to a discharge current of 100 Amps. A 5 C rate for this battery would be 500 Amps, and a 0.5 C rate would be 50 Amps. The power density of the battery is another important criterion for battery selection that is defined as the peak power per unit volume of a battery (W/l). It is related to the significant impact of battery’s internal resistance on the battery model dynamics, defined as an overall equivalent resistance within the battery, changing its value during the charging and discharging battery cycles, and also may vary as the operating condition changes. In [1], according to the U.S. Advanced Battery Consortium (USABC)’s definition, the peak power is related to an open circuit voltage (OCV) squared value divided to the value of the battery internal resistance R. The maximum power value of the battery is defined at the condition when the terminal voltage reaches 2/3 of its OCV.
The SOC of the battery is an essential internal parameter of BMS that provides an important feedback about the state of health of the battery (SOH) and its safe operation. SOC is defined as battery available capacity expressed as a percentage of its rated capacity, or more precisely, the SOC is the remaining capacity of a battery affected by its operating conditions such as load current and temperature [1,2,3,4,6,10,11,12,13,14,15]:
SOC = Remaining   capacity Rated   capacity
The SOC for a fully charged battery is 100% and for an empty battery is 0%, defined for a discharging cycle, when discharging battery current is positive, as:
SOC ( t ) = 100 ( 1 η C n o m 0 t i ( τ ) d τ )   ( % ) ,   i ( τ ) 0
where η is the coulombic efficiency of the charging (almost 100%) or discharging (around 86% or greater) battery cycle, and C n o m represents the nominal battery capacity.
The relation (2) is also equivalent to the following first order differential equation that will be useful for SOC state estimation in this research paper:
d d t ( SOC ( t ) ) = 100 η × i ( t ) C n o m , i ( t ) 0
The SOC is a critical condition parameter for battery management system (BMS), often affected by its operating conditions such as load current and temperature; consequently, an accurate estimation of SOC is very important, since it is the key issue for the healthy and safe operation of batteries.
Related to SOC, the depth of discharge (DOD) is a SOC derived parameter used to indicate the percentage of the total battery capacity that has been discharged at time t, defined as [1]:
DOD ( t ) = 100 ( 1 SOC ( t ) )   ( % )
In conjunction with DOD and SOC as internal battery parameters, the battery’s state of health (SOH) is defined as the ratio of the maximum charge capacity of an aged battery to the maximum charge capacity when this battery was new. The battery life cycle (LC) is given by the number of discharging–charging cycles that the battery can withstand at a specific DOD (normally 80%) before it fails to meet the desired performance criteria [1]. The actual operating life of the battery is affected by the charging and discharging rates, DOD, and by the temperature. The higher the DOD is the shorter will be the life cycle. To attain a higher life cycle, a larger battery is required to be used for a lower DOD during normal operating conditions.

2.3. Battery Management System: Functions, Hardware and Software Components

The Battery Management System (BMS) is an integrated battery structure consisting of measurement sensors, controllers, serial communication, and computation hardware with software algorithms on-board implemented to assess the maximum charging/discharging cycles current and the duration from the estimation of SOC and SOH of the battery pack. Furthermore, a BMS is an essential interface between the battery and the HEV, very useful to improve the battery performance and to optimize vehicle operation “in a safe and reliable manner”, as is mentioned in [14]. Thus, it is necessary for the HEV automotive industry to develop comprehensive and mature BMSs. The BMS hardware and software components and the safety circuitry incorporated within the battery packs play an important role to monitor and control, to compute and to show continually the safety state, the SOC, SOH, as well as the longevity of the battery.
Related to the battery life, one of the most dangerous situations is the ignition of a Li-Ion battery during overcharging operating conditions, due to the volatility, flammability and entropy changes. Moreover, the repeated over-discharging cycles significantly reduce the battery cell capacity due to irreversible chemical reactions. Consequently, the need to constantly monitor and control the Li-Ion battery internal states and parameters validates once more the integration of BMS inside the EVs architecture. Whenever any abnormal conditions happen, such as self-discharge leakage current through the insulation resistance of the battery, well-known as ground insulation resistances of the negative and positive bus of BMS R n and R p , respectively. In addition, any time when an over-voltage or overheating operating conditions are identified, the BMS should notify the user in a very short time, and also performs the preset correction procedures [14].
Summarizing, a comprehensive and mature BMS must be equipped with the most suitable hardware and software components of the newest generation, integrated in EVs/HEVs structure to achieve the following functions [14]: (1) real time monitoring of battery states by a performing data acquisition system (DAQS) of external signals (i.e., voltage, current, cell temperature etc.); (2) ensure user safety protection, and extend the battery life; (3) the ability to estimate and monitor the battery internal parameters and states (i.e., the internal and insulation battery resistances, polarization voltage, maximum available capacity, SOC, SOH, etc.) sustained by on-board integration of intelligent algorithms (e.g., genetic, fuzzy logic, neural networks and expert systems based on artificial intelligence); (4) the ability to prevent the abnormal operating conditions, such as an over-charge or over-discharge of the battery; (5) the ability to perform fault diagnosis, detection and isolation (FDI); (6)ensure an efficient battery energy utilization, thermal management and SOC cell balancing; (7) delivery of battery status and authentication to a user interface; (8) the ability to communicate with vehicle controller and all other components [14]. In order to achieve these goals, many researchers from BMS’ HEVs/EVs control systems community investigate extensively new battery models, the most suitable SOC estimation techniques, as well as the consistency evaluation and battery cells SOC balancing, such as stated in [14,15].

2.4. Li-Ion Battery SOC Measurement Methods Reported in the Literature

In the absence of a measurement battery SOC sensor we are focused to identify some of direct SOC measurement methods, such as those summarized in [3,7], as follows:

2.4.1. Laboratory Tests and Chemistry Dependent Methods

From this category are mentioned the following three cell modeling methods:
  • A laboratory method for determining SOC consists of completely discharge a cell, recording discharged ampere-hours, to determine its remaining available capacity. This method “is the most accurate SOC measurement technique, but is impractical in HEV as the battery energy is wasted by the test, and the test cannot dynamically estimate SOC”, as is stated in [7].
  • Chemistry-dependent methods for other chemistries, e.g., lead-acid batteries, are all inappropriate since our application is using Li-Ion battery.
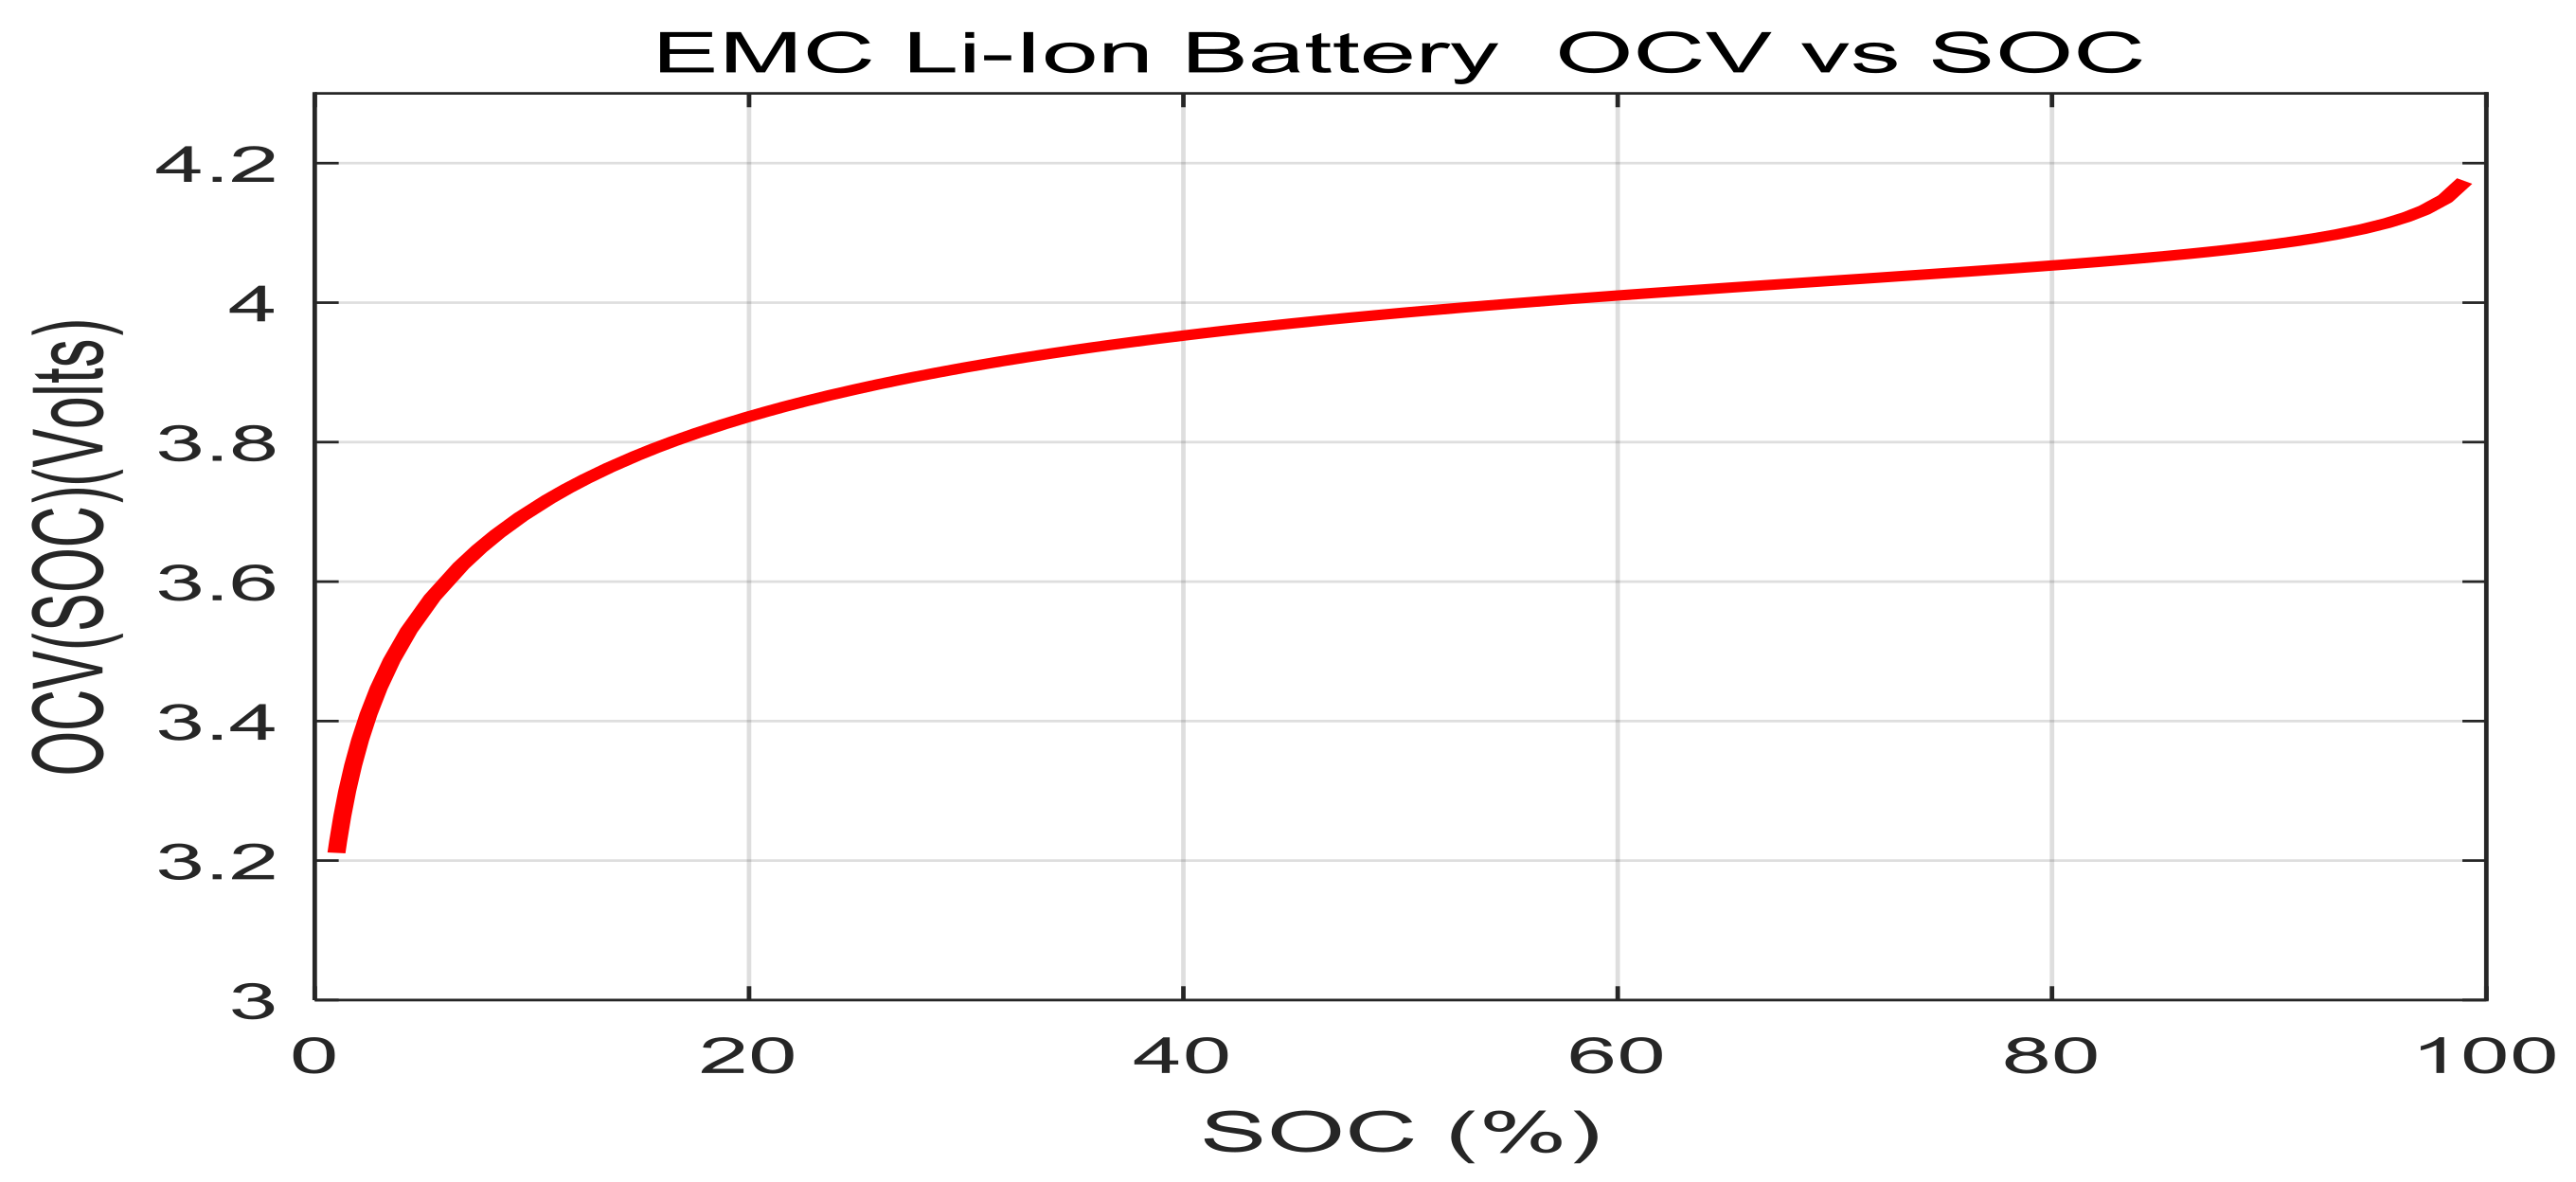
  • Open-circuit voltage (OCV) measurements. “If the battery cell is allowed to rest for a long period, its terminal voltage decays to OCV that may be used to infer SOC via a lookup table” [7]. However, long periods of battery inactivity sometimes hours must occur before the terminal voltage approaches OCV. But, the method may not be used for dynamic SOC estimation due to the fact that “long periods of battery inactivity, sometimes hours, must occur before the terminal voltage approaches OCV”, as is stated in [7], and also “this method includes the dependence of OCV on temperature, and presence of terminal voltage hysteresis, especially at low temperatures” [7].

2.4.2. Electro-Chemical Methods

This approach consists of modeling the cell electrical dynamics at the molecular level, taking into consideration the various processes that occur within the cell. An “accurate terminal voltage prediction may be achieved by these models”, as is stated in [7], but “it would be difficult to measure all the required physical parameters on a cell-by-cell basis in a high-volume consumer product”.

2.4.3. Impedance Spectroscopy

Applying this method measures the cell impedances over a wide range of AC frequencies at different SOCs, and the model parameter values are found applying the well-known least-squares errors (LSE) fitting method to measure the impedance values. Then, the battery SOC “may be indirectly inferred by measuring present cell impedance and correlating them with known impedances at various SOC levels” [7].

2.4.4. Equivalent Electric Circuit Models

In this method, a high-valued capacitor or voltage source is used to represent the battery OCV, connected in series with the internal resistance of the battery, and one, two or three RC parallel polarization cells, such as the second order 2RC EMC battery model proposed in the case study, for which the battery cell dynamics are described in the next Section 2.6. From the OCV estimate, SOC may be inferred via a table lookup. Both linear- and nonlinear circuit models may be used to model the dynamics of the Li-Ion battery cell. The setting parameters values of these equivalent circuit models (i.e., SOC, the internal resistance, and the polarization resistances and capacitances) can be selected for a particular configuration as constant values or they are dependent of temperature (i.e., battery cell SOC) and SOC (resistances and capacitances), respectively, as is shown in [2,7,17,19,20,21].

2.4.5. Coulomb Counting

This method consists of counting the amount of charge that flows in and out of the battery, according to the Equation (2) or (3). The method involves the SOC estimation directly, in open-loop which is prone to current measurement errors, or in closed-loop that can be much more accurate [7]. Similar to voltage measurements, “coulomb counting has intuitive appeal and it is easy to implement (especially with today’s µ-controllers)”, as mentioned in [17]. The value decreases as the battery’s SOH also decreases. If the battery is not fully discharged after being maximally charged, then a proper calculation is difficult and the Coulomb counting method degrades considerable in accuracy. This is one of the main flaws since in the most cases is very rare to fully charge and fully discharge a battery, thus a significant drift in the Coulomb countering method is difficult to avoid [17]. As the signal drifts, the efficacy of coulomb counting decreases. Another drawback of the Coulomb counting method is that it becomes less effective when the battery self-discharges or is subject to temperature changes, but fortunately these losses in precision owing to temperature fluctuations and battery aging are of minor consequence when compared to the significant loss in precision that can accompany a drift in the signal, as is stated in [17]. As for example, a drifting signal can produce a 100% discrepancy between the measured and actual amounts of energy in the battery, compared to other issues that may affect the precision of coulomb counting by less than 1% per month [17]. Furthermore, in [3], it is stated that the Coulomb counting calculation is based on a predefined calibration point that may not always be available, and not all of the current discharged from the battery in Equations (2) and (3) can be taken into account because of losses. These drawbacks can be overcome by having an accurate but expensive sensor, and by having a predefined calibration point. The error in Coulomb counting can be also maintained at a low value by defining a correction factor and defining a re-calibration point. In conclusion, the Coulomb counting method provides a higher accuracy than other SOC calculation methods. It is easy and reliable if the current measurement is accurate and if the re-calibration point is available.

2.4.6. Artificial Neural Networks (ANN)

This method can establish a nonlinear input/output relationship for non-linear complex systems, thus SOC and SOH can readily be obtained with ANNs, as is mentioned in [3]. An ANN consists of two or more layers of neurons (i.e., input-hidden-output neurons) that are interconnected together to form a nonlinear relationship between the network’s input and outputs, thus, it mimics the human brain and needs to be trained based on specific algorithms reported in the literature [3]. However, the ANNs have a limitation since they require a large amount of data to be trained to cover all operating conditions and situations.

2.4.7. Model Based State Estimation Techniques

Any state estimation technique like EKF, UKF, PF, Luenberguer and nonlinear observers, sliding mode observers, fuzzy logic estimation algorithms, can be used to accurately estimate the system’s observable states. In the case of Li-Ion batteries, one of the system’s states is the SOC. The above-mentioned estimation methods require a model of the dynamic system. The SOC model-based estimation accuracy is shown for an EKF real time state estimator applied to different Li-Ion battery models reported in [3,7], also applied in our case study, performs with an estimation error of less than 5%.

2.5. Linear and Nonlinear Analytic Li-Ion Battery Models in State Space Representation Reported in Literature

In this section we briefly review some linear and nonlinear analytic battery models of different chemistries reported in the literature and developed over time for various purposes, such as battery design, performance estimation, prediction for real-time power management, and circuit simulation [19]. In general, the existing battery models can be classified into five categories: electrochemical models, computational intelligence-based models, analytical models, stochastic models, and electrical circuit models, as is mentioned in [19,20].

2.5.1. Electrochemical Models

The electrochemical models or distributed physics-based models are the most accurate models, namely an accurate terminal voltage prediction may be achieved by these models, but they require detailed knowledge of the battery chemical processes, which makes them difficult to be configured [7,20]. These models can capture the electrochemical reactions using partial differential equations (PDE) “that link physical parameters to internal electrochemical dynamics of the battery cell allowing trade off analysis and high accuracy”, as is stated in [3]. A well-known early model with a high accuracy of 2% was originally developed by Doyle, Fuller and Newman [3]. Since these models use PDE with typically numerous unknown parameters, they are “significantly more complicated and computationally expensive than others, making their use in real-time applications for BMS almost impractical” [3].

2.5.2. Computational Intelligence Based Models

The computational intelligence-based models describe the nonlinear relationships between SOC, battery terminal voltage, input current, and battery internal temperature. The artificial neural networks (ANN) based models support vector regression models, and mixed models have been used to estimate the battery nonlinear behaviors; also, a recurrent neural network (RNN) has been used to build an SOC observer estimator and battery terminal voltage estimator, as is mentioned in [19].

2.5.3. Analytical Models

The analytical models are simplified electrochemical models, namely the Pucker’s law, kinetic battery model and diffusion model, as are described in [19], that can capture nonlinear capacity effects and predict runtime of the batteries with reduced order of equations. These models perform well for SOC tracking and runtime prediction under specific discharge profiles [19].

2.5.4. Stochastic Models

The stochastic models focus on modeling the recovery effect and describes battery behavior as a Markov process with probabilities in terms of parameters that are related to the physical characteristics of an electrochemical cell [19]. The stochastic battery model mentioned in [19] gives a good qualitative description for the behavior of a Li-Ion battery under pulsed discharge, for which the recovery effect is modeled as a decreasing exponential function of the SOC and discharge capacity.

2.5.5. Electric Circuit Models

The simplest linear Li-Ion polymer (LiPb) battery model is implemented in [6], p. 259 to implement the EKF algorithm to estimate the battery SOC using an electric circuit consisting of a parallel RC cell connected in series with the battery internal resistance. In [7] are presented for same LiPB battery other electric circuit models, typically consisting of a high-valued capacitor or voltage source used to represent the OCV, in series with the cell’s internal resistance and additional more dynamic effects such as terminal voltage relaxation. Furthermore, from the OCV estimate, SOC may be inferred via table lookup [7]. Both linear and nonlinear circuit models may be used to implement the battery dynamics. The following battery models are proposed in [7], pp. 266–274:
  • model only with SOC as state: is the simplest model capable to estimate the battery terminal voltage in a limited way, but was improved later by adding to the model multiple states
  • a combined model that has SOC as a state and predicts the terminal battery voltage as a combination of three nonlinear models, separately or all together, the second one being adopted in our case study [3,7]:
    Shepherd model:
    y ( k ) = E 0 R i ( k ) K 1 SOC ( k )
    Unnewehr universal model:
    y ( k ) = E 0 R i ( k ) K 2 SOC ( k )
    Nernst model:
    y ( k ) = E 0 R i ( k ) + K 3 ln ( SOC ( k ) ) + K 4 ln ( | 1 SOC ( k ) | )
where SOC(k) denotes the battery state in discrete time ( T s is the sampling time), representing the discrete time equivalent of SOC(t) described by a first order differential equation given by (3):
SOC ( k + 1 ) = SOC ( k ) η T s C n o m i ( k )
In all these models, y ( k ) is the discrete time cell terminal voltage, E 0 is a constant voltage source, R is the cell internal resistance with a slight difference between its values for charging (input battery current i ( k ) < 0) and discharging cycles ( i ( k ) > 0), as well as at different SOC levels if desired, K 1 is the polarization resistance and K 2 , K 3 , K 4 are constants chosen to make the model fit the data well. A “combined model” that performs better than any of the individual models alone, especially the Shepherd model (criticized in the literature for algebraic loops issues that may lead to an unstable computation algorithm), is proposed in [3,7] that is adopted later in this section with additional states for our case study:
SOC ( k + 1 ) = SOC ( k ) η T s C n o m i ( k ) y ( k ) = E 0 R i ( k ) + K 1 1 SOC ( k ) K 2 SOC ( k ) + K 3 ln ( SOC ( k ) ) + K 4 ln ( | 1 SOC ( k ) | )
and the OCV(k) as function of SOC(k) is given by:
OCV ( k ) = E 0 K 2 SOC ( k ) + K 1 1 SOC ( k ) + K 3 ln ( SOC ( k ) ) + K 4 ln ( | 1 SOC ( k ) | )
that is similar to those used in our model, replacing E 0 in (10) by a constant K 0 .
The unknown quantities in the combined model may be estimated using a system identification procedure. This model has the advantage of being “linear in the parameters” [7], i.e., the unknowns occur linearly in the output equation. Using a set of N cell input–output three-tuples ( y ( k ) , i ( k ) , SOC ( k ) ) all these parameters may be solved for in closed form using a result from least-squares estimation (LSE), as is suggested in [7].
  • The zero-state hysteresis model, conceived to compensate partially the hysteresis effect, one of the main drawback of a simple model. The cell voltage lags the predicted voltage in some sense [7]; more precisely, it may also be defined as a characteristic of a system in which a change in the direction of the independent variable leads to the dependent variable failing to retrace the path it passed in the forward direction [7]. This model adds no additional states for hysteresis, so it is named the “zero-state hysteresis model”.
  • The one-state hysteresis model is an improvement over the simple model where the slow transition in the level of the hysteresis from charging and discharging cycles may be modeled by adding a “hysteresis state”.
  • The enhanced self-correcting (ESC) model is conceived to model the “relaxation effect”, implemented as a low-pass filter on input current i ( k ) , since the cell model must accurately predict its behavior in a dynamic HEV environment [7].
  • Adding temperature dependence to the model, as is done briefly in [7] that shows how to incorporate temperature dependence into the models. According to [7] a very simple method, can use a table of different models, where each model had parameters optimized for a specific temperature. The second method used in [7] performs a joint optimization over the entire temperature range, where every parameter is represented by a continuous fourth order polynomial of temperature to force nearby models to have similar parameter values. The cell data were collected from UDDS tests can be provided by ADVISOR MATLAB platform described in Section 2.7, and the optimization method performed at 16 controlled temperatures from −30 to 45 °C, in increments of 5 °C. This second method did not result in modeling errors as low as when individually optimized; the generalization performance was much better [7].

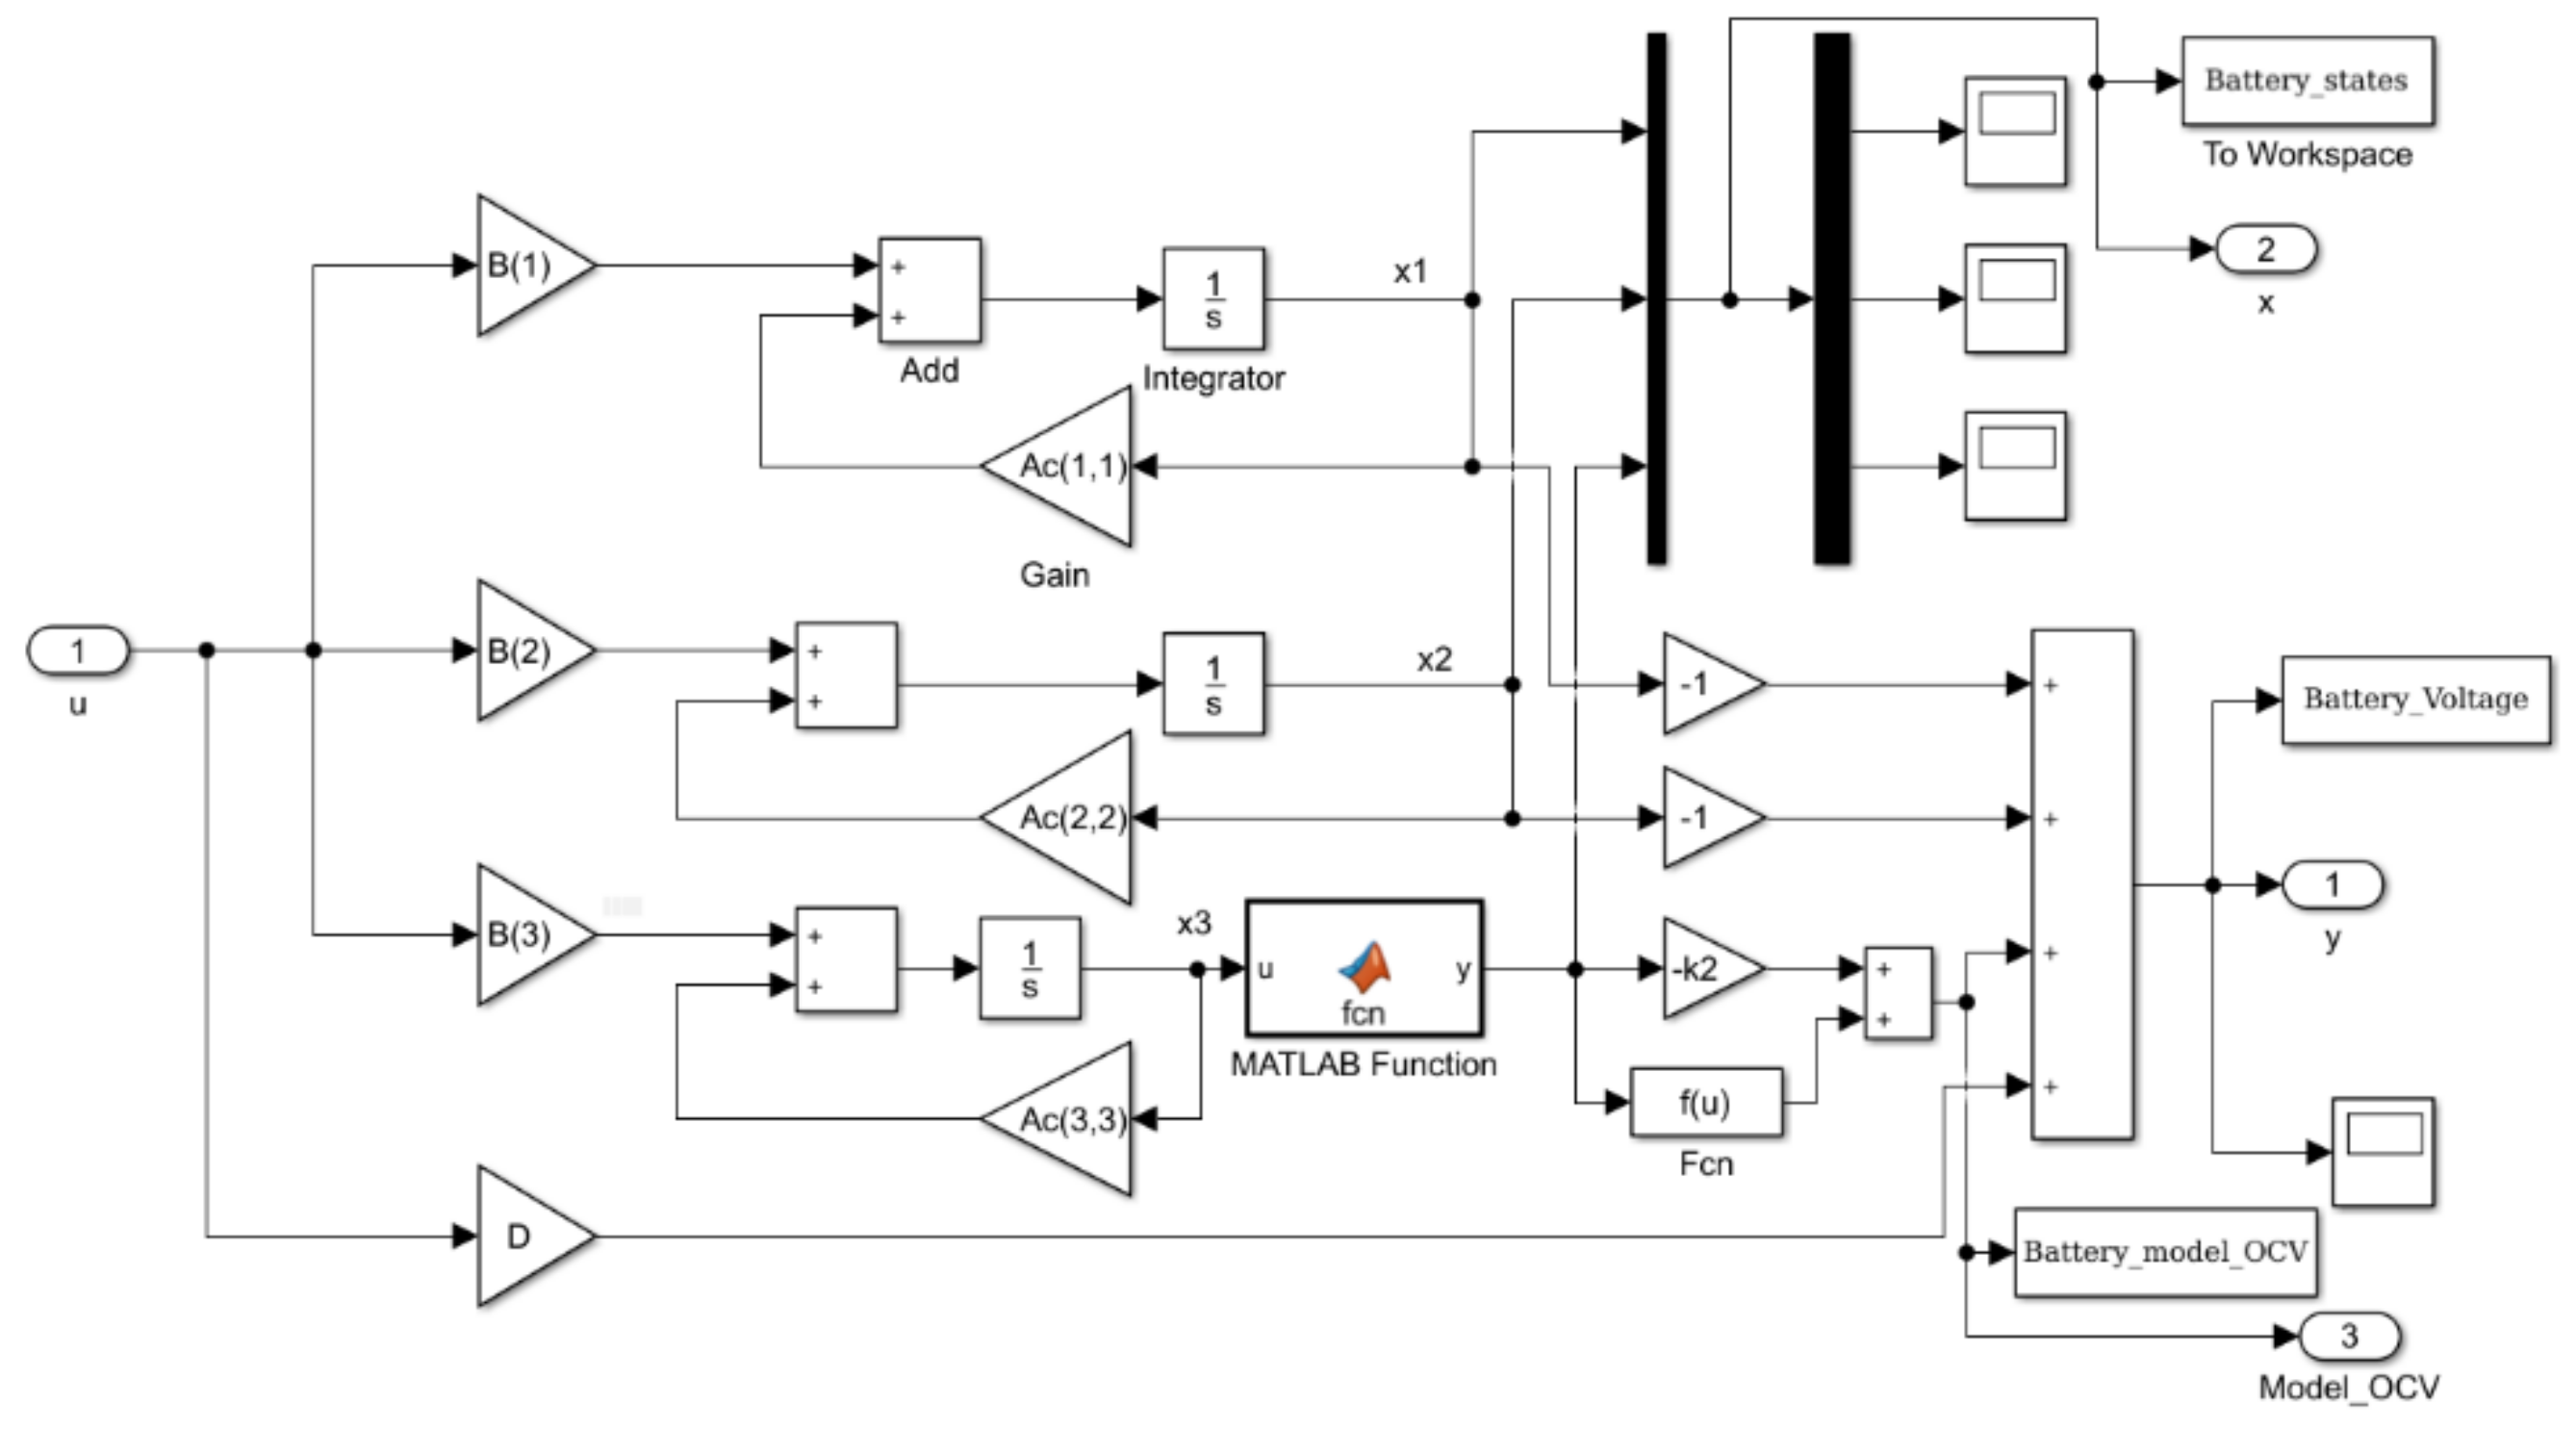
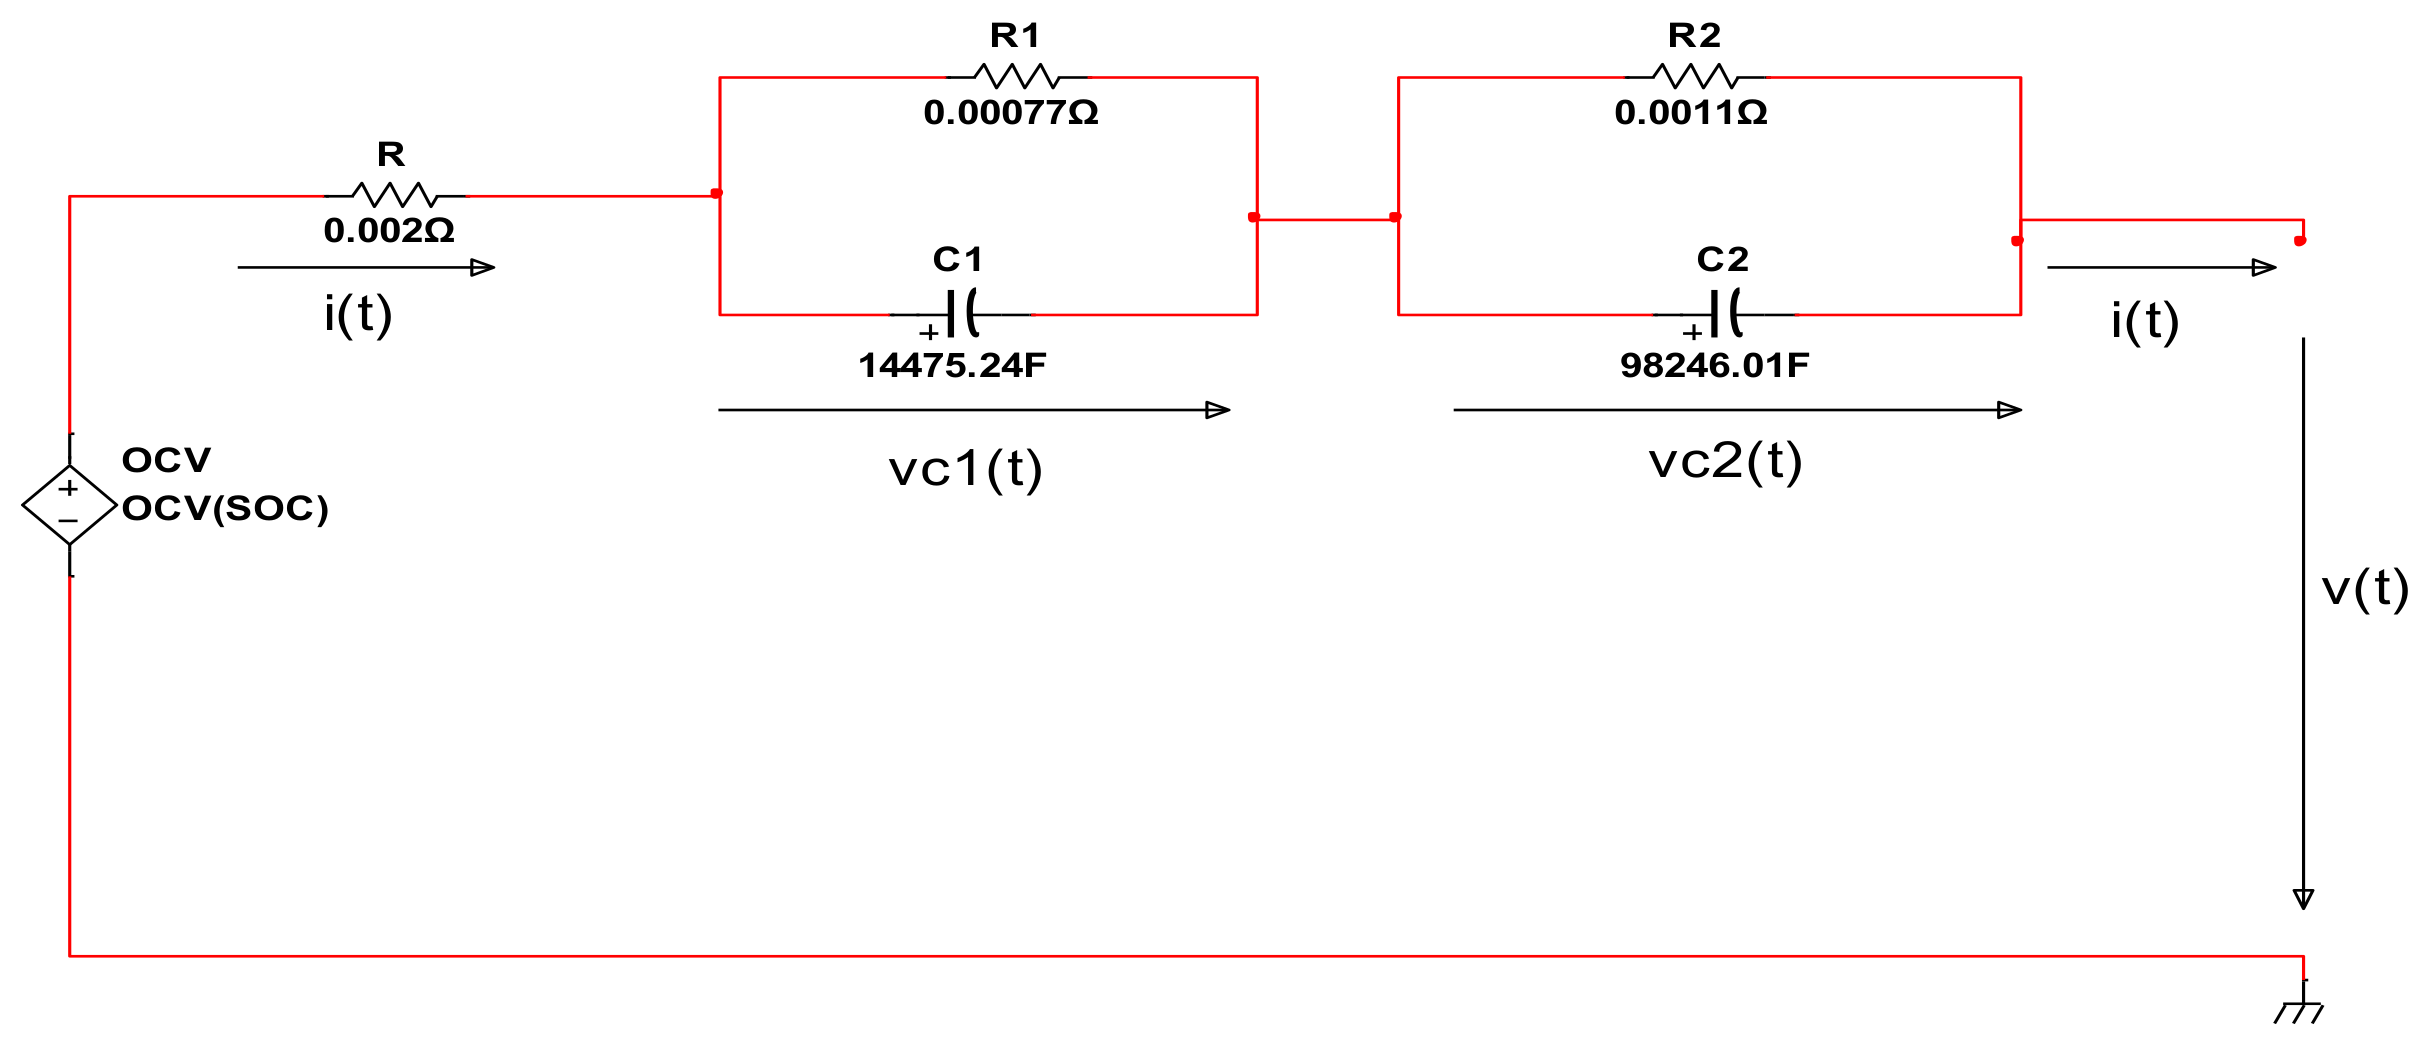
2.6. Li-Ion Battery Equivalent Model Circuit in State Space Representation

2.6.1. Continuous Time State Space Representation

First, we need to precise that in our case study application is modelled only the cell dynamics for the purpose of SOC estimation in an HEV battery pack. The equivalent electric circuit model of the proposed Li-Ion battery shown in Figure 1 is easy to be implemented in a state space representation by a set of three first order differential equations, based on the direct application of the voltage Kirchhoff’s law to a single mesh of the electric circuit, and by assigning the states, one for each memory RC cell, and the third one to the state-of-charge of the battery defined in Equation (4). The state-space equivalent model is combined with the output-states-input equation suggested in [2,3,4,7,10,11,12,13,14,15] to provide the Li-Ion battery terminal voltage, such that the whole model has the ability to capture the entire dynamics of the battery and easy to be implemented in real time, and lastly is useful as a support to build the proposed state estimation algorithms:
d x 1 d t = 1 T 1 x 1 + 1 C 1 u d x 2 d t = 1 T 2 x 2 + 1 C 2 u d x 3 d t = η C n o m u y = OCV ( x 3 ) x 1 x 2 R u
where x 1 = v C 1 ( t ) , x 2 = v C 2 ( t ) , and x 3 = SOC ( t ) represent the states attached to each RC polarization voltage cell, and the state-of-charge of the battery respectively, u = i ( t ) denotes the input DC instantaneous current that flows through battery, and y = v ( t ) designates the battery output DC instantaneous voltage. Also, T 1 = R 1 C 1 [ s ] , T 2 = R 2 C 2 [ s ] represent the time constants of the polarization RC cells, and the OCV (t) is similar to (10) adapted to the state-space representation, given by:
OCV ( x 3 ( t ) ) = h ( x 3 ( t ) ) = K 0 K 1 1 x 3 ( t ) K 2 x 3 ( t ) + K 3 ln ( x 3 ( t ) ) + K 4 ln ( | 1 x 3 ( t ) | )
For simulation purpose and adopting a “proof-algorithm concept” approach to validate the proposed combined Li-Ion battery model, and also to prove the effectiveness in real time implementation MATLAB environment of both SOC estimators developed in the next section, the nominal values for Li-Ion battery EMC parameters and OCV(t) coefficients are set to the same values that are carefully chosen for model validation in [3] and shown in Table 1.
In Equation (12) the OCV(t) is a nonlinear function of SOC(t), i.e., of state x 3 , similar as in [3,6,7,10], increasing considerable the accuracy of the Li-Ion battery EMC combined model, and proving that is amongst the most accurate formulations seen in literature from EVs/HVs field.
The nominal values of OCV(t) parameters ( K 0 , K 1 , K 2 , K 3 , K 4 ) are chosen to fit the model to the manufacture’s data by using a least squares curve fitting estimation method, as is suggested in [3,6,7], where the OCV curve is assumed to be the average of the charge and discharge curves taken at low direct currents (dc) rates from fully charged to fully discharged battery that minimize considerable the Li-Ion battery cell dynamics.

2.6.2. Discrete Time State-Space Representation

An equivalent compact discrete-time equation in matrix form, as an alternative to the continuous time description (11), is given by:
x ( k + 1 ) = A x ( k ) + B u ( k ) y ( k ) = C x ( k ) + D u ( k ) + Ψ ( x 3 ( k ) ) x ( k ) = [ x 1 ( k ) x 2 ( k ) x 3 ( k ) ] T , A = [ 1 T s T 1 0 0 0 1 T s T 2 0 0 0 1 ] , B = [ T s C 1 T s C 2 η T s C n o m ] , C = [ 1 1 K 2 ] , D = R
Ψ ( x 3 ( k ) ) = K 0 K 1 1 x 3 ( k ) + K 3 ln ( x 3 ( k ) ) + K 4 ln ( | 1 x 3 ( k ) | )
where T s is the sampling time, t = k T s , k Z , x ( k ) = x ( k T s ) , y ( k ) = y ( k T s ) , u ( k ) = u ( k T s ) .
The nonlinear function Ψ ( x 3 ( k ) ) is linearized in the next Section 3.1 around an operating point to develop the first proposed real-time SOC estimator in EKF version, well documented in [2,6,7]. To analyze the behavior of the proposed Li-Ion battery EMC combined model for different driving conditions such as urban, suburban and highway, two different charging and discharging current profiles tests are introduced in Section 2.7.

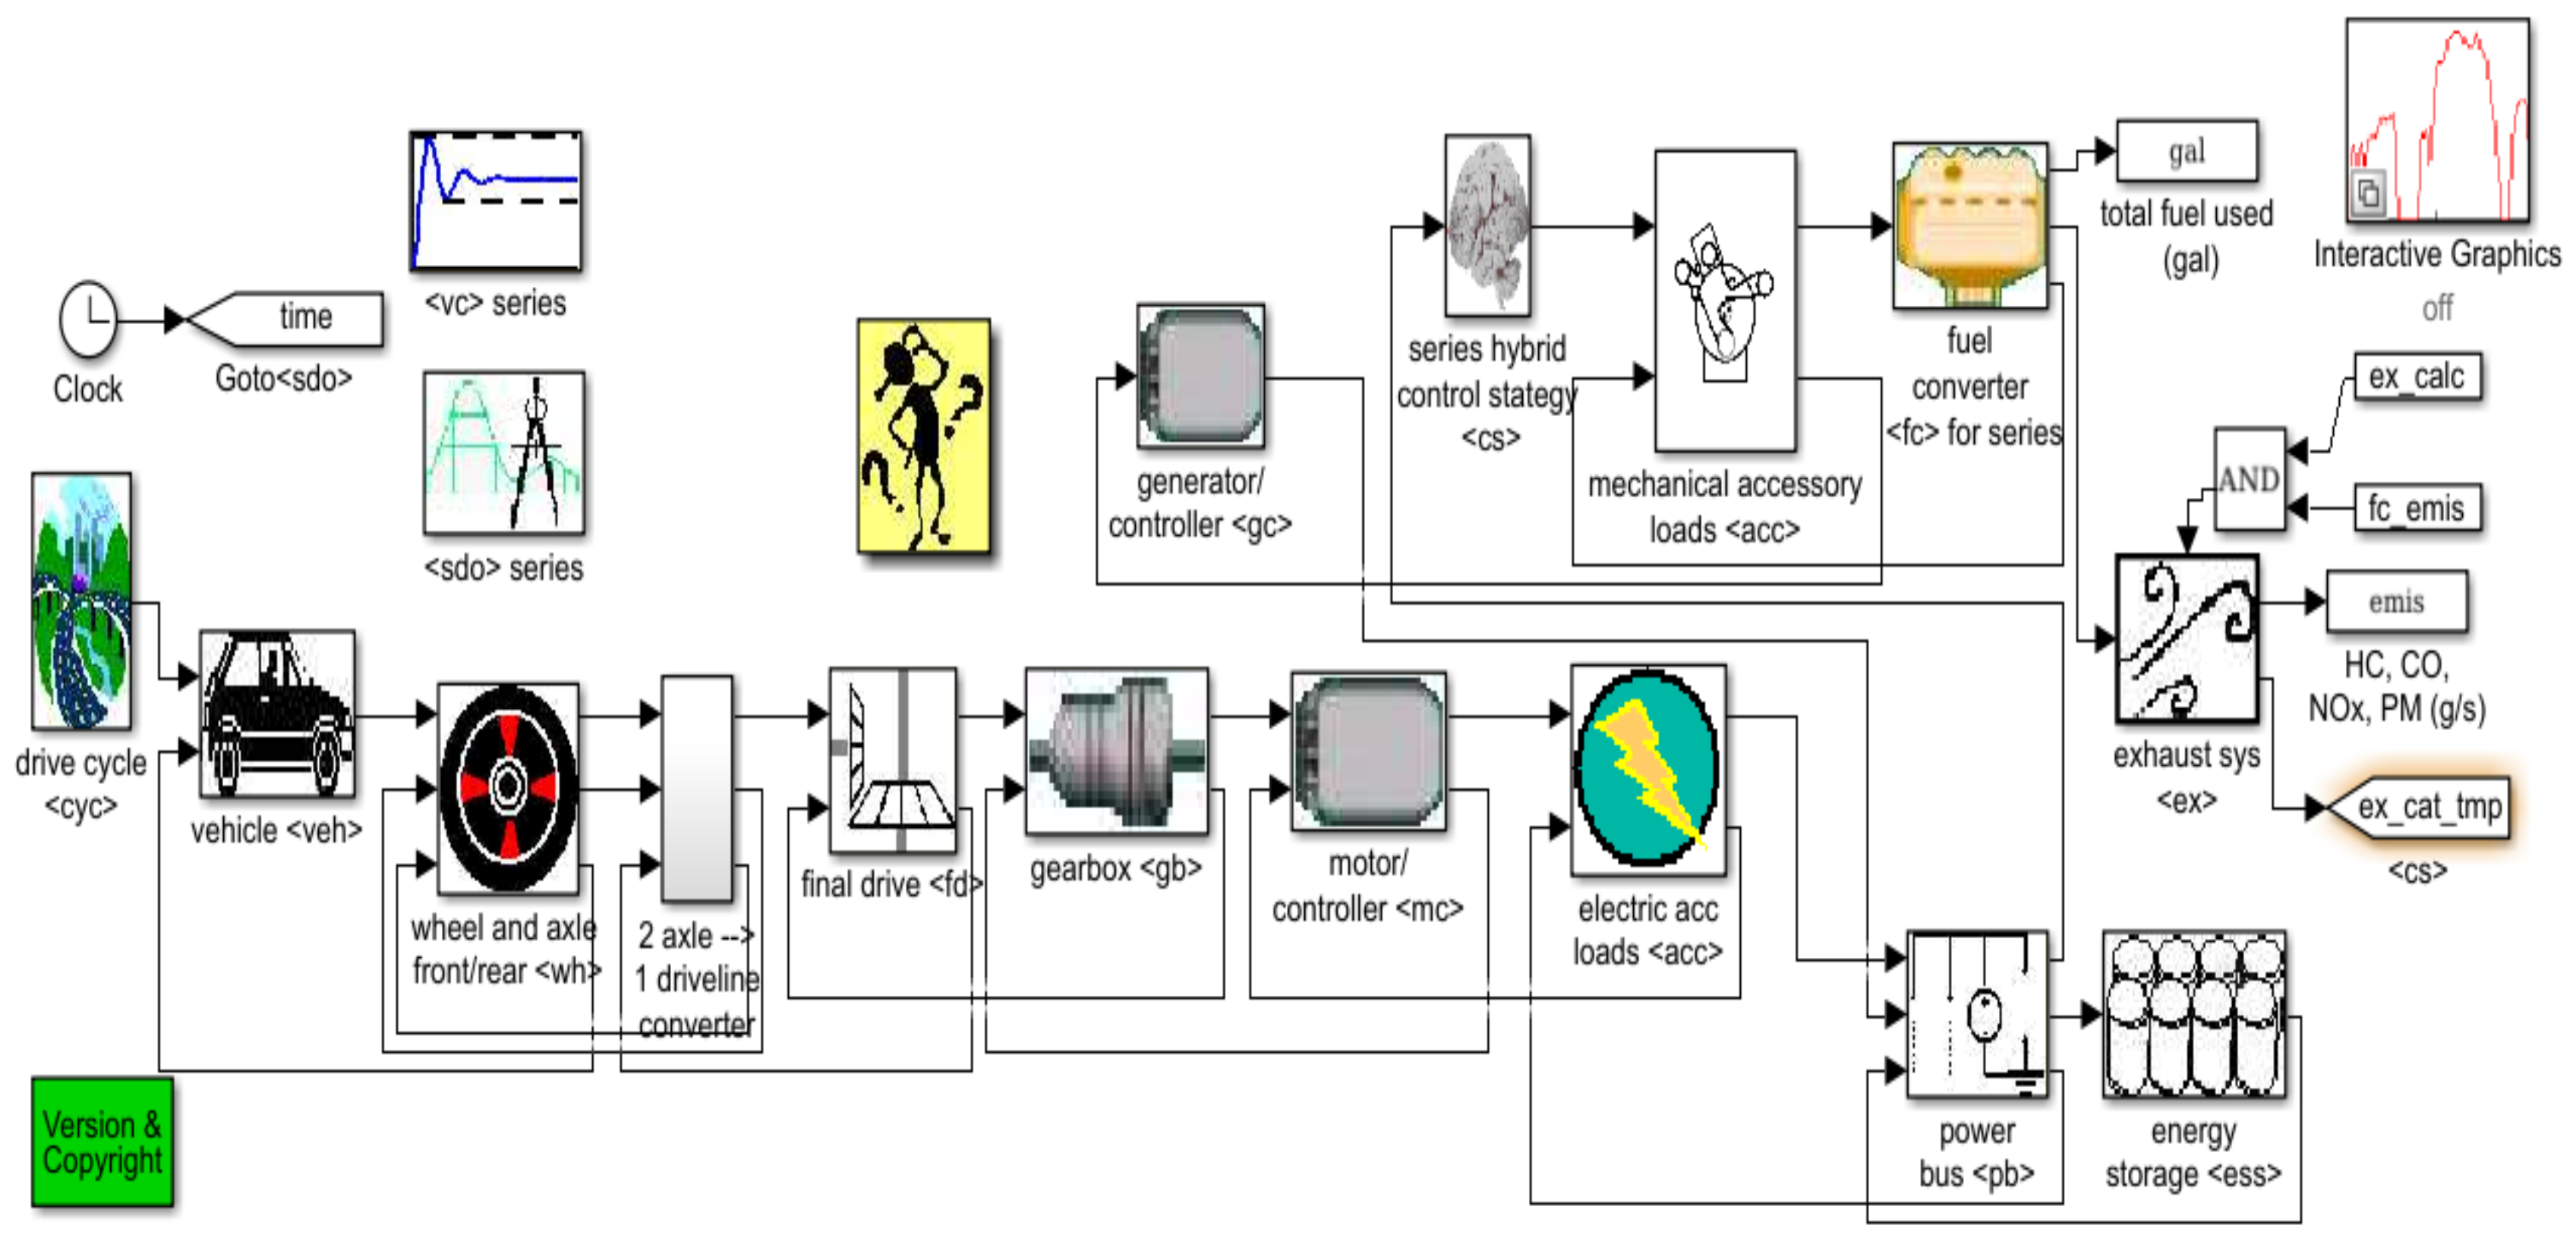
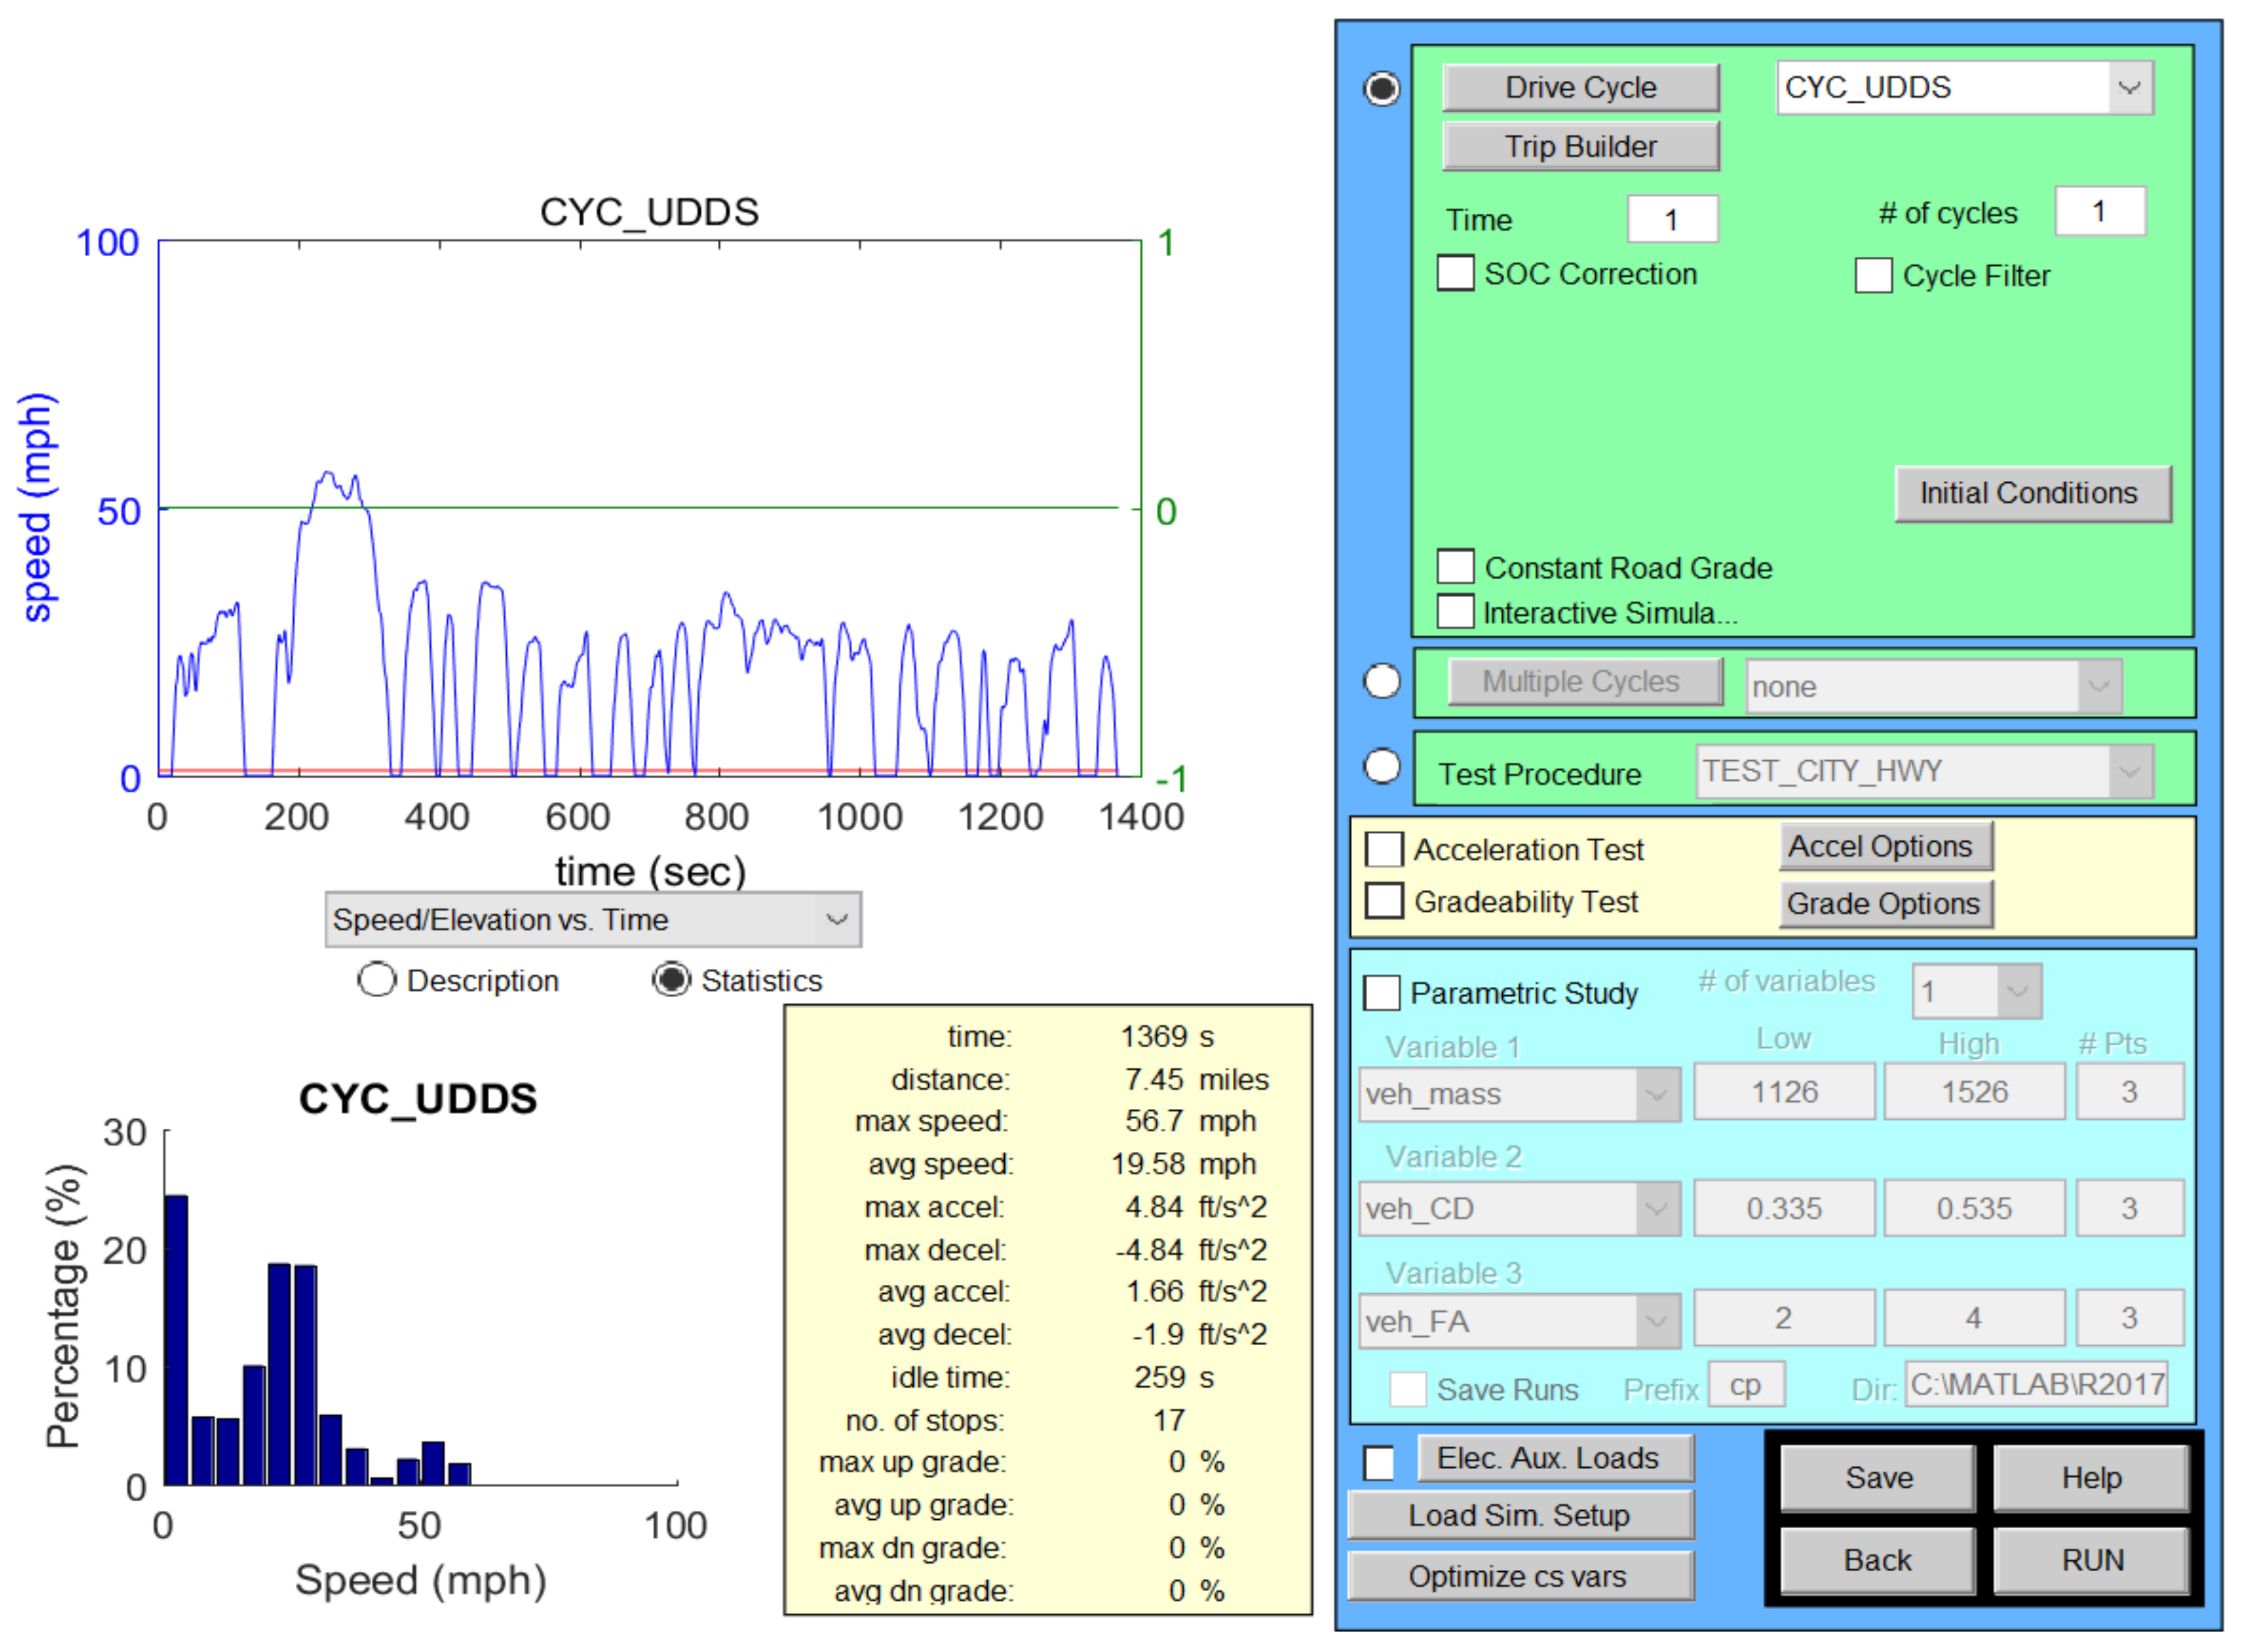
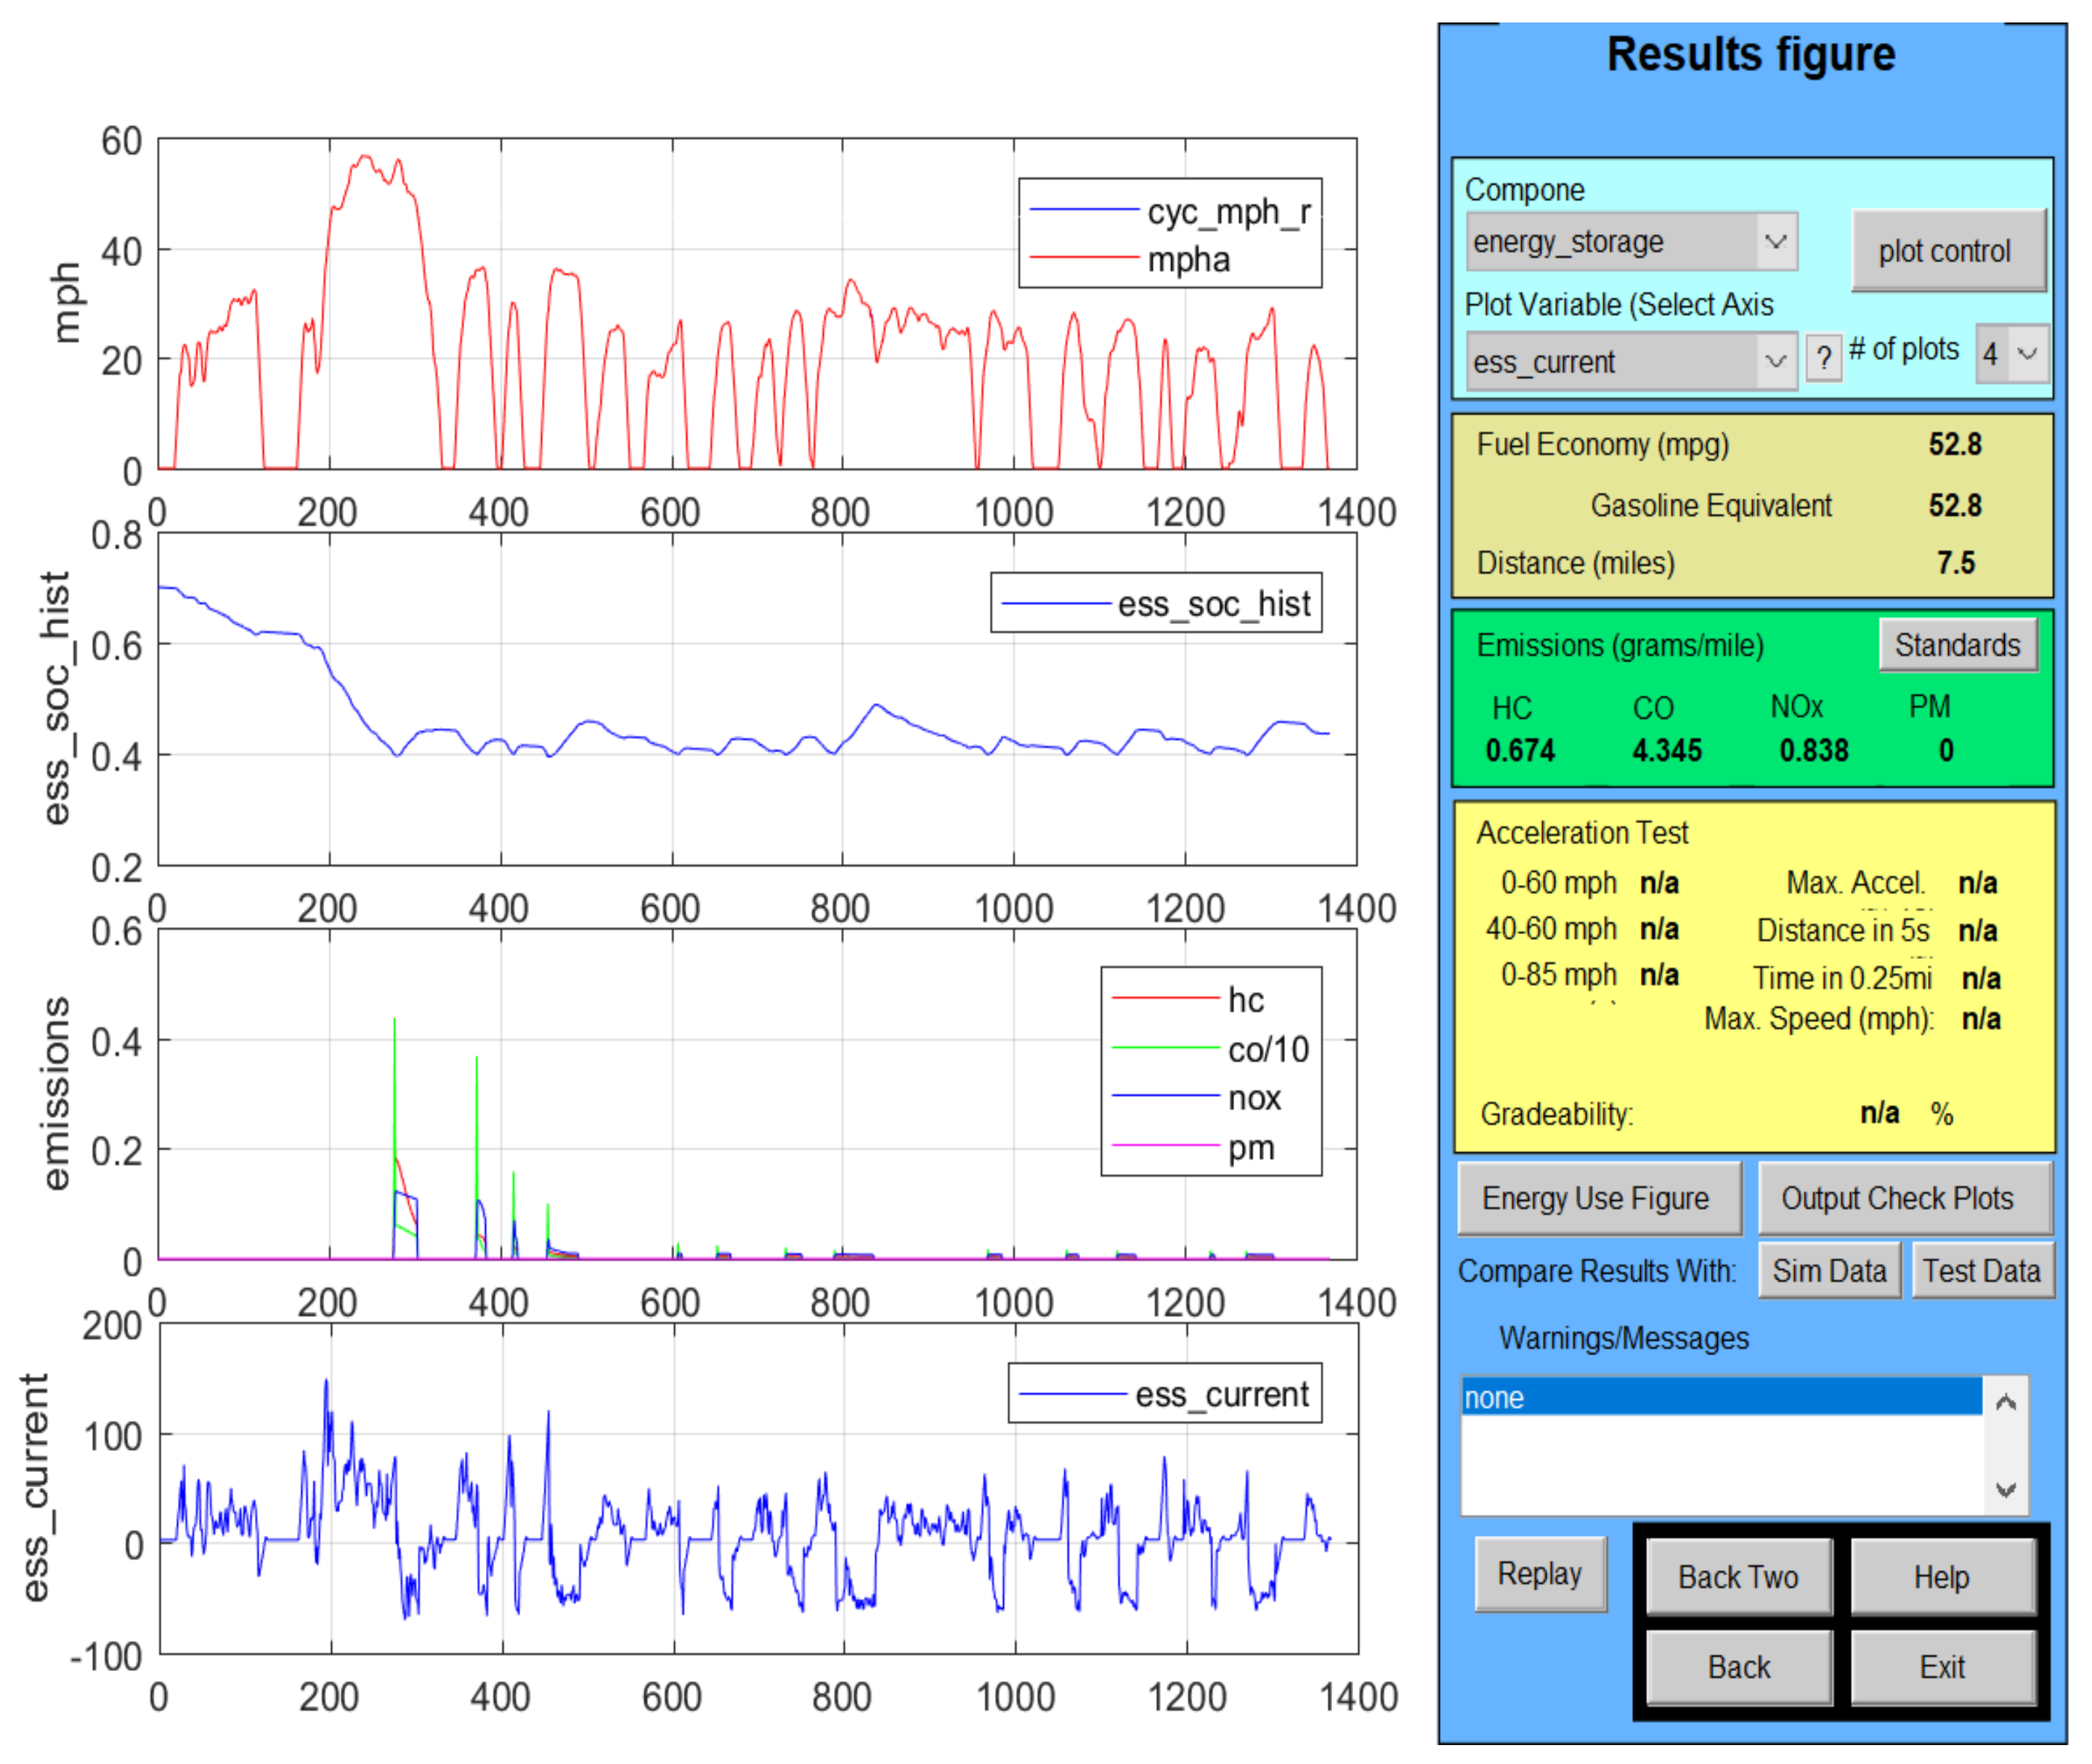
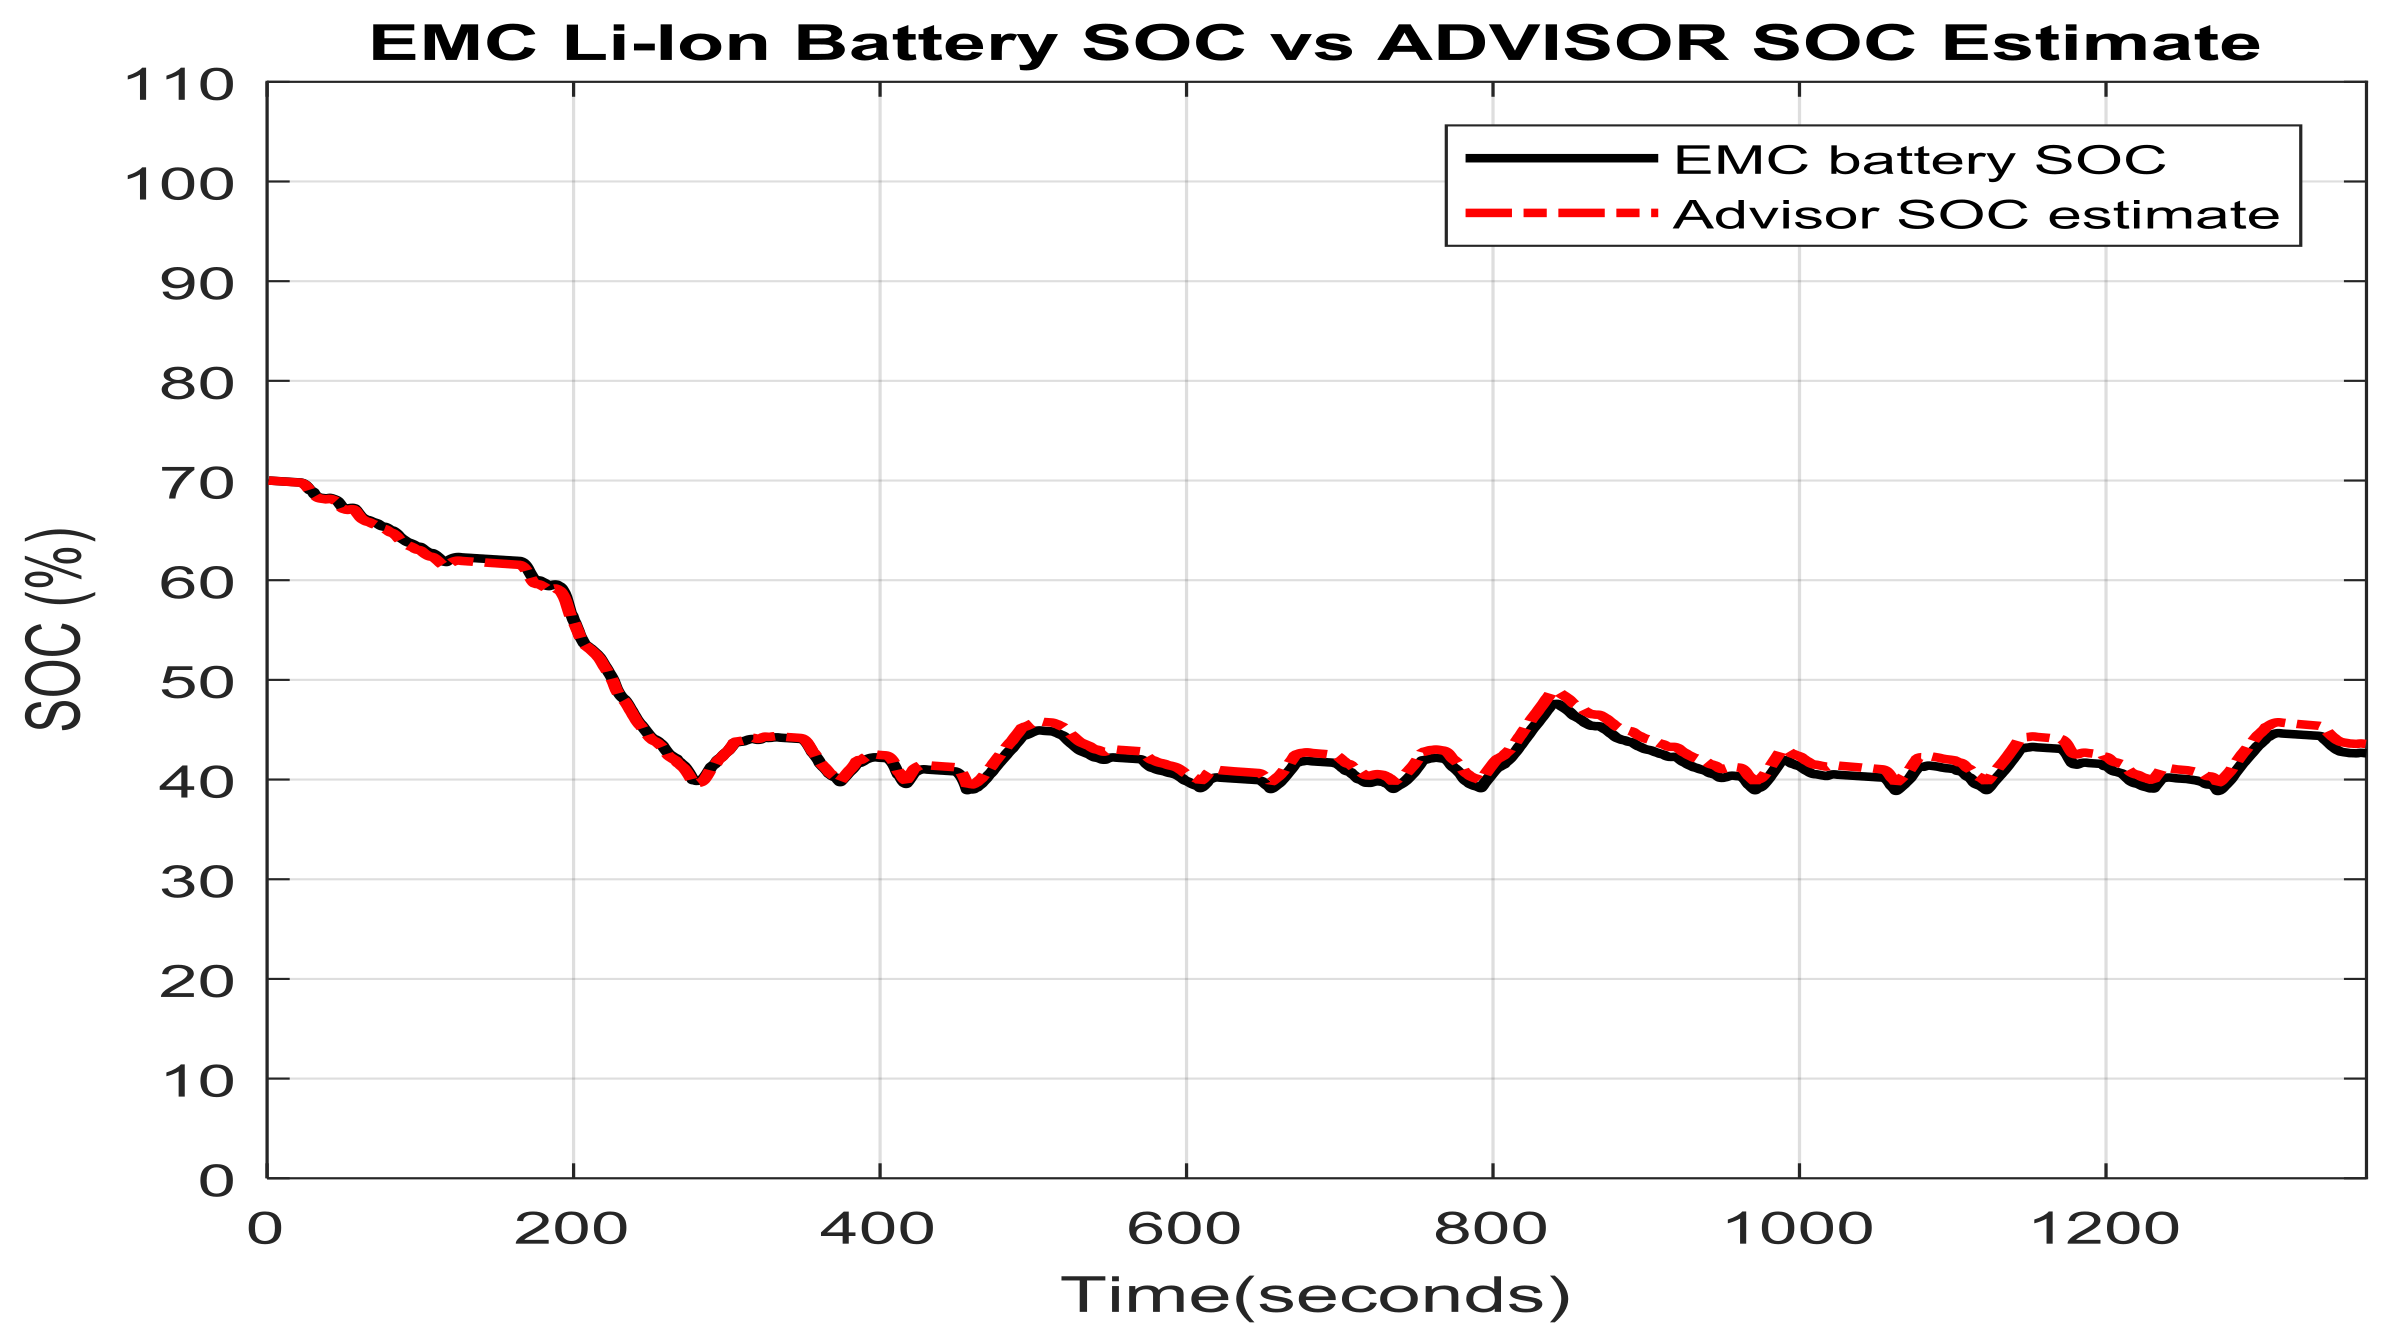
2.7. Li-Ion Battery Equivalent Circuit Model Validation in ADVISOR MATLAB Platform, a Case Study

To provide a diversity of current profiles to cover almost all realistic driving conditions required in Li-Ion HEV’s battery simulations, and also for model validation purpose, an ADVISOR MATLAB platform is introduced in this section. It is very common in automotive industry, especially in all HEVs design as is suggested in [2,3,4,13]. This simulator was created in November 1994 by US National Renewable Energy Laboratory (NREL), and after it was continually improved until the most recent version 2003-00, with a new release r0116 in April 24th 2013, as is mentioned also in [13]. ADVISOR MATLAB platform allows system-level analysis and trade-off studies of advanced vehicles [16]. The NREL’s ADVISOR predicts battery and vehicle performance for conventional (e.g., non-electrified vehicles on the road today), hybrid, electric, and fuel cell vehicles as they vary with drive cycle [13]. In order to cover the majority of cases met in real life, ADVISOR’s battery models must be robust and accurately for different battery chemistries including lithium ion, nickel-metal hydride, and lead acid. Also, they must have the ability to predict the battery’s voltage, current, temperature and SOC, interfacing well with MATLAB/Simulink platform. The following battery models available in ADVISOR MATLAB platform are reported:
  • an internal resistance model (Rint)
  • a resistance–capacitance model (RC)
  • a partnership for a new generation of vehicles (PNGV) capacitance model (PNGV model)
  • a neural network (nnet) lead acid model (PbA nnet)
  • a fundamental lead acid battery model (PbA fund)
The Li-Ion battery selected model is validated by comparing the results of the tests in terms of SOC estimates using a NREL’ Li-Ion battery with an internal resistance (Rint) model integrated in ADVISOR MATLAB platform, as is shown in [10,12,13,16]. The proposed Li-Ion battery EMC model of 6Ah capacity and nominal voltage of 3.6 V, manufactured by the company SAFT America, is matching with high accuracy the NREL’ Li-Ion battery model in terms of SOC estimation, as can be seen in our preliminary results disseminated in [10]. Also, for simulation purpose and comparison of the experimental tests results, the 2RC EMC Li-Ion battery model shown in Figure 1 is incorporated in a BMS’ HEV and its SOC performance is compared to those obtained by a Rint Lithium battery model integrated in a particular structure of a hypothetical small car SMcar with the following characteristics: (1) manual 5 speeds transmission; (2) powertrain drive series transmission; (3) 700-W constant electric load; (4) MC-AC75 Westinghouse 75-kW (continuous) AC induction motor/inverter. This small town car is selected as an input vehicle in ADVISOR MATLAB platform under standard initial conditions, modeled in Simulink in Figure 2, according to an ADVISOR page setup shown in Figure 3. Amongst different driving speed cycles for a large collection of cars provided by the ADVISOR US Environmental Protection Agency (EPA) we use in our case study the Urban Dynamometer Driving Schedule (UDDS) speed profile, as is shown in Figure 4 and Figure 5. The driving UDDS cycle profiles for car speed (mph) and for corresponding Lithium battery discharging current [A] are represented separately in the same ADVISOR MATLAB platform, as is shown in the first and the fourth corresponding graphs from Figure 5.
More precisely, in Figure 5 are shown the performance results obtained in MATLAB environment for a driving city highway test split in two phases, namely a standard federal test procedure cycle at 75 F (FTP-75) for exhaust car emissions, followed by the highway fuel economy test (HWFET) cycle for a particular car selection.
The FTP-75 driving cycle uses an UDDS cycle of total length of 2457 s with three separate phases:
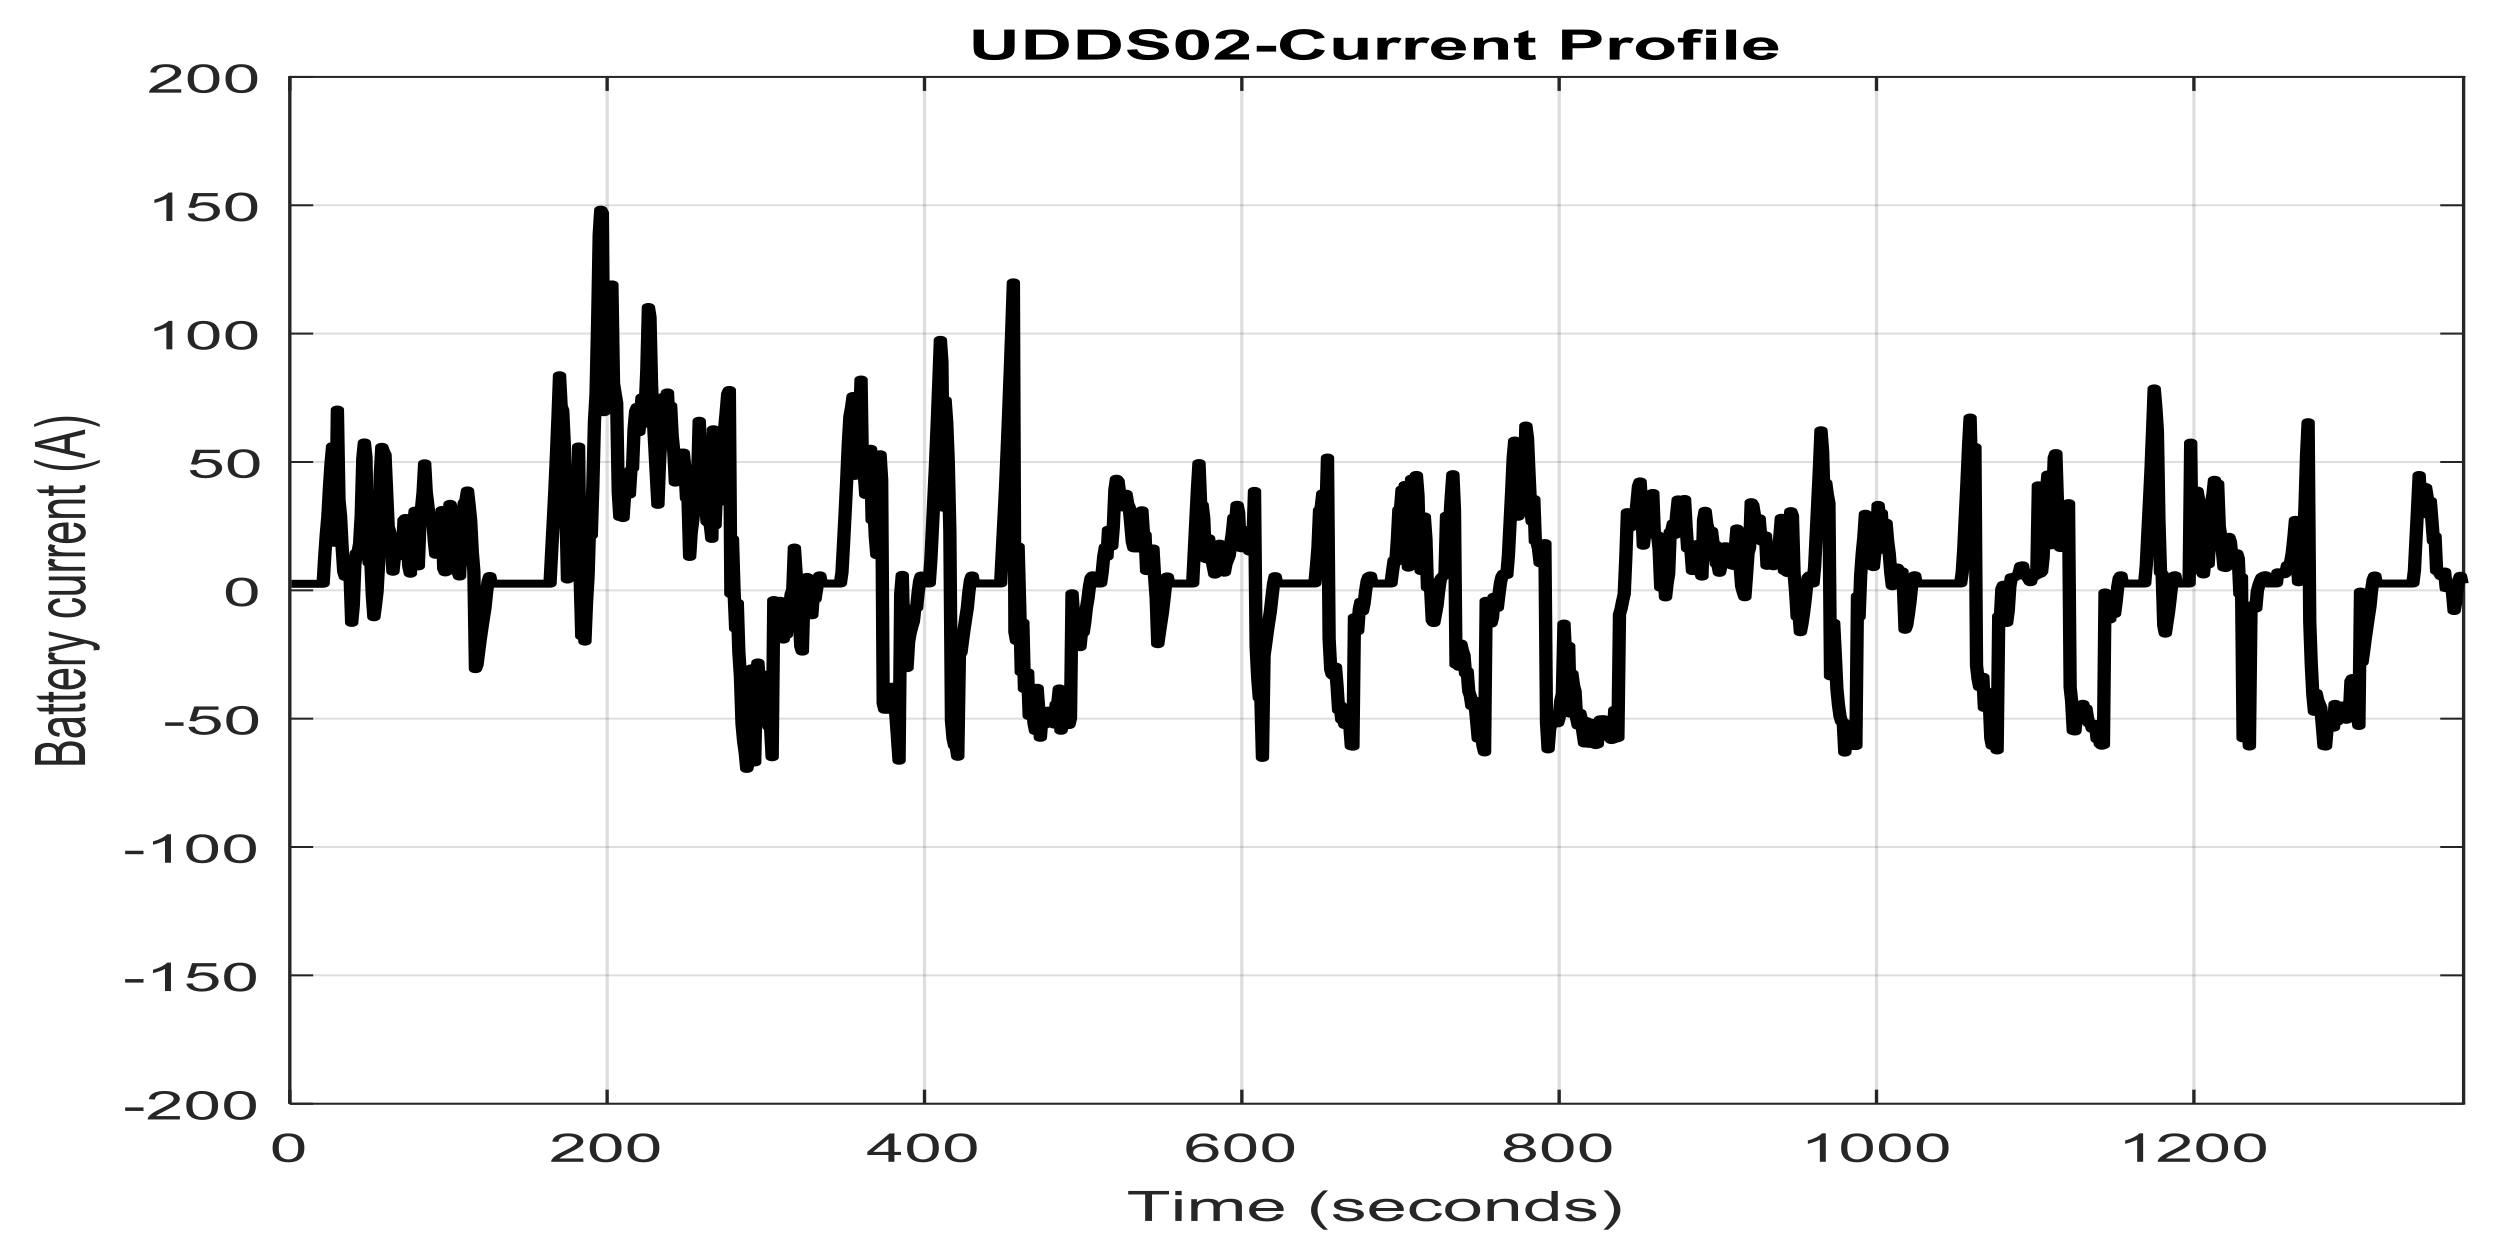
  • a cold-start phase (505 s) known as bag 1
  • a hot-transient (870 s) known as bag 2
  • a hot-start (505 s) known as bag 3
The driven distance is approximately 11 miles. The HWFET driving cycle is used to simulate the highway driving and estimate typical highway fuel economy. The official test consists of warm-up followed by a test phase. The driver follows the same traces in warm-up and test phases In ADVISOR the warm-up phase is replaced by a starting the vehicle with hot initial conditions. A top speed of 59.9 mph is reached with an average speed of 47.6 mph.
The validation of the proposed 2RC EMC Li-Ion battery model by extensive experimental tests performed on ADVISOR MATLAB platform is an essential battery model design step to establish its credibility. In Figure 6 are shown in the same graph the SOC curves corresponding to the proposed EMC Li-Ion battery model (blue color) and ADVISOR MATLAB platform estimate (red color). The SOC simulations performed for the same initial conditions (SOCini = 70%) reveal a high accuracy of the proposed Li-Ion battery EMC model compared to ADVISOR NREL Rint model. This important result validates without doubt the proposed EMC model and is encouraging to be used as a model support for building robust, accurate and reliable real-time SOC estimators, as those developed in the next Section 3. In Figure 7 is shown the 2RC EMC Li-Ion battery terminal voltage to a discharging UDDS current profile during the FTP-75 test.
In the United States, the “FTP-75” is a transient test cycle used for emission certification testing of cars and light duty trucks. The optional Standard Air Conditioning “SC03” Supplemental Federal Test Procedure (SFTP) has been introduced to represent the engine load and emissions associated with the use of air conditioning units in vehicles certified over the FTP-75 test cycle. The total simulated length is 1370 s for a single cycle, but in ADVISOR simulator has the facility to increase the length by a certain number of the cycles. EPA fuel economy (FE) calculation methods use test results from individual phases of certain drive cycles which are not required to have battery charge balance on HEVs, as is mentioned in [17]. In Figure 8 is shown the Li-Ion battery OCV (top) and its corresponding SOC (bottom) during a constant 1 C discharging rate, i.e., according to its definition in Section 2.2, for our case study of a battery of 6 Ampere-hours nominal capacity is equivalent to a 6 A discharging current flow inside the battery during a complete cycle of 3500 s length.
In Figure 9 is shown the UDDS cycle discharging current profile used in FTP-75 test.
The Li-Ion battery 2RC EMC model simulations are performed in SIMULINK simulation environment using a continuous time 2RC EMC Li-Ion battery SIMULINK model, as is shown in Figure 10. The battery SIMULINK model is used as support for building in next Section 3.2 the second proposed real time SOC estimator under PI Observer version.
The detailed SIMULINK 2RC EMC Li-Ion battery model block diagram is shown in Figure 11.
The Li-Ion battery 2RC EMC OCV as a function of SOC for an UDDS cycle charging current profile test is shown in Figure 12. The Li-Ion battery 2RC EMC SOC versus ADVISOR estimate on MATLAB/SIMULINK platform are shown on the same graph in Figure 13.
The simulation results obtained for the same initial conditions, i.e., SOCini = 70%, and for an input UDDS cycle charging current profile test are shown in Figure 13 that reveal a high accuracy, a good convergence, and thus validate again without doubts the proposed 2RC EMC Li-Ion battery. The terminal voltage as the balancing cells criterion is widely used in commercial HEVs since it can be easily measured and implemented in all kinds of balancing circuits [2]. The EMC Li-Ion battery terminal voltage is shown in Figure 14, and the entire range of charging Li-Ion battery SOC from 0 to 100% that requires three consecutive UDDS charging cycles is shown in Figure 15.
The corresponding battery terminal output voltage for the same three consecutive UDDS driving cycles charging current profile is shown in Figure 16.
The UDDS driving cycle charging current profile test is shown in Figure 17.

3. Extended Kalman Filter and Proportional Integral Observer Real Time SOC Estimators

In this section, we develop two real time SOC estimators based on 2RC second order EMC Li-Ion battery model, validated already in the second section for both charging and discharging current UDDS driving cycles for a case study well detailed in the previous section. The MATLAB simulation results for each real time Li-Ion battery SOC estimator are also shown in this section. At the end of the section a comparison of the performance results obtained by the both SOC estimators will be completed and the most suitable real time SOC estimator will be selected.

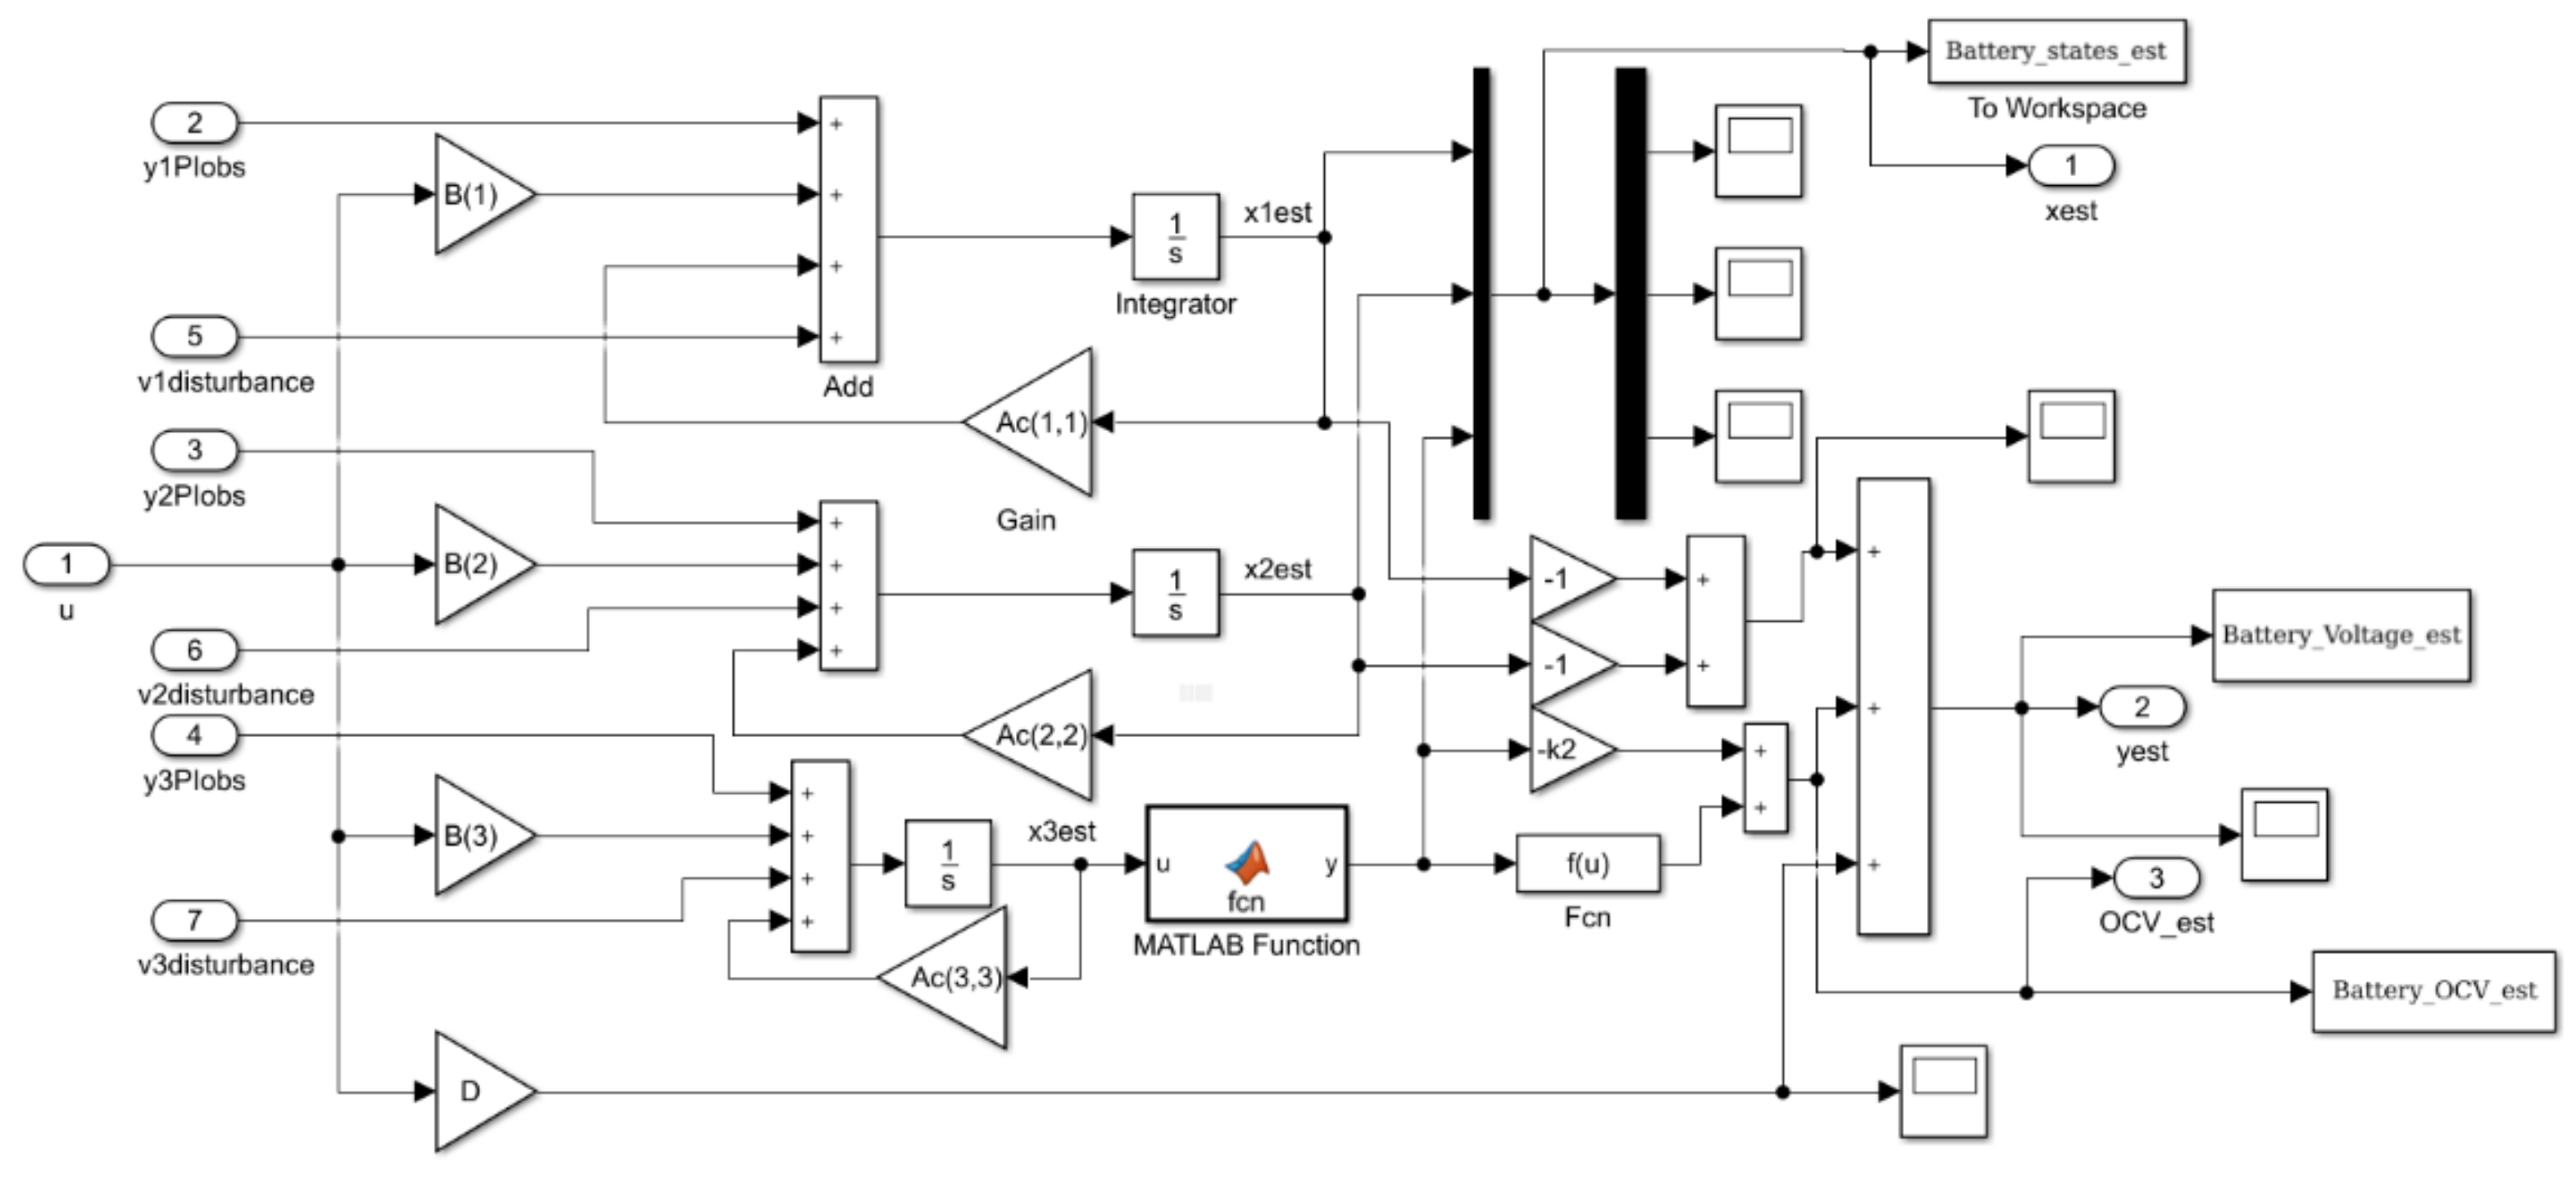
3.1. Real Time Extended Kalman Filter SOC Estimator Design

Technically, the Kalman filter uses the entire observed input and output data to find the minimum mean squared error (MSE) between the estimation values of the system states and the true values of 2RC EMC Li-Ion battery states [2]. Basically, the KF takes advantage of the prior input current u ( t ) and output terminal battery voltage y ( t ) to obtain the Kalman gain, K . The Kalman gain K is calculated iteratively to feedback the correction of the differences between the estimated values of system states and their true values provided by the 2RC EMC Li-Ion battery model [2].
As was mentioned in previous section the Coulomb counting is a typical approach to estimate the Li-Ion battery SOC due to its implementation simplicity, explained in detail in previous Section 2.4.5 [2,6,7]. The main drawback of this approach is the difficulty to guess the initial condition value of SOC, thus its estimation error increases considerable over time. Essentially, a viable solution to increase the SOC estimation accuracy is to take the battery OCV for SOC calibration but is hard to measure the OCV in real time and the small OCV error may lead to a significant SOC difference, as is stated in [2,7].
The most suitable approach that combines the advantages of the Coulomb counting method and the battery OCV based SOC estimation method is to design an EKF SOC real time estimator, similar to those developed in [6,7]. Additionally, an adaptive improvement version of EKF, known as AEKF real time SOC estimator is developed in detail in [2]. To obtain optimal SOC estimation results for EKF estimator gain the process w ( k ) and measurement output v ( k ) white uncorrelated noises of zero mean and covariance matrices Q ( k ) and R ( k ) respectively are considered [2,6,7], i.e.,
w ( k ) ( 0 , Q ( k ) ) , v ( k ) ( 0 , R ( k ) ) E ( w ( k ) w ( j ) T ) = Q ( k ) δ k j , E ( v ( k ) v ( j ) T ) = R ( k ) δ k j δ k j = { 0 , k j 1 , k = j }
Also, in a battery pack the parameters are extracted once and used in the later estimations that lead to accumulated modelling error. This is the reason that a fading memory factor α is used in the mentioned AEKF estimator design “to increase the adaptiveness for the modelling errors” and “serves to increase the uncertainty of the state estimation and to give more credence to the measurement” [2].
When process errors and measurement output noises are considered, the discrete-time state space equation of the EMC Li-Ion battery dynamic model (13) and (14) can be generalized as:
x ( k + 1 ) = f ( k , x ( k ) , u ( k ) ) + w ( k ) y ( k ) = g ( k , x ( k ) , u ( k ) ) + v ( k )
where x ( k ) = [ x 1 ( k ) x 2 ( k ) x 3 ( k ) ] T is a row battery state vector.
The EKF algorithm steps suggested by [2,6,7] are summarized as follows.
Step 1: Linearization, the 2RC EMC Li-Ion battery nonlinear dynamics is linearized around the most recent estimation state value x ^ ( k | k ) and x ^ ( k | k 1 ) respectively, considered as an operating point, and the Jacobian matrices of the linearization are given by
A ( k ) = f ( k , x ( k ) , u ( k ) ) x ( k ) | x ^ ( k | k ) , B ( k ) = f ( k , x ( k ) , u ( k ) ) u ( k ) | x ^ ( k | k ) C ( k ) = g ( k , x ( k ) , u ( k ) ) x ( k ) | x ^ ( k | k 1 )
Step 2: Initialization, the initial estimation value of the 2RC EMC Li-Ion battery state vector x ( 0 ) is estimated as a Gaussian random vector with mean E { x ( 0 ) } and state covariance matrix P ^ ( 0 ) = E { ( x ( 0 ) x ^ ( 0 ) ) ( x ( 0 ) x ^ ( 0 ) ) T } , i.e., a random vector with a normal Gaussian distribution of mean x ^ ( 0 ) and covariance matrix P ^ ( 0 ) , x ( 0 ) N ( E { x ( 0 ) } , P ^ ( 0 ) ) .
Step3: Prediction phase (time update), the predicted value of the state vector is calculated based on the previous state estimate and state matrix covariance:
x ^ ( k + 1 | k ) = A ( k ) x ^ ( k | k ) + B ( k ) u ( k ) P ^ ( k + 1 | k ) = A ( k ) P ^ ( k | k ) A ( k ) T + Q ( k )
Step 4: Kalman gain computation, the Kalman filter gain is calculated as is follows:
K ( k ) = P ^ ( k + 1 | k ) H ( k ) T ( H ( k ) P ^ ( k + 1 | k ) H ( k ) T + R ( k ) ) 1
Step 5: Correction phase (measurement update), if a discrete time measurement is available then the estimated 2RC EMC Li-Ion battery state can be updated according to following equations:
x ^ ( k + 1 | k + 1 ) = x ^ ( k + 1 | k ) + K ( k ) ( y ( k ) g ( x ^ ( k + 1 | k ) , u ( k ) , k ) P ^ ( k + 1 | k + 1 ) = ( I K ( k ) H ( k ) ) P ^ ( k + 1 | k )  
We remark the recursive predictor-corrector structure of the EKF estimator that allows the time and measurement updates at each iteration. The EKF SOC estimator is easy to be implemented in real time and has only three parameters to be tuned, namely the noise covariance matrices Q ( k ) and R ( k ) , and the initial value of the state covariance matrix P ^ ( 0 ) = P ^ ( 0 | 0 ) . The initial parameter values of the EKF estimator can be obtained based on designer’s empirical experience. Furthermore, to simplify the tuning parameters procedure we can chose the time constant noise covariance positive definite diagonal matrices Q and R, based on a trial and error procedure. For our case study, we initialize the filter parameters by setting the following values:
x ( 0 ) = [ 0.01 0.01 0.9 ] T , R ( 0 ) = [ 0.02 ] , Q ( 0 ) = [ 0.0002 0 0 0 0.0002 0 0 0 0.05 ] , P ( 0 ) = [ 0.1 0 0 0 0.1 0 0 0 0.1 ] x ( 0 ) = [ 0.01 0.01 0.3 ] T , x E M C ( 0 ) = [ 0.01 0.01 0.7 ] T , SOC A D V I S O R = 0.7

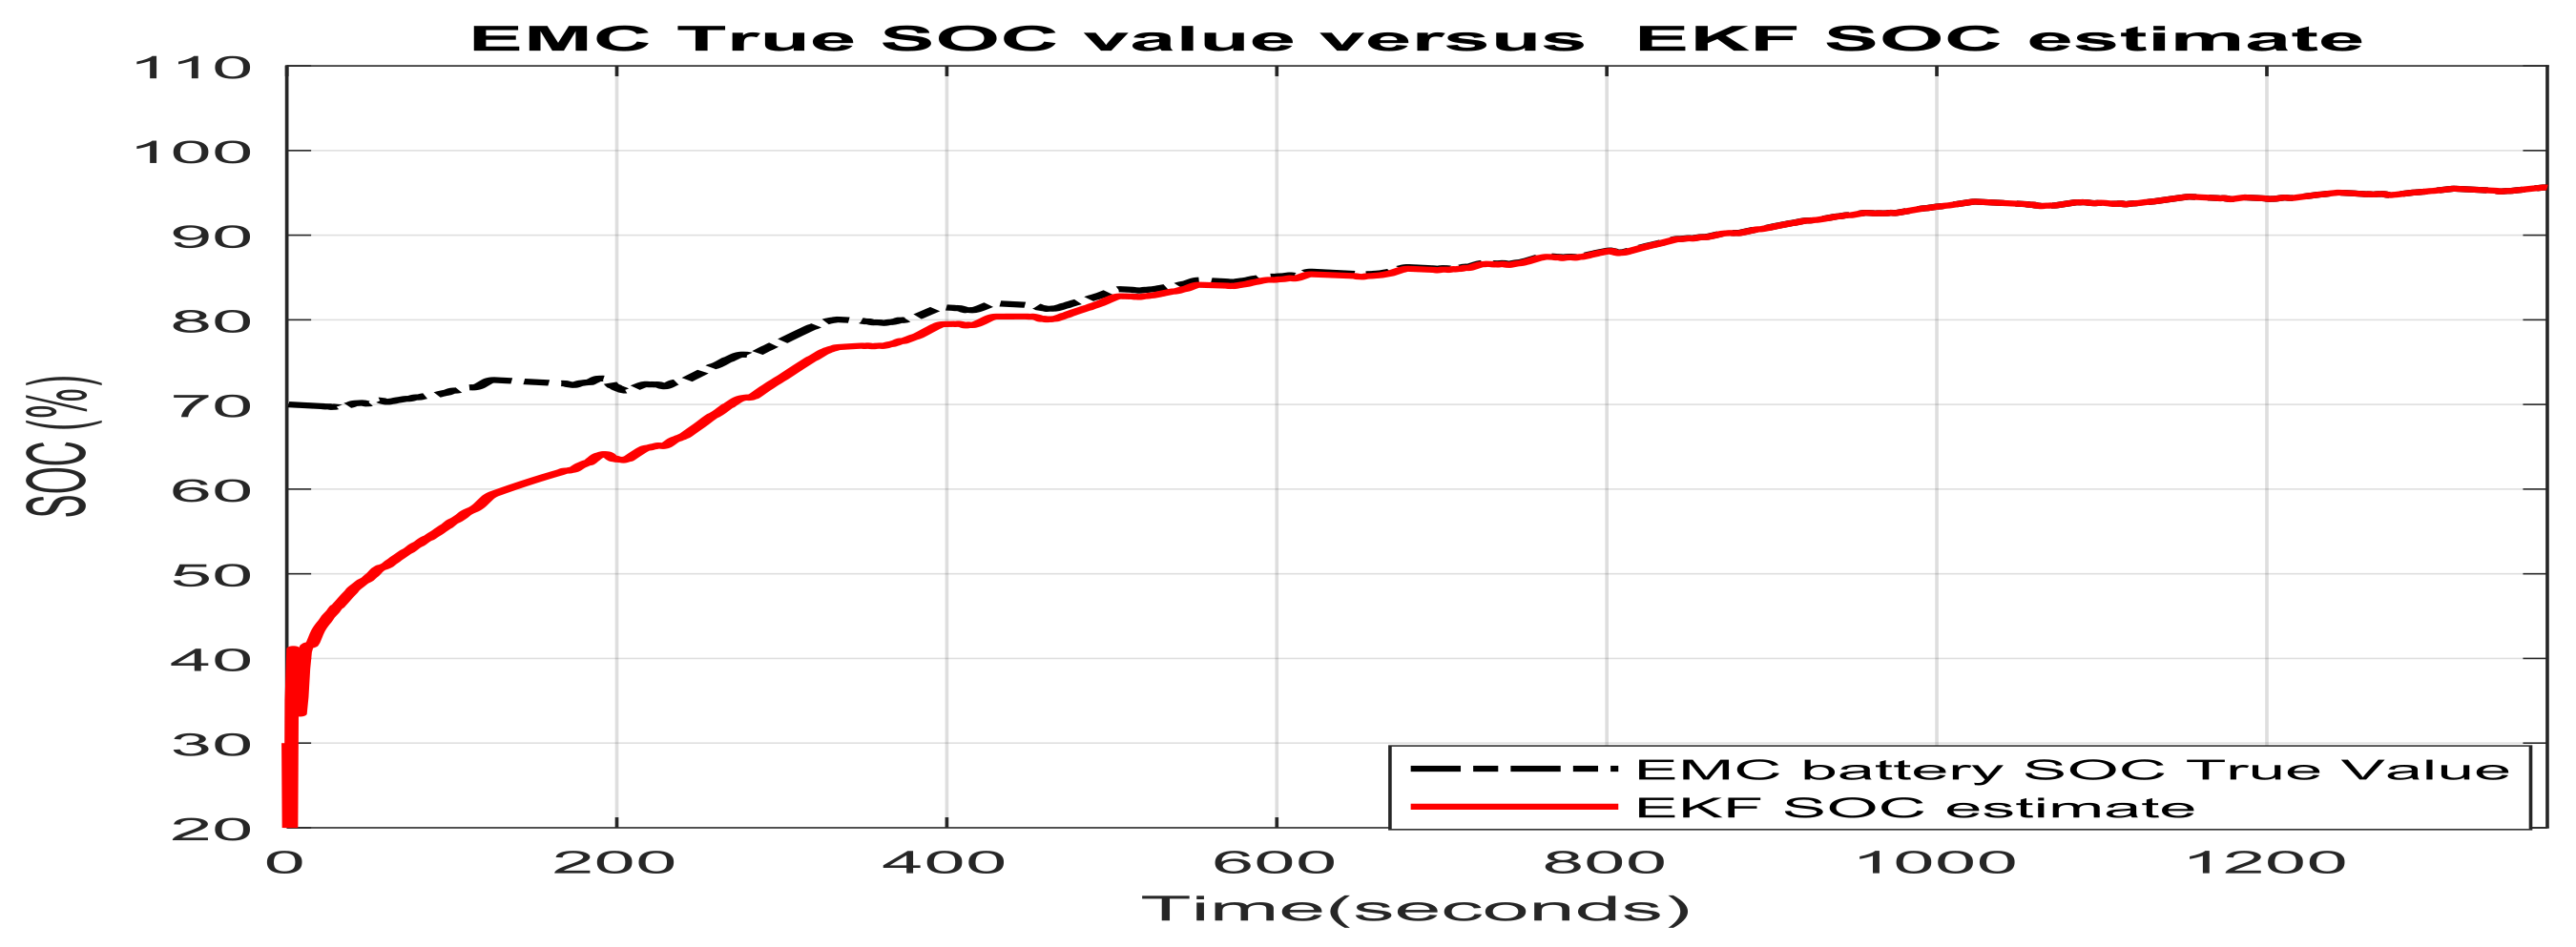
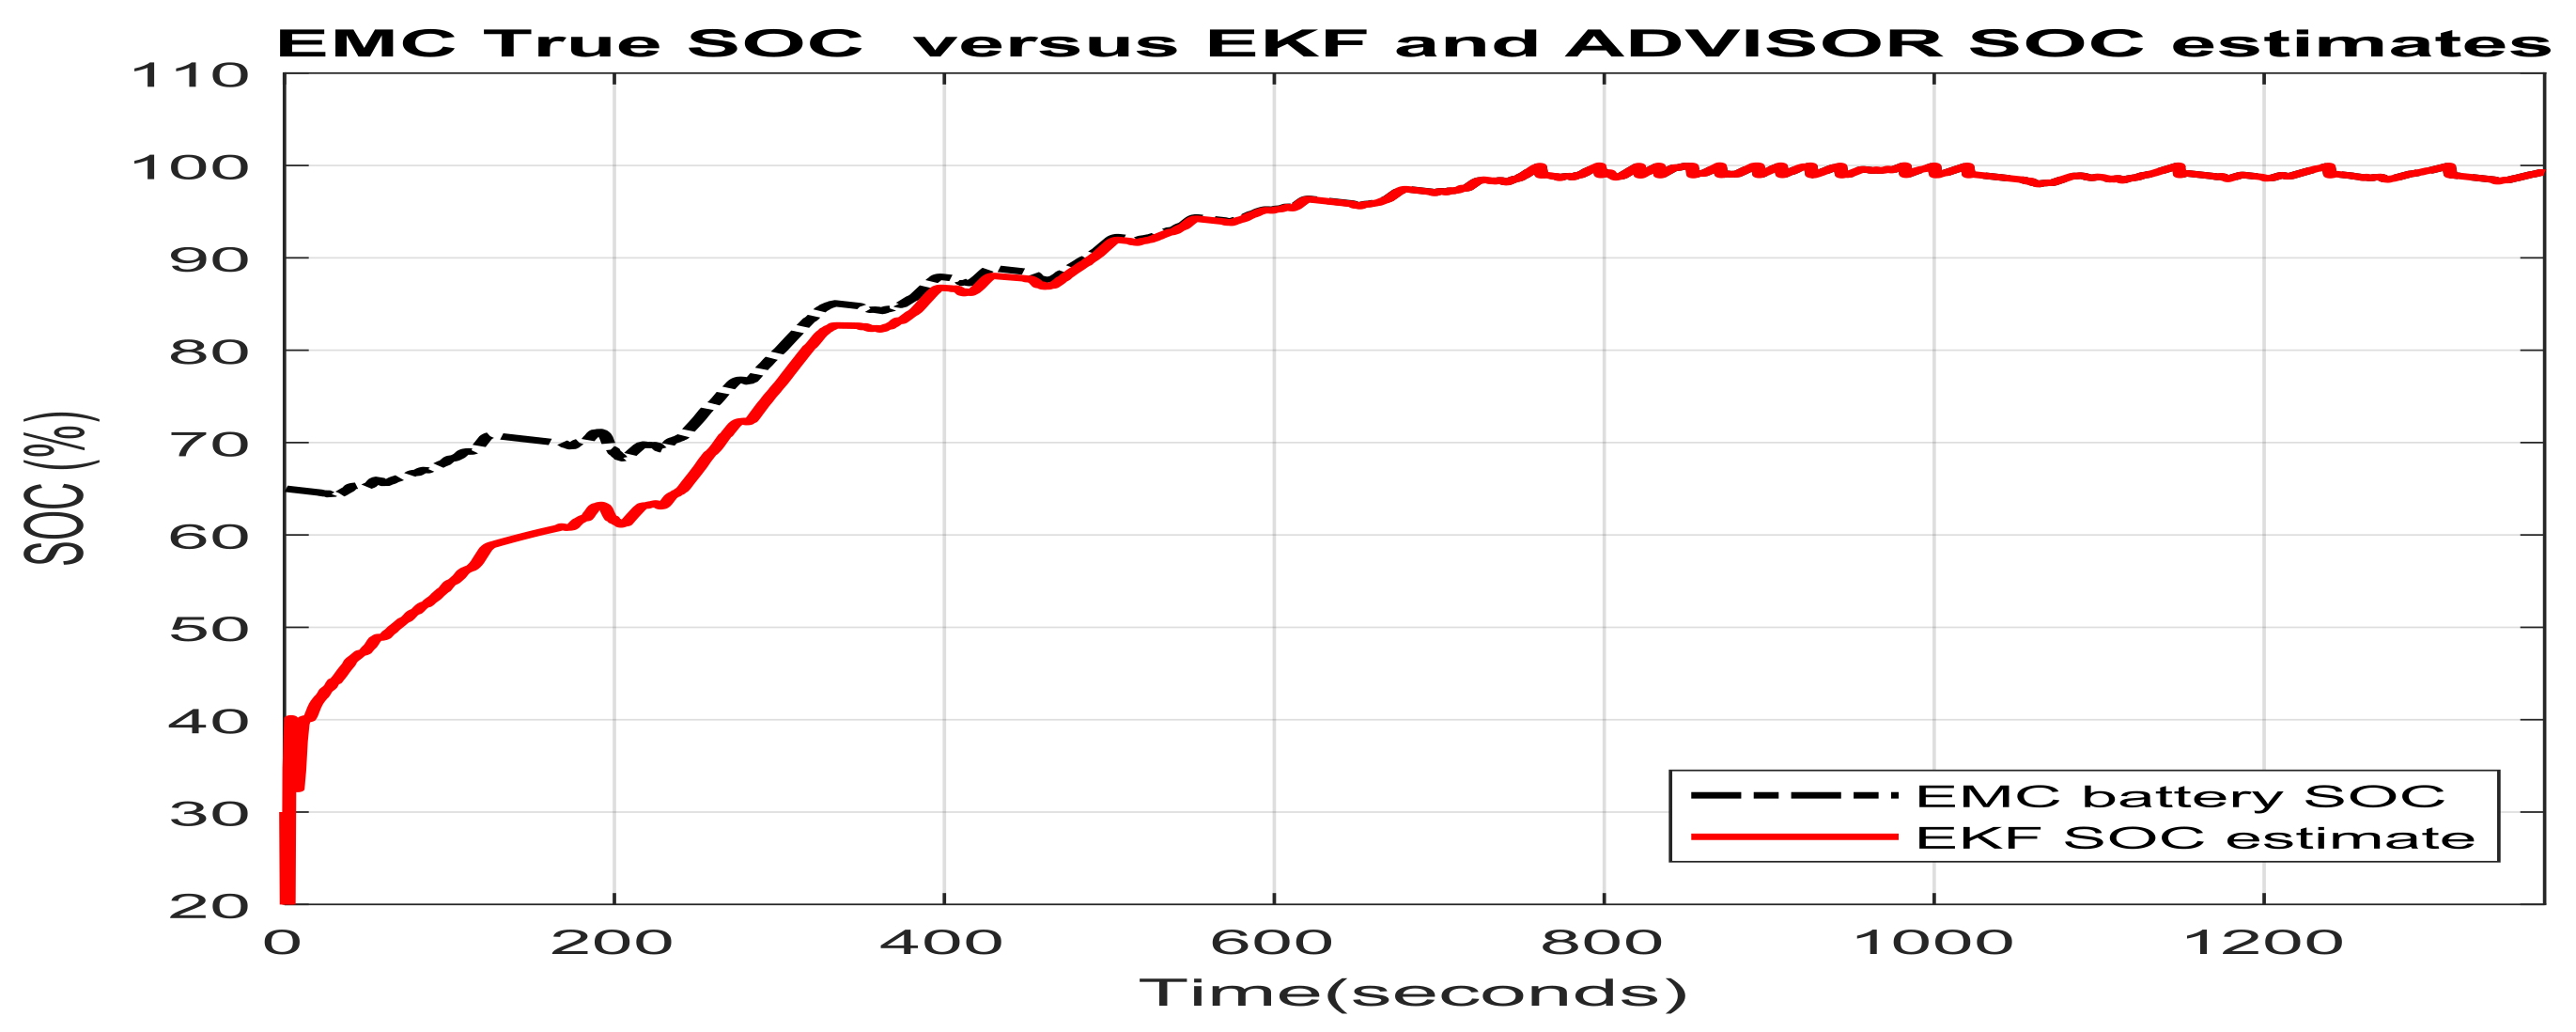
3.1.1. Real Time EKF SOC Estimator Implementation on MATLAB Platform, Simulation Results and Performance Analysis

The simulation results of real time implementation of 2RC EKF SOC estimator in MATLAB simulation environment are shown in Figure 18, Figure 19, Figure 20, Figure 21 and Figure 22. We analyze the EKF estimator performance in terms of robustness, convergence speed, accuracy and real-time implementation simplicity.
A. EKF estimator robustness
The robustness will be tested for:
  • changes (increase or decrease) in SOC initial values
  • simultaneous changes in SOC initial value and measurement current sensor noise level
  • simultaneous changes in SOC initial values and changes in internal resistance of Li-Ion battery 2RC EMC (two time increase of room temperature resistance value given in Table 1) due to the effects mentioned in Section 2.1, especially the changes in temperature effects
  • simultaneous changes in SOC initial value and the nominal value of the battery nominal capacity due to aging and/or temperature effects
A1 Robustness to changes in SOC initial values
Figure 18 shows the robustness of the EKF SOC estimator to an increase in initial SOC value (guess value) from 70 to 90%.
Figure 19 shows the robustness of the EKF SOC estimator to a decrease in initial SOC value (guess value) from 70 to 30%.
A2 Robustness to simultaneous changes in SOC initial value and measurements current sensor noise level
Figure 20 shows the simulation results of EKF estimator robustness test to simultaneous changes in SOC initial value from 70 to 30% and measurement current sensor noise level with zero mean and standard deviation σ2 = 0.002.
A3 Robustness to simultaneous changes in SOC initial value and changes in internal Li-Ion battery resistance
Figure 21 shows the MATLAB simulation results for the robustness test of EKF estimator to simultaneous changes in SOC initial value from 70 to 30% and an increase by 100% (two times) of the nominal value of the battery capacity due to aging and/or temperature effects.
A4 Robustness to simultaneous changes in SOC initial value and 50% decrease in nominal capacity value of Li-Ion battery due to aging and/or temperature effects
The MATLAB simulation results for this case are shown in Figure 22.
B EKF estimator convergence speed
The performance analysis can be done visually by examination of the last five graphs presented above and related directly to the EKF SOC estimator. Almost in all these five graphs, the EKF SOC estimate reaches the EMC SOC true value after 400 s, thus, showing a fast convergence speed.
C SOC estimation accuracy
The simulation results shown in the last five graphs reveal a high SOC estimation accuracy after the EKF SOC estimate reaches the 2RC EMC SOC true value. Only Figure 20 shows that if the minimum threshold of the noise level is exceeded, i.e., the standard deviation is greater than 0.002, the EKF SOC estimate is biased with respect to 2RC EMC SOC true value.
D Implementation simplicity of EKF estimator in real time MATLAB simulation environment
The experience accumulated until now in modeling, identification, estimation and control design, as well as all preliminary results obtained in this field, similar to those disseminated in [10], encourage us to believe that the EKF estimator due to its predictor-corrector structure is a recursive algorithm that is very simple to be implemented in real time and is computationally efficient. Additionally, the proposed 2RC EMC model is very simple and also easy to be implemented in real time. Furthermore, MATLAB platform has a lot of real time features needed for real time implementation of the proposed EKF state estimator.

3.1.2. Temperature Effects on Li-Ion Battery Model Parameters and on Real Time EKF SOC Estimator Implementation, Simulation Results and Performance Analysis on MATLAB Platform

In Section 2.1 we have identified all disturbances and the main factors that affect the Li-Ion battery dynamics in a realistic operating conditions environment. Thus, in “real life” the dynamics of the battery are seriously affected by these factors, reflected in changes of battery model parameters in time, and especially dependent on SOC and on the temperature. In this subsection, we consider the temperature effects on Li-Ion battery model parameters and on the EFK SOC estimator design and real time implementation, as is detailed in [18,22]. The simulation results performed in a real time MATLAB simulation environment and a brief performance analysis will be done in this subsection. Moreover, an improvement can be also done by considering a 3RC EMC Li-Ion battery model that has a third RC polarization cell connected in series with the OCV source, the internal resistance of the battery and other two RC polarization cells, as is introduced in [3,21]. The discrete time state space model that describes the dynamics of the improved Li-Ion battery is introduced in a similar way as is given in [3,18,22] and also described in the Equations (13) and (14):
x ( k + 1 ) = A ( k ) x ( k ) + B ( k ) u ( k ) y ( k ) = C ( k ) x ( k ) + D ( k ) u ( k ) + Ψ ( k , x 4 ( k ) ) x ( k ) = [ x 1 ( k ) x 2 ( k ) x 3 ( k ) x 4 ( k ) ] , A = [ 1 T s T 1 ( k ) 0 0 0 0 1 T s T 2 ( k ) 0 0 0 0 1 T s T 3 ( k ) 0 0 0 0 1 ] , B = [ T s C 1 ( k ) T s C 2 ( k ) T s C 3 ( k ) η T s C n o m ] C = [ 1 1 1 K 2 ] , D = R ( k )
Ψ ( k , x 4 ( k ) ) = K 0 K 1 1 x 4 ( k ) + K 3 ln ( x 4 ( k ) ) + K 4 ln ( | 1 x 4 ( k ) | ) , x 4 ( k ) = SOC ( k )
where T s is the sampling time, t = k T s , k Z , x ( k ) = x ( k T s ) , y ( k ) = y ( k T s ) , u ( k ) = u ( k T s ) and the polarization time constants are given by T 1 ( k ) = R 1 ( k ) C 1 ( k ) , T 2 ( k ) = R 2 ( k ) C 2 ( k ) , T 3 ( k ) = R 3 ( k ) C 3 ( k ) .
The third order 3RC EMC Li-Ion model parameters have the same significance as those defined in Table 1, but in the extended version, i.e., fourth state space of dimensionality n = 4, the internal resistance of the battery R(k), the polarization resistances R 1 ( k ) , R 2 ( k ) , R 3 ( k ) , and the polarization capacitances C 1 ( k ) , C 2 ( k ) , and C 3 ( k ) are variable parameters and depend on the temperature (T(k)) and on SOC(k). In addition, the values of these parameters differ between charging and discharging cycles, thus, the cell’s voltage behavior will be described by two sets of parameters, one for charging and one for discharging, as developed in [18]. Since the difference is not significant in our case study, we simplify the model by considering equal values for the charging and discharging cycles, as for 2RC EMC model case. The battery’s parameters are variable with respect to the temperature, the SOC and the current direction, making the overall Li-Ion battery model nonlinear. As is stated in [18], experimental data and curve fitting techniques are used to find empirical equations relating the parameters with the operating conditions. The new Li-Ion battery model can be simplified such that instead of using the nonlinear characteristics describing the parameter values, the expressions of three order 3RC EMC battery model parameters are simplified to lower degree equations in order to reduce the computational complexity as well as to study the robustness of the proposed EKF estimator to modeling uncertainties, as is done in [18]. The simplifying model procedure is well explained in [18] following the steps:
  • A simplification is done by separately studying each parameter and its variation with respect to SOC(k) and T.
  • The nonlinear equation for the specified parameter is used to generate data for a range of SOC and sometimes for different temperatures (depending on the case).
  • These data will be introduced to a curve fitting procedure where an expression of lower order has to be found.
  • The output of the high order equations model and the output of the lower order equations model are compared.
For simulation purposes, we combine this procedure with the new modeling approach introduced in [22] based on the internal impedance measurements mentioned in Section 2.4.3, that dynamically update the model based on cell temperature and SOC variations, thus, the dynamic battery behavior may be more accurately predicted. This is possible since the internal battery impedance is inversely proportional to its temperature. The effects of SOC variation is only taken into account to update the OCV parameter. Also, in this new approach all three RC polarization cells parameters are not updated for SOC variations since they are minimally affected at a frequency of interest in HEVs, as is stated in [22]. To build the third order 3RC EMC Li-Ion battery model, the designer can follow the design procedure steps detailed in [22]:
  • Step 1. Initiate a battery discharging cycle at a nominal discharging current based on a given SOC interval step to obtain the effect of SOC on OCV parameter
  • Step 2. Measure the internal impedance:
    Z ( j ω ) = R + ( R 1 | | 1 j ω C 1 ) + ( R 2 | | 1 j ω C 2 ) + ( R 3 | | 1 j ω C 3 ) , ω = 2 π f
The extracted values from the internal impedance Z ( j ω ) for RC polarization battery cell parameters, i.e., the resistances R, R1, R2, R3, and the capacitances C1, C2, and C3 are obtained at various temperature conditions through sinusoidally perturbing the frequency of the discharging current while measuring the battery terminal voltage.
  • Step 3. Apply a curve fitting method to obtain the resistive and capacitive RC battery polarization cell component values based on the measured internal impedance at the various temperature conditions.
  • Step 4. Update the battery model parameters dynamically based on the collected data and self-heating, described by the following thermal model equation [22]:
    m C p d T c e l l d t = V 1 R 1 + V 2 R 2 + V 3 R 3 h C o n v S c e l l ( T c e l l T A m b i e n t )
    where m is the battery mass (kg), C p is the specific heat (J/(kg·K)), V i | i = 1 , 3 ¯ are the RC polarization cells voltages, h C o n v is the heat transfer coefficient ( W / ( m 2 · K ) ) , S c e l l is cell surface area ( m 2 ), T c e l l is the cell temperature (K) and T A m b i e n t is the ambiental temperature (K). This thermal model is easy to be modeled in SIMULINK. In [22], p. 50, Table 3.1 are given the values of the extracted model parameters for four different temperatures: 5   ° C , 10   ° C , 15   ° C , 20   ° C , shown below in Table 2 also:
The collected data can be considered as four different 3RC EMC combined models set to the same values for the coefficients K0, K1, K2, K3, K4 that appear in the Equation (23) and given in Table 1. The MATLAB simulation results reveal the superiority of the 3RC EMC Li-Ion battery EKF SOC estimator compared to 2RC EMC Li-Ion Battery EKF SOC estimator developed in Section 3.1 and Section 3.1.1. It converges much faster, is robust to all model parameters affected by the SOC and temperature, and is very accurate. Also, by comparing the SOCs true values with their EKF and ADVISOR estimates we validate all these four 3RC EMC Li-Ion battery models. These simulation results obtained in a MATLAB simulation environment are shown in the following four figures, Figure 23, Figure 24, Figure 25 and Figure 26.

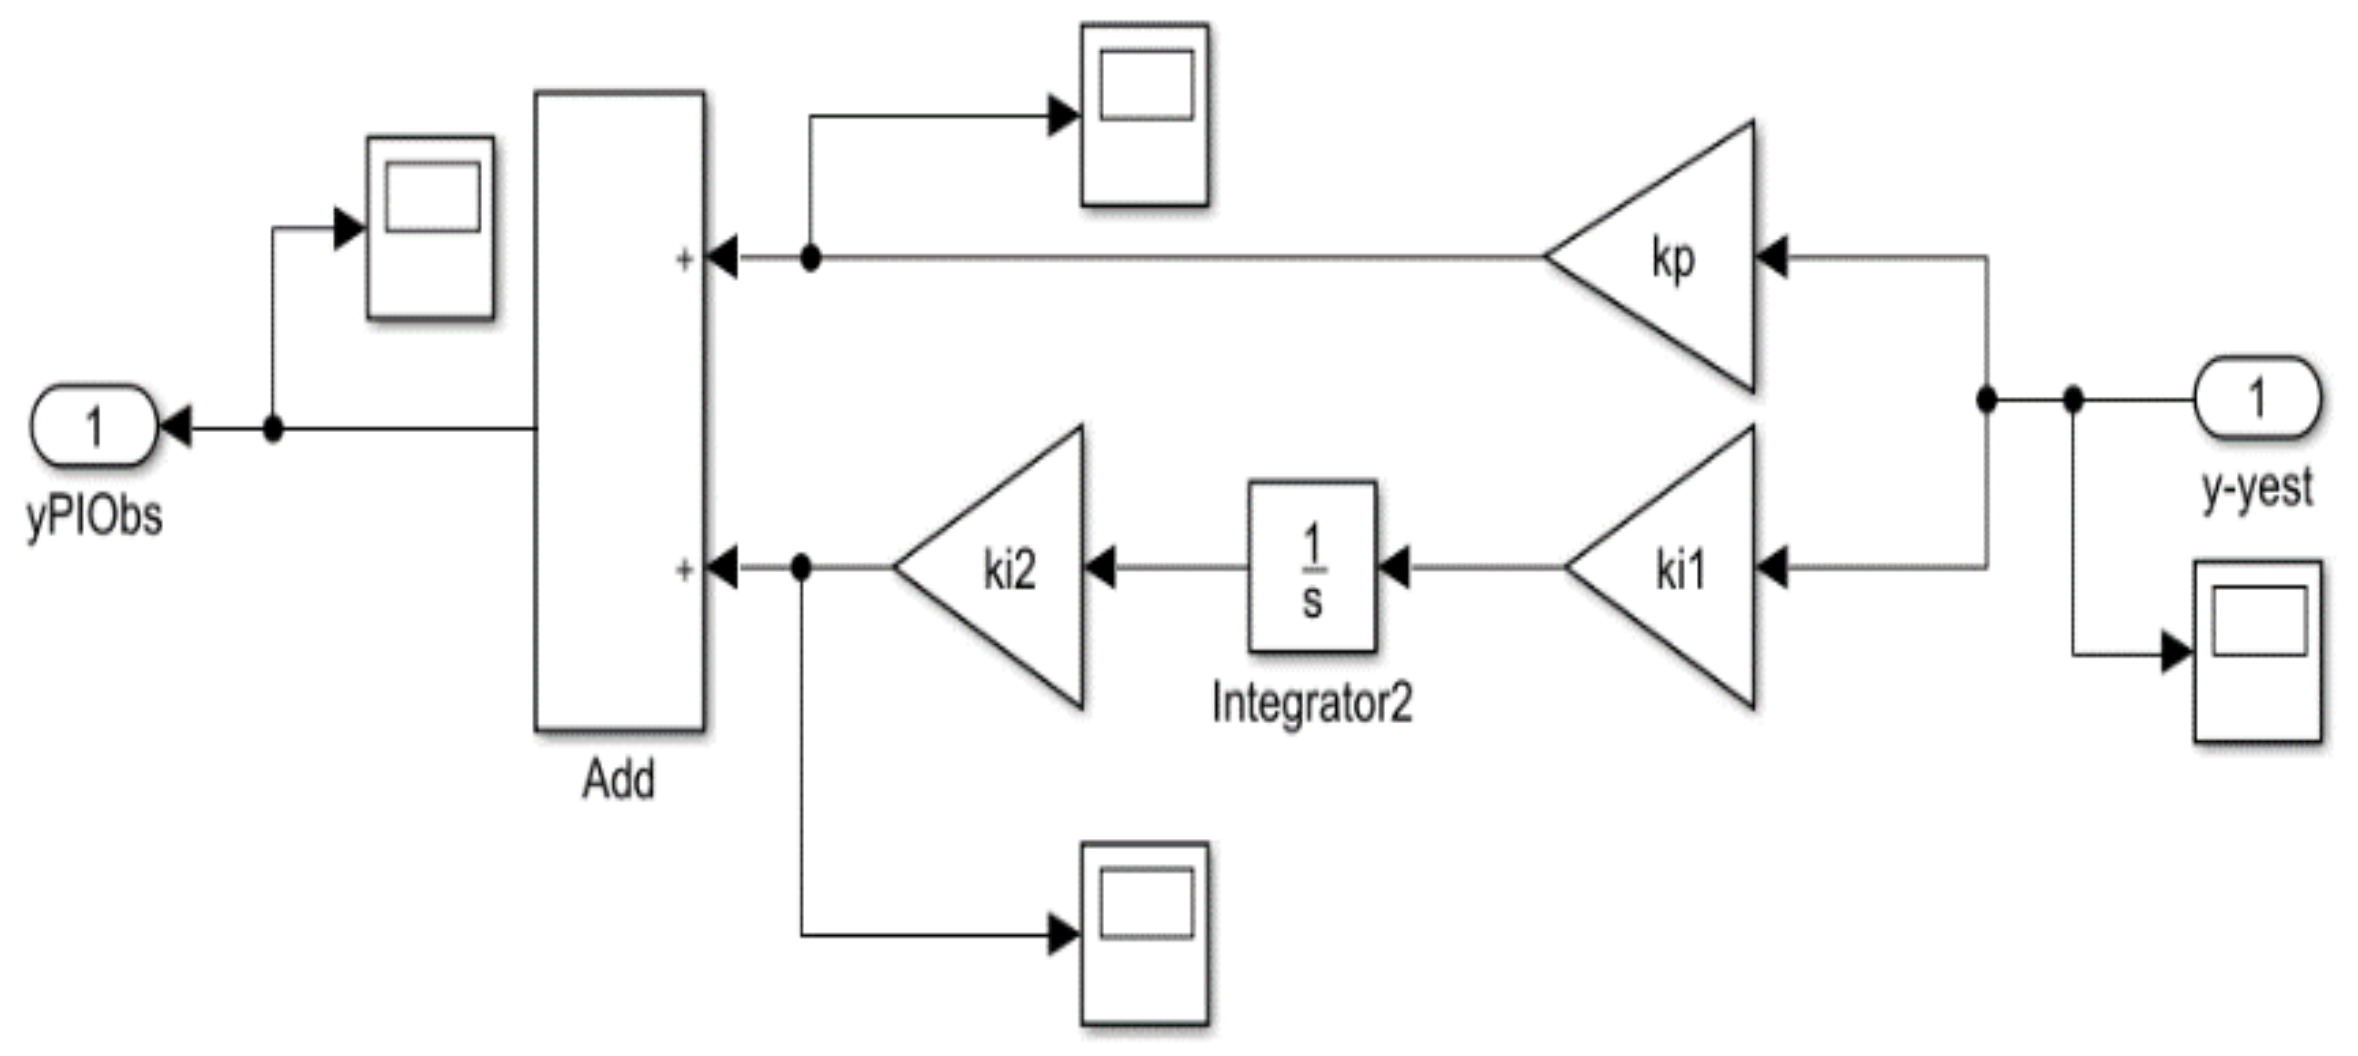
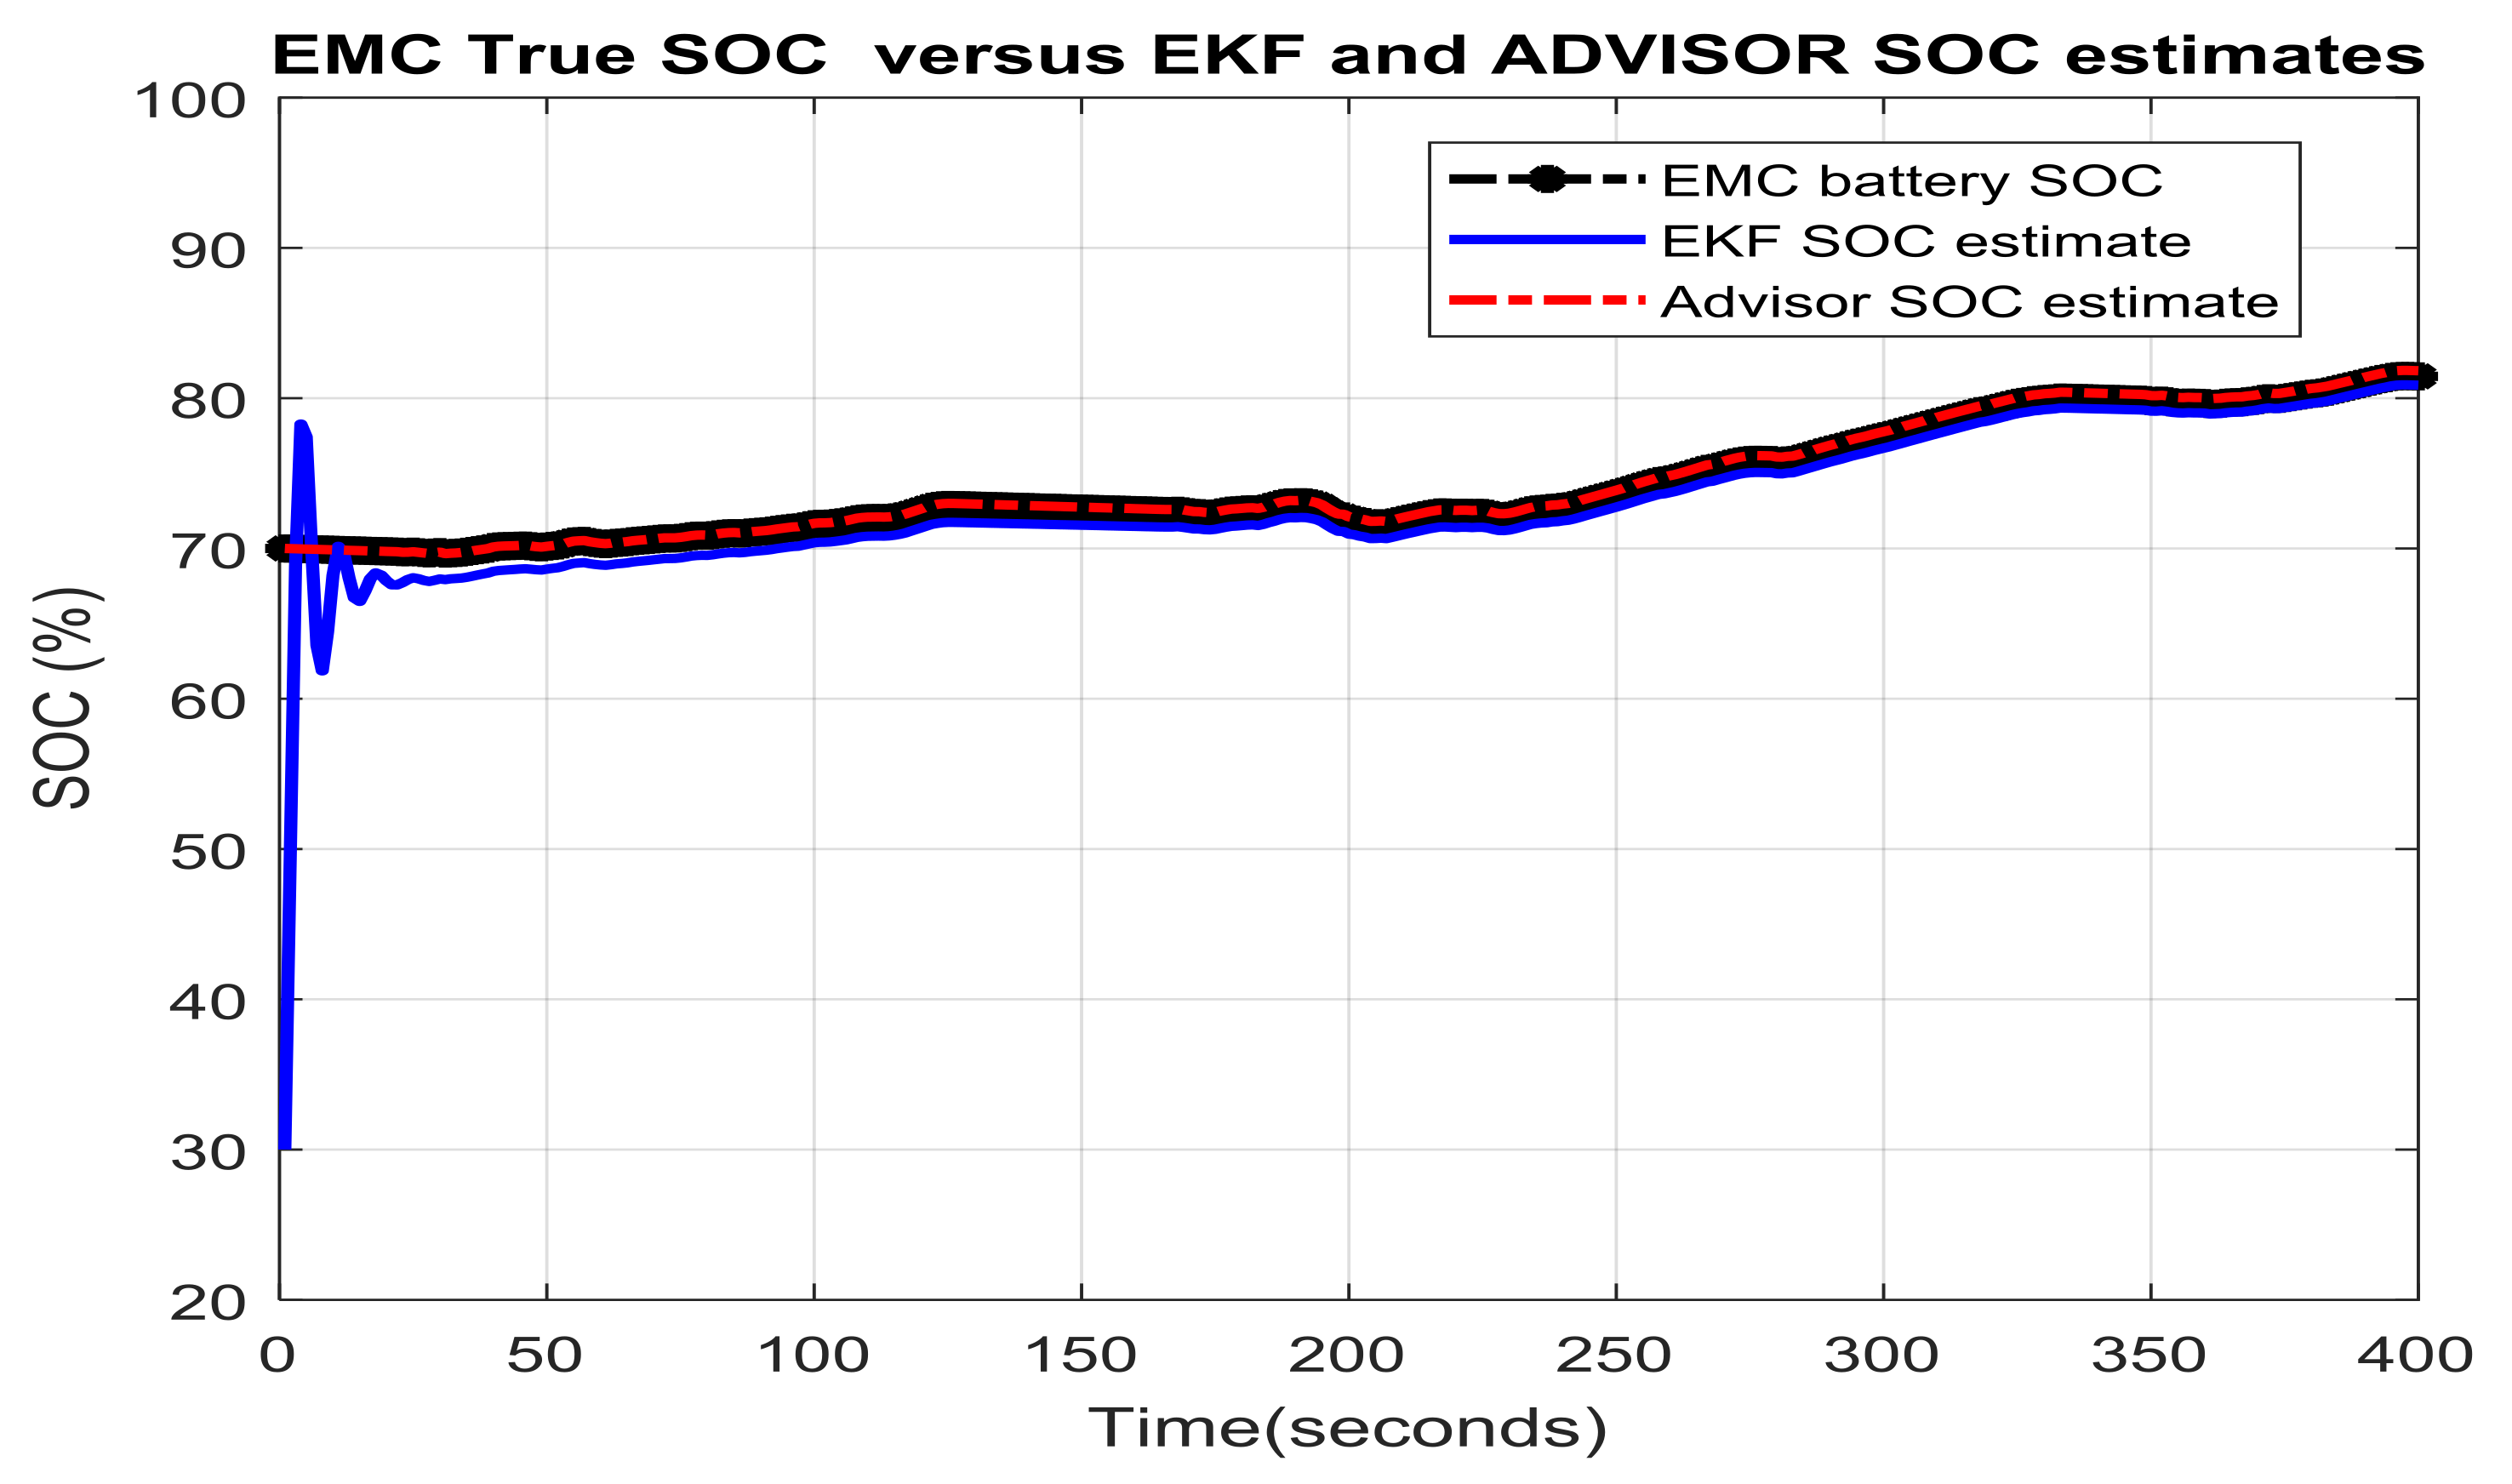
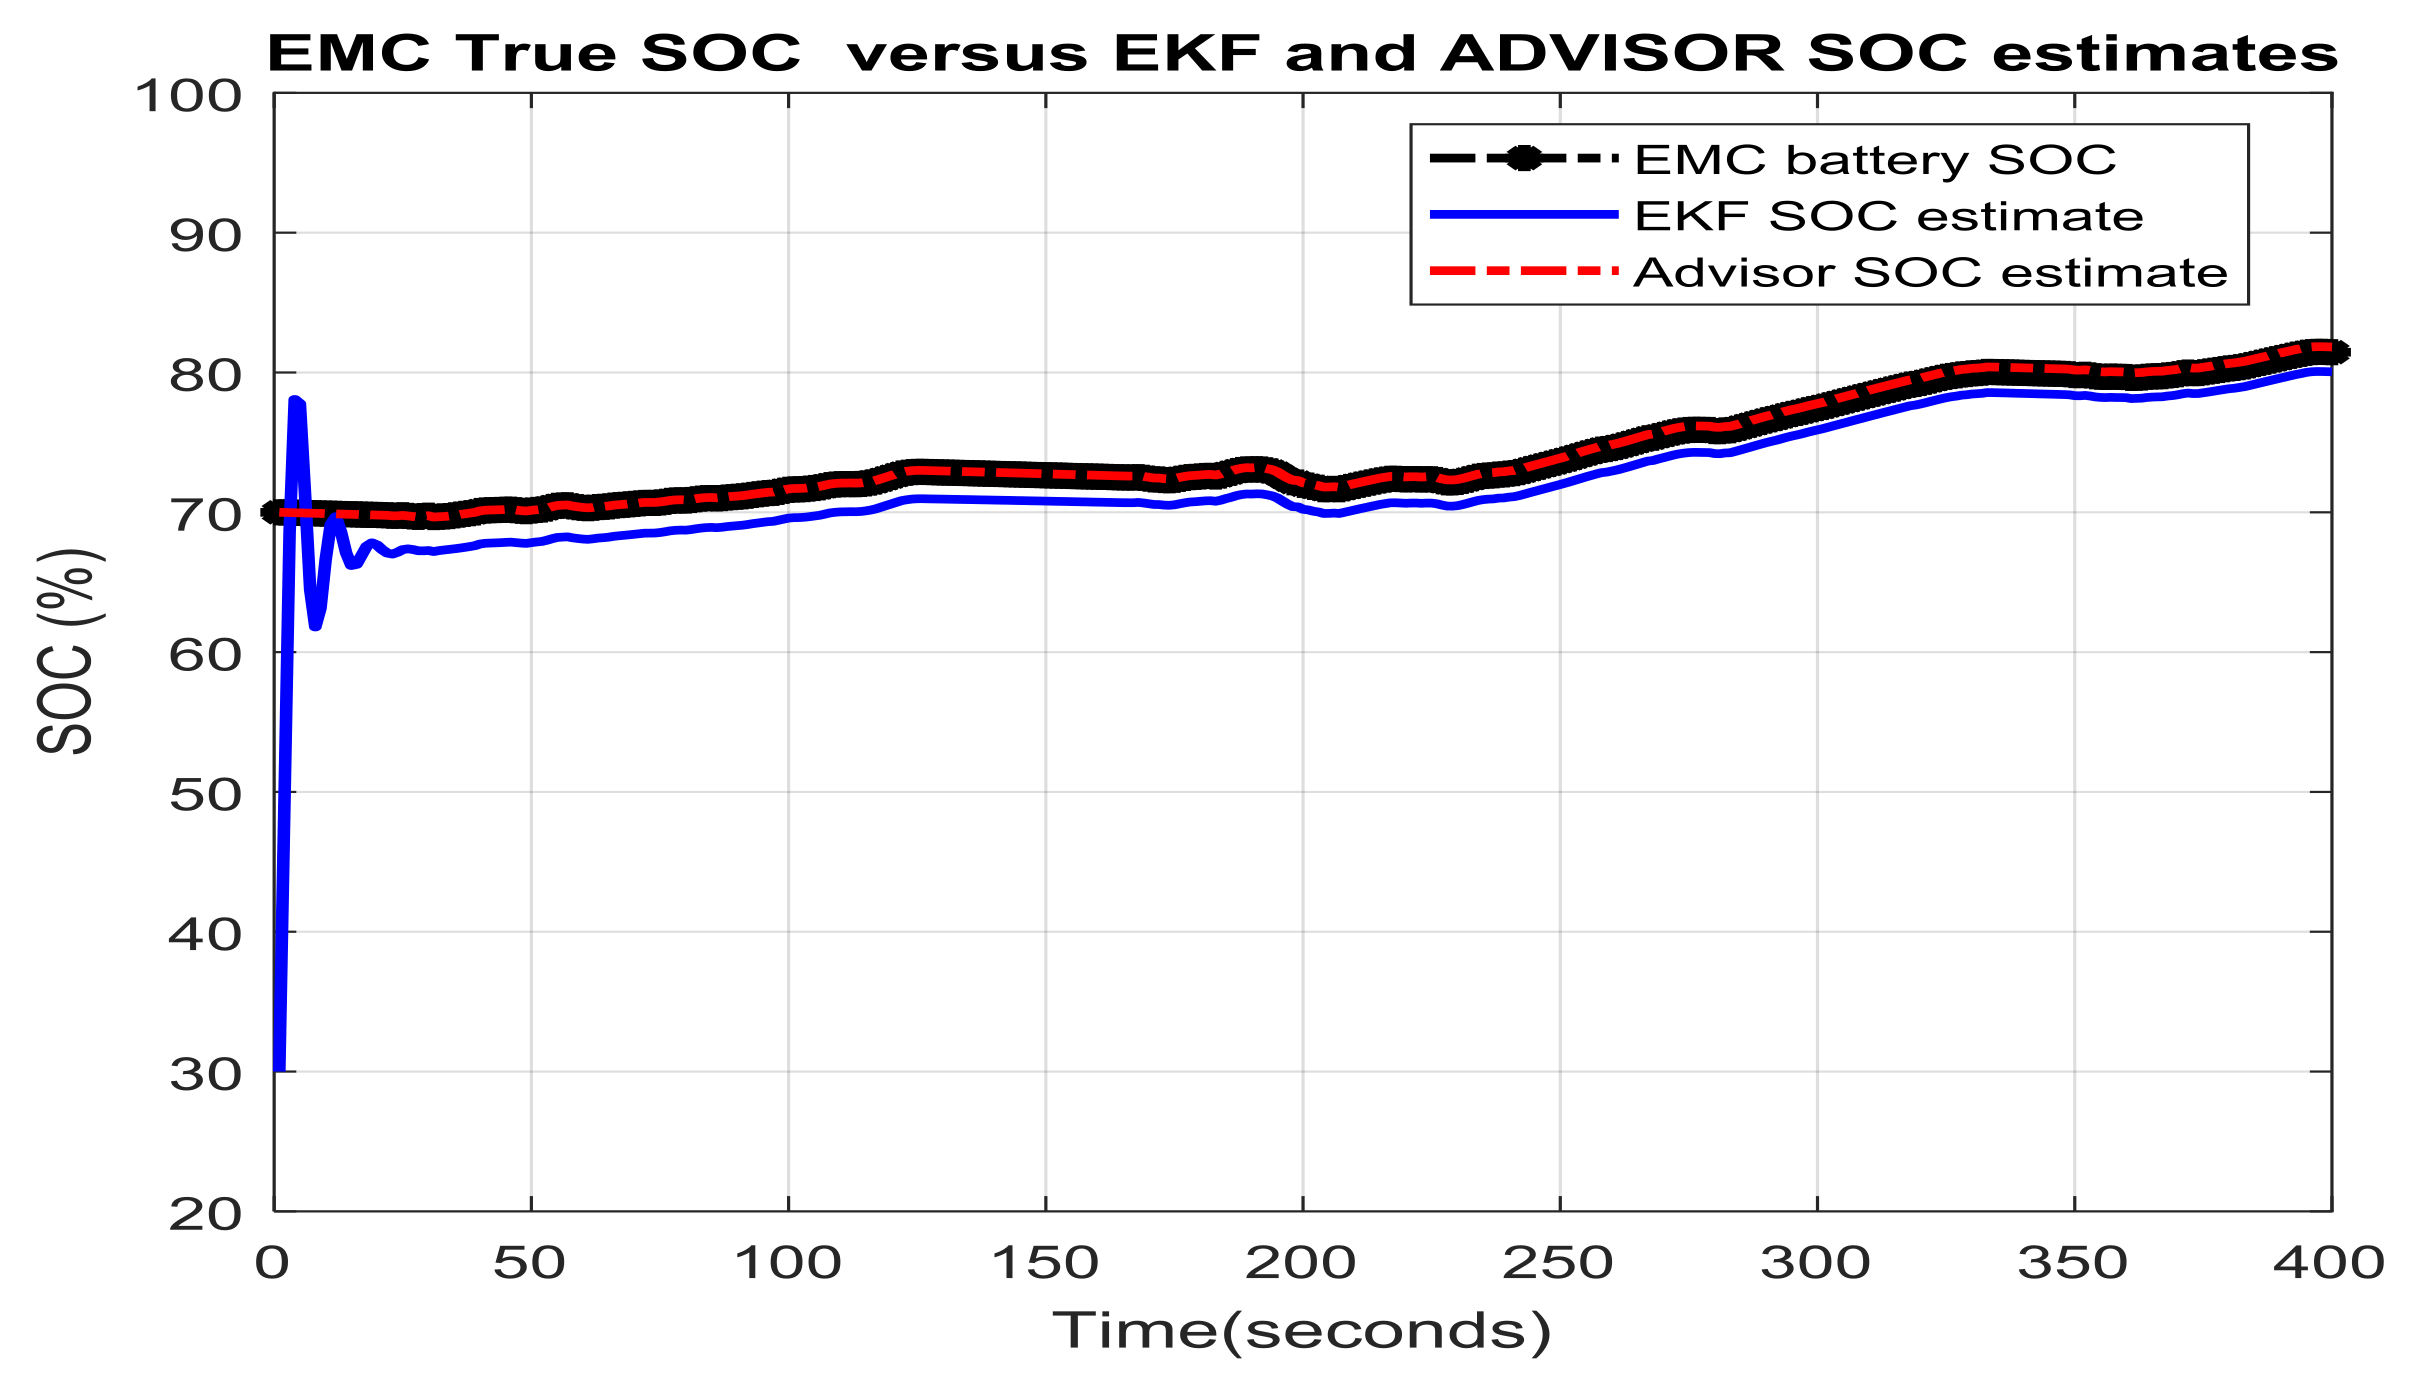
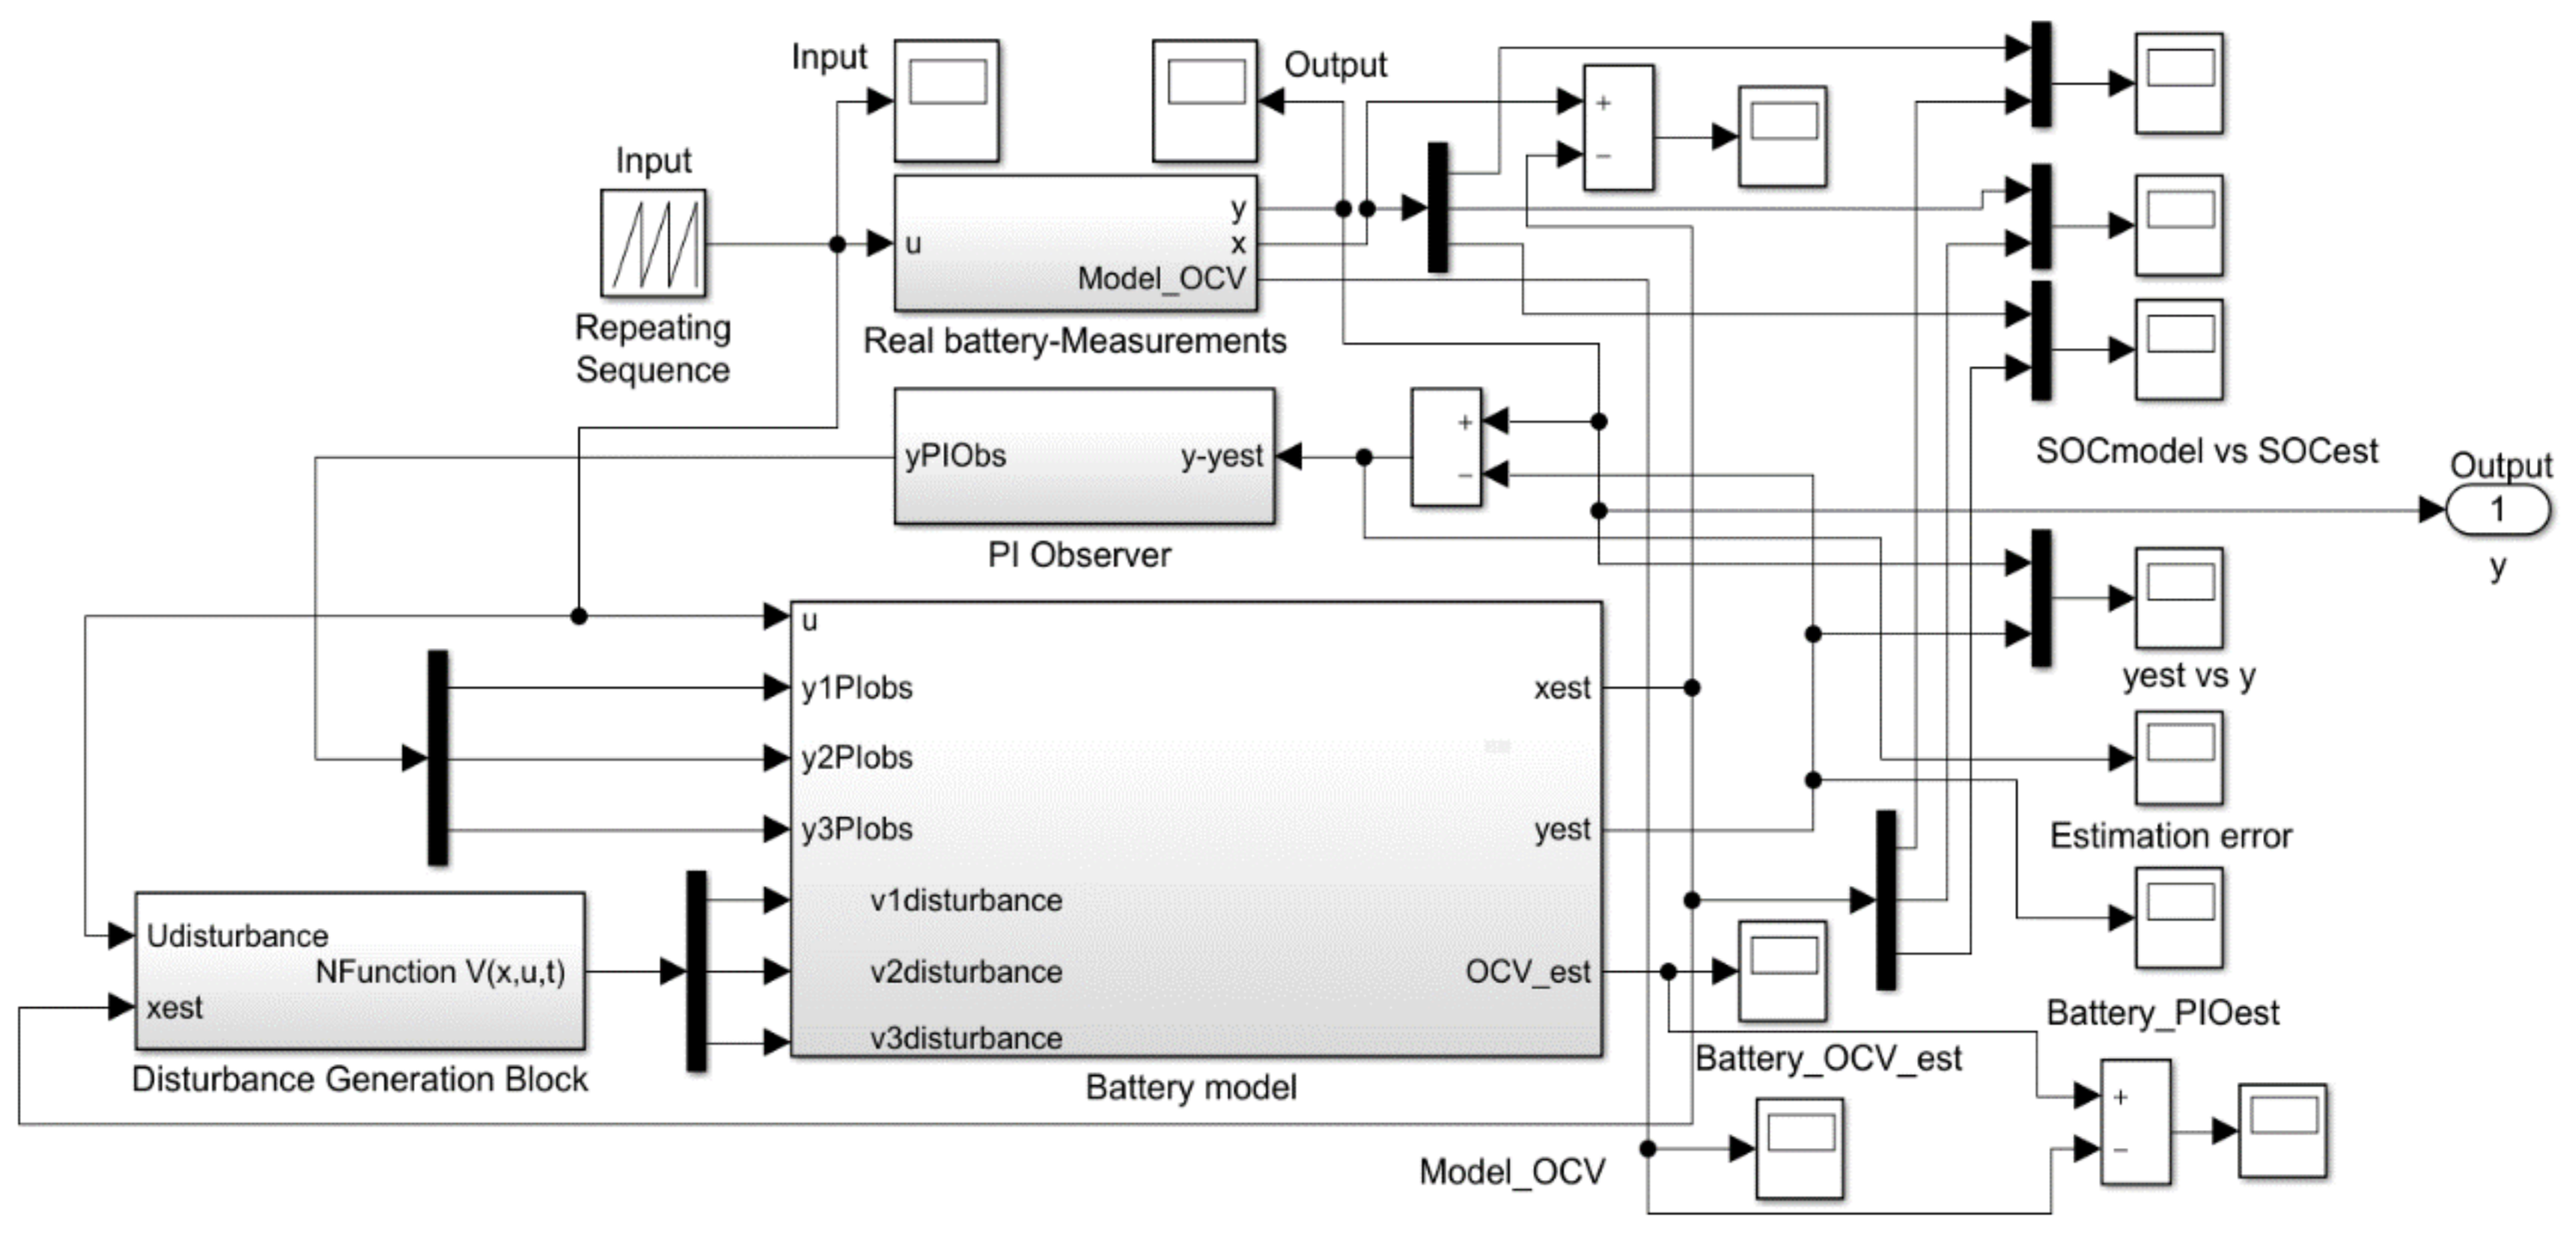
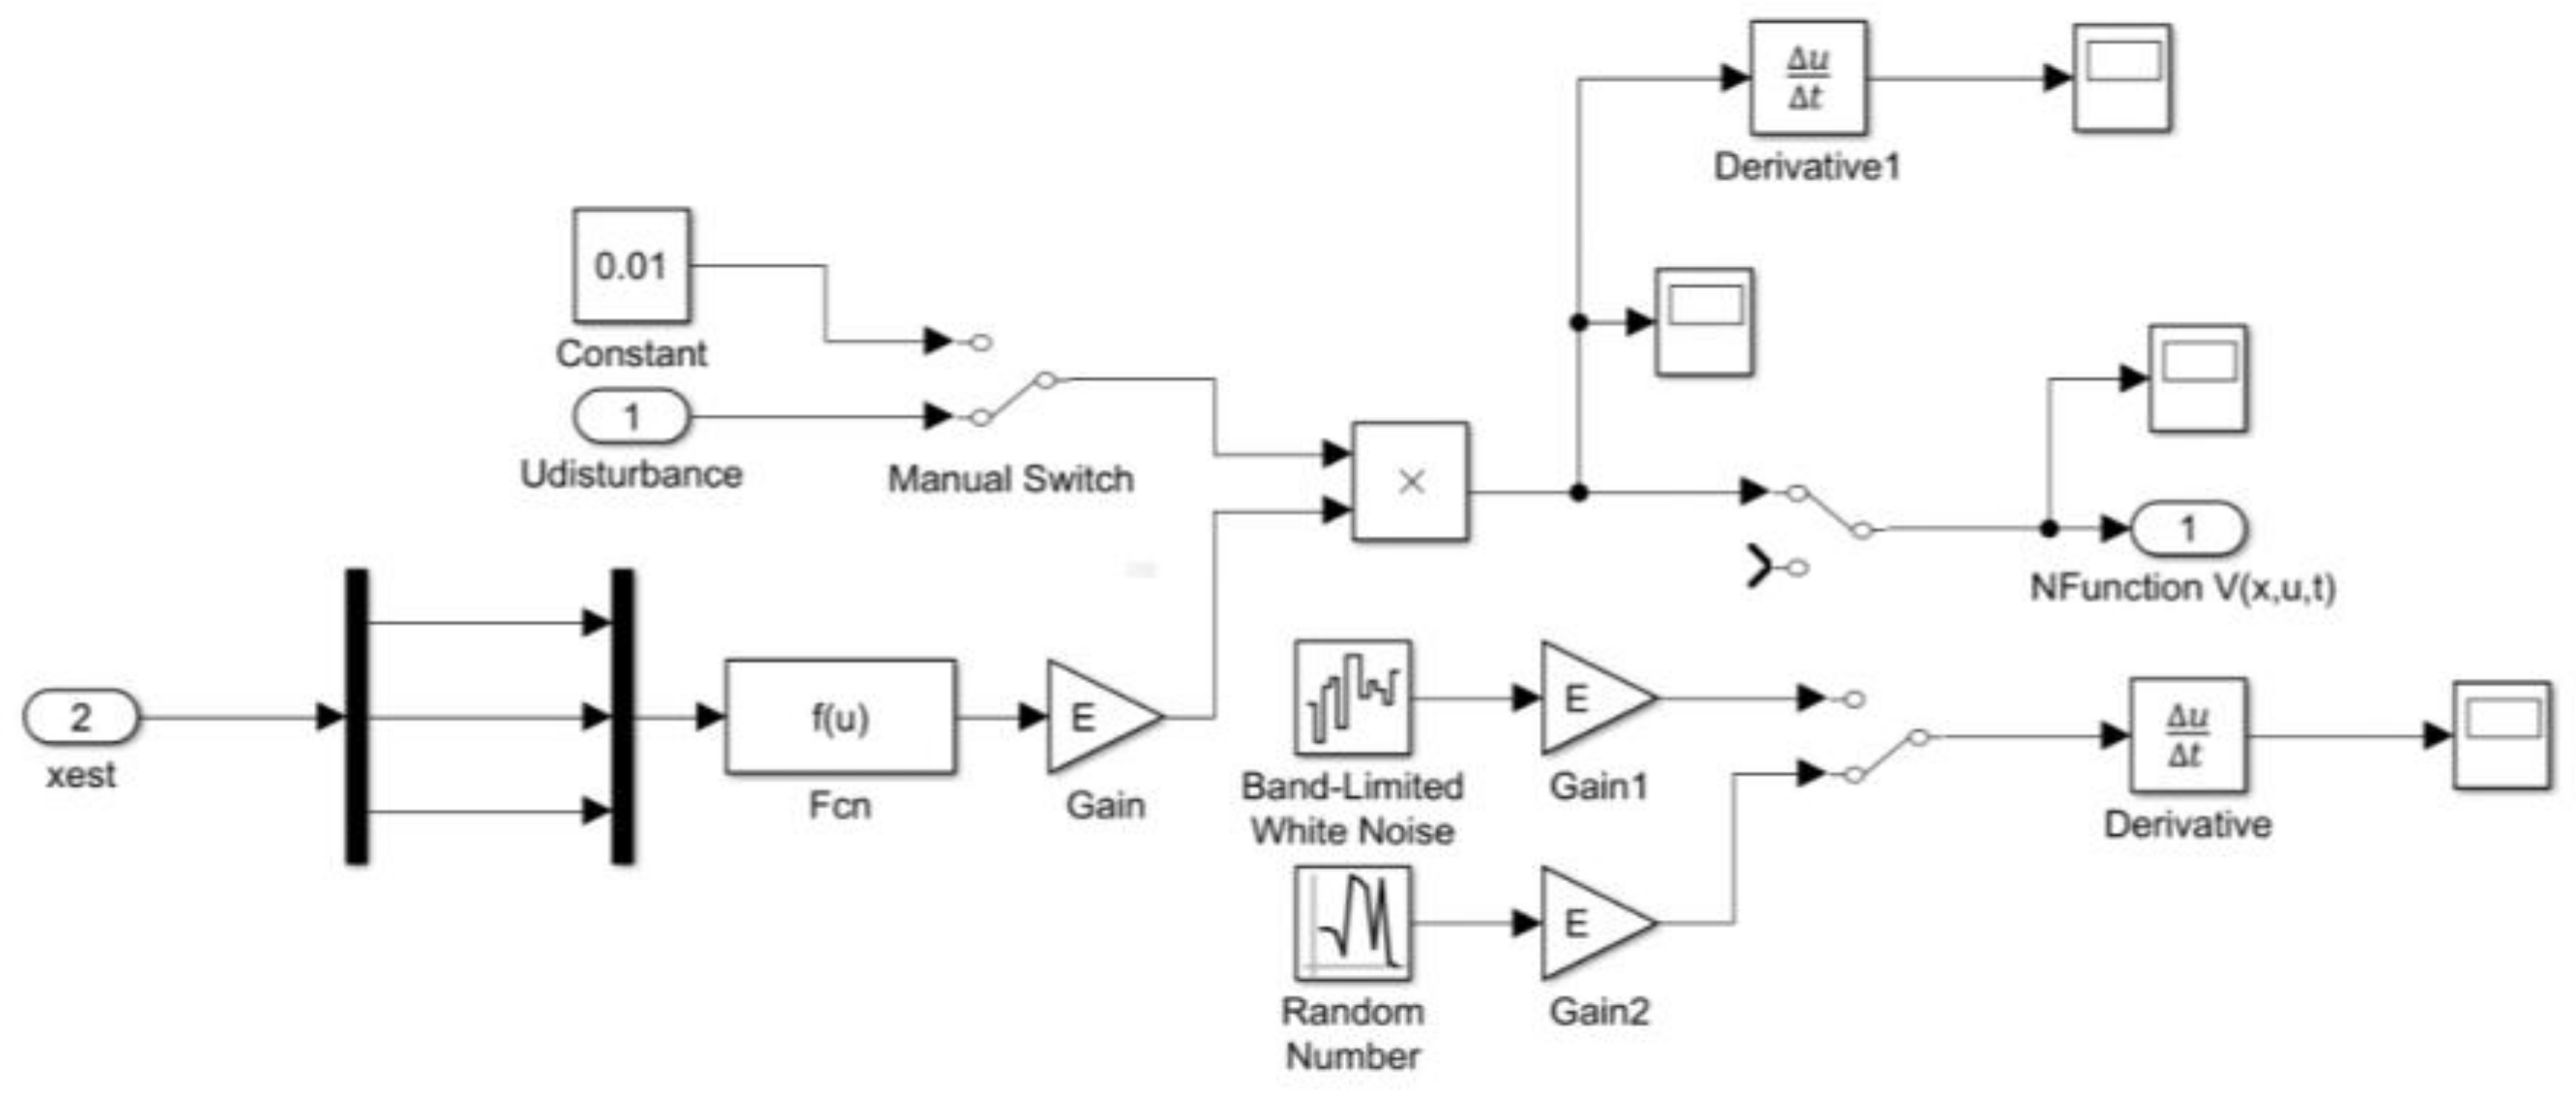
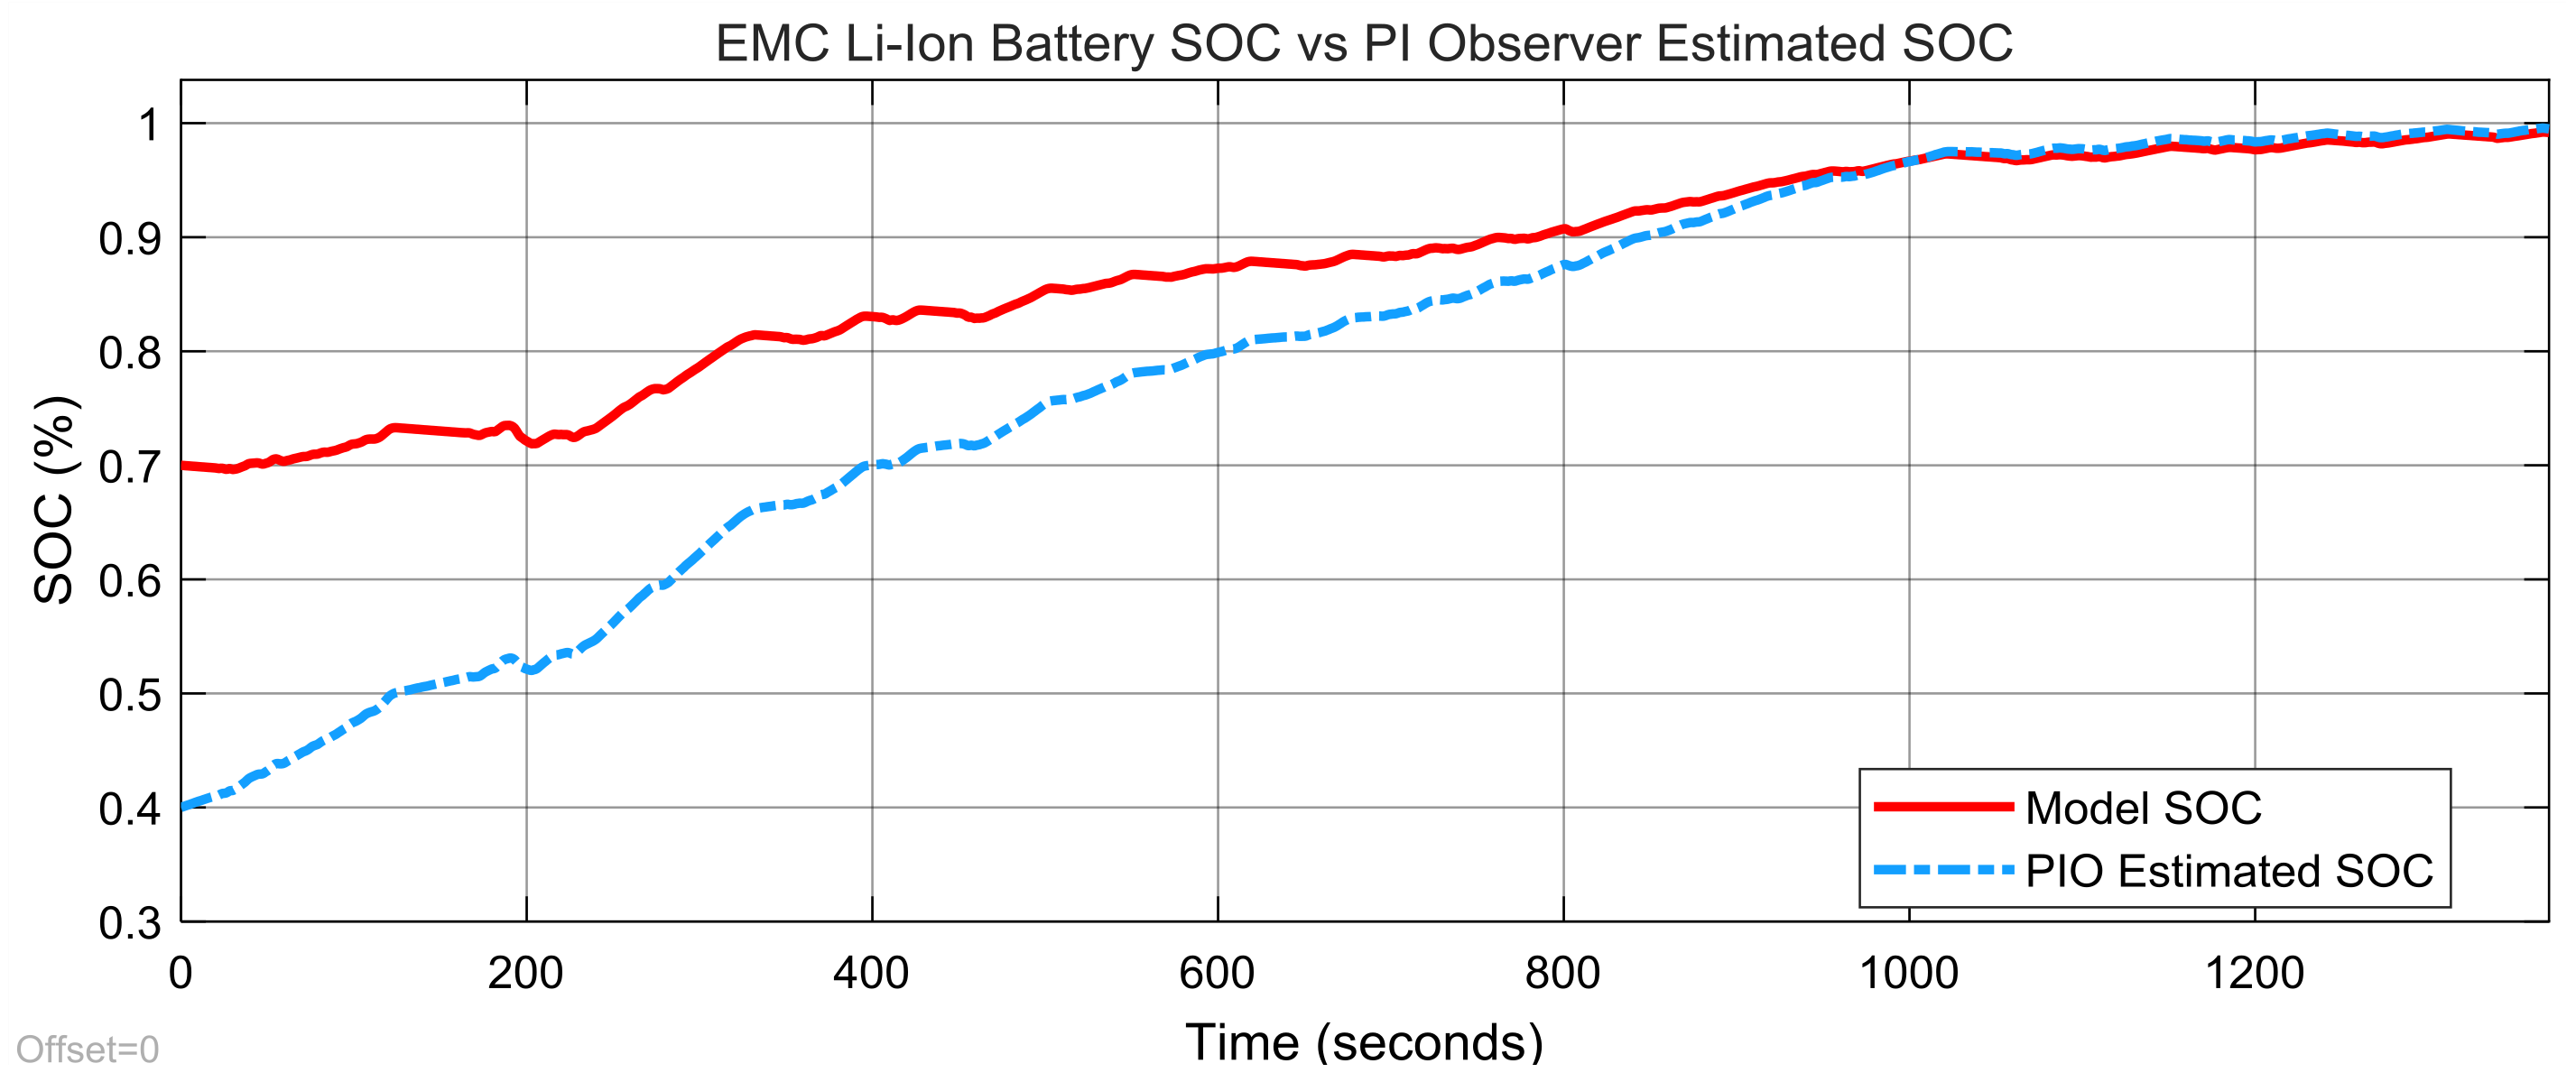
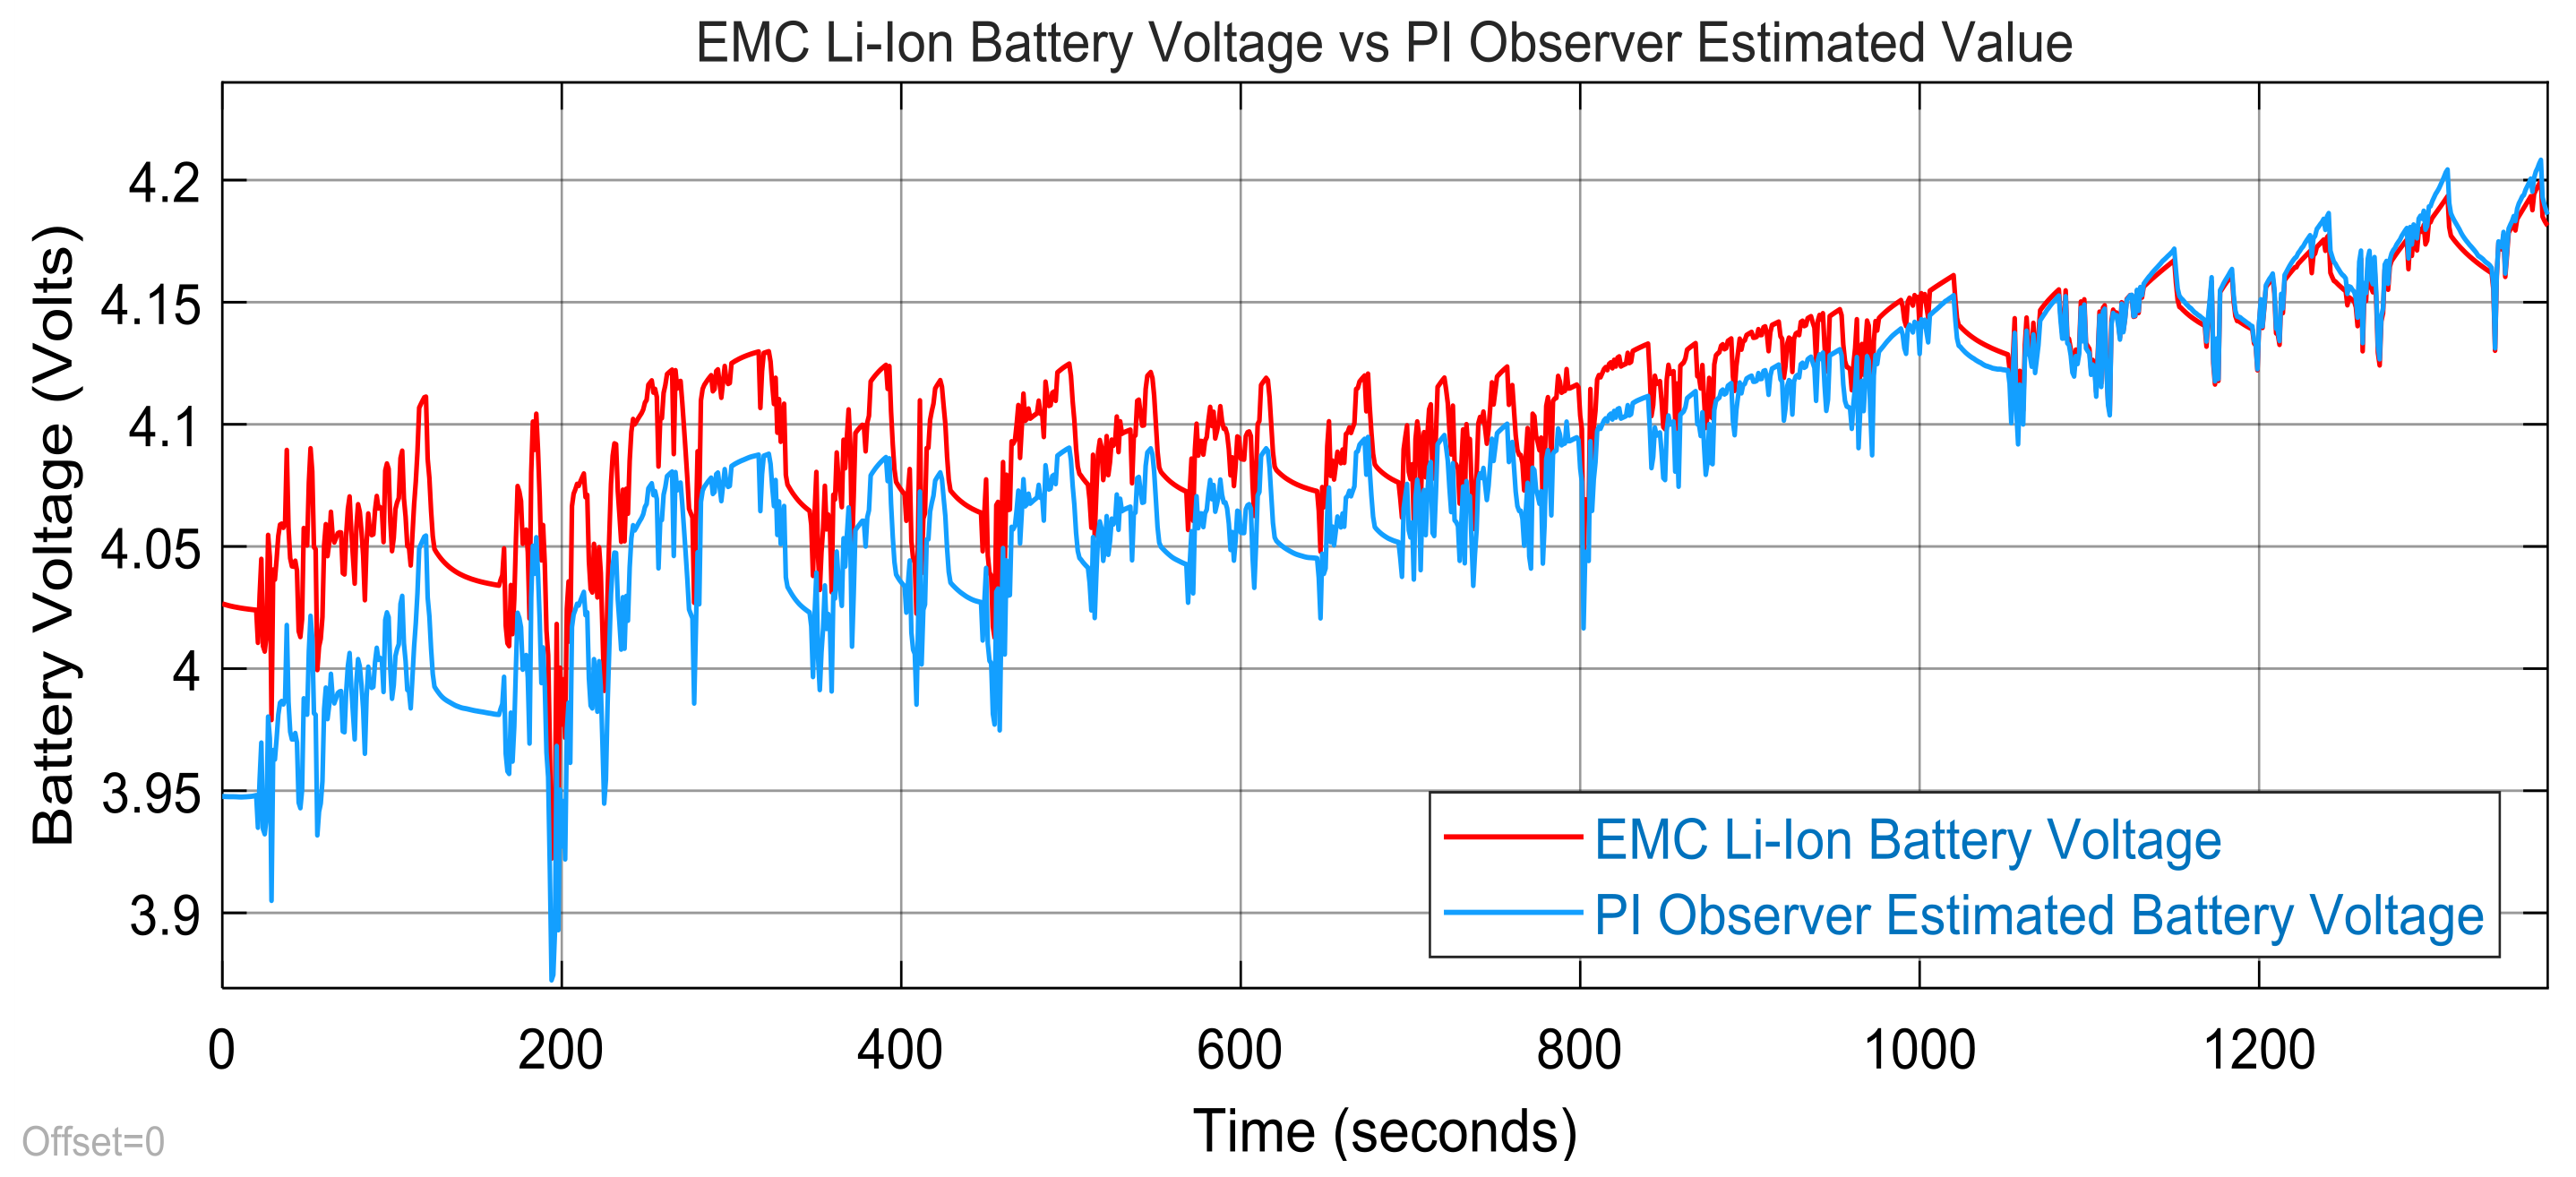
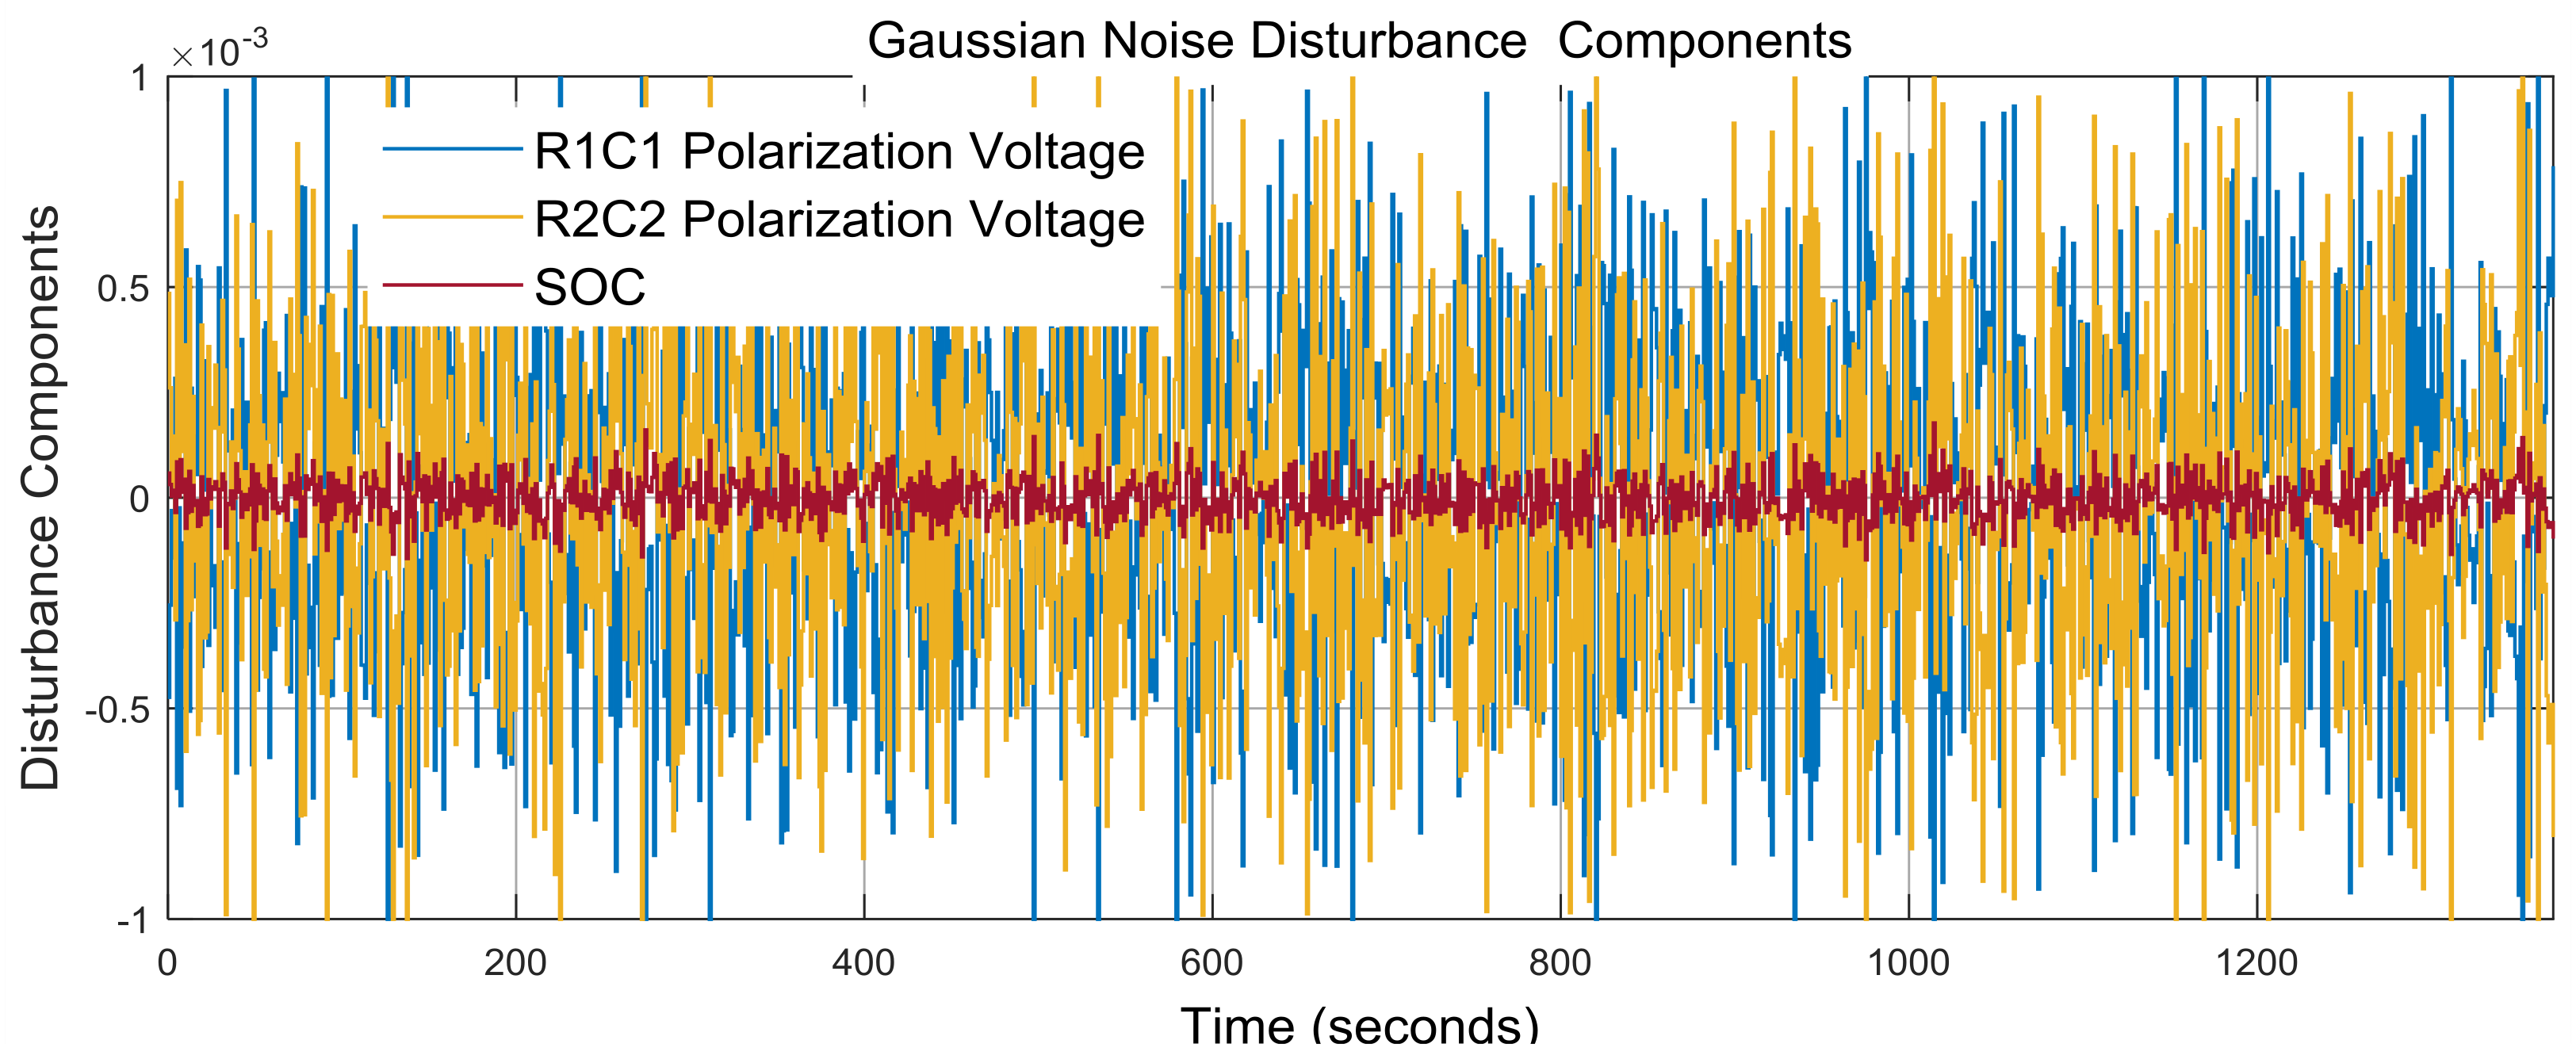
3.2. Real-Time PI Observer SOC Estimator

Using an additional integrator, the proportional integral observer (PIO) is reported in the literature to be a state estimator more robust with respect to modeling uncertainties, as is stated also in [2]. Since in reality, few modeling errors exist in the proposed 2RC EMC Li-Ion battery model, the PIO is considered capable to improve the accuracy and estimation speed of SOC estimation [2]. Thus, a PIO SOC real-time estimator is proposed in this section, and its corresponding SIMULINK model is shown as a block diagram in Figure 27. The EMC Li-Ion battery dynamics are described in state-space representation in a continuous time domain specified in Equations (11) and (12), implemented in real-time on SIMULINK, as is shown in Figure 28. In Figure 29, one can see the SIMULINK model of the integrated structure 2RC EMC Li-Ion battery observer estimator. The SIMULINK model of the PI Observer block is shown in Figure 30. Nevertheless, considering the modeling errors, capacity variation, and the additional output sensor noise, the 2RC EMC Li-Ion battery model given by (11) and (12) is not sufficient to model the entire dynamics of the Li-Ion battery.
The nonlinear part should be added to the 2RC EMC Li-Ion battery model, which could be described as follows:
d x ( t ) d t = A x ( t ) + B u ( t ) + E v ( x , u , t ) y ( t ) = C x ( t ) + D u ( t ) + ψ ( x ( t ) )
where E describes the influence of the nonlinearities included in the 2RC EMC Li-Ion battery states’ dynamics, and the disturbance v ( x , u , t ) describes the nonlinearities, unknown-inputs, and un-model dynamics of the battery and may be a nonlinear function of states, inputs and time, caused specially by the temperature and sensor noise, as is mentioned in [2]. Fortunately, for special applications from HEVs fields the variation rate of the temperature could be very slow, and thus d v ( x , u , t ) d t = 0 . Moreover, the operation temperature range for the Li-Ion battery is limited for the consideration of life cycle and safety operation. Consequently, as is stated in [2] the disturbance nonlinear function “ v ( x , u , t ) should also be in a small range due to the influence of temperature”. For a strict temperature control in HEVs applications, “the temperature would be stable after a short time, thus lim t v ( x , u , t ) exists for the influence of temperature”. In addition, “sensor failure could also be considered to be slow changing, and thus the assumption d v ( x , u , t ) d t = 0 could be reasonable”, as is mentioned also in [2]. Due to a small change rate, “the sensor drift could be neglected for a certain drive cycle from EVs/HEVs ADVISOR collection, as it changes very little for one-day drive of a particular vehicle, thus it is reasonable to assume that lim t v ( x , u , t ) = 0 for the influence of current sensor”, as is stated in [2].
As mentioned above, in Figure 30 you can see the SIMULINK block of PIO, designed according to the definition of double integrator PIO given in [2], and its dynamics are described by the following set of first order differential equations [2]:
d x ^ ( t ) d t = A x ^ ( t ) + B u ( t ) + K p ( y ( t ) y ^ ( t ) ) + K i 2 w ( t ) d w ( t ) d t = K i 1 ( y ( t ) y ^ ( t ) )
where x ^ ( t ) , w ( t ) are the estimated Li-Ion battery state vector, and a new scalar variable that penalizes the accumulation, i.e., by integration operation, of the error ( y ( t ) y ^ ( t ) ) between the 2RC EMC Li-Ion battery terminal output voltage y ( t ) and its estimated value by PIO real-time estimator. The vectors K p R 3 × 1 , K i 1 R 1 × 1 and K i 2 R 3 × 1 represent the proportional and integral gains, respectively. Their tuning values will be set by assuming as in [2] that the following matrix pair is observable:
( [ A E 0 0 ] , [ C 0 ] ) ,
that is equivalent to:
r a n k { [ A K i 2 C 0 ] } = n + r = 3 + 1 = 4
where n, r are the 2RC EMC Li-Ion battery model dimension, i.e., n = 3 (states), and the Li-Ion battery terminal voltage dimension, i.e., r = 1, respectively. Through a poles assignment procedure [2], and performing some matrix manipulations in Equation (29) we obtain the most suitable tuning values for each of PIO real-time estimator parameters, such as:
K i 2 = [ 0.00028749 0.0028 0.00001 ] , E = K i 2 , K i 1   =   0.00001 , K p = [ 0.00001 0.0001 0.008 ]
Remark 1: 
The elements of vector K p R 3 × 1 and the value of the scalar gain K i 1 are tuned by trial and error procedure, similar the one used to tune PI controller parameters, until you get the best SOC estimation performance.
The Simulink model of the disturbance and noise generator is shown in Figure 31.

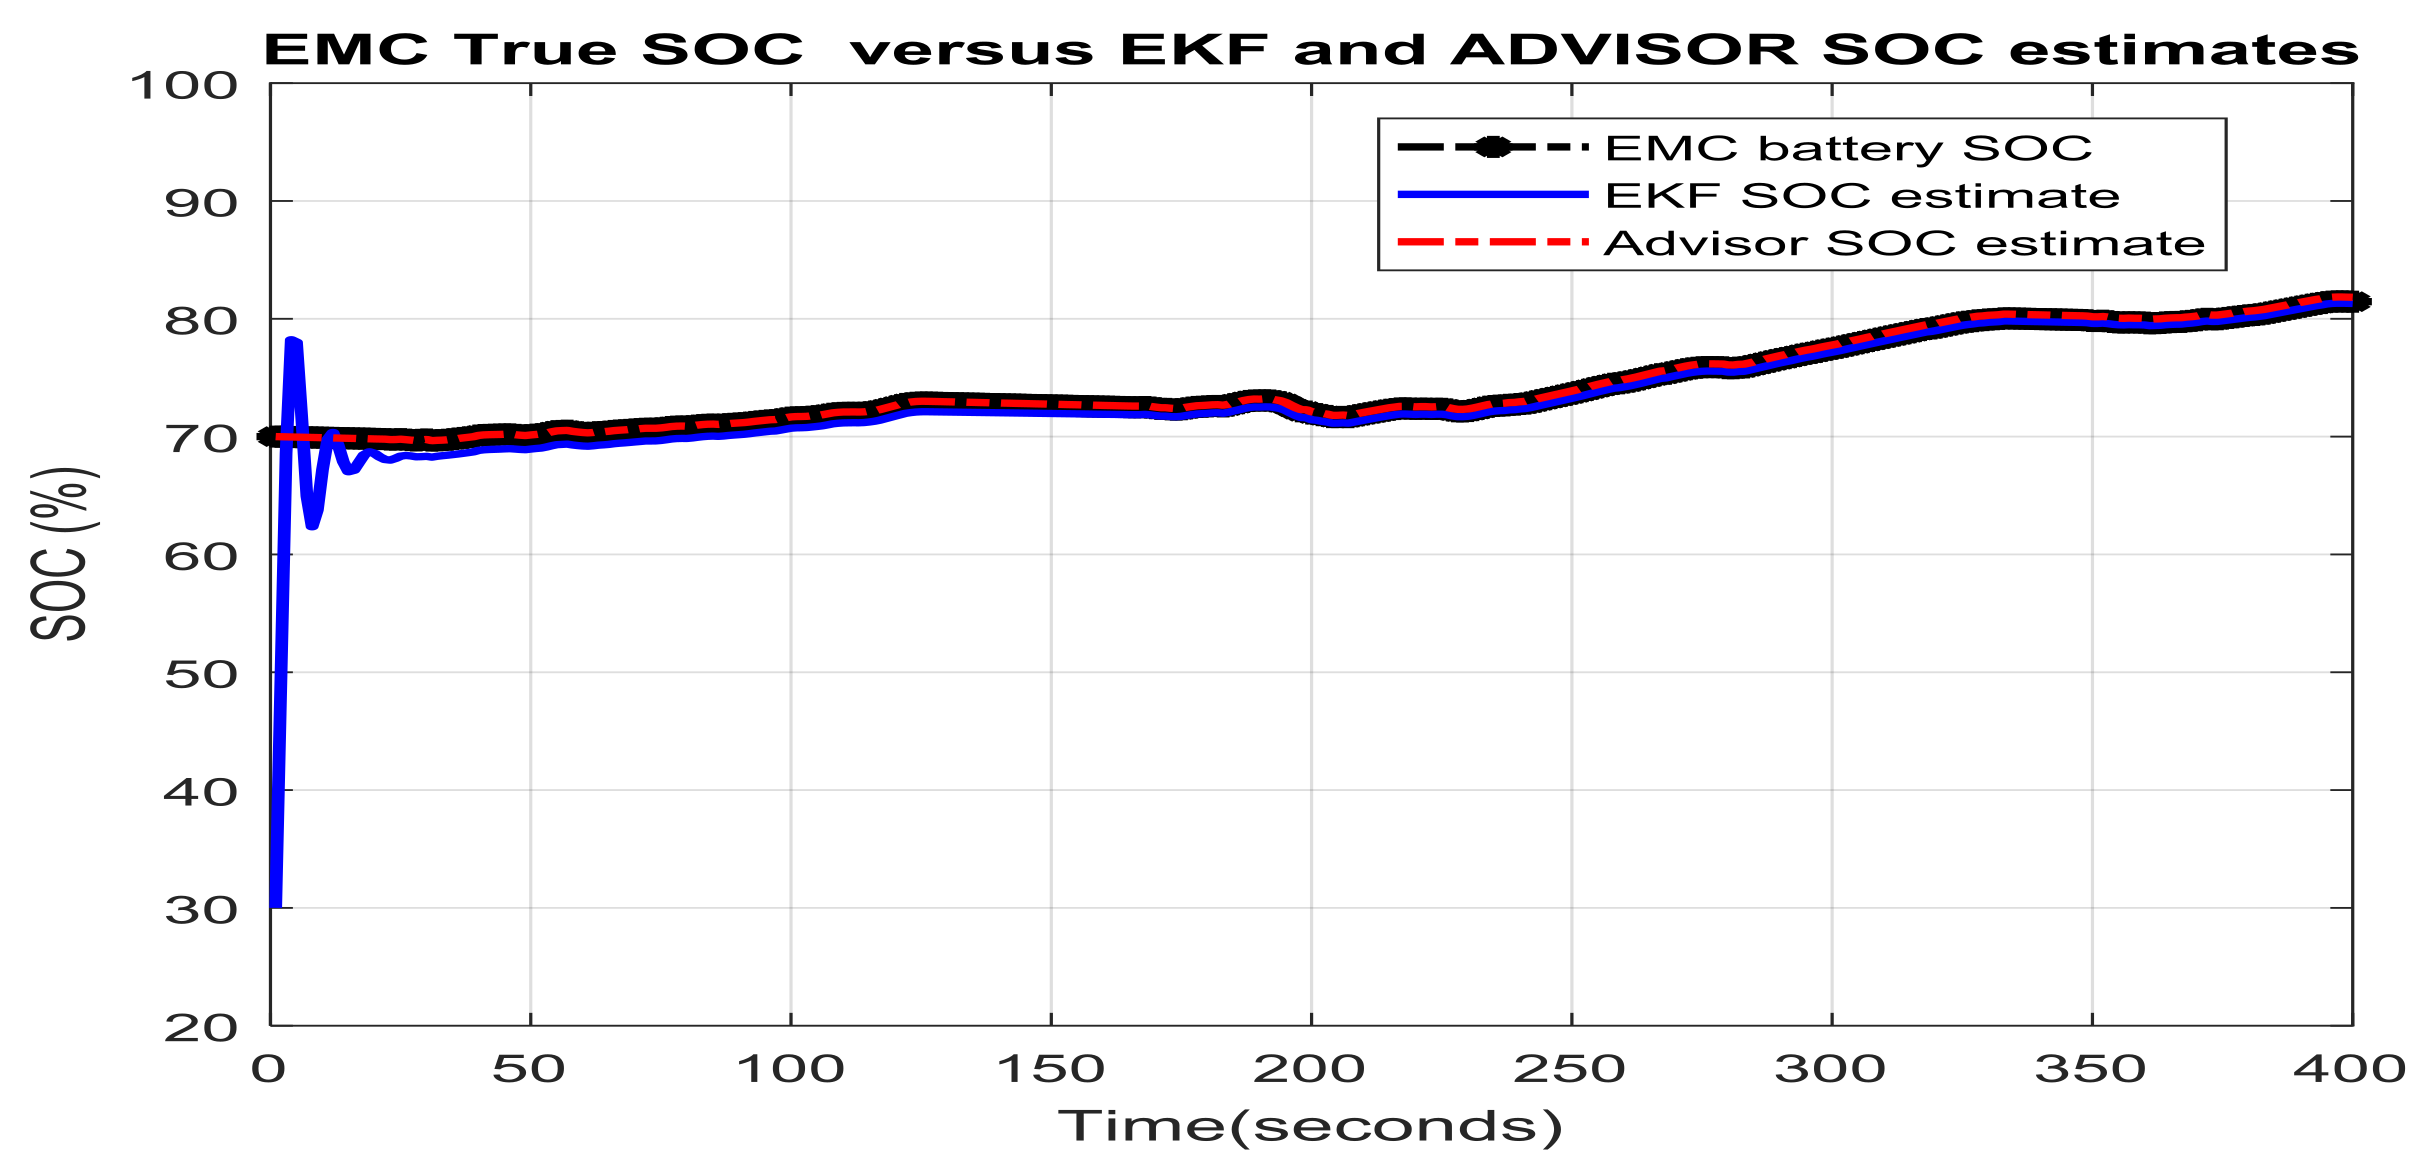
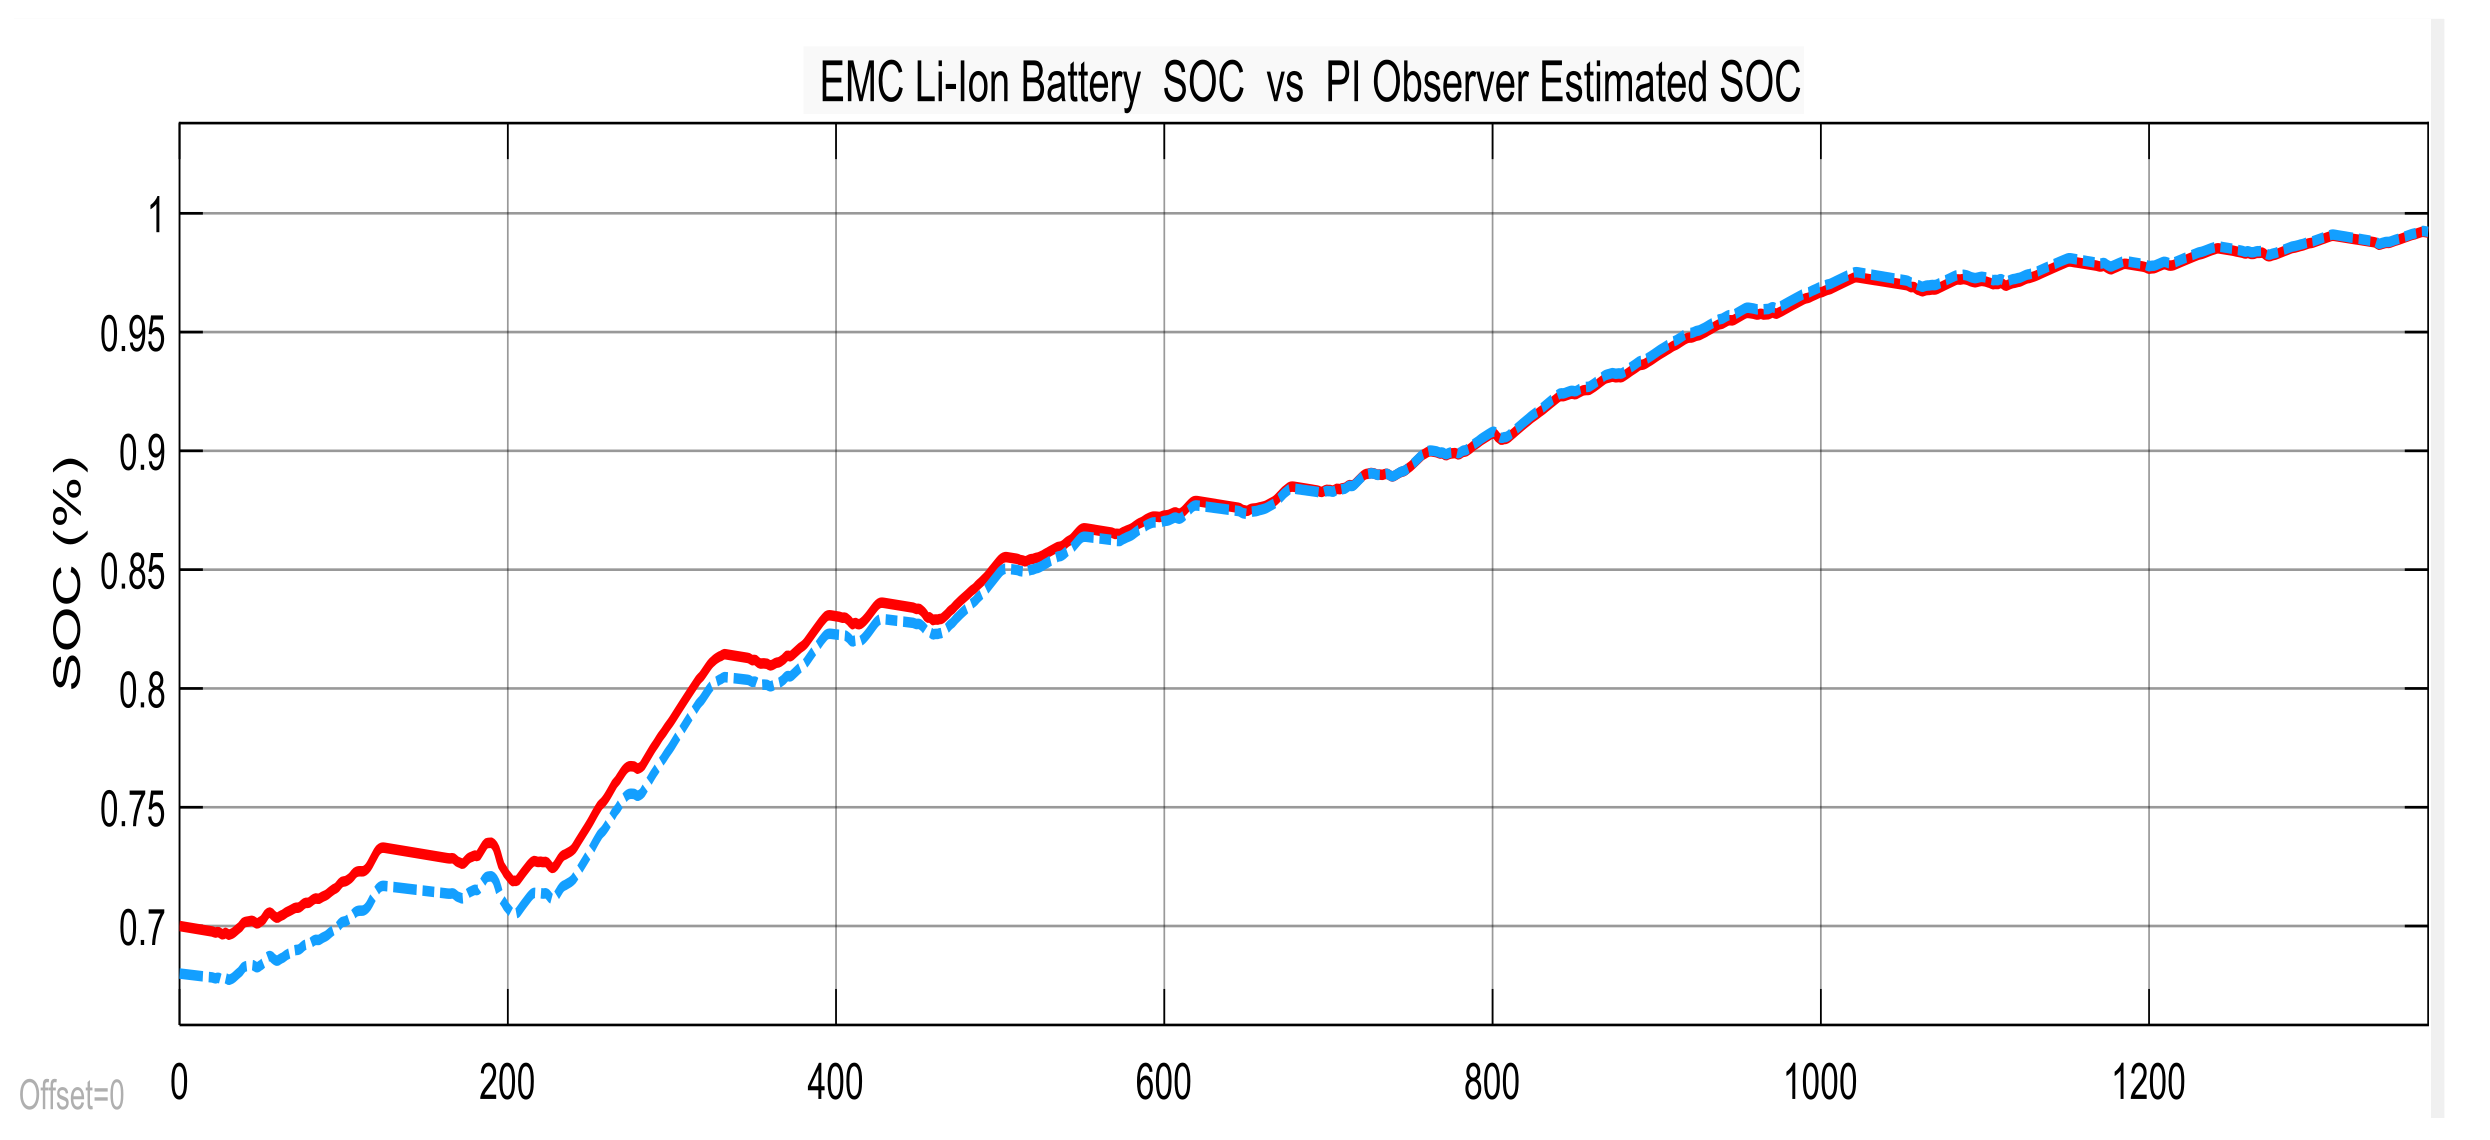
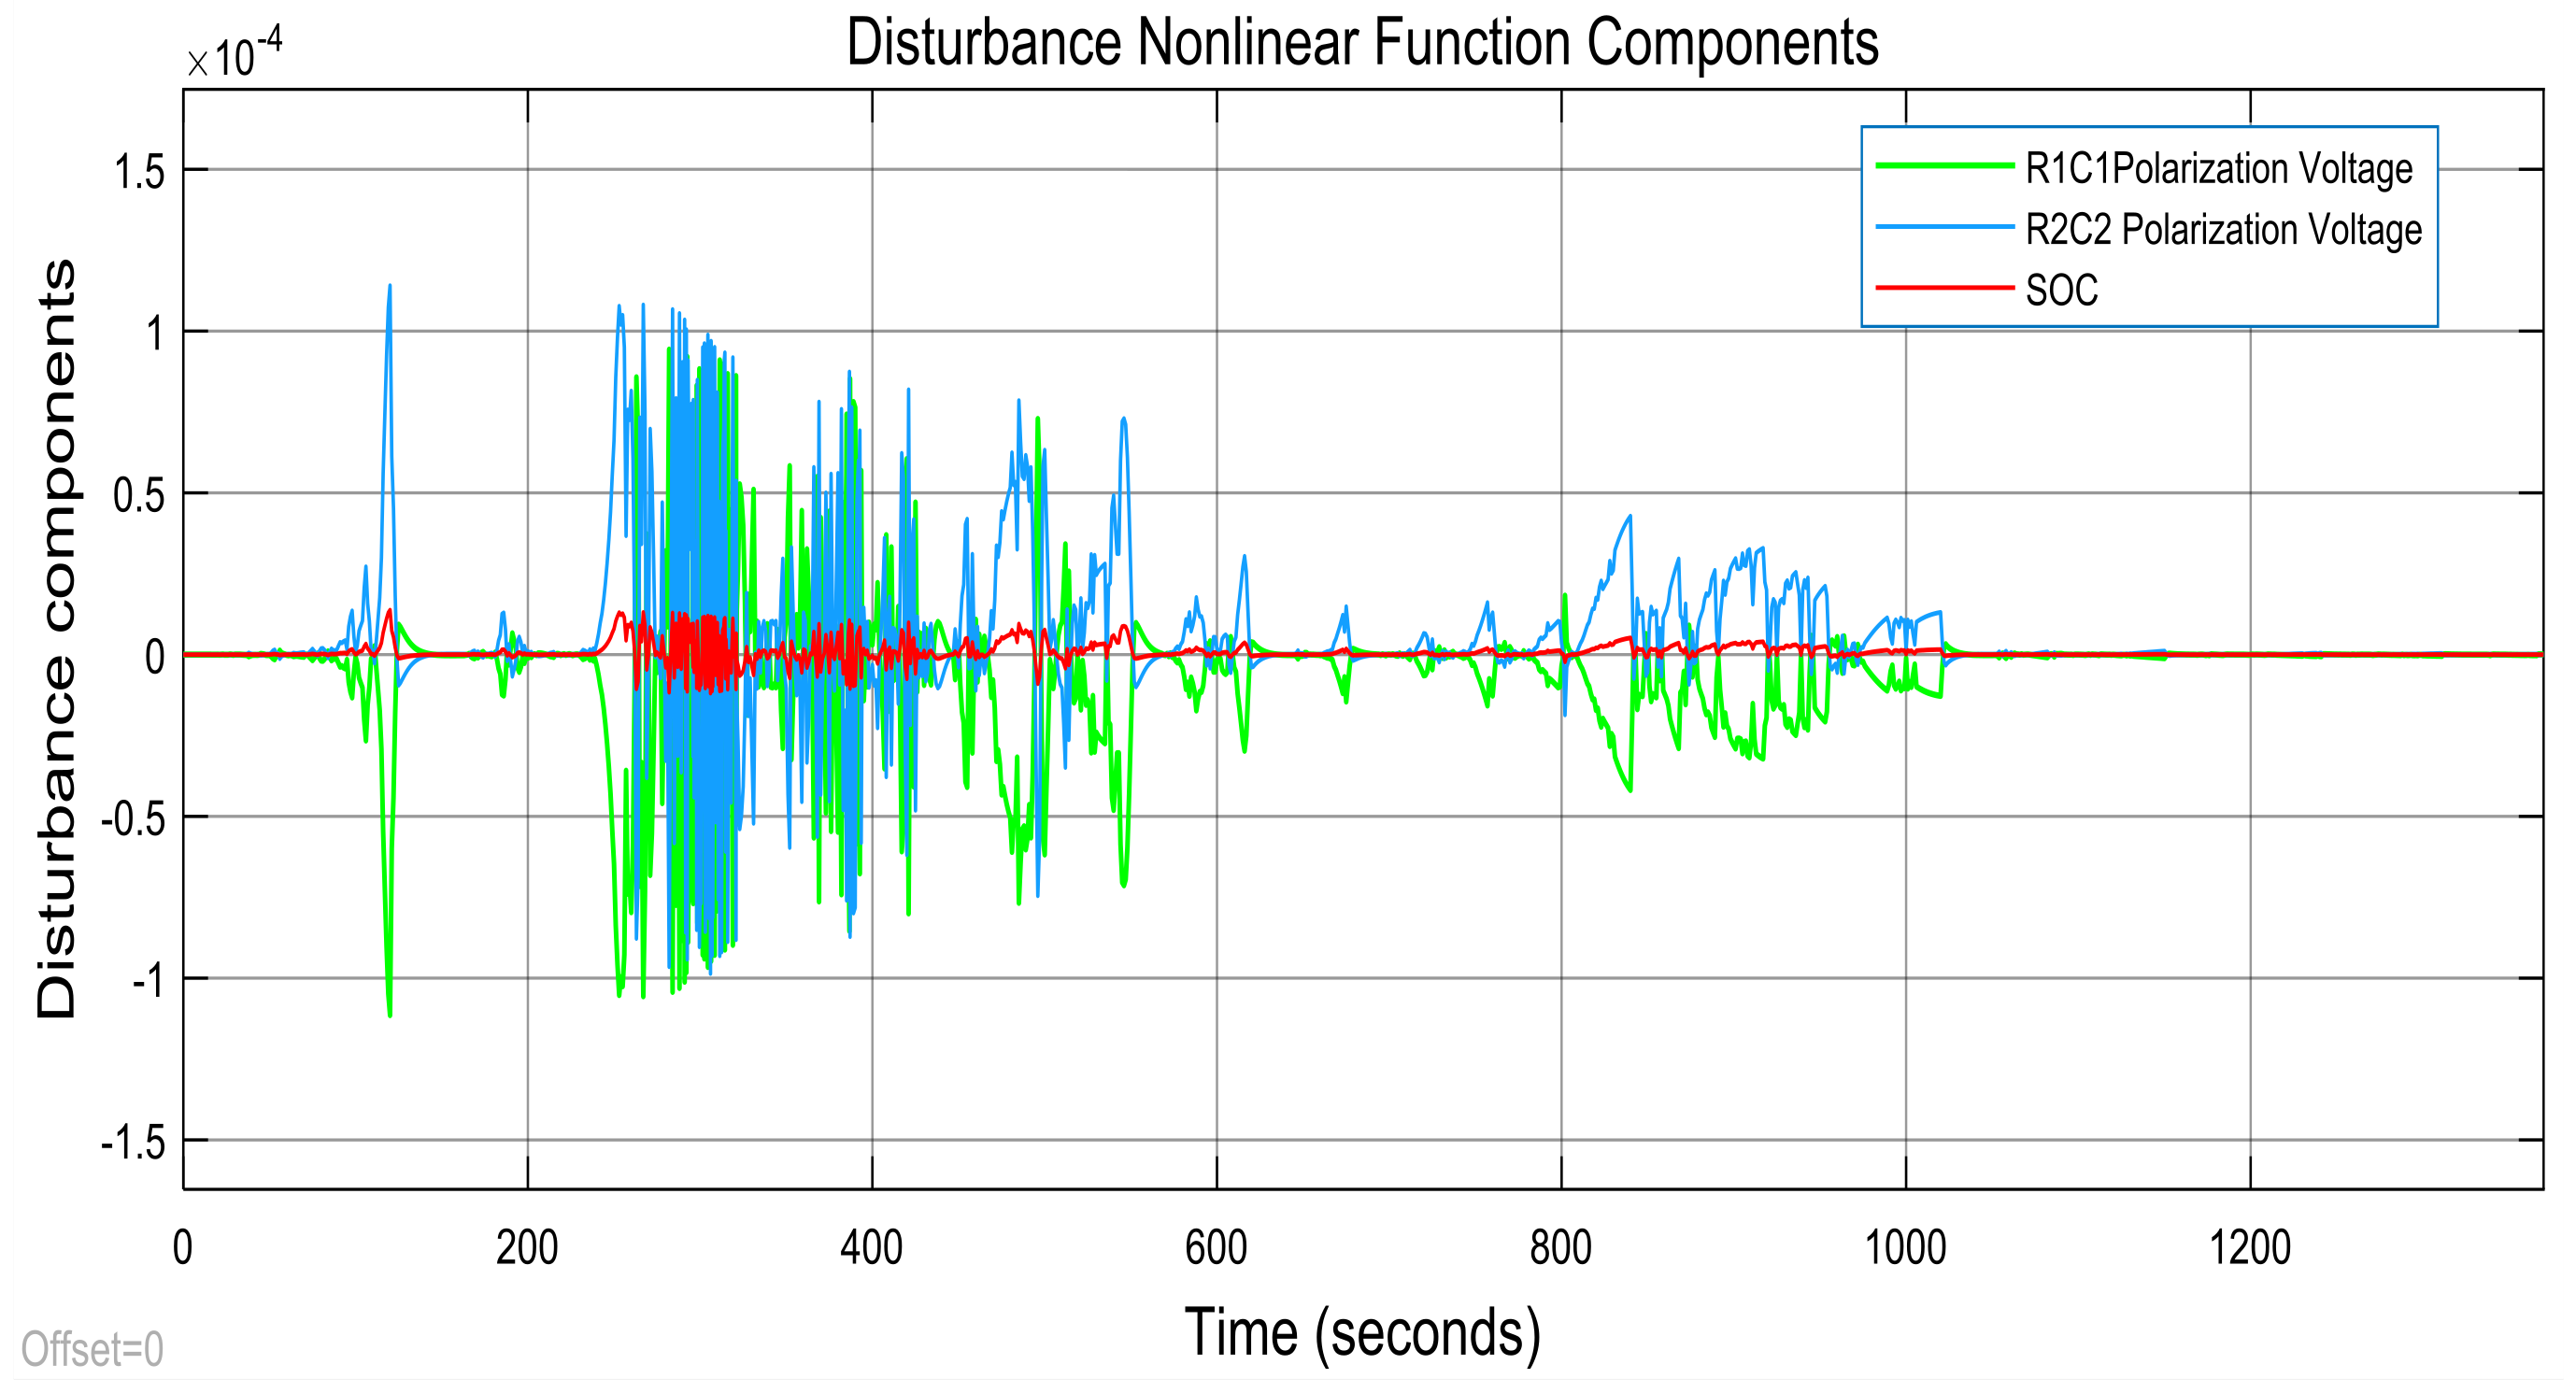
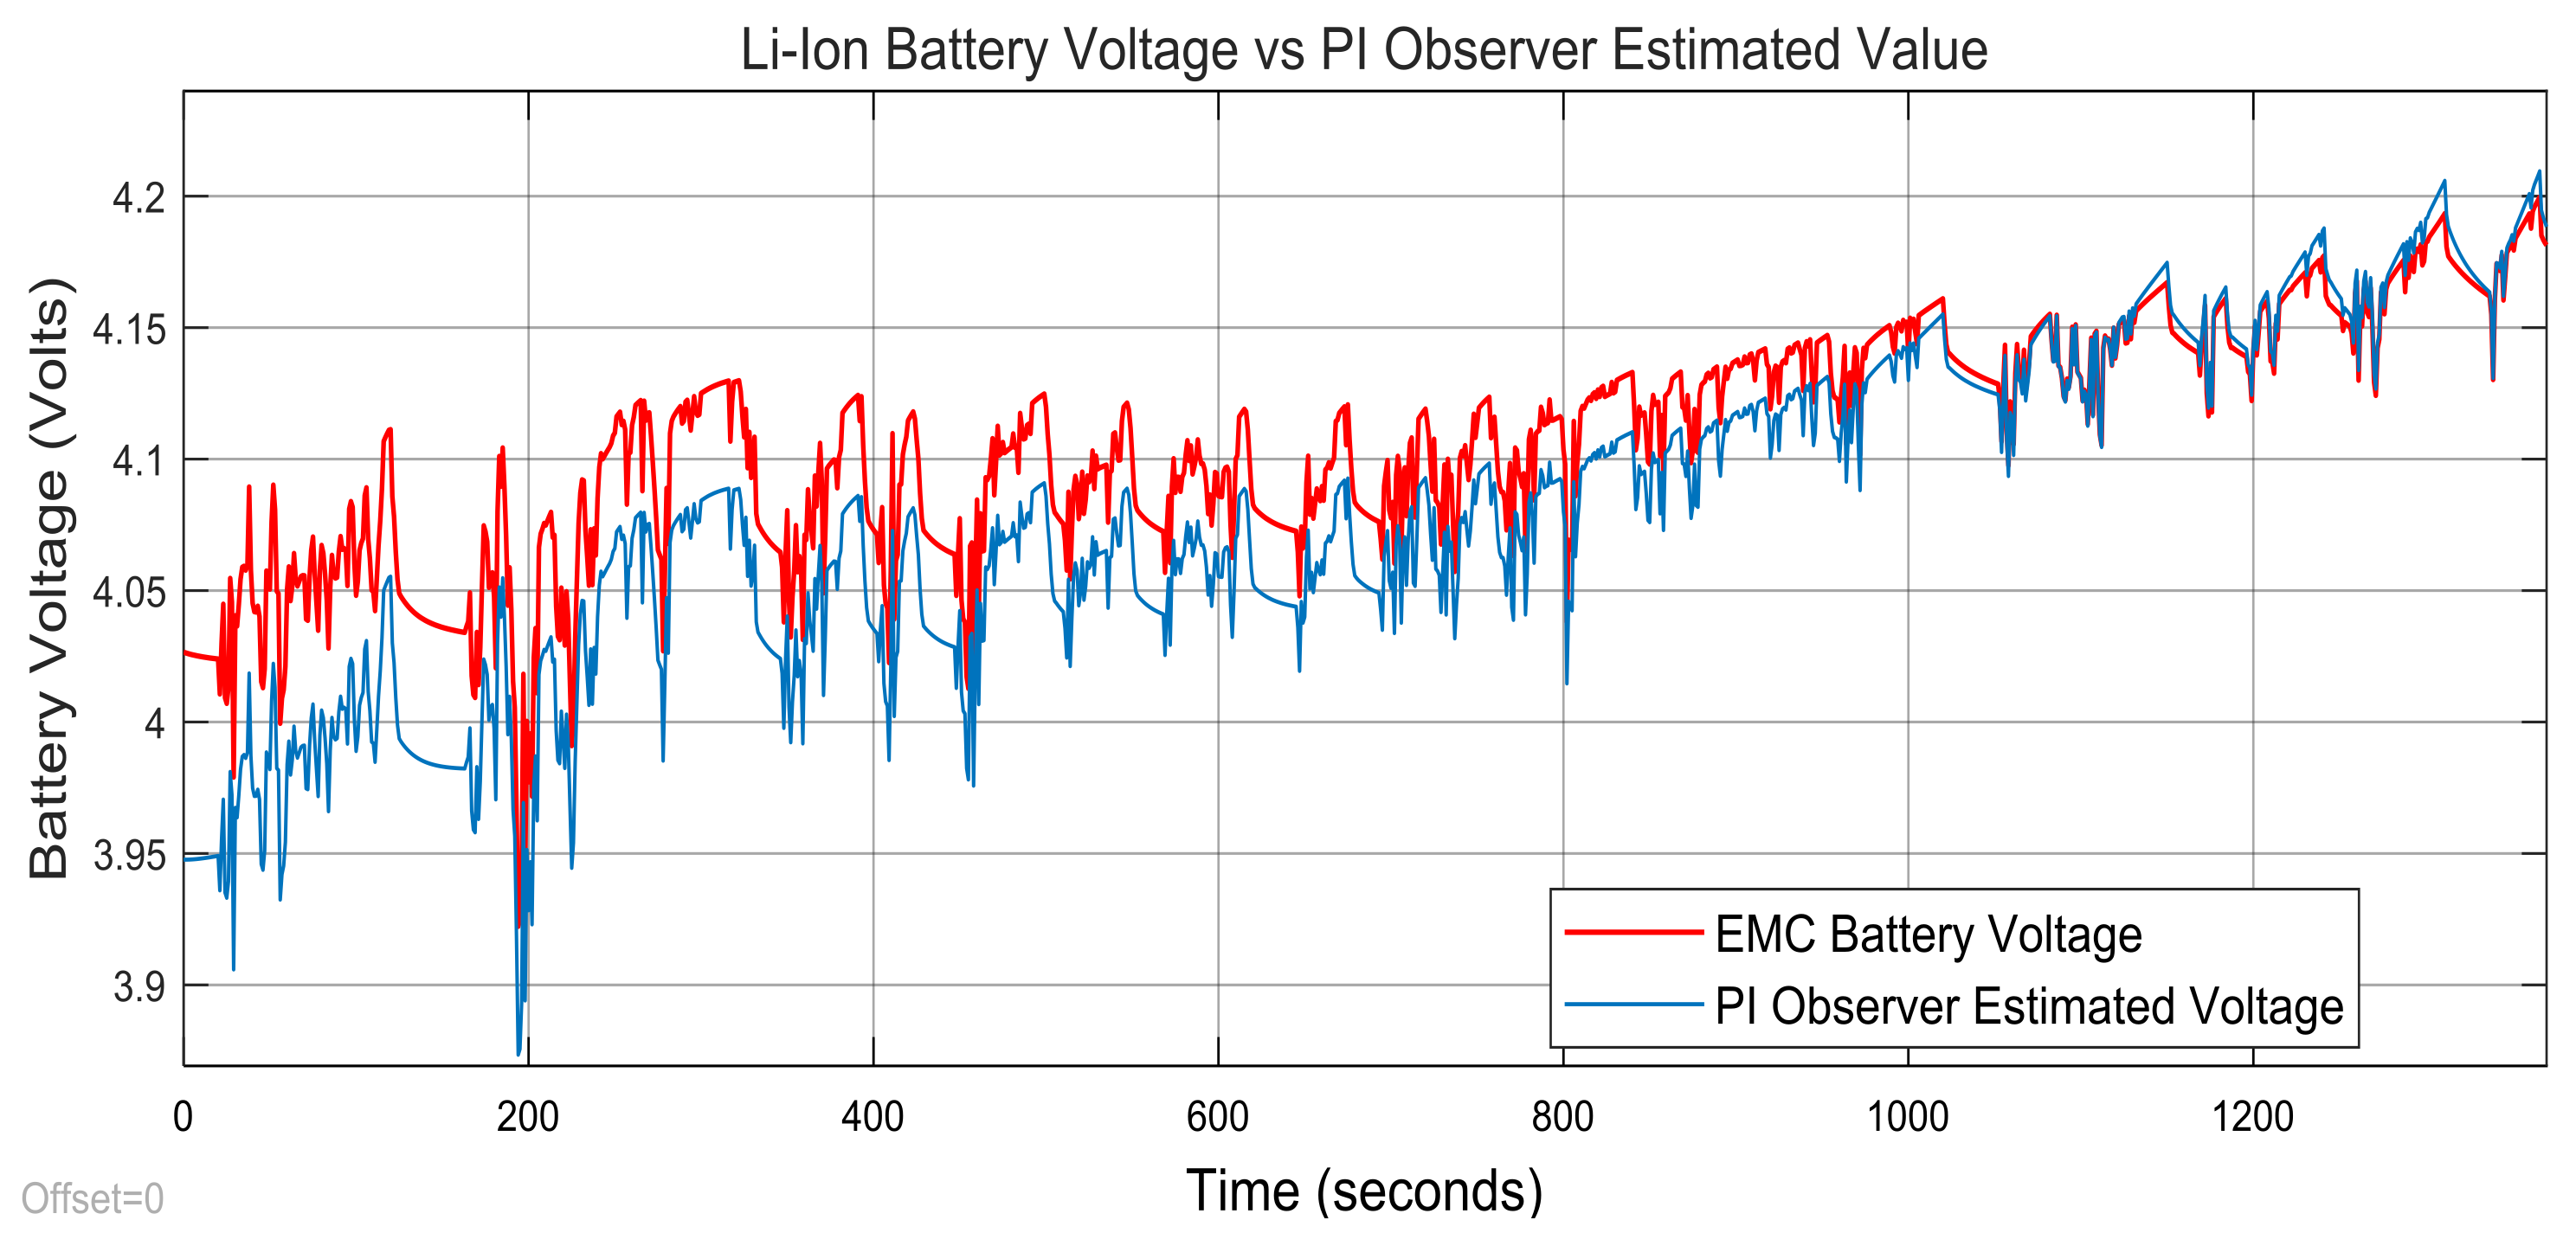
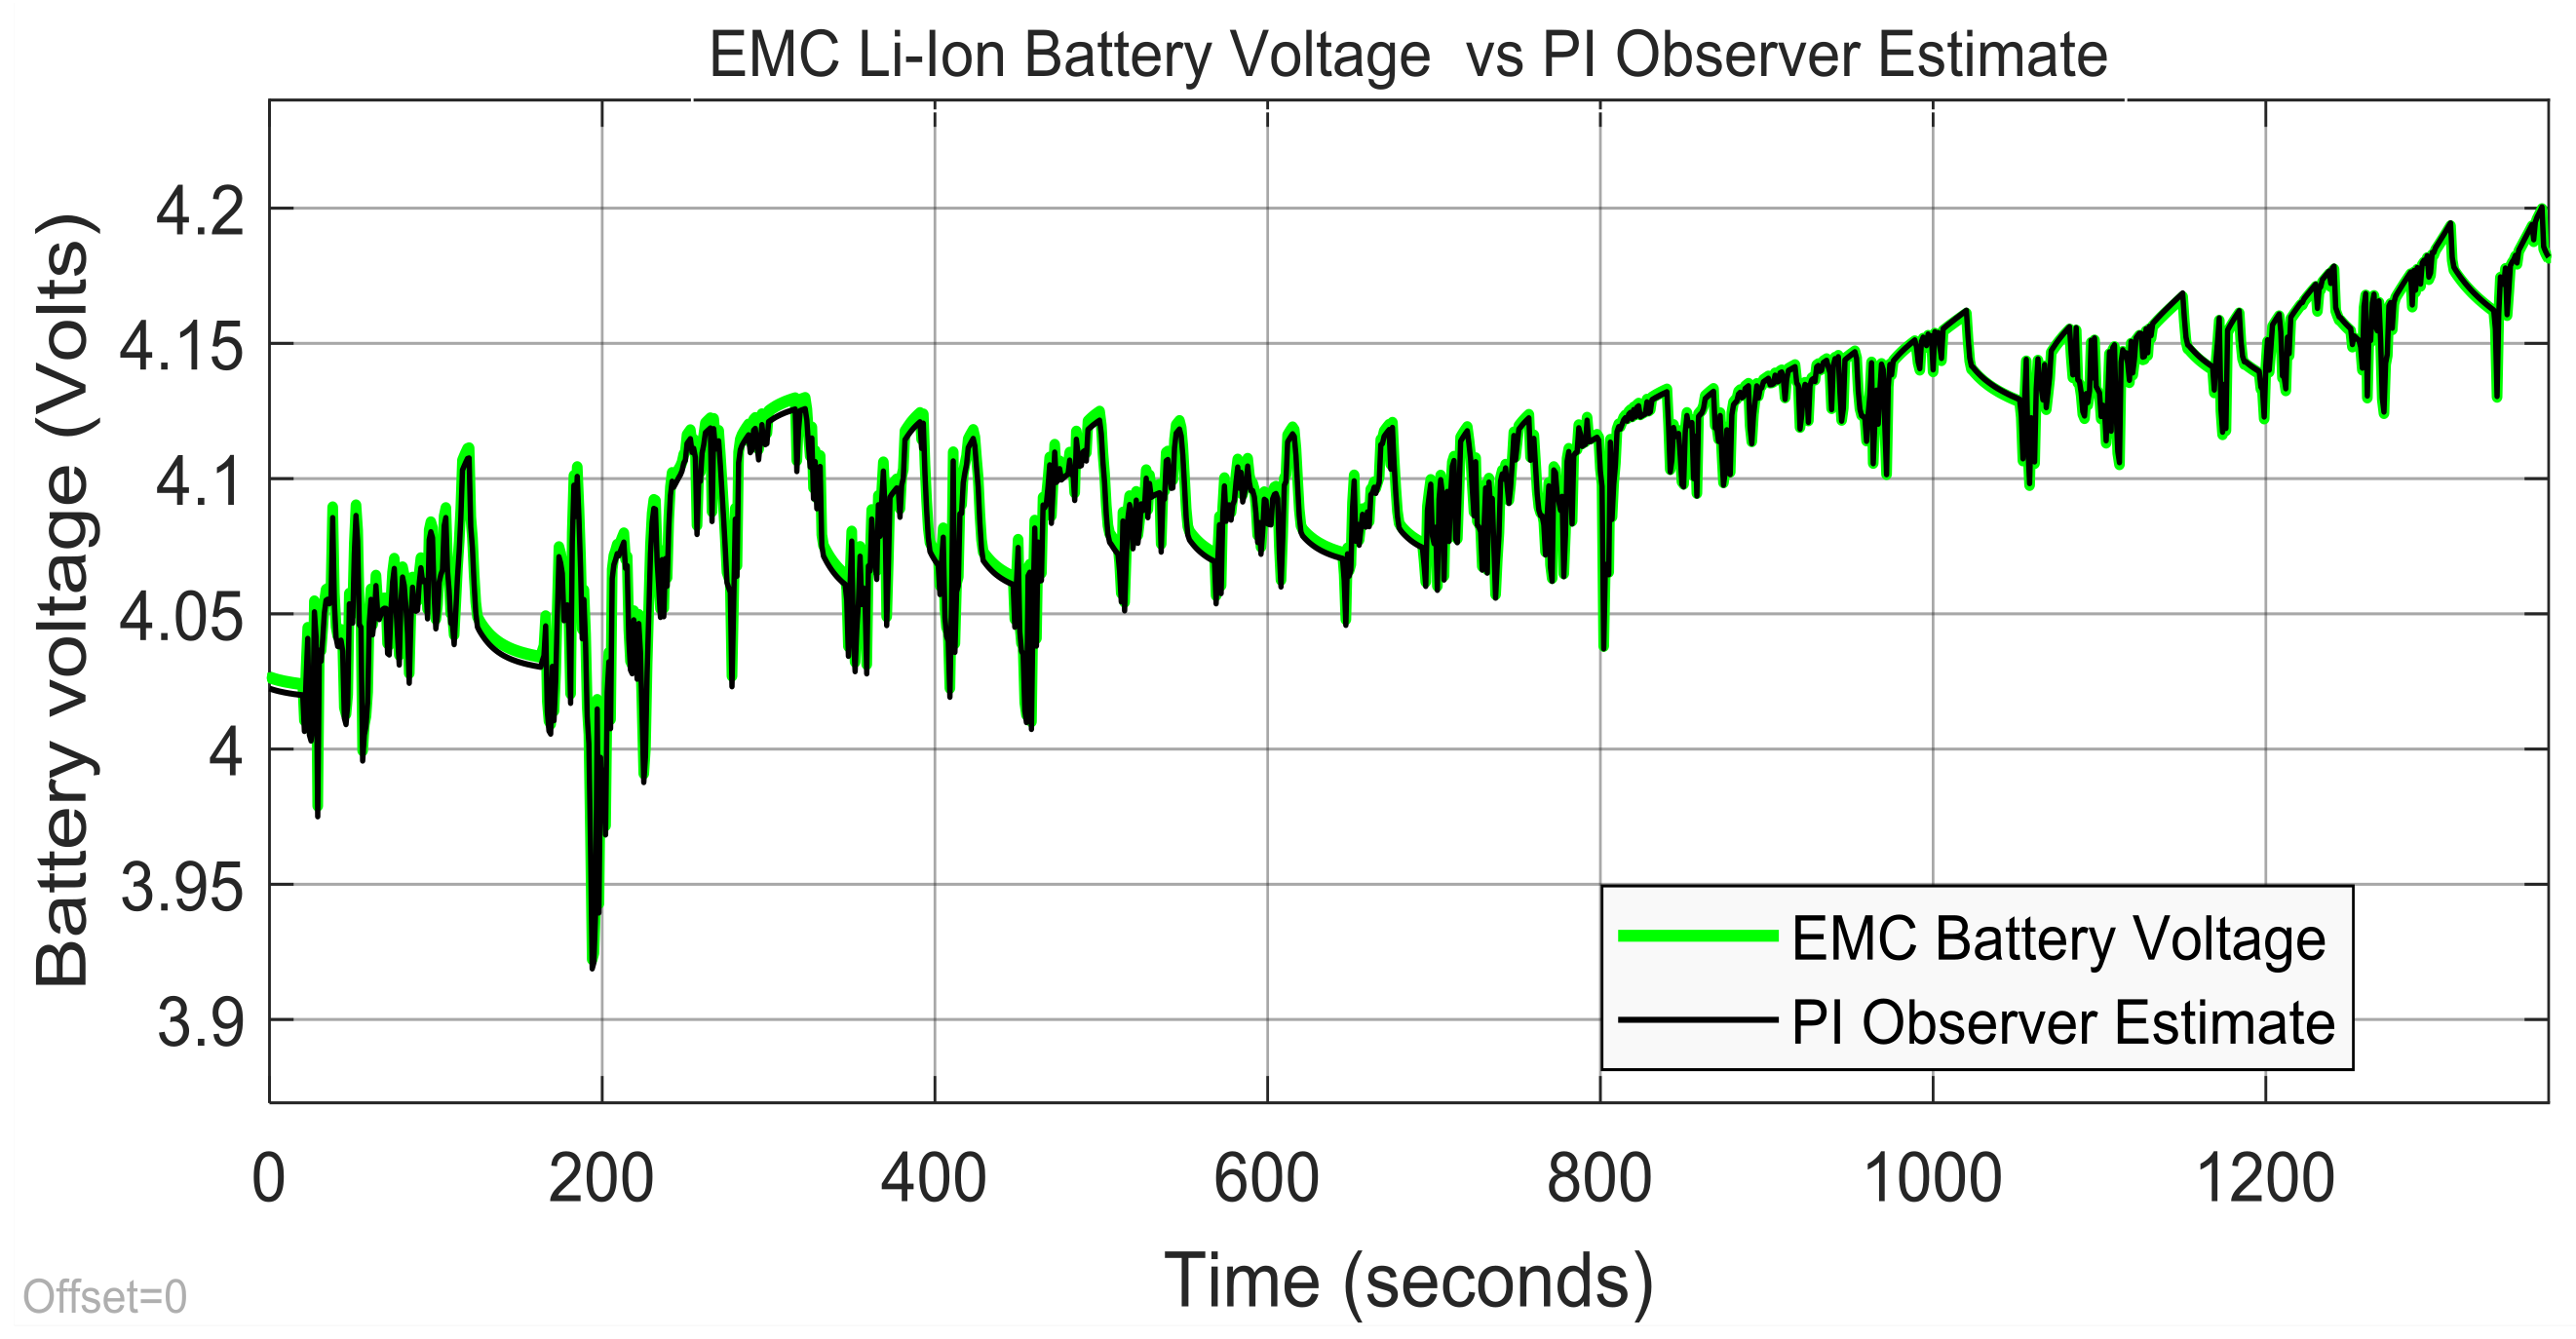
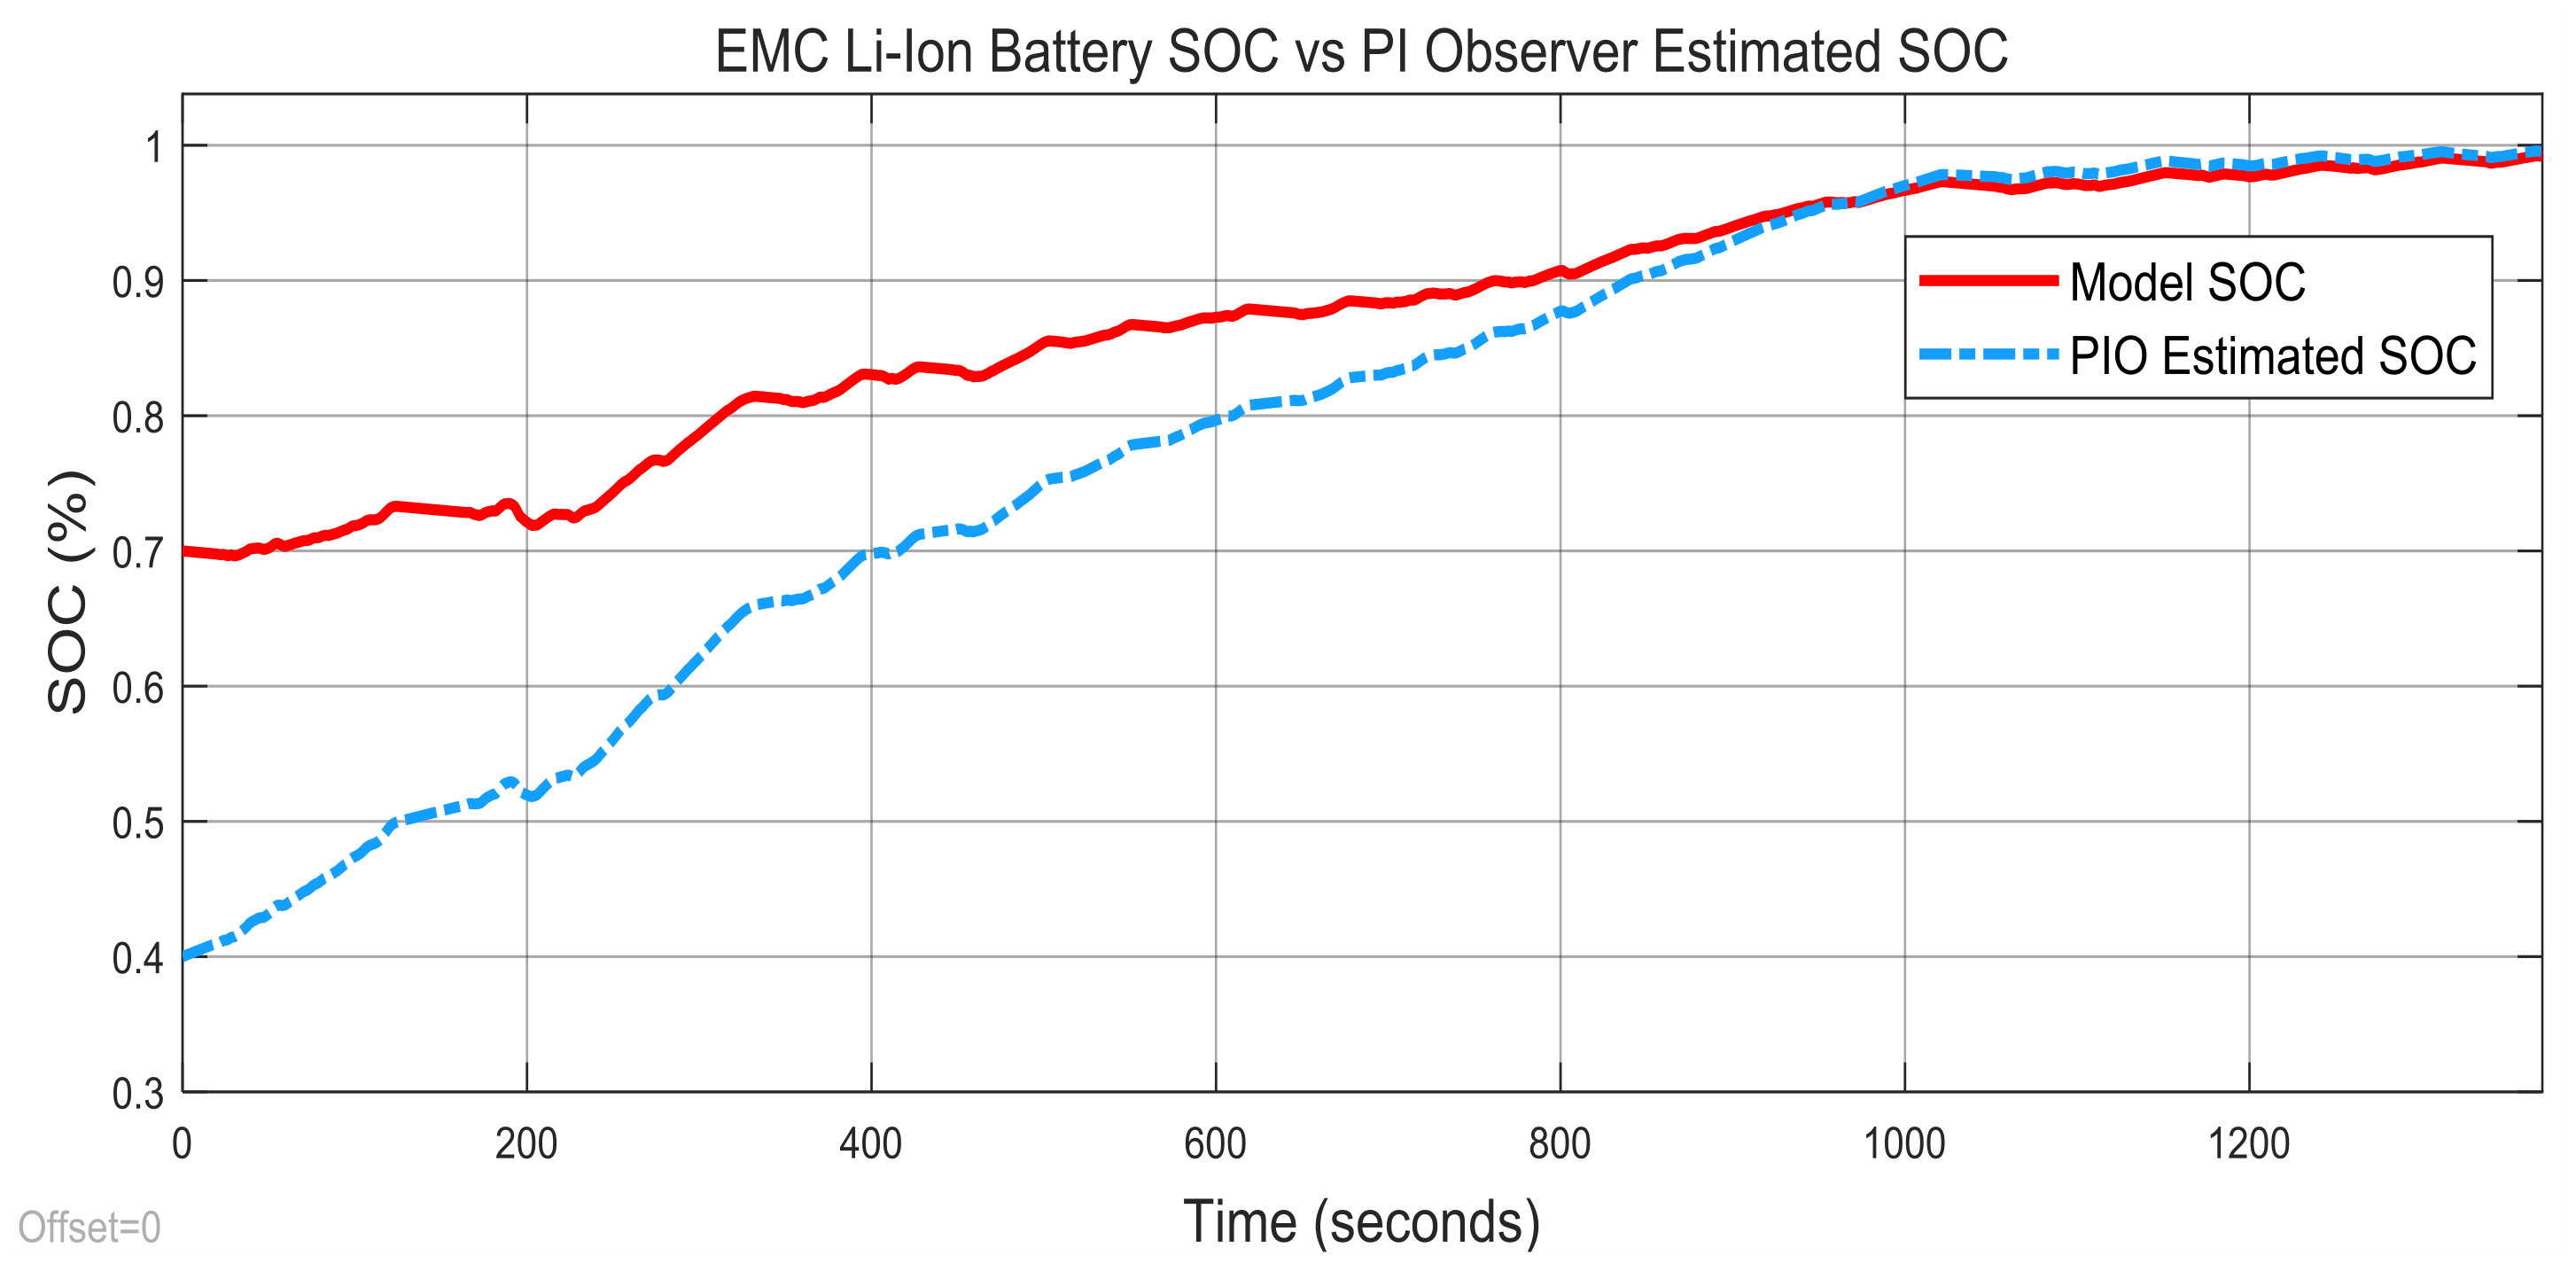
3.3. Real-Time PIO SOC Estimator SIMULINK Simulation Results

The simulation results of PIO real-time estimator are shown in Figure 32, Figure 33, Figure 34, Figure 35, Figure 36, Figure 37, Figure 38 and Figure 39.
These results are split into two distinct groups, the first one contains the SIMULINK simulation results that prove the PIO estimator robustness to changes in initial SOC value from 70 to 40% and to one disturbance representing a slow nonlinear function v(x,u,t), as shown in Figure 32, Figure 33, Figure 34, Figure 35 and Figure 36 The second contains the SIMULINK simulation results that also prove the robustness of 2RC EMC PIO real time estimator to the same changes in initial SOC value mentioned above, and in addition, the robustness to a Gaussian white noise of zero mean and standard deviation, σ = 0.001 shown in Figure 37, Figure 38 and Figure 39. The SIMULINK simulation results reveal a good convergence, very good accuracy after approximately 1000 s, and the convergence speed being slow compared to both 2RC and 3RC EMC EKF SOC real-time estimators. The PIO real-time estimator is robust to changes in initial SOC value, and to the slow varying disturbance as a nonlinear function or current sensor noise level.
Summarizing this section, we can say that it is not really necessary to build a benchmark based on the performance assessment in terms of error statistics, such as root mean square error (RMSE), mean absolute error (MAE), and mean square error (MSE) [10] as long as it is much simpler to perform a visual examination of MATLAB and SIMULINK simulations performance results of both proposed SOC estimators on similar graphs, and you can see that the EKF estimator performs better than PIO in terms of simplicity, robustness, estimation accuracy, and convergence speed. This is an improved 3RC EMC Li-Ion battery model. So, the most suitable real time estimator for this kind of HEVs applications is the EKF SOC estimator.

4. Conclusions

In this research article, we propose two suitable models for a particular HEV Li-Ion battery, the first one is of high simplicity and accuracy, easy to be implemented in real time and provides a beneficial support to build two real-time SOC estimators, namely, EKF and PIO SOC estimators. To have a good insight into the realistic battery life environment, a new improved 3RC EMC Li-Ion battery model with time varying parameters and dependent on SOC and temperature, dynamically updated based on a thermal model, is investigated. This improved model selection is a good support to prove the robustness of the proposed EKF SOC estimator to the model parameter changes from all four models extracted at different temperatures, as is shown in Section 3.1.2. The robustness is also investigated for:
  • changes (increase or decrease) in SOC initial values
  • simultaneous changes in SOC initial value and measurement current sensor noise level
  • simultaneous changes in SOC initial value and changes in internal resistance of Li-Ion battery due to the effects mentioned in Section 2.1, especially the temperature effects
  • simultaneous changes in SOC initial value and the nominal value of the battery capacity due to aging and/or temperature effects
By a rigorous performance analysis of MATLAB and SIMULINK simulation results for both proposed real time SOC estimators in terms of convergence speed, robustness, SOC estimation accuracy, battery terminal voltage prediction and real time implementation simplicity, in our opinion the EKF SOC estimator is the most suitable real time estimator for this kind of HEVs applications compared to PIO SOC estimator. For sure, in other HEVs applications, perhaps the PIO SOC real time estimator could perform better than the EKF SOC estimator, especially considering its main drawback of required model linearization, so an important limitation in accurately capturing the entire dynamics of the battery. Many other topics remain open for future investigations, such as accurate online SOC estimation that needs reliable cell current measurements. This is difficult for the battery pack in the balancing process due to the existence of balancing current and this challenge is not solved in the literature. In the future work, we are interested to develop real time adaptive and fuzzy logic SOC estimation strategies for batteries of different chemistries, for which the battery models will be further improved by integrating the effect of degradation, temperature and SOC effects. Regarding the level of the battery pack performance, we are interested in improving it by considering mismatches among the battery cells and the non-uniformity of the temperature distribution in the cell (balancing cells), modules and battery pack. However, this can further complicate the calculations that should be done by the BMS in real time.

Author Contributions

Tudoroiu Roxana-Elena and Radu Mihai-Sorin conceived the algorithms and prepared the manuscript. Tudoroiu Nicolae and Zaheeruddin Mohammed performed the algorithms simulations on real-time MATLAB/SIMULINK platform, and analyzed the simulations results.

Conflicts of Interest

The authors declare no conflict of interest.

Abbreviations

NiCadnickel cadmium
NiMHnickel metal hydride
Li-Ionlithium-ion
EVelectric vehicle
HEVhybrid electric vehicle
BMSbattery management system
EMCequivalent model circuit
ADVISORadvanced vehicle simulator
EPAenvironmental protection agency
UDDSurban dynamometer driving schedule
FTP-75federal test procedure at 75 F
FEfuel economy
HWFEThighway fuel economy test
OCVopen-circuit voltage
EKFextended Kalman filter
PIOproportional-integral observer
SOHstate of health
DODdepth of discharge
NRELnational renewable energy laboratory
UKFunscented Kalman filter
EnKFensemble Kalman filter
PFparticle filter

References

  1. Young, K.; Wang, C.; Wang, L.Y.; Strunz, K. Electric Vehicle Battery Technologies: Chapter 2. In Electric Vehicle Integration into Modern Power Networks, 1st ed.; Garcia-Valle, R., Peças Lopes, J., Eds.; Springer: New York, NY, USA, 2013; pp. 15–26. [Google Scholar] [CrossRef]
  2. Xia, B.; Zheng, W.; Zhang, R.; Lao, Z.; Sun, Z. A novel observer for Lithium-Ion battery state of charge estimation in electric vehicles based on a second-order equivalent circuit model. Energies 2017, 10, 1150. [Google Scholar] [CrossRef]
  3. Farag, M. Lithium-Ion Batteries, Modeling and State of Charge Estimation. Master’s Thesis, McMaster University of Hamilton, Hamilton, ON, Canada, 2013. [Google Scholar]
  4. Cui, X.; Shen, W.; Zhang, Y.; Hu, C. A Novel Active Online State of Charge Based Balancing Approach for Lithium-Ion Battery packs during Fast Charging process in Electric Vehicles. Energies 2017, 10, 1766. [Google Scholar] [CrossRef]
  5. Lowe, M.; Tokuoka, S.; Trigg, T.; Gereffi, G. Li-Ion Batteries for Electric Vehicles. The US Chain; Research Report; Center on Globalization Governance and Competitiveness: Durham, NC, USA, 2010; pp. 1–68. Available online: https://unstats.un.org/unsd/trade/s_geneva2011/refdocs/RDs/Lithium-Ion%20Batteries%20 (Gereffi%20-%20May%202010).pdf (accessed on 17 March 2018).
  6. Plett, G.L. Extended Kalman filtering for battery management systems of LiPB-based HEV battery packs: Part 1. Background. J. Power Sources 2004, 134, 252–261. [Google Scholar] [CrossRef]
  7. Plett, G.L. Extended Kalman filtering for battery management systems of LiPB-based HEV battery packs: Part 2. Modeling and identification. J. Power Sources 2004, 134, 262–276. [Google Scholar] [CrossRef]
  8. Plett, G.L. Extended Kalman filtering for battery management systems of LiPB-based HEV battery packs: Part 3. State and parameter estimation. J. Power Sources 2004, 134, 277–292. [Google Scholar] [CrossRef]
  9. Simon, J.J.; Uhlmann, J.K. A New Extension of the Kalman Filter to Nonlinear Systems. In Process of AeroSense, Proceedings of the 11th International Symposium on Aerospace/Defense Sensing, Simulation and Controls, Orlando, FL, USA, 21–24 April 1997; SPIE: Orlando, FL, USA, 1997; Available online: https://people.eecs.berkeley.edu/~pabbeel/cs287-fa09/readings/JulierUhlmann-UKF.pdf (accessed on 21 January 2018).
  10. Tudoroiu, N.; Radu, S.M.; Tudoroiu, E.-R. Improving Nonlinear State Estimation Techniques by Hybrid Structures, 1st ed.; LAMBERT Academic Publishing: Saarbrucken, Germany, 2017; 56p, ISBN 978-3-330-04418-0. [Google Scholar]
  11. Xu, J.; Cao, B. Battery Management System for Electric Drive Vehicles-Modeling State Estimation and Balancing—Chapter 4. In New Applications of Electric Drives, 1st ed.; Chomat, M., Ed.; INTECH: Rijeka, Croatia, 2015; pp. 87–113. [Google Scholar] [CrossRef]
  12. Johnson, V.H. Battery Performance Models in ADVISOR. J. Power Sources 2001, 110, 321–329. [Google Scholar] [CrossRef]
  13. Tremblay, O.; Dessaint, L.A. A Generic Battery Model for the Dynamic Simulation of Hybrid Electric Vehicles. In Proceedings of the IEEE Vehicle Power and Propulsion Conference VPPC 2007, Arlington, TX, USA, 9–12 September 2007; pp. 284–289. [Google Scholar] [CrossRef]
  14. Xing, Y.; Ma, E.W.M.; Tsui, K.L.; Pecht, M. Battery Management Systems in Electric and Hybrid Vehicles. Energies 2011, 4, 1840–1857. [Google Scholar] [CrossRef]
  15. Jiang, J.; Zhang, C. Fundamentals and Applications of Lithium-Ion Batteries in Electric Drive Vehicles, 1st ed.; John Wiley & Sons: Singapore, 2015; 300p, ISBN 978-1-118-41478-1. [Google Scholar]
  16. Wipke, K.B.; Cuddy, R.M. Using an Advanced Vehicle Simulator (ADVISOR) to Guide Hybrid Vehicle Propulsion System Developmen; Research Gate Net; National Renewable Energy Laboratory: Golden, CO, USA, 1996; Available online: https://www.researchgate.net/publication/255260311Using_an_advanced_vehicle_simulator_ADVISOR_to_guide_hybrid_vehicle_propulsion_system_development (accessed on 4 March 2018).
  17. [Internet]. Evaluation and Adaption of 5-Cycle FE Testing and Calculations for HEV. US Department of Energy, Argonne National Laboratory, 15 May 2012; p. 4. Available online: https://www.energy.gov/sites/prod/files/2014/03/f10/vss065_lohsebusch_2012_o.pdf (accessed on 15 March 2018).
  18. Lakkis, M.E.; Sename, O.; Corno, M.; Bresch, P.D. Combined battery SOC/SOH estimation using a nonlinear adaptive observer. In Proceedings of the European Control Conference, Linz, Austria, 15–17 July 2015; Available online: https://www.researchgate.net/publication/308863249_Combined_battery_SOCSOH_estimation_using_a_nonlinear_adaptive_observer (accessed on 17 March 2018).
  19. [Internet]. Battery and Engineering Technologies. Battery Life (and Death). Available online: http://www.mpoweruk.com/life.htm (accessed on 18 March 2018).
  20. Taesic, K. A Hybrid Battery Model Capable of Capturing Dynamic Circuit Characteristics and Nonlinear Capacity Effects. Master’s Thesis, University of Nebraska, Lincoln, NE, USA, 2012. [Google Scholar]
  21. Prasanna Mantravadi, S.R. Modeling, Simulation & Implementation of Li-Ion Battery Powered Electric and Plug-In Hybrid Vehicles. Master’s Thesis, University of Akron, Akron, OH, USA, 2011. [Google Scholar]
  22. Moshirvaziri, A. Lithium-Ion Battery Modeling for Electric Vehicles and Regenerative Cell Testing Platform. Master’s Thesis, University of Toronto, Toronto, ON, Canada, 2013. Available online: https://www.academia.edu/8205872/LITHIUM-ION_BATTERY_MODELING_for_ELECTRIC_VEHICLES_and_REGENERATIVE_CELL_TESTING_PLATFORM (accessed on 18 March 2018).
Figure 1. The second order 2RC Li-Ion battery EMC represented in National Instruments Multisim 14.1 editor.
Batteries 04 00019 g001
Figure 2. The Simulink block diagram of a hypothetical small town car SMcar.
Batteries 04 00019 g002
Figure 3. The setup ADVISOR page of the input HEV SMcar.
Batteries 04 00019 g003
Figure 4. UDDS driving speed cycle of the input HEV SMcar.
Batteries 04 00019 g004
Figure 5. The performance results for a driving FTP-75 cycle followed by HWFET cycle for a HEV SMcar in MATLAB environment. In the first top graph, we show the UDDS speed cycle profile, in the second top graph, we show the estimated value of Li-Ion SAFT battery SOC, in the third graph, we show the gas emissions, in the last bottom graph, we show the discharging current UDDS FTP-75 cycle test.
Batteries 04 00019 g005
Figure 6. The 2RC EMC Li-Ion battery SOC versus ADVISOR SOC estimate in MATLAB simulation environment.
Batteries 04 00019 g006
Figure 7. The 2RC EMC Li-Ion battery terminal voltage for a discharging current UDDS cycle FTP-75 test.
Batteries 04 00019 g007
Figure 8. The Li-Ion battery 2RC EMC OCV curve during a complete discharging cycle at 1 C rate (top) and the corresponding Li-Ion battery SOC (bottom).
Batteries 04 00019 g008
Figure 9. The discharging current UDDS cycle profile used in FTP-75 test.
Batteries 04 00019 g009
Figure 10. The SIMULINK model of 2RC EMC Li-Ion Battery.
Batteries 04 00019 g010
Figure 11. The detailed Simulink model of 2RC EMC Li-Ion battery.
Batteries 04 00019 g011
Figure 12. Li-Ion battery OCV versus SOC for a UDDS cycle charging current profile test.
Batteries 04 00019 g012
Figure 13. The 2RC EMC Li-Ion battery SOC versus ADVISOR SOC estimate.
Batteries 04 00019 g013
Figure 14. The 2RC EMC Li-Ion battery terminal voltage for an UDDS cycle charging current profile test.
Batteries 04 00019 g014
Figure 15. The charging Li-Ion battery SOC cycle for almost three UDDS driving cycles.
Batteries 04 00019 g015
Figure 16. The 2RC EMC Li-Ion battery terminal voltage for three UDDS cycles charging current profile test.
Batteries 04 00019 g016
Figure 17. The UDDS driving cycle charging current profile test.
Batteries 04 00019 g017
Figure 18. Robustness of EKF estimator for an increase in SOC initial condition value from 70 to 90%.
Batteries 04 00019 g018
Figure 19. Robustness of EKF estimator to a decrease in SOC initial value.
Batteries 04 00019 g019
Figure 20. The robustness of EKF estimator to simultaneous changes in SOC initial value and in measurements current sensor noise level.
Batteries 04 00019 g020
Figure 21. The robustness of EKF SOC estimator to simultaneous changes in SOC initial value and two times increase in internal battery resistance of the Li-Ion battery.
Batteries 04 00019 g021
Figure 22. The robustness of EKF SOC estimator to simultaneous changes in SOC initial value and 50% decrease in the nominal value of Li-Ion battery capacitance.
Batteries 04 00019 g022
Figure 23. The 3RC EMC SOC model versus EKF SOC and ADVISOR SOC estimates for T = 5 °C.
Batteries 04 00019 g023
Figure 24. The 3RC EMC SOC model versus EKF SOC and ADVISOR SOC estimates for T = 10 °C.
Batteries 04 00019 g024
Figure 25. The 3RC EMC SOC model versus EKF SOC and ADVISOR SOC estimates for T = 15 °C.
Batteries 04 00019 g025
Figure 26. The 3RC EMC SOC model versus EKF SOC and ADVISOR SOC estimates for T = 20 °C.
Batteries 04 00019 g026
Figure 27. The overall architecture of the PI Observer design.
Batteries 04 00019 g027
Figure 28. The Simulink model of the measurements’ generator block.
Batteries 04 00019 g028
Figure 29. The architecture of Simulink models for 2RC EMC Li-Ion battery and estimator.
Batteries 04 00019 g029
Figure 30. The Simulink model of PI Observer.
Batteries 04 00019 g030
Figure 31. The Simulink model of the disturbance and noise generator.
Batteries 04 00019 g031
Figure 32. The 2RC EMC Li-Ion Battery SOC versus PIO SOC real-time estimator.
Batteries 04 00019 g032
Figure 33. The 2RC EMC Li-Ion battery terminal voltage versus PIO estimate.
Batteries 04 00019 g033
Figure 34. The slow disturbance nonlinear function components.
Batteries 04 00019 g034
Figure 35. The robustness of 2RC EMC Li-Ion battery PIO SOC estimator to the changes in SOC initial value from 70 to 40%.
Batteries 04 00019 g035
Figure 36. The 2RC EMC Li-Ion battery terminal voltage versus its PIO estimate, and the estimator robustness to a change in SOC initial value from 70 to 40%.
Batteries 04 00019 g036
Figure 37. The robustness of 2RC EMC Li-Ion battery PIO SOC estimator to simultaneous changes in SOC initial value and to the sensor white noise level of zero mea and standard deviation σ = 0.001.
Batteries 04 00019 g037
Figure 38. The robustness of 2RC EMC Li-Ion battery PIO estimator, to simultaneous change in SOC initial value and the measurement output white noise level of zero mean and standard deviation σ = 0.001.
Batteries 04 00019 g038
Figure 39. The measurement output white noise level of zero mean and standard deviation σ = 0.001.
Batteries 04 00019 g039
Table 1. The parameters and the coefficients of Li-Ion battery equivalent combined model.
ItemParameters/CoefficientsSymbolValueUnit Measure
1Li-Ion battery EMC parameters:
1.1The battery internal ohmic resistance (slightly different for charging and discharging cycle)R0.0022Ω (ohm)
1.2The first cell polarization resistanceR10.00077
1.3The second cell polarization resistanceR20.0011
1.4The first cell polarization capacitanceC114,475.24F (farad)
1.5The second cell polarization resistanceC298,246.01F
2Li-Ion battery characteristics:
2.1The value of the battery nominal capacityCnom6Ah (Amperes hours)
2.2The voltage nominal value of the batteryVnom3.6V (volt)
2.3Coulombic efficiency:
-
for charging cycle
-
for discharging cycle
η0.98
0.86
3The OCV coefficients:K04.23
K10.0000386
K20.24
K30.22
K4−0.04
Table 2. Extracted Li-Ion 3RC EMC model parameters.
Li-Ion Battery ParameterTemperature (°C)Unit
5101520mΩ
R88.17.57.6
R14.34.11.91.0mΩ
R25.53.52.51.8mΩ
R3107.55.13.2mΩ
C10.40.40.30.3F
C24.34.14.14F
C349.835.33.935.1F

