Coefficients of Thermal Expansion of Al- and Y-Substituted NaSICON Solid Solution Na3+2xAlxYxZr2−2xSi2PO12


1
Forschungszentrum Jülich GmbH, Institute of Energy and Climate Research, Materials Synthesis and Processing (IEK-1), 52425 Jülich, Germany
2
Helmholtz-Institute Münster, Forschungszentrum Jülich GmbH, 52425 Jülich, Germany
3
Jülich Aachen Research Alliance, JARA-Energy, 52425 Jülich, Germany
*
Author to whom correspondence should be addressed.
Batteries 2018, 4(3), 33; https://doi.org/10.3390/batteries4030033
Submission received: 25 May 2018
/
Revised: 2 July 2018
/
Accepted: 5 July 2018
/
Published: 16 July 2018
(This article belongs to the Special Issue Sodium-Ion Battery: Materials and Devices)
Abstract
:Because of an increasing interest in NaSICON materials as electrolyte materials in all-solid state sodium batteries, their thermal expansion was investigated in this study. The thermal expansion coefficient (CTE) of the Al and Y-substituted NaSICON compositions Na3+2xAlxYxZr2−2xSi2PO12 with 0 ≤ x ≤ 0.3 was obtained by dilatometry and compared to the CTE derived from the lattice parameters using high-temperature X-ray diffraction. The difference in CTE obtained from techniques, the influence of sodium content and central metal cation on CTE, as well as other observations such as phase changes are described and rationalized.
1. Introduction
The increasing interest in solid-state sodium batteries has made deeper understanding of the involved materials a necessary requirement. Due to a wide range of structural stability and excellent electrical performance, NaSICONs have the potential to be used as electrolytes in solid-state batteries [1,2,3,4,5]. However, for successful application in batteries, their mechanical properties and the thermal expansion behavior must also be studied in order to avoid thermal stresses and assure thermally stable cathode-electrolyte contact to avoid micro-cracking at the interface.
Thermal expansion is represented by its coefficient (CTE), and it can be obtained using different experimental techniques. High-temperature X-ray diffraction (HT-XRD) is the most reliable technique to measure the CTE at the crystallographic unit cell level where the lattice expansion is determined as a function of temperature. Typically, the lattice of NaSICON expands anisotropically [6,7,8]. As an example, the NaSICON material Na3.4Sc2(SiO4)0.4(PO4)2.6 shows nearly no expansion of the a lattice parameter (<0.1%), but a substantial expansion of the c lattice parameter of 2.15% between room temperature and 600 °C [9,10]. The resulting CTEs are 1.34 × 10⁻⁶ K−1 and 37.3 × 10⁻⁶ K−1, respectively, leading to a mean CTE of 13.3 × 10⁻⁶ K−1. The anisotropy is a crucial material property, as it results in residual stresses during cooling after sintering and thus induces micro-cracks, reduces the electrical conductivity, and increases safety risks [8,11]. This is particularly true for materials with crystal anisotropy and depends also on the microstructure (e.g., grain orientation). In addition, the formation of micro-cracks also erases the results of CTE measurements by dilatometry. In this case, the dimensional change of samples is measured mechanically using a pressure-sensitive push-rod or optically with a laser system. The length change is recorded as a function of temperature from which the CTE can be determined. Since CTE determination from dilatometry uses the macroscopic dimensional change, it therefore also includes changes in microstructure [12].
A careful sample preparation combined with sensitive and well-calibrated measurements may result in accurate CTEs from dilatometry similar to HT-XRD even for polycrystalline materials. For example, the CTE of dense 8 mol % yttria-stabilized zirconia is 10.5 × 10⁻⁶ K−1 and 9.7 × 10⁻⁶ K−1 when measured with dilatometry [13] and HT-XRD [14], respectively. In NaSICON materials, often the CTEs from dilatometry are much smaller than the values obtained from HT-XRD, which results from the creation of cracks [11], particularly during the cooling step after sintering. These cracks become narrower and disappear during dilatometry measurements, because of volume expansion while heating. This often leads to CTE values smaller than the data derived from crystallographic measurements and, even worse, the sometimes negative slope of the dilatometry curves [15,16,17,18,19] triggered an intense research activity and led to the misinterpretation that NaSICON materials might be “zero-expansion” ceramics [15].
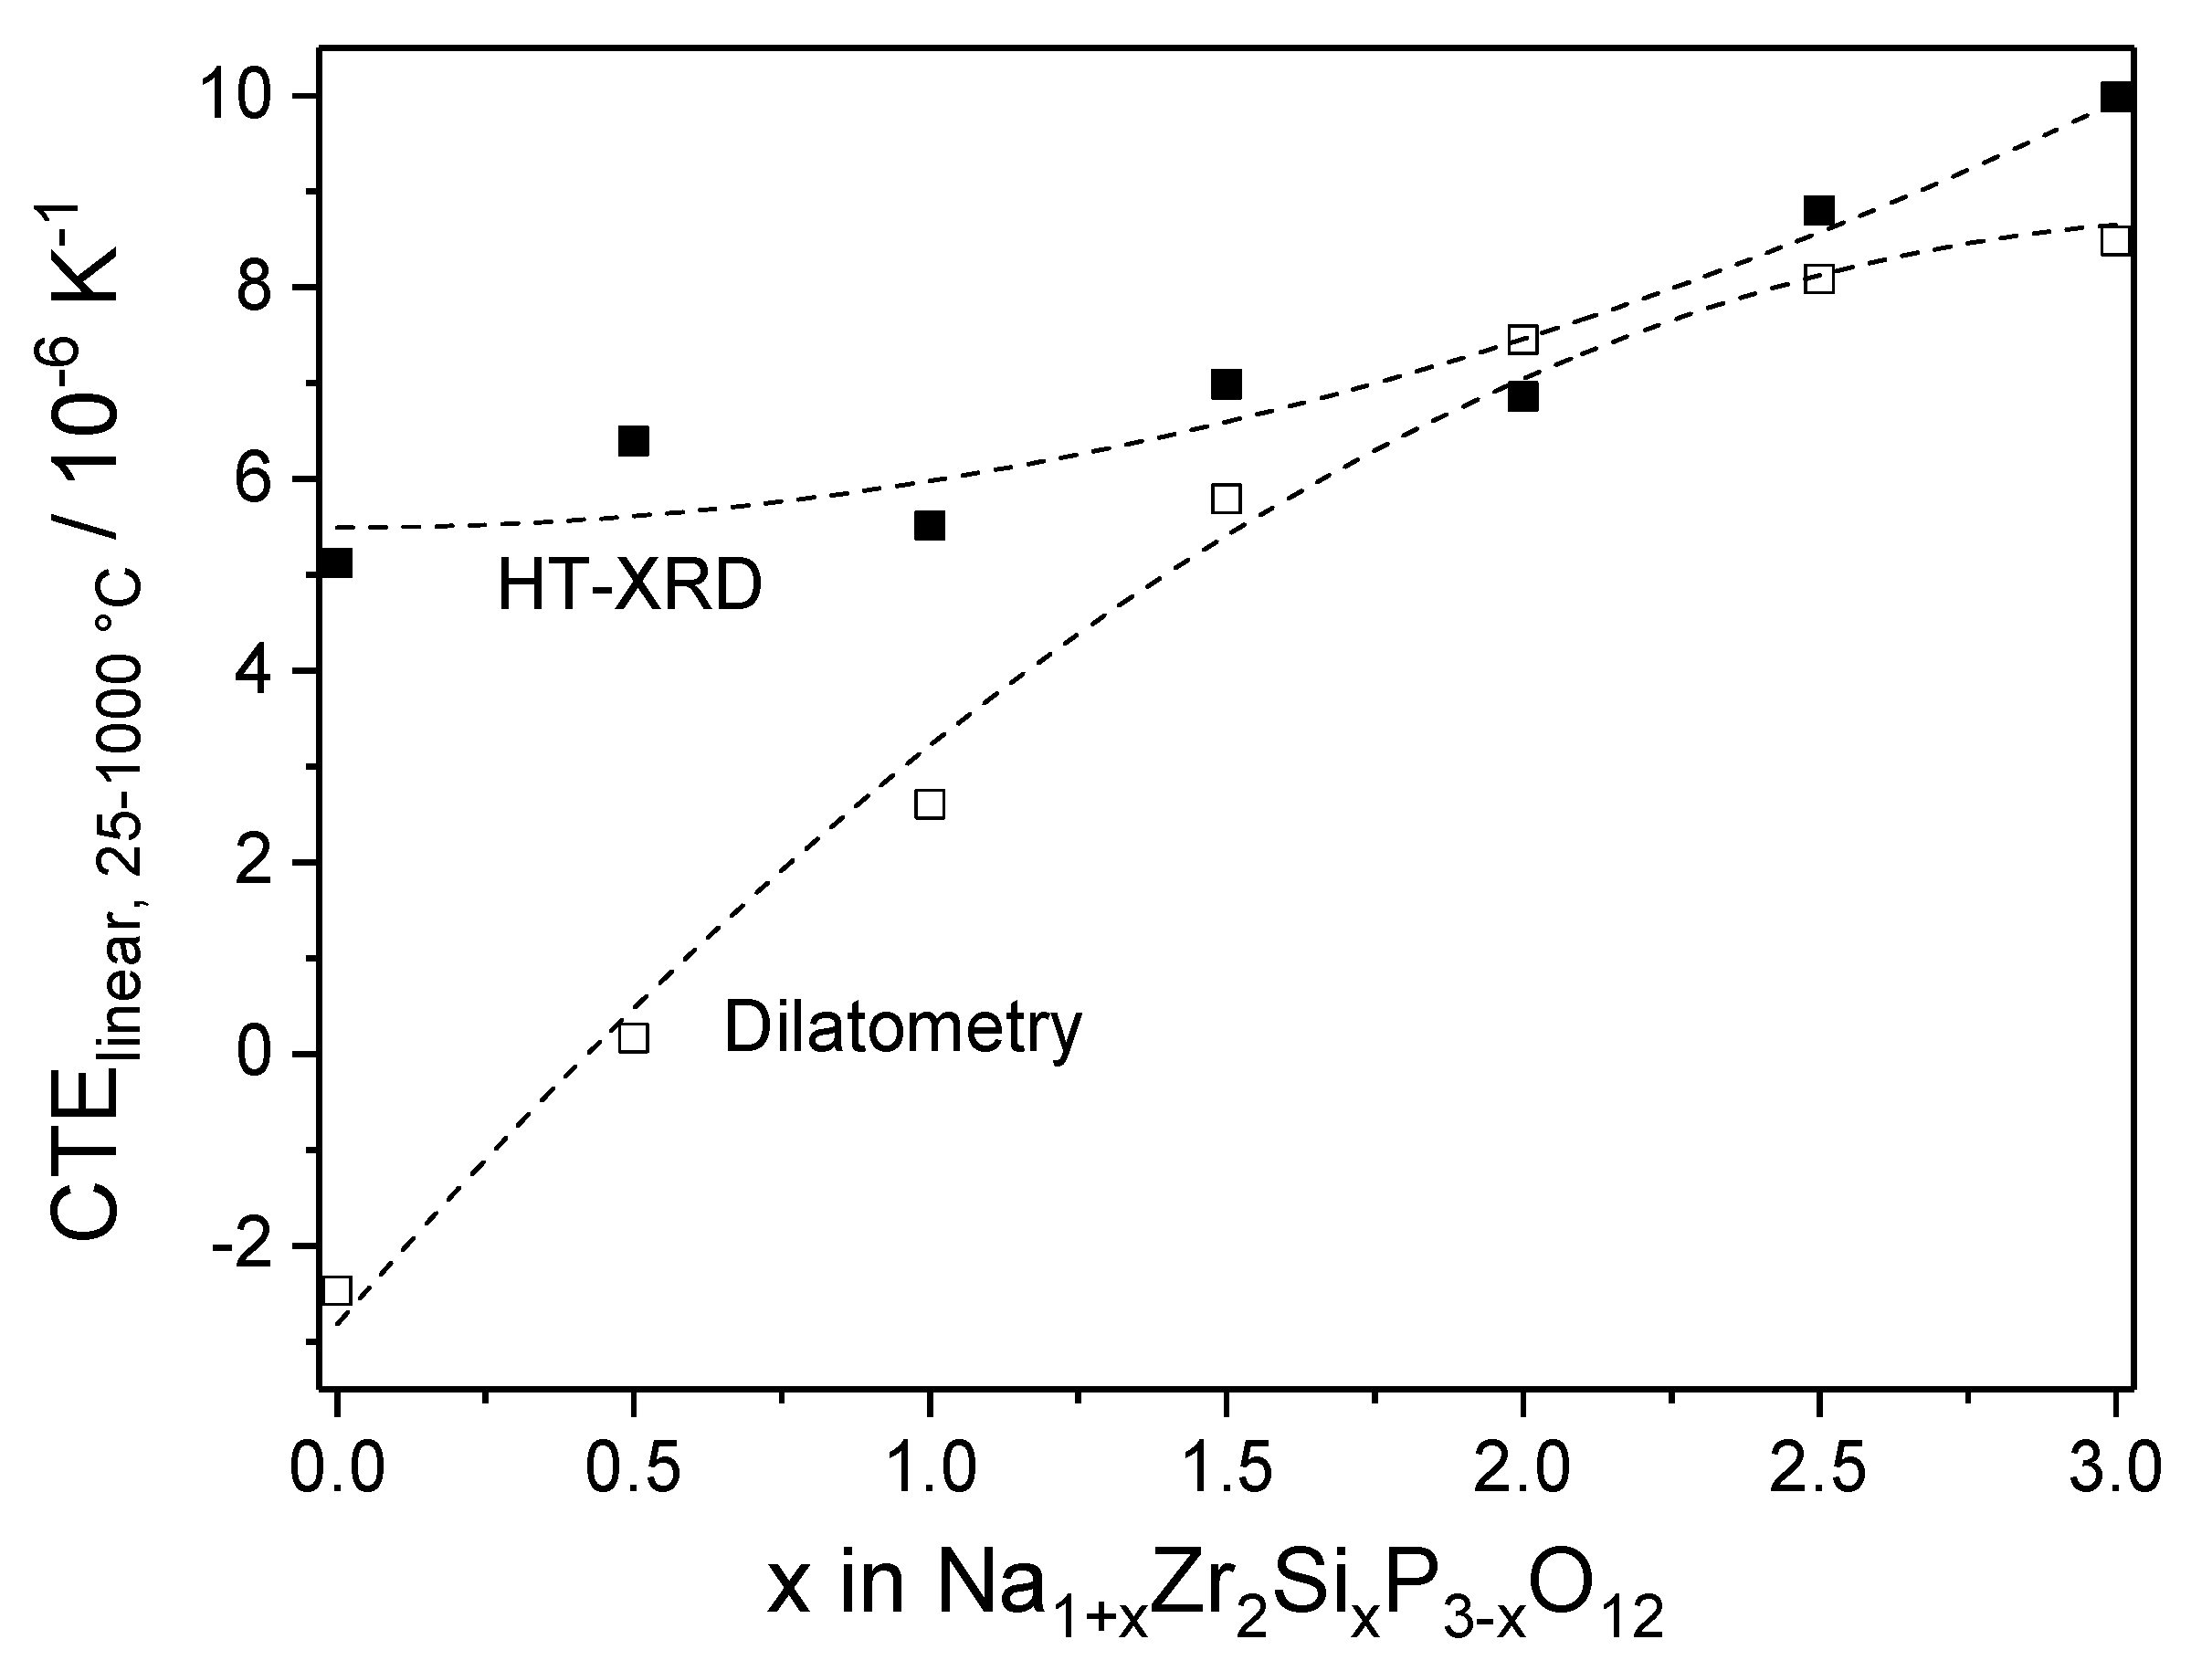
As shown in Figure 1, the CTE measurements on Na1+xZr2SixP3−xO12 only show an acceptable agreement between HT-XRD and dilatometry for x ≥ 1.5 [8]. Typically, a hysteresis in the cooling and heating curves of dilatometry indicates the influence of micro-cracks [17,20]. Only a careful sample preparation results in a crack-free material to achieve CTE values that are in good agreement with XRD data.
Recently, we have reported the crystallographic and electrical properties of the series Na3+2xAlxYxZr2−2x(SiO4)2(PO4)3 (hereafter: NAYZSiPx) with 0 ≤ x ≤ 0.3 [21]. NAYZSiPx has a monoclinic structure for 0 ≤ x < 0.2, and transforms into a rhombohedral Rc phase when x ≥ 0.2. For x < 0.2, the monoclinic to rhombohedral transition occurs at temperatures between 100 and 200 °C, and their stoichiometries, crystal structure and lattice parameters are given in Table 1 [21]. In this study, we further determined the CTEs by dilatometry and compared them with the CTEs obtained from HT-XRD reported earlier.
2. Experimental
All specimens were prepared from powder precursors by uniaxial pressing 150 MPa into a rectangular shape (40 × 5 × 3–5 mm) and subsequent sintering at 1000–1250 °C. The terminal faces were cut and polished to give samples 25 mm in length. The synthesis of the powders and more details on sample preparation and sintering conditions are given elsewhere [21]. Sintered samples with density in the range of 85–93% were used to measure the length changes as a function of temperature to determine the CTE. In a temperature range ΔT, a sample with a reference length L0 has a length change ΔL, and its CTE is calculated according to:
The dilatometry experiments were carried out with a push-rod dilatometer 402C from Netzsch, Germany, calibrated with a sapphire single crystal. Temperature was calibrated using an interpolation routine with five standard metals after determination of their melting points. Each sample was heated with 180 K/h to 1000 °C, and then the temperature was kept constant for 0.5 h to control the dimensional stability of the specimens. Finally, the samples were cooled with −180 K/h to 30 °C.
For comparison with HT-XRD results, the crystallographic unit cell parameters (i.e., volume, V) can be related to the linear CTE:
Hence, the CTE calculations using Equations (1) and (2) assume that the macroscopic body behaves like a single crystal. Using the hexagonal lattice parameters of the rhombohedral structure of investigated NaSICON materials, the linear CTE can be expressed as
3. Results and Discussions
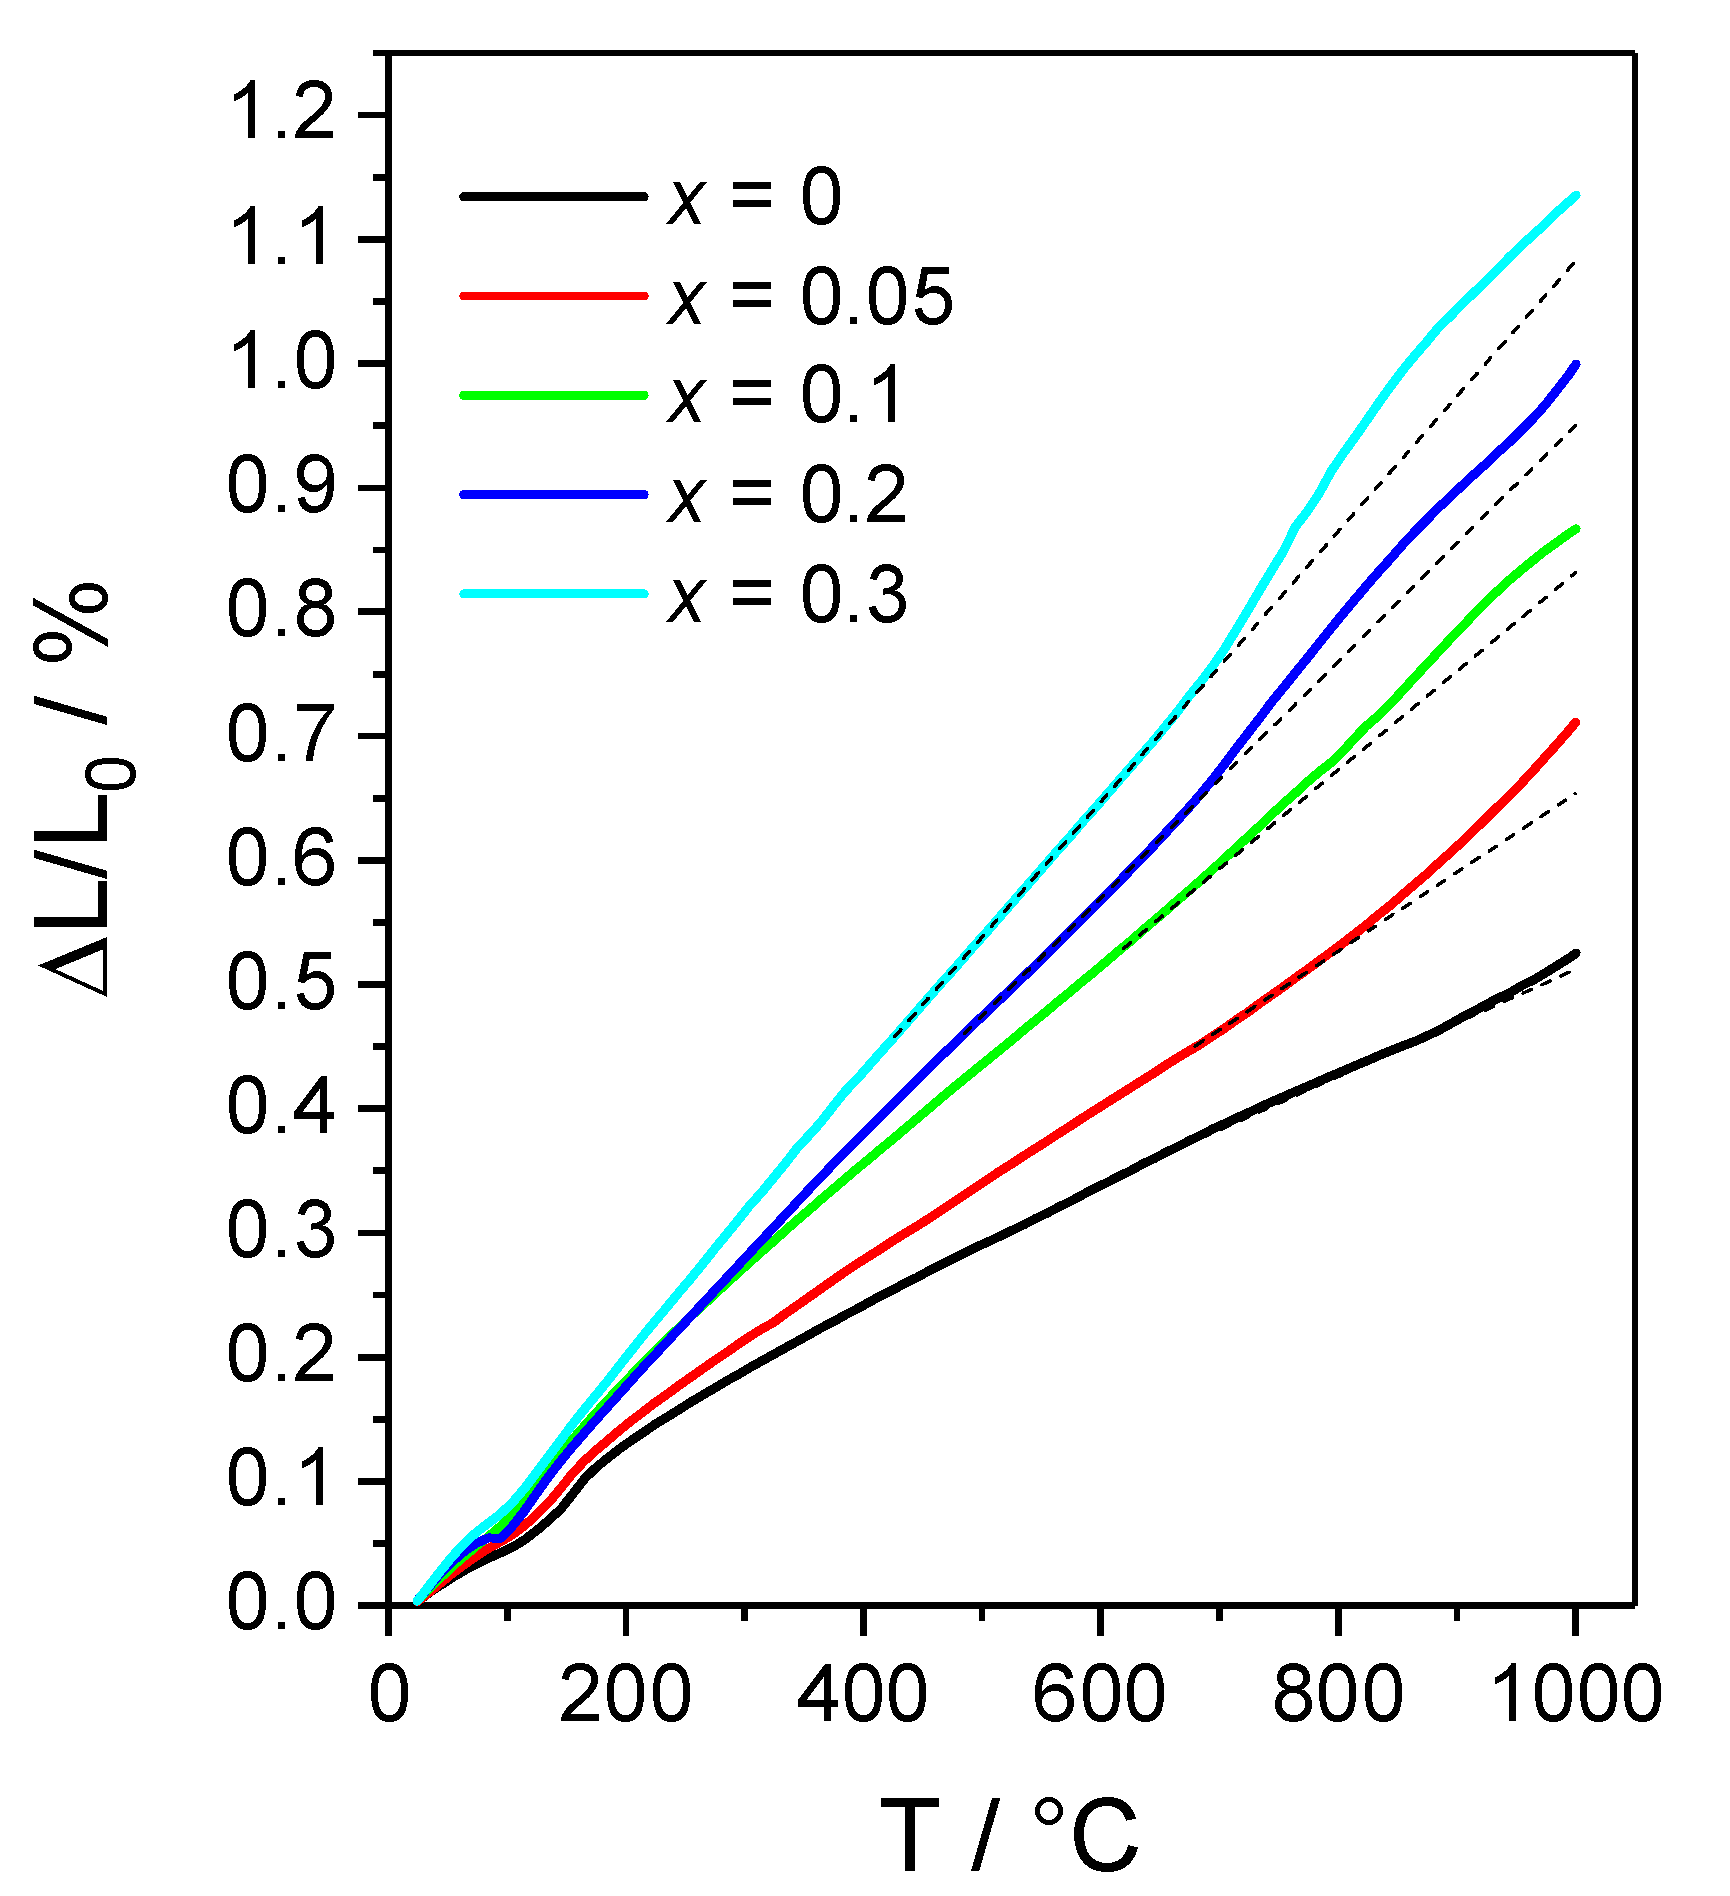
The dilatometry measurements of the series NAYZSiPx during heating is shown in Figure 2. The dilatometry curves indicate a small change in slope between 120 and 160 °C, which corresponds to a monoclinic to rhombohedral phase transition [21,22]. The transition temperature decreases with increasing the substitution content until x = 0.2. As shown in Figure 3a, the transition temperatures can be easily obtained from the first derivative of the dilatometry curves, better showing the slope changes. Additional slope changes at higher temperatures are also visible in Figure 2. The straight dashed lines indicate the deviation from a linear thermal expansion and show, on the one hand, that the additional expansion increases with increasing x, and, on the other hand, that the onset temperature of the additional expansion decreases with increasing x. The slope changes at high temperatures are summarized in Figure 3b and consist of two contributions which both tend to decrease in temperature with increasing x. The onset temperatures and maxima of slope changes are listed in Table 2. In addition, in this temperature region, secondary phase formation is observed by HT-XRD measurements.
Therefore this change in slope at high temperatures could be due to secondary phase segregation processes, and, especially for the samples with x ≥ 0.1, the formation of new phases as observed in HT-XRD measurements. Starting at about 700 °C, the substituting cations Al3+ and Y3+ leave the NaSICON structure, form ternary compounds like Y4Al2O9 and AlPO4 (as observed from HT-XRD [21]) and consequently reduce the unit cell volume of NaSICON. It is, therefore, interesting to note that the substituting elements show a low solubility in the NaSICON structure at 1000 °C and below, whereas they are widely incorporated in the host lattice at sintering temperatures of 1150–1200 °C. The leaching of Al3+ and Y3+ at 1000 °C can be monitored during the short dwell time of 0.5 h during the dilatometer measurements. In this period, the samples elongate very systematically with an individual constant rate which is proportional to the substitution level. After 0.5 h, they have accumulated a length increase by (0.126 ± 0.008)x (in %). Therefore, the dilatometer measurements are composed of two contributions: (a) a static contribution from the existing phases at room temperature, i.e., NaSICON and small amounts of monoclinic ZrO2 and AlPO4 [21], determining the linear steady increase with increasing temperature (dotted lines in Figure 2), and (b) a dynamic contribution resulting from the changing phase contents above 700 °C and determining the deviation from the constant expansion rate.
The existence of small amounts of secondary phases (ZrO2 and AlPO4) is the reason why the CTE obtained from dilatometry curves is higher than the values derived from HT-XRD (Table 2) due to the larger thermal expansion of both compounds. Assuming the rule of mixtures, the CTEs of the pure materials between room temperature and 700 °C, i.e., 8.65 × 10⁻⁶ K−1 for monoclinic ZrO2 [23] and 36 × 10−6 K−1 for AlPO4 [24], as well as the corresponding amounts derived from the XRD measurements, the CTE of the phase mixture can be calculated according to
in which vi is the volume fraction of phase i. The used parameters and resulting CTEs are also listed in Table 3 and show that especially small amounts of AlPO4 may have a significant impact on the thermal expansion of a polycrystalline NaSICON material. Therefore, the small impurities easily explain the larger CTEs obtained from dilatometry although the opposite trend might be expected.
Apart from the shift in length during the dwell time, the cooling curves do not show any unusual phenomena like hysteresis, abrupt length changes, or smooth minima which were frequently observed in former investigations [8,15,16,17,18].
In the case of NaSICON materials, often the CTEs obtained from dilatometry are much smaller than the ones from HT-XRD. This is because the particles expand anisotropically, leading to creation of cracks during cooling after sintering originating from large grain sizes [8,11]. Subsequently, during the dilatometry measurements, these cracks are reversibly filled up by the surrounding expanding material, and consequently, the detected length changes of the sample are smaller than a crack-free material. However, a careful sample preparation can result in similar CTE values obtained from dilatometry and HT-XRD. As shown in this study, the difference is in the range of only 0.5–2.5 × 10⁻⁶ K−1 (Table 2).
In Figure 4, the CTEs of the NAYZSiPx system are compared to those of Na3+xSc2SixP3−xO12 [10], Na1+xZr2SixP3−xO12 [8,19], and Na3+xY0.12Zr1.88SixP3−xO12 [25]. Among these materials, a general observation is evident: materials containing only Zr4+ as transition metal in the polyanionic lattice show a much smoother slope with increasing sodium content than those materials with mixture of tetra- and trivalent cations (Sc3+, Al3+, and Y3+) or materials containing only trivalent cations. Obviously, the two different bond strengths, i.e., Zr4+-O2− and M3+-O2− given in Table 4 (with M = Sc, Y, Al), cause a different dependence of the thermal expansion and vibrational amplitudes on the composition of the NaSICON materials.
On the one hand, the CTEs of NaSICON materials increase with Na content per formula unit when Zr4+ is used as transition metal cation in the polyanionic lattice. This is because at higher temperature, sodium ions become highly mobile, induce increased repulsive forces, and therefore increase the vibrational magnitude within the lattice. On the other hand, the substitution with trivalent transition metal cations (e.g., Al3+, Sc3+, Y3+) also influences the CTE of the NaSICON material. Since the trivalent cations are replacing Zr4+ in the crystal lattice (Figure 5), the octahedra become larger due to less charge polarization of oxygen atoms, or in other words, reduced bond strength between trivalent cation and oxygen in the octahedra. This is validated by the calculations of the volume of ZrO6 [27] and ScO6 [28] octahedra, i.e., 11.69 Å3 and 13.49 Å3, respectively. As a consequence of enlarged octahedra with central trivalent cations, the lattice vibrations become more pronounced, especially at elevated temperatures. This explains why the CTE of NAYZSiPx and other NaSICON compounds substituted with trivalent cations are increasing much more in dependence of x than NaSICON materials with tetravalent cations (Figure 4).
4. Conclusions
The coefficients of thermal expansion coefficient (CTE) of the NaSICON series NAYZSiPx were measured by dilatometry. The CTE values were similar to those obtained by HT-XRD. The prerequisite for accurate dilatometry measurements is a careful sample preparation for achieving crack-free specimens. The CTEs of NaSICON materials increase with Na content per formula unit when Zr4+ is used as transition metal cation in the polyanionic lattice. This is because sodium influences the charge polarization and therefore induces stronger lattice vibrations due to increased repulsive forces within the lattice. In addition, the substitution of trivalent transition metal cations influences the CTE because they have weaker attractive forces towards oxygen atoms of the octahedra as compared to tetravalent cations, which also leads to higher lattice vibrations.
Author Contributions
(1) S.N.: Material synthesis and preparation, conceptual idea of experiments, authoring the manuscript and the corresponding author. (2) M.-T.G.: performing Dilatometry measurements. (3) F.T.: Supervision of experiments, editing of manuscript and acquiring the research funding. (4) O.G.: Acquiring the research funding and editing of the manuscript.
Acknowledgments
The authors thank the Ministry of Innovation, Science and Research of the State of North Rhine-Westphalia for financial support in terms of the starting funds for Helmholtz Institute Münster (Az. 433).
Conflicts of Interest
The authors declare no conflict of interest.
References
- Song, S.F.; Duong, H.M.; Korsunsky, A.M.; Hu, N.; Lu, L. A Na+ Superionic Conductor for Room-Temperature Sodium Batteries. Sci. Rep. 2016, 6, 32330. [Google Scholar] [CrossRef] [PubMed]
- Hayashi, A.; Noi, K.; Sakuda, A.; Tatsumisago, M. Superionic glass-ceramic electrolytes for room-temperature rechargeable sodium batteries. Nat. Commun. 2012, 3, 856–860. [Google Scholar] [CrossRef] [PubMed]
- Guin, M.; Tietz, F. Survey of the transport properties of sodium superionic conductor materials for use in sodium batteries. J. Power Sources 2015, 273, 1056–1064. [Google Scholar] [CrossRef]
- Hueso, K.B.; Armand, M.; Rojo, T. High temperature sodium batteries: Status, challenges and future trends. Energy Environ. Sci. 2013, 6, 734–749. [Google Scholar] [CrossRef]
- Ma, Q.; Guin, M.; Naqash, S.; Tsai, C.L.; Tietz, F.; Guillon, O. Scandium-Substituted Na3Zr2(SiO4)2(PO4) Prepared by a Solution Assisted Solid-State Reaction Method as Sodium-Ion. Conductors. Chem. Mater. 2016, 28, 4821–4828. [Google Scholar] [CrossRef]
- Pet’kov, V.I.; Asabina, E.A.; Shchelokov, I.A. Thermal Expansion of NASICON Materials. Inorg. Mater. 2013, 49, 502–506. [Google Scholar] [CrossRef]
- Woodcock, D.A.; Lightfoot, P.; Ritter, C. Mechanism of low thermal expansion in the cation-ordered Nasicon structure. Chem. Commun. 1998, 1, 107–108. [Google Scholar] [CrossRef]
- Oota, T.; Yamai, I. Thermal Expansion Behavior of NaZr2(PO4)3Type Compounds. J. Am. Ceram. Soc. 1986, 69, 1–6. [Google Scholar] [CrossRef]
- Kaus, M.; Guin, M.; Yavuz, M.; Knapp, M.; Tietz, F.; Guillon, O.; Ehrenberg, H.; Indris, S. Fast Na+ Ion. Conduction in NASICON-Type Na3.4Sc2(SiO4)0.4(PO4)2.6 Observed by 23Na NMR Relaxometry. J. Phys. Chem. C 2017, 121, 1449–1454. [Google Scholar] [CrossRef]
- Guin, M. Chemical and Physical Properties of Sodium Ionic Conductors for Solid-State Batteries; Rheinisch Westfälischen Technischen Hochschule (RWTH): Aachen, Germany, 2016. [Google Scholar]
- Srikanth, V.; Subbarao, E.C.; Agrawal, D.K.; Huang, C.-Y.; Roy, R.; Rao, G.V. Thermal Expansion Anisotropy and Acoustic Emission of NaZr2P3O12 Family Ceramics. J. Am. Ceram. Soc. 1991, 74, 365–368. [Google Scholar] [CrossRef]
- Maca, K.; Pouchy, V.; Boccaccini, R. Sintering Densification Curve–A Practical Approach for its Construction from Dilatometric Shrinkage Data. Sci. Sinering 2008, 40, 117–122. [Google Scholar] [CrossRef]
- Shiratori, Y.; Tietz, F.; Buchkremer, H.P.; Stöver, D. YSZ-MgO composite electrolyte with adjusted thermal expansion coefficient to other SOFC components. Solid State Ion. 2003, 164, 27–33. [Google Scholar] [CrossRef]
- Biswas, M.; Kumbhar, C.S.; Gowtam, D.S. Characterisation of Nanocrystalline Yttria-Stabilized Zirconia: An. In Situ HTXRD Study. ISRN Nanotechnol. 2011, 2011, 305687. [Google Scholar] [CrossRef]
- Agrawal, D.K.; Roy, R. Composite route to “zero” expansion ceramics. J. Mater. Sci. 1985, 20, 4617–4623. [Google Scholar] [CrossRef]
- Alamo, J.; Roy, R. Ultralow-Expansion Ceramics in the System Na2O-ZrO2-P2O5-SiO2. J. Am. Ceram. Soc. 1984, 67, c78–c80. [Google Scholar] [CrossRef]
- Huang, C.-Y.; Agrawal, D.K.; McKinstry, H.A. Thermal expansion behaviour of M′Ti2P3O12 (M′ = Li, Na, K, Cs) and M″Ti4P6O24 (M″ = Mg, Ca, Sr, Ba) compounds. J. Mater. Sci. 1995, 30, 3509–3514. [Google Scholar] [CrossRef]
- Lenain, G.E.; McKinstry, H.A.; Limaye, S.Y.; Woodward, A. Low thermal expansion of alkali-zirconium phosphates. Mater. Res. Bull. 1984, 19, 1451–1456. [Google Scholar] [CrossRef]
- Colomban, P.; Mouchon, E. Phase transition in, thermal history and expansion of NASICON, solid solution and lithium derivative ceramics and of SiC (mullite) fibers-NASICON composites. Solid State Ion. 1994, 73, 209–220. [Google Scholar] [CrossRef]
- Yousef, S.G. Mikrorissbildung Durch Anisotrope Thermische Ausdehnung: Experiment und Numerische Simulation, in Material-Und Geowissenschaften. Ph.D. Thesis, Technischen Universität Darmstadt, Darmstadt, Germany, 2004. [Google Scholar]
- Naqash, S.; Tietz, F.; Guillon, O. Synthesis and characterization of equimolar Al/Y-substituted NASICON solid solution Na1+2x+yAlxYxZr2−2xSiyP3−yO12. Solid State Ion. 2018, 319, 13–21. [Google Scholar] [CrossRef]
- Jolley, A.G.; Taylor, D.D.; Schreiber, N.J.; Wachsman, E.D. Structural Investigation of Monoclinic-Rhombohedral Phase Transition in Na3Zr2Si2PO12 and Doped NASICON. J. Am. Ceram. Soc. 2015, 98, 2902–2907. [Google Scholar] [CrossRef]
- Patil, R.N.; Subbarao, E.C. Axial thermal expansion of ZrO2 and HfO2 in the range room temperature to 1400 °C. J. Appl. Crystallogr. 1969, 2, 281–288. [Google Scholar] [CrossRef]
- Achary, S.N.; Jayakumar, O.D.; Tyagi, A.K.; Kulshresththa, S.K. Preparation, phase transition and thermal expansion studies on low-cristobalite type Al1−xGaxPO4 (x = 0.0, 0.20, 0.50, 0.80 and 1.00). J. Solid State Chem. 2003, 176, 37–46. [Google Scholar] [CrossRef]
- Smirnova, O.A.; Fuentes, R.O.; Figueiredo, F.; Kharton, V.V.; Marques, F.M.B. Stability and thermal expansion of Na+-conducting ceramics. J. Electroceram. 2003, 11, 179–189. [Google Scholar] [CrossRef]
- Luo, Y.R.; Lide, D.R. Bond. Dissociation Energies, CRC Handbook of Chemistry and Physics, 97th ed.; CRC Press: Boca Raton, FL, USA, 2007. [Google Scholar]
- Hong, H.Y.P. Crystal structures and crystal chemistry in the system Na1+xZr2SixP3−xO12. Mater. Res. Bull. 1976, 11, 173–182. [Google Scholar] [CrossRef]
- Guin, M.; Tietz, F.; Guillon, O. New promising NASICON material as solid electrolyte for sodium-ion batteries: Correlation between composition, crystal structure and ionic conductivity of Na3+xSc2SixP3−xO12. Solid State Ion. 2016, 293, 18–26. [Google Scholar] [CrossRef]
Figure 1.
Linear thermal expansion (see Equations (1)–(3)) of NaSICON ceramics measured by dilatometry and HT-XRD during heating [8]. A satisfying agreement of the values is obtained only for x ≥ 1.5.
Figure 1.
Linear thermal expansion (see Equations (1)–(3)) of NaSICON ceramics measured by dilatometry and HT-XRD during heating [8]. A satisfying agreement of the values is obtained only for x ≥ 1.5.

Figure 2.
Heating curves of the series NAYZSiPx. Solid lines represent measured data that deviates from linear behavior (dotted line).
Figure 2.
Heating curves of the series NAYZSiPx. Solid lines represent measured data that deviates from linear behavior (dotted line).

Figure 3.
The first derivatives of the dilatometry curves during heating for identification of the phase transition (a) And characteristic temperatures related to high-temperature processes (b). Stars and arrows indicate the maximum slope changes and onset of phase segregation processes (new phase formation), respectively.

Figure 4.
The CTE data of NAYZSiPx (red squares) in comparison to other NaSICON materials previously reported in the temperature range as indicated in the figure. Black circles represent Na1+xZr2SixP3−xO12 [8], blue diamonds Na3+xSc2SixP3−xO12 [10], green stars Na1+xZr2SixP3−xO12 [19], and pink triangles Na3+xY0.12Zr1.88SixP3−xO12 [25]. Filled and empty symbols represent data obtained from HT-XRD and dilatometry, respectively.

Figure 5.
Rhombohedral NaSICON structure indicating the ZrO6 octahedra, (P/Si)O4 tetrahedra and sodium atoms. The structural data are taken from [28]. The figure shows the hexagonal unit cell of the NaSICON lattice, which exists above 150 °C in all NAYZSiPx compositions.
Figure 5.
Rhombohedral NaSICON structure indicating the ZrO6 octahedra, (P/Si)O4 tetrahedra and sodium atoms. The structural data are taken from [28]. The figure shows the hexagonal unit cell of the NaSICON lattice, which exists above 150 °C in all NAYZSiPx compositions.


Table 1.
Composition and crystal structure of NAYZSiPx compounds.
| Material | Lattice Parameters and Space Groups | |||
|---|---|---|---|---|
| 25 °C | Space Group | 700 °C | Space Group | |
| NAYZSiP0 | a: 15.637(1), b: 9.045(1), c: 9.225(1), β: 123.64(1)° | c2/c | a = b = 9.058(2), c: 23.173 (4) | Rc |
| NAYZSiP0.05 | a: 15.665(1) b: 9.058(1), c: 9.233(1), β: 123.79(1)° | c2/c | a = b = 9.070(1), c: 23.161(1) | Rc |
| NAYZSiP0.1 | a: 15.671(1) b: 9.065(1), c: 9.221(1), β: 123.95(1)° | c2/c | a = b = 9.090(9), c: 23.133(3) | Rc |
| NAYZSiP0.2 | a = b = 9.096(1), c: 22.741(2) | Rc | a = b = 9.120(9), c: 23.034(6) | Rc |
| NAYZSiP0.3 | a = b = 9.110(3), c: 22.671(1) | Rc | a = b = 9.139(6), c: 23.938(8) | Rc |
Table 2.
Onset temperatures and maxima of slope changes deduced from Figure 3a,b. The values of the high-temperature processes have an error of about ± 20 °C.
Table 2.
Onset temperatures and maxima of slope changes deduced from Figure 3a,b. The values of the high-temperature processes have an error of about ± 20 °C.
| x | Tmon-rhom/°C | Tonset1/°C | Tmax1/°C | Tonset2/°C | Tmax2/°C |
|---|---|---|---|---|---|
| 0 | 152 | 850 | 910 | 955 | >1000 |
| 0.05 | 146 | 675 | 720 | 780 | >1000 |
| 0.1 | 138 | 670 | 735 | 770 | 880 |
| 0.2 | 136 | 650 | 720 | 935 | 815 |
| 0.3 | 138 | 625 | 740 | - | 830 |
Table 3.
CTEs between room temperature and 700 °C of NAYZSiPx and the used volume fractions of AlPO4 and ZrO2 for calculating the CTE according to Equation (4).
Table 3.
CTEs between room temperature and 700 °C of NAYZSiPx and the used volume fractions of AlPO4 and ZrO2 for calculating the CTE according to Equation (4).
| x | CTEHT-XRD/K−1 10−6 | CTEdil./K−1 10−6 | CTEcalc./K−1 10−6 | /% | /% |
|---|---|---|---|---|---|
| 0 | 5.22 | 5.72 | 5.69 | 1.4 | 1.1 |
| 0.05 | 5.11 | 6.84 | 6.83 | 5.3 | 2.2 |
| 0.1 | 7.81 | 8.85 | 8.83 | 3.3 | 3.4 |
| 0.2 | 9.13 | 9.97 | 9.99 | 3.2 | 2.8 |
| 0.3 | 8.57 | 11.34 | 11.33 | 10.0 | 5.6 |
Table 4.
Bond dissociation energies at 298 K of Zr4+-O and M3+-O taken from [26].
Table 4.
Bond dissociation energies at 298 K of Zr4+-O and M3+-O taken from [26].
| A-B | D°/kJ mol−1 |
|---|---|
| Zr-O | 766.1 ± 10.6 |
| Al-O | 501.9 ± 10.6 |
| Y-O | 714.1 ± 10.2 |
| Sc-O | 671.4 ± 1.0 |
© 2018 by the authors. Licensee MDPI, Basel, Switzerland. This article is an open access article distributed under the terms and conditions of the Creative Commons Attribution (CC BY) license (http://creativecommons.org/licenses/by/4.0/).
Share and Cite
MDPI and ACS Style
Naqash, S.; Gerhards, M.-T.; Tietz, F.; Guillon, O. Coefficients of Thermal Expansion of Al- and Y-Substituted NaSICON Solid Solution Na3+2xAlxYxZr2−2xSi2PO12. Batteries 2018, 4, 33. https://doi.org/10.3390/batteries4030033
AMA Style
Naqash S, Gerhards M-T, Tietz F, Guillon O. Coefficients of Thermal Expansion of Al- and Y-Substituted NaSICON Solid Solution Na3+2xAlxYxZr2−2xSi2PO12. Batteries. 2018; 4(3):33. https://doi.org/10.3390/batteries4030033
Chicago/Turabian StyleNaqash, Sahir, Marie-Theres Gerhards, Frank Tietz, and Olivier Guillon. 2018. "Coefficients of Thermal Expansion of Al- and Y-Substituted NaSICON Solid Solution Na3+2xAlxYxZr2−2xSi2PO12" Batteries 4, no. 3: 33. https://doi.org/10.3390/batteries4030033
Note that from the first issue of 2016, this journal uses article numbers instead of page numbers. See further details here.