Article

Do Eco-Fees Encourage Design for the Environment? The Relationship between Environmental Handling Fees and Recycling Rates for Printed Paper and Packaging

Department of Geography, Wilfrid Laurier University, Waterloo, Ontario, ON L6S2X5, Canada
Recycling 2016, 1(1), 136-146; https://doi.org/10.3390/recycling1010136
Submission received: 17 January 2016 / Revised: 7 February 2016 / Accepted: 15 February 2016 / Published: 3 March 2016

Abstract

:
This study undertook a critical examination of Ontario’s extended producer responsibility scheme for the residential “Blue Box” recycling program, specifically examining the relationship between packaging fee rates and material-specific recycling rates. Using data collected for each of the 23 materials found in the residential recycling program over the past decade, a regression model was developed to gauge what relationship (if any) packaging recycling rates have with fee rates, costs of material management and revenue from the sale of recyclable material. The modeling in this study indicates that packaging fee rates have no effect on packaging recycling rates. Recycling rates were positively correlated with material revenue and negatively correlated with material management costs. There is no evidence that suggests that Ontario’s fee model used to allocate environmental handling fees to individual materials encourages waste diversion or design for the environment. The disconnect in the results and the intended function of packaging fee rates calls into question the appropriateness of Ontario’s fee rate methodology.

1. Introduction

Extended producer responsibility (EPR) is becoming a favored public policy approach to manage post-consumption waste in most developed economies. Generally speaking, EPR shifts the financial (and sometimes physical) responsibility for the end-of-life (EOL) management of used packaging from consumers to the producer of the original packaging [1]. A producer, in this context, is commonly defined as the brand owner of a packaged product or the first person to import into a specific jurisdiction (typically the distributor or retailer who first receives the product in that jurisdiction). Although EPR policy formulation and programs for used packaging have existed for the better part of three decades, EPR thinking is still in its infancy: The ever-widening range of government initiatives, program implementation models and new enterprises forming in response to these changes highlight the relative immaturity of the field [2]. The primary reason for adopting EPR policies, to date, has been the relatively narrow issue of post-consumer waste management. While grounded within the broader sustainability framework, most program initiatives have focused on the collection and diversion of designated wastes from disposal, with increasing attention being paid to waste reduction and product/packaging design [3].
Ontario’s transition to an EPR scheme in the early 2000s marked a shift in the cost of managing EOL products from the local tax base to packaging producers [4]. To date, Ontario’s partial EPR scheme remains the foundation for managing and financing the provincial Blue Box program in Ontario; the distribution of recycling system costs is performance-based, with the fees paid by packaging producers being in direct proportion to their recycling performance. All other things being equal, materials with high rates of waste diversion will pay a smaller percentage of recycling system costs when compared to materials with low recycling rates. This is designed to incentivize producers to increase the relative recycling performance of their materials by investing in technologies, end markets and infrastructure to ensure the recyclability of their packaging. The underlying intuition behind Ontario’s fee model is that materials who have their costs partially subsidized will want to increase their recycling rates such that they continue to transfer costs onto poorer performing materials. Conversely, materials who subsidize the costs of other materials will want to increase their recycling rates such that they can minimize the impact of the fee. Thus far, the effectiveness of this approach has yet to be evaluated. Policy decisions have been made predicated under the assumption that the fee methodology employed in Ontario improves recovery of household recyclables by encouraging packaging producers to make recyclable packaging choices. This study seeks to test this hypothesis by evaluating how Ontario’s incentive-based EPR fee model has influenced recycling rate performance for printed paper and packaging materials. The main objective of this research is to examine whether fee incentives/disincentives for packaging producers increase recycling rates for packaging materials.
The analysis in this study builds upon the existing research, shifting the research focus away from individual consumers and households to packaging producers. To date, no study has evaluated how incentivization affects recycling behavior of packaging producers and brand owners. Doing so provides unique insights into the effectiveness of performance-based fees, particularly as Ontario’s model of EPR funding spreads to other jurisdictions (both within Canada and abroad).

2. Literature Review

Extended producer responsibility for packaging waste, and, by proxy, packaging fees, has received relatively little attention from the research community; while studies on EPR do exist [5,6,7]), they have tended to focus on deposit return schemes for beverage containers, waste electronics and hazardous waste. Most of the research on packaging eco-fees in Canada has generally been grey literature—work carried out by consulting firms or local governments. Most of the information that is currently available has reflected either local circumstance that can differ substantially from one area to the next and/or has reflected a particular focus or interest of the author.
As noted by Mayers and Butler [8], the primary public policy arguments for implementing EPR for packaging include:
  • To transfer the costs of managing packaging waste from the local tax base to the producer and user of the product.
  • To provide a direct economic incentive for the producer of the package to reduce packaging materials and design packaging for improved recyclability.
  • As an initial step towards the development of a circular materials economy—where waste materials serve as feedstock for new processes (as opposed to the current norm: a linear extraction/production/consumption/disposal economic system).
  • To make the producer and consumer of the packaging fully responsible for the environmental impacts of it production, use and EOL management.
Notably absent in most EPR practices, to date, has been the ability to design and implement a program based upon a broader product and packaging lifecycle assessment [9]. This will likely change in the future to include considerations of greenhouse gas (GHGs) emissions, water impacts, hazardous materials and the use of renewable materials and renewable energy.
Most OECD (Organization for Economic Cooperation and Development) countries have adopted one or more of these EPR approaches for EOL product management and packaging. Approximately 61% of the OECD population currently has EPR policies for packaging in place. The significant majority of the remainder not covered is the United States (27%) [10]. Initial packaging EPR program models were predominately based upon the creation of a single national packaging compliance scheme [11]. More recent EPR policy trends have focused on assigning the legal responsibility for EOL management of packaging waste to individual producers, and on allowing each producer, operating individually (as part of a group or as a member of a producer responsibility organization), to discharge their legal obligation [12]. In most cases, EPR programs for non-packaging products and wastes require the producer to pay 100% of the program costs. Existing EPR programs for used packaging assign partial or full financial responsibility to producers, but there is a clear trend in Europe and Canada of assigning the full program costs to producers. Table 1 below summarizes EPR trends in European countries.
The European Recovery & Recycling Organization (ERRA) launched packaging recycling pilots across Europe to demonstrate effective and efficient approaches to package recycling [13]. ERRA supported European-wide packaging legislation to stimulate wider adoption of packaging recycling schemes and minimize trade distortions in the common market. In Canada, major brand owners and grocery retailers have promoted voluntary approaches to recycling through Corporations Supporting Recycling for more than a decade. A lack of financial resources and the proliferation of provincial packaging regulations led CSR (Corporate Social Responsibility) to advocate for EPR programs for used packaging. In the United States, voluntary industry efforts have tended to be single-material or packaging-specific approaches, and the overall recycling rate for used packaging has remained relatively flat over the last decade.
To date, no study has examined whether packaging fees encourage packaging producers to select the most recyclable material. While environmental handling fees as a whole have been demonstrably successful in having companies internalize the costs of EOL waste management, the link between fees and product design for the environment remains poorly understood.

3. Materials and Methods

3.1. Description of Study Site

Ontario remains at the forefront of recycling initiatives and legislation in Canada, recognized as one of only three provinces in Canada to implement an extended producer responsibility scheme (EPR) for household recyclables. Residential and commercial waste diversion programs exist for MHSW (Material Hazardous or Special Waste), WEEE (Waste Electrical and Electronics Equipment), automobile tires, and printed paper and packaging (Blue Box) materials. Each of these programs exists under the oversight of Waste Diversion Ontario (WDO), a non-Crown corporation created under Ontario’s 2002 Waste Diversion Act [14]. WDO was established to develop, implement and manage waste diversion programs for stakeholders from both private and public sectors [14].
Under provincial regulation O. Reg. 274/04, all producers of printed paper and packaging are required to pay a fee to finance the EOL management of material generated in the province. Producers are financially obligated to contribute 50% of reported municipal costs for the operation and maintenance of the Blue Box program.
Conversely, under provincial regulation O. Reg. 101/94, every municipality with a population of 5000 or more residents are obligated to operate a Blue Box program accepting at least five mandatory materials, plus three optional materials. A total of 23 packaging types have been classified as being eligible for inclusion in the Blue Box.
Data for Ontario’s residential recycling system was obtained from the Waste Diversion Ontario municipal data call. Each year, WDO requests that every municipality within Ontario report detailed recycling and cost information regarding the management of their waste diversion programs [14]. Municipalities are required to log into the Waste Diversion Ontario web site and fill out an electronic questionnaire that solicits information that includes information on the amount of material recovered, the types of material recovered and the operating and capital costs associated with the management and collection of recyclables. All data used in this study pertains to printed paper and packaging recyclables found in the residential recycling stream, i.e., newsprint, cardboard, glass, aluminum, steel, composite packaging and plastics.

3.2. Description of Stewardship Ontario Fee Model

The information collected by WDO is used to calculate material-specific costs by Stewardship Ontario using a “Pay-In Model” (PIM) [15]. This model allocates municipal recycling costs to individual materials using a three-step process.
These include:
  • Determine Blue Box Program Costs
  • Allocate Costs to Individual Materials
  • Determine Fee Rates
Each year, representatives from Stewardship Ontario, the Association of Municipalities of Ontario (AMO) and the City of Toronto meet to review the costs submitted by municipalities and together determine a “Best Practice” cost, which is used to negotiate producer obligations to municipalities for their share of the cost for running the Blue Box program. In 2014, the net cost for managing the residential Blue Box program was approximately $216 million [15]. These costs are allocated to individual materials based on activity-based costing principles and a distribution of common costs. These costs are distributed on the basis that a material-specific net cost reflects the costs of collecting, processing and providing administrative support for that material. The PIM then calculates material-specific fee rates for packaging producers using a three-factor formula based on the net cost of material management, material-specific recycling rates, and an equalization payment, where:
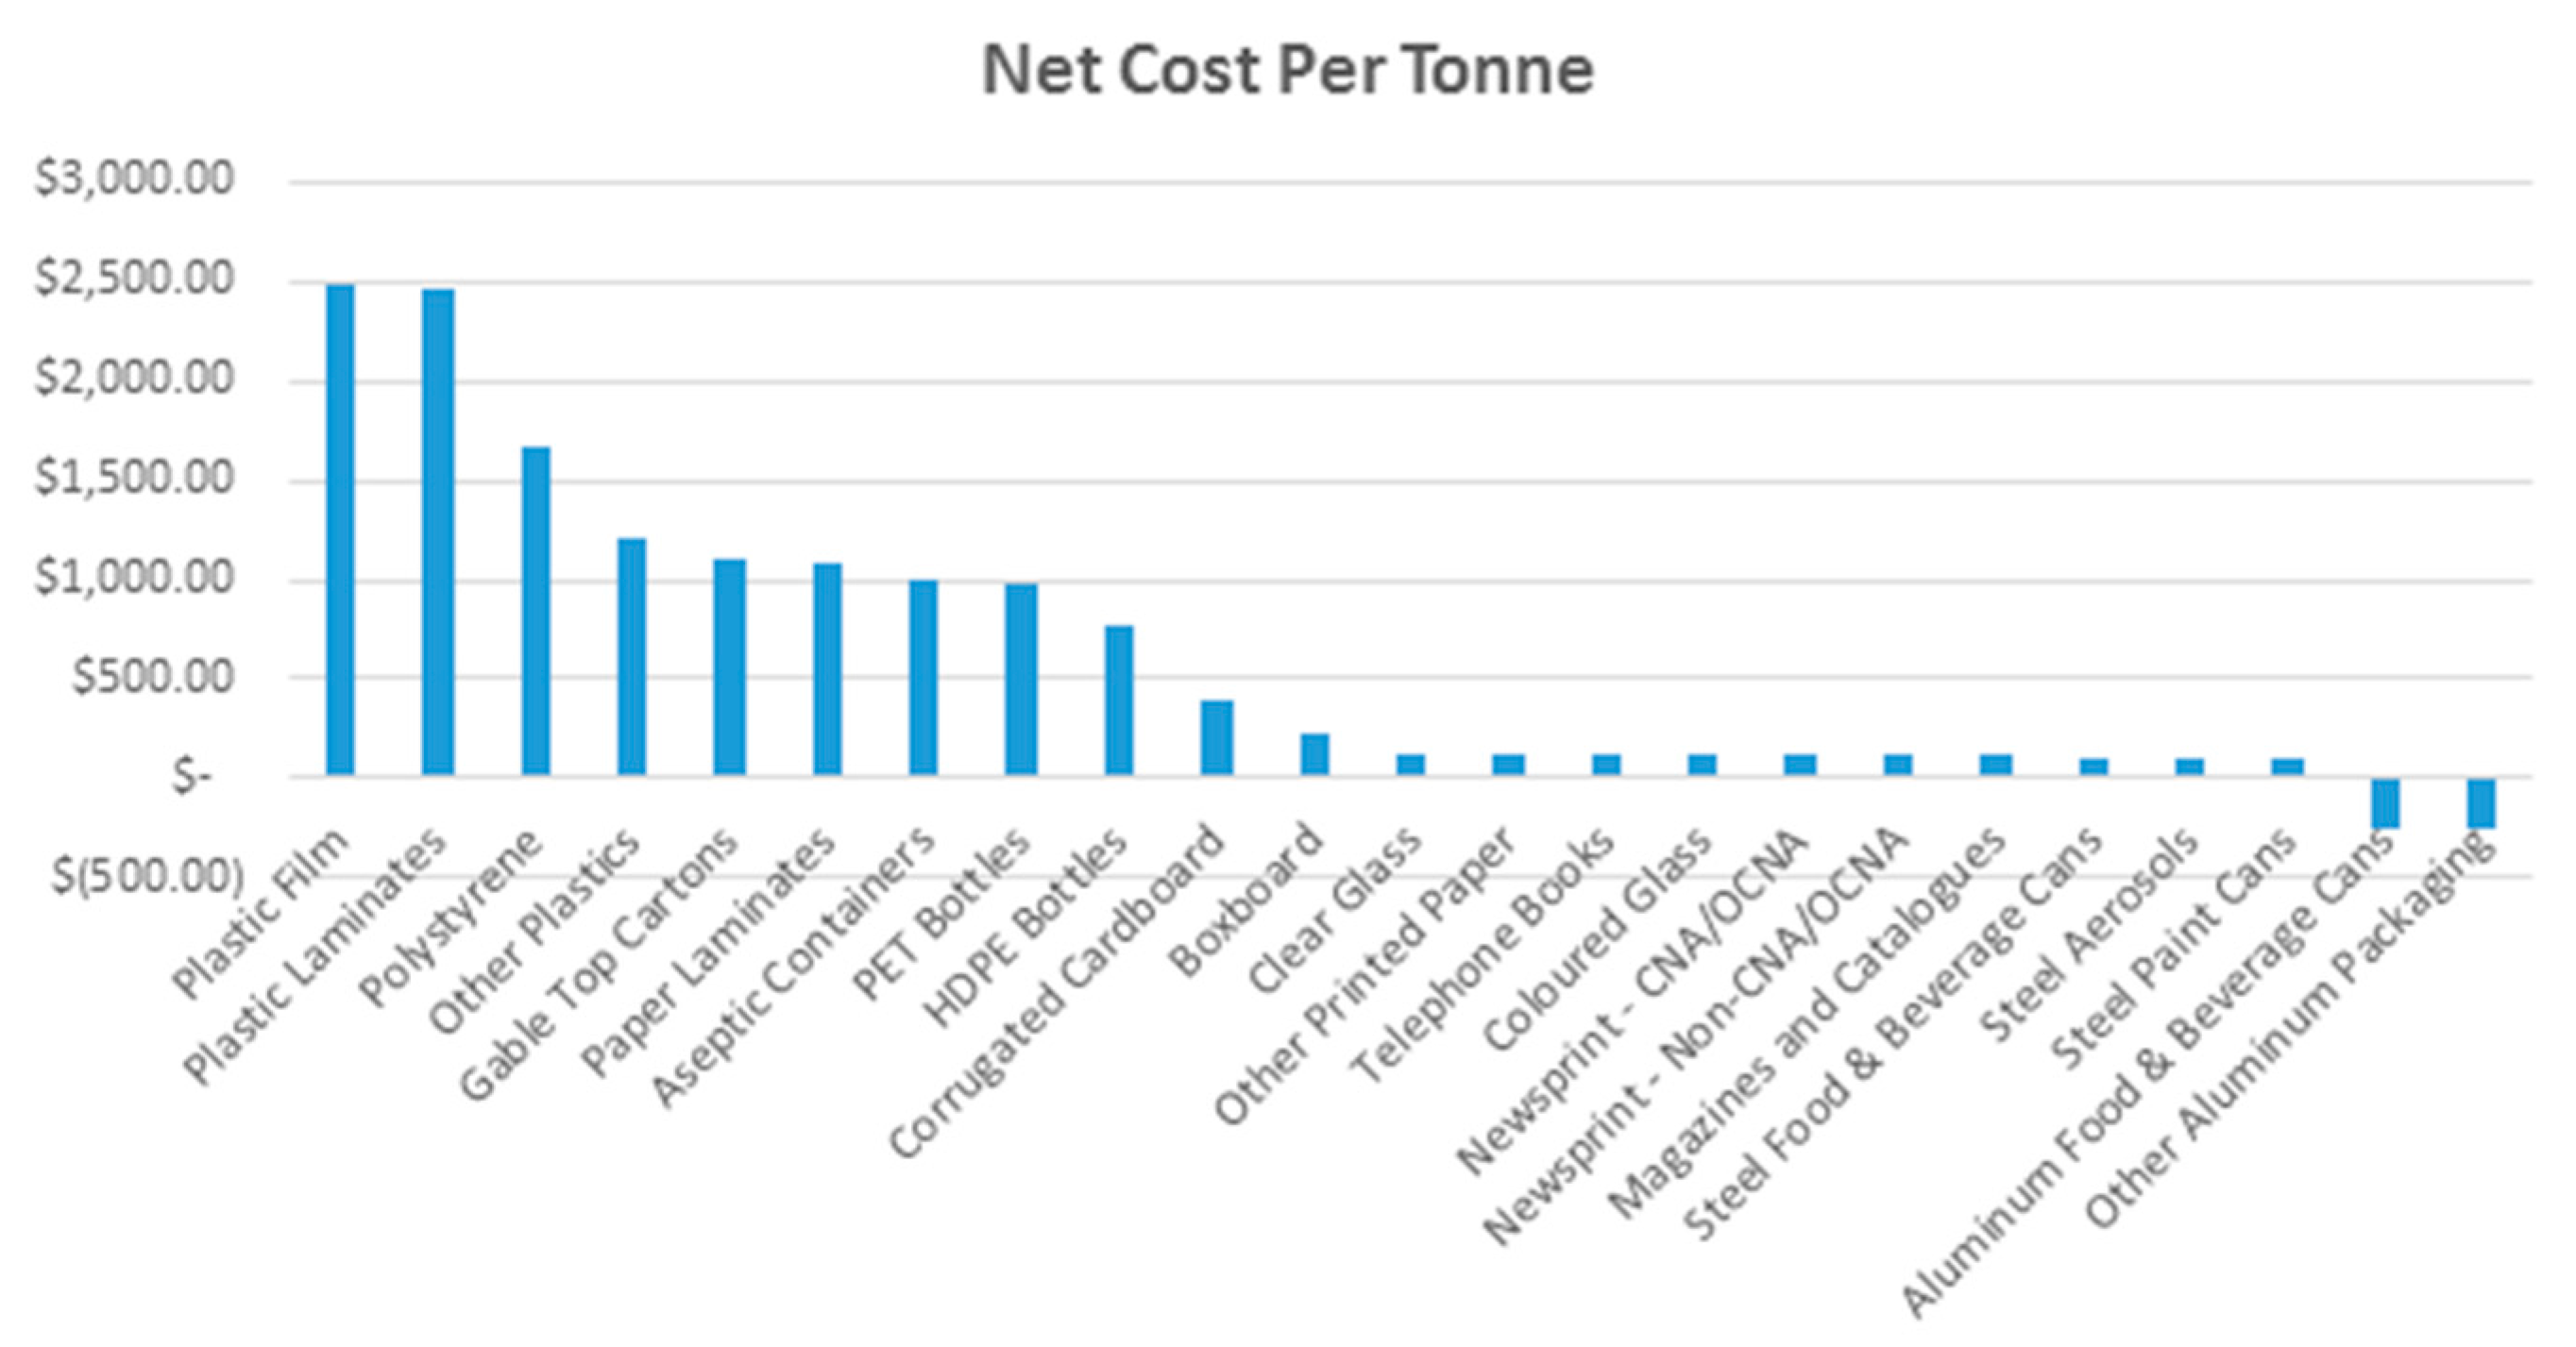
  • 20% of the cost of the program is assigned to each material category based on the net cost of managing each material in the system;
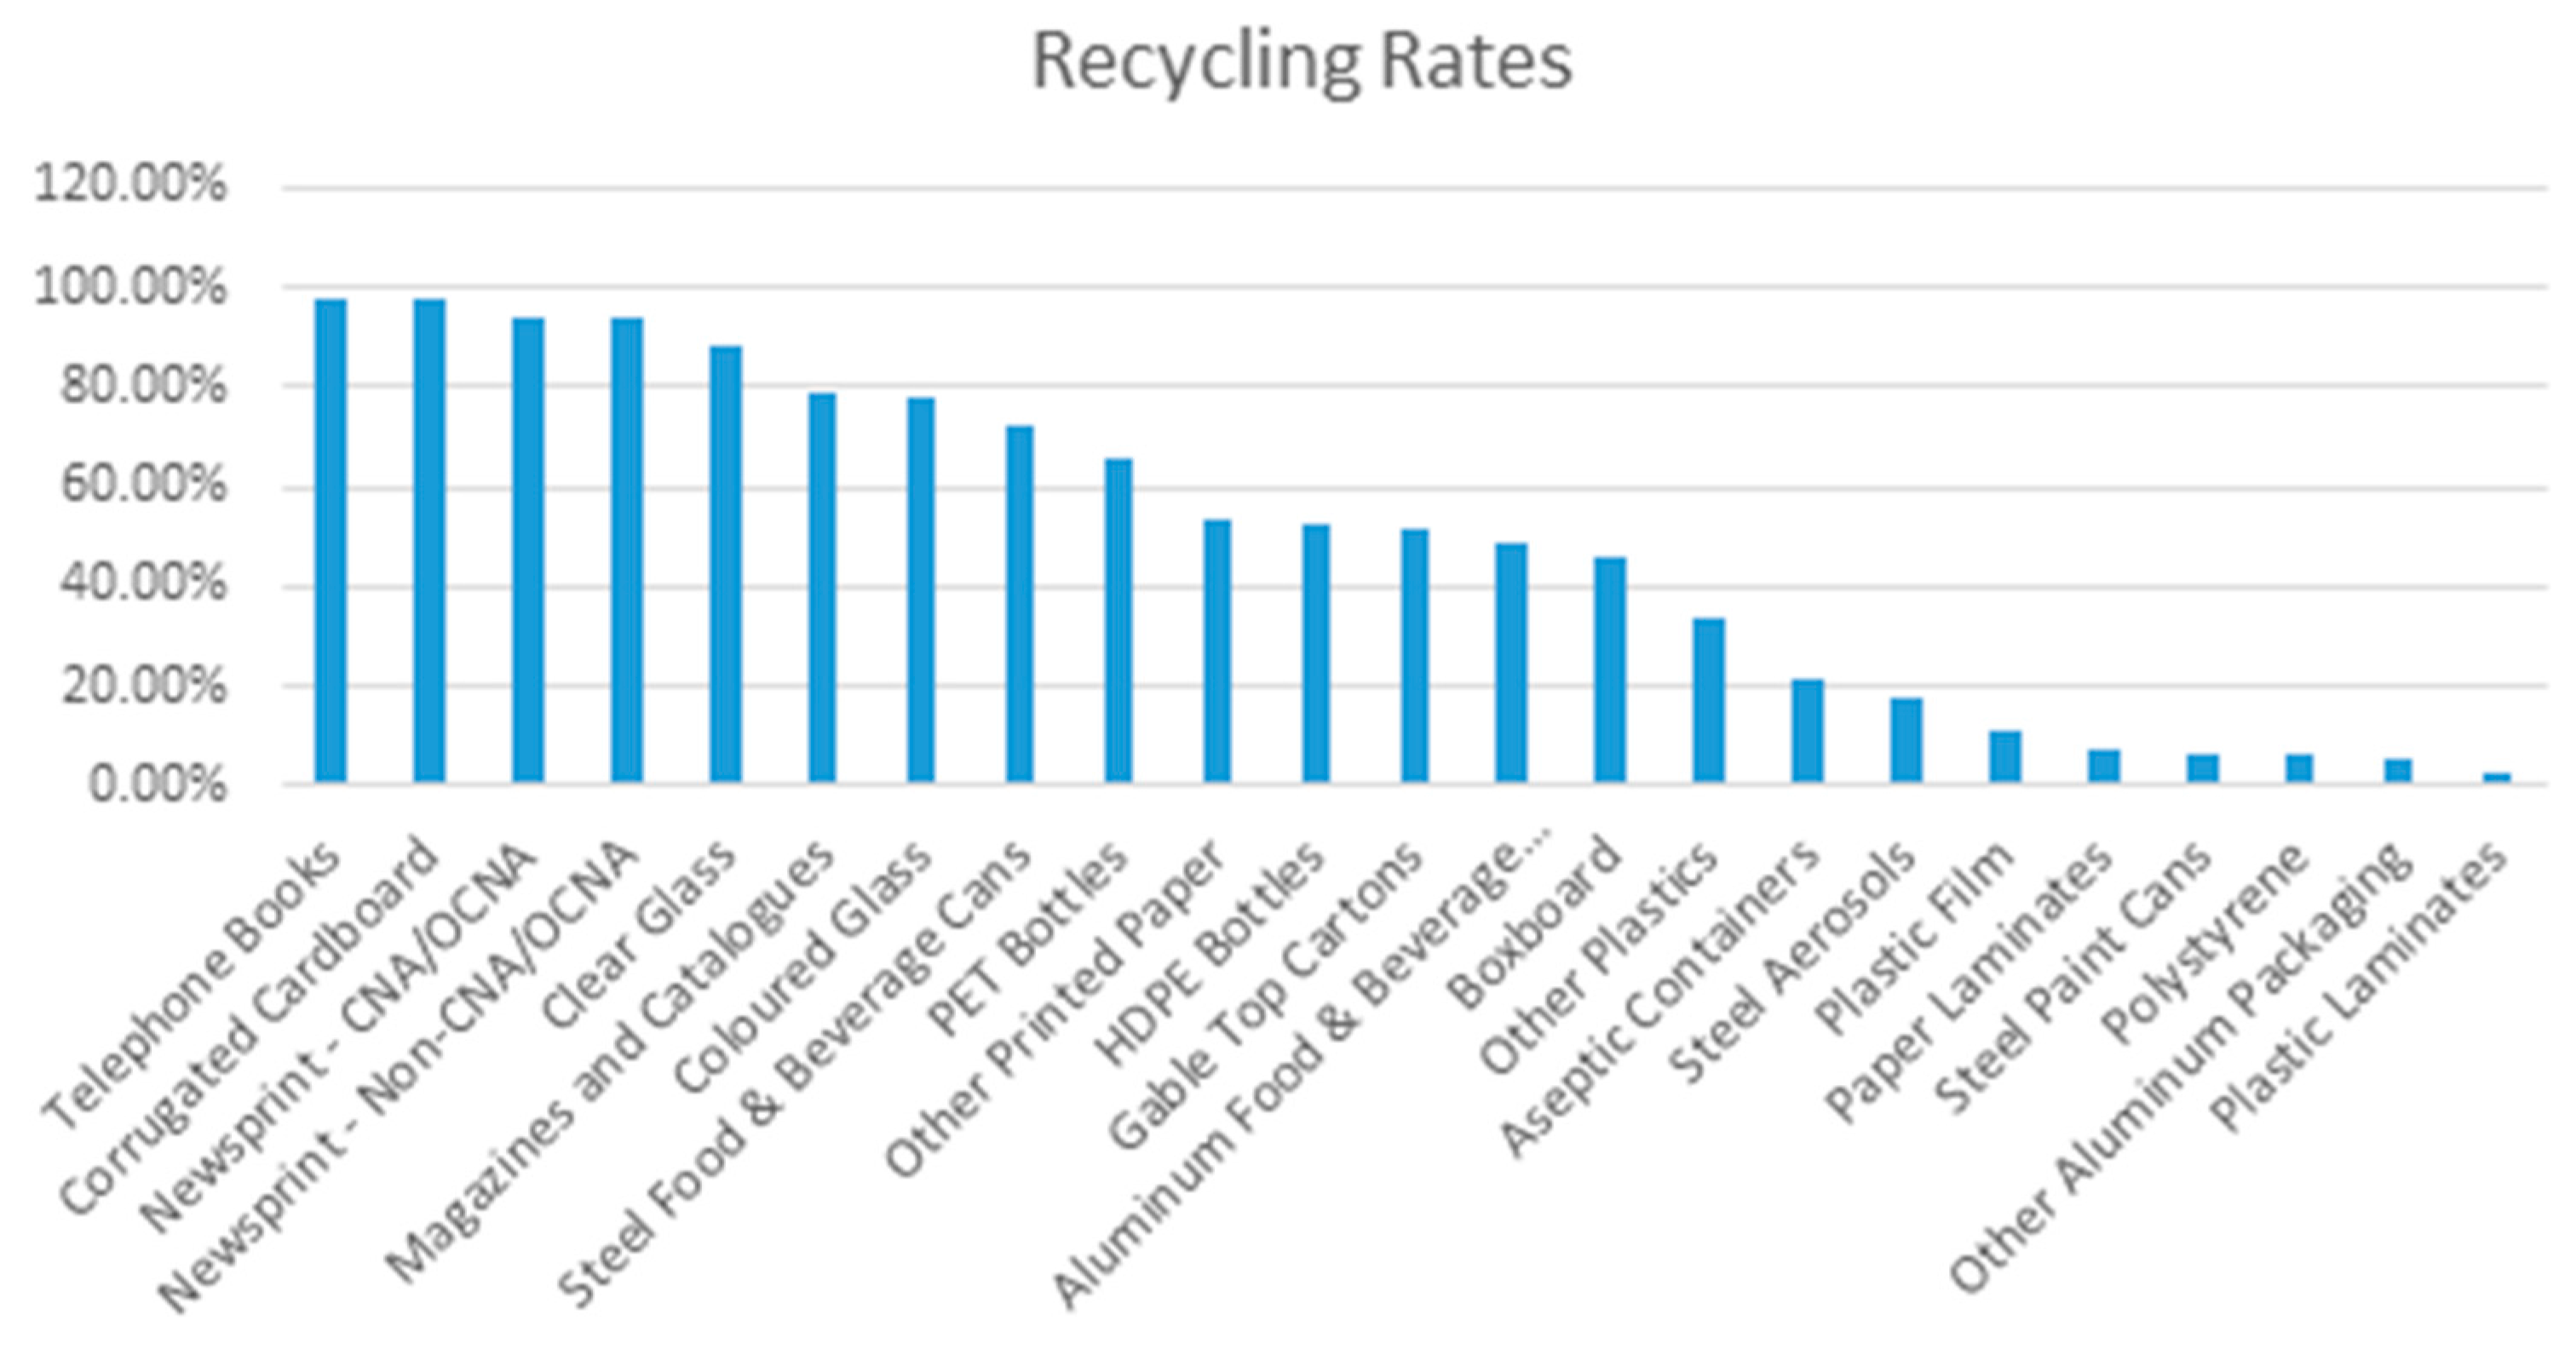
  • 55% of the cost of the program is assigned based on the recovery rate achieved by that material;
  • 25% of the cost of the program is assigned based on how much it would cost to manage the material if it were recovered at a rate of 60% (only applies to materials achieving less than 60% target rate) [16].
The objective of the fee setting process is to share the cost of achieving Ontario’s diversion target among packaging producers for obligated materials [16]. The intuition behind the fee setting formula is to reward materials with high recovery rates while sharing the cost among all materials participating in the program. Stated alternatively, materials with lower recycling rates partially subsidize the cost of recycling materials with higher recycling rates.
For the purposes of this study, the PIM model was used to calculate material-specific generation, recovery and cost data.
Data used in this study pertains to packaging materials found in the residential recycling stream for printed paper and packaging materials. This includes the following materials:
  • Newsprint
  • Magazines and Catalogs
  • Telephone Books
  • Other Printed Paper (e.g., Office paper)
  • Corrugated Cardboard
  • Boxboard
  • Gabletop Cartons (e.g., milk and orange juice containers)
  • Aseptic Containers (e.g., juice boxes)
  • Paper Laminants (e.g., coffee cups)
  • PET (Polyethylene terephthalate) Bottles (e.g., water bottles)
  • HDPE (High density polyethylene terephthalate) Bottles (e.g., laundry detergent)
  • Plastic Film (e.g., grocery bags)
  • Plastic Laminants (e.g., chip bags)
  • Polystyrene
  • Other Plastics (e.g., margarine tubs and lids)
  • Steel Food and Beverage Cans
  • Steel Aerosols
  • Steel Paint Cans
  • Aluminum Food and Beverage Cans
  • Other Aluminum Packaging
  • Clear Glass
  • Colored Glass
Figure 1, Figure 2 and Figure 3 compare the fee rates, net cost of material management and recycling rates for the full range of Blue Box materials. Net cost of material management is calculated by taking the gross cost of material management and subtracting revenue from the sale of marketed material. Revenue for each material is calculated using the twelve-month average of the spot price received from the sale of material by provincial municipalities. Recycling rates are calculated by dividing the total quantities of material recovered by the total quantities of material generated.
As shown in the above figures, on average, materials with the highest fee rates also have the highest costs of material management and lowest recycling rates. This is largely an expected result given the way in which fee rates are calculated (using the three factor formula described in Section 3.2).
Using historical data from the Stewardship Ontario PIM model, Table 2 below shows how generation of high fee rate (>10 c/kg) materials has changed over the past decade. For illustrative purposes, these figures are compared against how the generation of low fee (<10 c/kg) materials have changed during this same period.
As shown in Table 2, total quantities of “high fee” materials have increased by almost 151,000 tonnes over the past decade (a 94% increase). For comparison, there has been a decrease of 182,000 tonnes for “low fee” materials. It should be noted that quantities of overall household waste generation in Ontario have actually decreased in the past decade. In 2002, the average Ontarian generated 383 kg of waste per year. This is compared to 366 kg per capita/per year estimated by WDO in 2012 [17]. Some municipal officials have suggested that decreases in generation are not necessarily attributed to changes in household behavior, but due to the increasing shift towards light weight packaging by packaging producers. There is evidence to support these claims, as a review of steward sales data remitted to Stewardship Ontario indicates that the quantities of packaging waste sold into the market (expressed in terms of unit sales, not weight-based metrics, i.e., tonnes) has increased over the past decade [16].
Coincidentally, this can be seen as a direct result of how packaging producers have responded to the evolution of Ontario’s fee allocation model. The fees charged to packaging producers as part of the province’s EPR system are calculated on a per tonne basis. As such, many packaging producers have opted to switch to light weight packaging (namely LDPE (Low Density Polyethylene Terephthalate), PET thermoforms and polystyrene crystal) to minimize the impact of the fee. While these materials traditionally have higher fee rates, fees are denominated in kilograms. As such, the total fee paid by packaging producers tends to be lower in absolute terms (due to light weighting of material). The issue with this is twofold: (1) Consumers don’t readily recognize these materials as being recyclable, and (2) these items are voluminous but not very heavy. This not only results in less material being placed in the Blue Box, but lower tonnages (and thus lower recycling rates) for the material that is collected. The impact of these changes have been significant, as Ontario’s recycling rate stagnated at 68% in 2010, and subsequently declined to 63% in 2014 [15]).

4. Results

A regression model was developed to ascertain what relationship (if any) exists between packaging environmental handling fees and recycling rates. Based on the intended function of Ontario’s fee setting methodology, it is expected that increases in recycling rates are positively correlated with packaging fees. It should be noted that a distinction exists between high recycling rates and marginal increases in recycling rates. By definition, materials with low levels of recyclability have the highest fee rates. The purpose of the fee is to incentivize packaging producers to improve their recycling rates such that relative fee rates will decline over time.

Statistical Analysis

Using the Breusche-Pagan Lagrange (LM) multiplier test, we test to see whether a random or fixed effects regression should be used in place of a pooled ordinary least squares (OLS) analysis [18]. A Breusche-Pagan multiplier test is used to test for heteroscedasticity in a linear regression model, and is useful in helping decide between a random/fixed effects regression and a simple OLS regression. The testing reveals that the null hypothesis is rejected, as the variance across entities is greater than zero. As such, pooled OLS is dismissed as an appropriate regressive technique. To determine whether a fixed or random effects model should be used, a Hausman test was conducted to see whether the unique errors of the model (ui) were correlated with the regressors [19]. The results show that cross-sectional variance components are greater than zero, suggesting that a fixed effects regressive model is the best available choice given the characteristics of the dataset.
However, with specific regards to this study, endogeneity poses an issue, as the independent variables (fee rates) is a function of the dependent variable (recycling rates). To correct for endogeneity of the fee rate (FR) variable, we instrument the variable FR with its one-year lagged variable. Prior year fee payments affect current year packaging recycling rates, but current year recycling rates have no bearing on prior year fee rates. An instrumental variable two-stage least squares regression is used to model our results. It should be noted that collinearity also poses a problem among the independent variables, as fee rates are a function of material-specific costs. However, using a variance inflation factors (VIF) test, it was determined that the variance of the estimated regression coefficient was sufficiently close to 1, indicating negligible multicollinearity.
The linear econometric specification of the packaging recycling rate function is:
RR = β0 + β1 FRit − 1 + β2Revit + β3COSTit + β4TIMEit + ai + uit
RR refers to the dependent variable, packaging-specific recycling rates. Fee Rates (FR) refers to material-specific fee rates for packaging materials using the three-factor formula based on the net cost of material management, material-specific recycling rates, and an equalization payment. Revenue (REV) refers to the material-specific revenue (expressed on a per tonne basis) received from the sale of baled and marketed materials. COST refers to the cost per tonne for managing packaging materials in the recycling system. TIME is the dummy variable for each year except for the first year, and ai and uit are the components for the unobserved disturbance for packaging type i during time t.
While the specified model used in this study may seem simplistic in design, it is important to note that the emphasis of the testing is to see how fee rates affect changes in packaging recycling rates. Previous works have undertaken a more comprehensive examination of the drivers of recycling behavior, but have done so from the perspective of consumers [20,21]. Conversely, examination of municipal transfer payments showed how municipal incentivization affects municipal recycling behavior [22]. As far as can be ascertained, this is one of the few studies to specifically examine the relationship between packaging fees and recycling rates over time (in a Canadian context). Assuming that producer behavior responds to changes in fee rates, packaging producers can promote recycling by serving as both internal and external facilitators of recycling (through increased promotion and education, investing in recycling infrastructure, etc.). If no material relationship exists between packaging fee rates and recycling performance, we assume that changes in recycling rates are explained by factors unrelated to packaging fee rates.
Table 3 and Table 4 below summarize the results from the fixed effects panel regression for packaging materials (on both a system wide and material-specific basis).
The above results did not demonstrate an association between packaging fee rates and recycling rates (for either the system as a whole or by individual material types). For every $0.01 increase or decrease in packaging fee rates, recycling rates would change by 0.000136%. There is no evidence to suggest that packaging producers are incentivized to continue or improve their recycling performance under Ontario’s existing fee model.
Of note, both cost per tonne and revenue were observed to have a statistically significant impact in our model. For every one dollar in the cost per tonne for recycling material, recycling rates would on average, decrease by approximately −0.2%. Conversely, recycling rates were positively correlated with revenue (increasing by approximately 0.3% for every one dollar increase in revenue). Model estimates did not find any discernable relationship between what types of materials are affected by changes in cost or revenue.

5. Conclusions

This study undertook a critical examination of Ontario’s fee setting methodology, specifically examining the relationship between packaging fee rates and material-specific recycling rates. Using data collected for each of the 23 materials found in the residential recycling program over the past decade, a regression model was developed to gauge what relationship (if any) packaging recycling rates have with fee rates, material-specific costs and revenue. The modeling in this study indicates that packaging fee rates have no effect on packaging recycling rates. Recycling rates were positively correlated with material revenue and negatively correlated with material management costs. The findings from this study raise some serious questions regarding the efficacy of Ontario’s fee setting methodology. There is no evidence that suggests the three-factor formula used to allocate fees to individual materials encourages waste diversion. The disconnect in the results and the intended function of packaging fee rates calls into question the appropriateness of Ontario’s fee rate methodology.
It is the recommendation of this study that the province re-evaluate Ontario’s fee incentivization model, particularly in light of the relative complexity of how fees are allocated and the lack of stakeholder awareness regarding the incentive model’s functions. Partial disaggregations, in kind contributions, equalization payments, etc. are all critical components in determining how fees are calculated. However, comparatively few truly understand how these things work. There is a need for increased transparency with respect to the inner workings of Blue Box fee setting policies. If the province wants to improve upon these policies such that they successfully promote recycling performance, it is of paramount importance that they do away with the black box nature of the Blue Box program.
Ontario should be credited for being the first province to embrace an EPR scheme for packaging waste. However, the distribution of Blue Box costs to individual materials needs to either reflect the actual cost of managing the material in the system, or, alternatively, make the penalty for producing non-recyclable packaging sufficiently high to act as an actual deterrent. Currently, the fee incentivization model occupies a peculiar (and ineffectual) middle ground—it only partially reflects material management costs, and the penalty for low recycling rates is inconsequentially low. Packaging producers continue to switch to lighter weight, but difficult-to-recycle material, as the fee rate penalty is more than offset by savings in transportation and logistics costs. Decision-makers and policy planners need to make a conscious decision to prioritize what they want from the Blue Box system: a true cost recycling system, or one where design for the environment principles are prioritized. The issue of how fees are distributed to individual packaging materials is of particular importance to other Canadian jurisdictions. Several provinces have used Ontario’s fee setting methodology as the basis for which to design their EPR programs. Given the lack of proven efficacy of Ontario’s fee setting approach, it seems prudent that alternative EPR fee models be explored.
The examination of packaging fee rates (particularly those that are distributed using an incentive-based model) is still very much in its conceptual infancy, as the advent of EPR for packaging waste is a relatively new phenomenon in North America. However, as EPR systems are adopted in other provinces and states, an understanding of how packaging producers can be encouraged and incentivized to design recyclable and environmentally sound products will be of growing importance.

Conflicts of Interest

The authors declare no conflict of interest.

References

  1. Lindhqvist, T.; Lifset, R. Can we take the concept of individual responsibility from theory to practice? J. Ind. Ecol. 2003, 7, 3–6. [Google Scholar] [CrossRef]
  2. Gertsakis, J. Industrial ecology and extended producer responsibility. In A Handbook of Industrial Ecology; Ayres, R.U., Ayres, L.W., Eds.; Edward Elgar Publishers: Cheltenham, UK, 2002; pp. 27–35. [Google Scholar]
  3. Mayers, K. Strategic, financial, and design implications of extended producer responsibility in Europe: A producer case study. J. Ind. Ecol. 2007, 11, 113–131. [Google Scholar] [CrossRef]
  4. Deutz, P. Producer responsibility in a sustainable development context: Ecological modernisation or industrial ecology? Geogr. J. 2009, 175, 274–285. [Google Scholar] [CrossRef]
  5. Mayers, K.; Lifset, R.; Bodenhoefer, K.; Van Wassenhove, L.N. Implementing individual producer responsibility for waste electrical and electronic equipment through improved financing. J. Ind. Ecol. 2013, 17, 186–198. [Google Scholar] [CrossRef]
  6. Walls, M. Extended Producer Responsibility and Product Design: Economic Theory and Selected Case Studies. Available online: http://ssrn.com/abstract=901661 (accessed on 10 November 2008).
  7. Gottberg, A.; Morris, J.; Pollard, S.; Mark-Herbert, C.; Cook, M. Producer responsibility, waste minimization and the WEEE Directive, Case studies in ecodesign from the European lighting sector. Sci. Total Environ. 2006, 359, 38–56. [Google Scholar] [CrossRef] [PubMed]
  8. Mayers, K.; Butler, S. Producer responsibility organizations development and operations. J. Indus. Ecol. 2013, 17, 277–289. [Google Scholar] [CrossRef]
  9. Stephenson, D. Internal White Paper on EPR (For Discussion Only). 2010. Available online: www.stewardedge.ca/content/archived/2010/EPRdiscussion.doc (accessed on 17 January 2016).
  10. Sheehan, B.; Spiegelman, H. EPR in the US and Canada. Resour. Recycl. 2005, 3, 18–21. [Google Scholar]
  11. Schwartz, J.; Gattuso, D. Extended Producer Responsibility: Re-Examining Its Role in Enviornmental Progress. Available online: http://www.rppi.org/ps293.pdf (accessed on 17 January 2016).
  12. Seidel, C. Zeroing in on Waste: The Role of Extended Producer Responsibility in a Zero Waste Strategy. Recycling Council of Alberta. From Recycling Council of Alberta. 2006. Available online: http://www.gpiatlantic.org/conference/proceedings/seidel.ppt (accessed on 27 February 2006).
  13. Pro Europe. Packaging and EU Directive on Waste. 2012. Available online: http://www.pro-e.org/2009-Q&A-Packaging-and-EU-Directive-on-waste.html (accessed on 10 November 2015).
  14. Waste Diversion Ontario. About WDO. 2012. Available online: http://www.wdo.ca/content/?path=page81+item35937 (accessed on 10 November 2016).
  15. Stewardship Ontario. Blue Box Annual Report. 2003–2015. Available online: http://www.wdo.ca/content/?path=page82+item35785 (accessed on 17 January 2016).
  16. Stewardship Ontario. Pay in Model. 2005–2015. Available online: http://www.stewardshipontario.ca/stewards-bluebox/fees-and-payments/fee-setting-flow-chart/the-pay-in-model/ (accessed on 17 January 2016).
  17. Waste Diversion Ontario. 2012 Ontario Residential Diversion Rates. 2014. Available online: http://www.wdo.ca/files/8413/9040/6230/Datacall_Diversion_Rates_2012.pdf (accessed on 17 January 2016).
  18. Breusch, T.S.; Pagan, A.R. A simple test for heteroscedasticity and random coefficient variation. Econometrica 1979, 47, 1287–1294. [Google Scholar] [CrossRef]
  19. Hausman, J.A. Specification Tests in Econometrics. Econometrica 1978, 46, 1251–1271. [Google Scholar] [CrossRef]
  20. Sidique, S.F.; Lupi, F.; Joshi, S.V. Factors influencing the rate of recycling: An analysis of Minnesota counties. Resour. Conserv. Recycl. 2009, 54, 242–249. [Google Scholar] [CrossRef]
  21. Oom do Valle, P.; Reis, E.; Menezes, J.; Rebelo, E. Behavioural determinants of household recycling participation. Environ. Behav. 2004, 36, 505–540. [Google Scholar] [CrossRef]
  22. Lakhan, C. The relationship between municipal waste diversion incentivization and recycling rate performance: An Ontario Case Study. Resour. Conserv. Recycl. 2016, 106, 68–77. [Google Scholar] [CrossRef]
Figure 1. Fee Rates for Blue Box Materials (Adapted from Stewardship Ontario PIM Model [16]).
Recycling 01 00136 g001
Figure 2. Net Cost Per Tonne for Blue Box Materials (Adapted from Stewardship Ontario PIM Model [16]).
Recycling 01 00136 g002
Figure 3. Recycling Rates for Blue Box Materials (Adapted from Stewardship Ontario PIM Model [16]).
Recycling 01 00136 g003
Table 1. European Union Programs Summary.
ApproachCountriesTrends
Producers pay 100% of costs15Move towards competing compliance schemes
Producers pay shared costs10Move to increasing industry cost share + costs of disposal for packaging not recycled
Tradable credits schemes2Provides only indirect price support for municipal recycling; focus on transport packaging
Packaging taxes2Add carbon costs as well as recycling costs; new government revenue source
Table 2. Changes in generation of high and low fee Blue Box Packaging (Source: [16]).
Materials2003 Quantity Generated2013 Quantity Generated
(tonnes)(tonnes)
High Fee Materials
Gable Top Cartons14,249 T42,000 T
Paper Laminants2800 T39,205 T
Aseptic Containers5820 T12,800 T
Plastic Film53,700 T54,383 T
Plastic Laminants35,391 T35,391 T
Polystyrene20,400 T57,400 T
Other Plastics28,300 T70,790 T
Low Fee Materials
Newsprint–CNA/OCNA264,800 T217,375 T
Newsprint–Non-CNA/OCNA136,400 T148,405 T
Magazines and Catalogues95,100 T78,908 T
Telephone Books15,000 T8329 T
Other Printed Paper127,800 T128,245 T
Corrugated Cardboard140,000 T169,361 T
Boxboard130,500 T163,988 T
PET Bottles36,200 T56,848 T
HDPE Bottles23,000 T27,598 T
Steel Food & Beverage Cans57,800 T45,286 T
Steel Aerosols4300 T4079 T
Steel Paint Cans4800 T5072 T
Aluminum Food & Beverage Cans24,100 T22,552 T
Other Aluminum Packaging2408 T4521 T
Clear Glass76,200 T74,522 T
Coloured Glass6700 T25,277 T
Table 3. Relationship between changes in year over year recycling rate and packaging fee rates (system wide). Instrumental Variable (2SLS) regression; Number of observations = 207; R2 = 0.2654.
Independent VariablesPackaging Materials (RR%)Std. ErrorZ Score
FR0.0001360.00020.03
REV0.295610.58683.90
COST−0.2145640.28474.41
Table 4. Relationship between changes in year over year recycling rate and packaging fee rates (material-specific).
MaterialFRREVCOST
Newsprint (Newspaper Association)0.0002200.18690−0.14366
Newsprint–(Not part of Newspaper Association)−0.0000700.34266 *0.13147
Magazines and Catalogues0.0008690.31110 *−0.21833
Telephone Books−0.0004350.32136 *0.27699 **
Other Printed Paper−0.0005040.26247 **0.29483 **
Corrugated Cardboard−0.0004410.32004 *−0.13283
Boxboard0.0002500.22784−0.28680 **
Gable Top Cartons0.0003510.37000 *−0.30779 *
Paper Laminates−0.0004370.35511*−0.12441
Aseptic Containers0.0005940.229200.32168 *
PET Bottles0.0002510.13968−0.17759
HDPE Bottles0.0006280.21201−0.38966 *
Plastic Film0.0001090.34974 *−0.16741
Plastic Laminates−0.0008800.25767 **−0.14192
Polystyrene0.0009330.27153 **−0.25416
Other Plastics−0.0008960.201250.18090
Steel Food & Beverage Cans−0.0003900.32253 *−0.13927
Steel Aerosols−0.0001800.12530−0.37894 *
Steel Paint Cans0.0006500.24550 **−0.14989
Aluminum Food & Beverage Cans0.0005620.15814−0.10016
Other Aluminum Packaging−0.0001140.11705−0.10969
Clear Glass−0.0005140.115870.29892 **
Coloured Glass−0.0005920.27944 **−0.32096 *
* Denotes statistical significance at the 95% interval; ** Denotes statistical significance at the 90% confidence interval.

