
Properties of Shredded Roof Membrane–Sand Mixture and Its Application as Retaining Wall Backfill under Static and Earthquake Loads

Glenn Department of Civil Engineering, Clemson University, 202 Lowry Hall, Clemson, SC 29634, USA
*
Author to whom correspondence should be addressed.
Recycling 2017, 2(2), 8; https://doi.org/10.3390/recycling2020008
Submission received: 6 December 2016
/
Revised: 23 March 2017
/
Accepted: 30 March 2017
/
Published: 5 April 2017
Abstract
:About 20 billion square feet of Ethylene Propylene Diene Monomer (EPDM) rubber is installed on roofs in the United States and most of them will be reaching the end of their lifespan soon. The purpose of this study is to investigate potential reuses of this rubber in Civil Engineering projects rather than disposing it into landfills. First, laboratory tests were performed on various shredded rubber-sand mixtures to quantify the basic geotechnical engineering properties. The laboratory test results show that the shredded rubber-sand mixture is lightweight with good drainage properties and has shear strength parameters comparable to sand. This indicates that the rubber-sand mixture has potential to be used for retaining wall backfill and many other projects. To assess the economic advantage of using shredded rubber-sand mixtures as a lightweight backfill for retaining walls subjected to static and earthquake loadings, geotechnical designs of a 6 m tall gravity cantilever retaining wall were performed. The computed volume of concrete to build the structural components and volume of backfill material were compared with those of conventional sand backfill. Results show significant reductions in the volume of concrete and backfill material in both static and earthquake loading conditions when the portion of shredded rubber increased in the mixture.
1. Introduction
The growing human population and consumption of raw materials to meet our needs are not only depleting our resources, but also increasing the amount of waste materials that may be disposed in landfills or simply thrown into open lands. To combat this problem, Civil Engineers have been investigating various environmentally sound recycling practices to salvage and reuse construction materials such as concrete, rubber, glass, metal slag, asphalt pavement and other waste materials such as waste tires and roof membranes. One area of interest within geotechnical engineering is the use of waste material as an alternative to coarse grained soil. Replacing heavy soil with lightweight recycled material such as rubber products having comparable engineering properties can not only solve a number of geotechnical engineering design and maintenance issues, but also help to reduce the consumption of natural resources for a sustainable future. Today, most of this rubber waste is derived from the hundreds of millions of scrap tires generated annually. Significant amounts of research have been performed in the last decade to investigate the applicability of waste scrap tires as an alternative to soils in geotechnical engineering [1,2,3,4]. Another rubber product which is removed in large quantities, but hasn’t received much attention from the geotechnical engineering community is Ethylene Propylene Diene Monomer (EPDM) roofing membrane. A pilot recycling program launched in 2006 by the EPDM Roofing Association (ERA) has estimated that between 2006 and 2010 around 6 million square feet of EPDM rubber was dumped into landfills or available to be recycled. Similar to waste tires, these roof membranes can be shredded and used as a viable lightweight alternative to heavy granular soil in geotechnical engineering. These applications may include backfill for retaining walls, cover systems in landfills [5], subgrade layers for roadways [6], embankment fill [7,8], and Mechanically Stabilized Earth (MSE) wall fill [9].
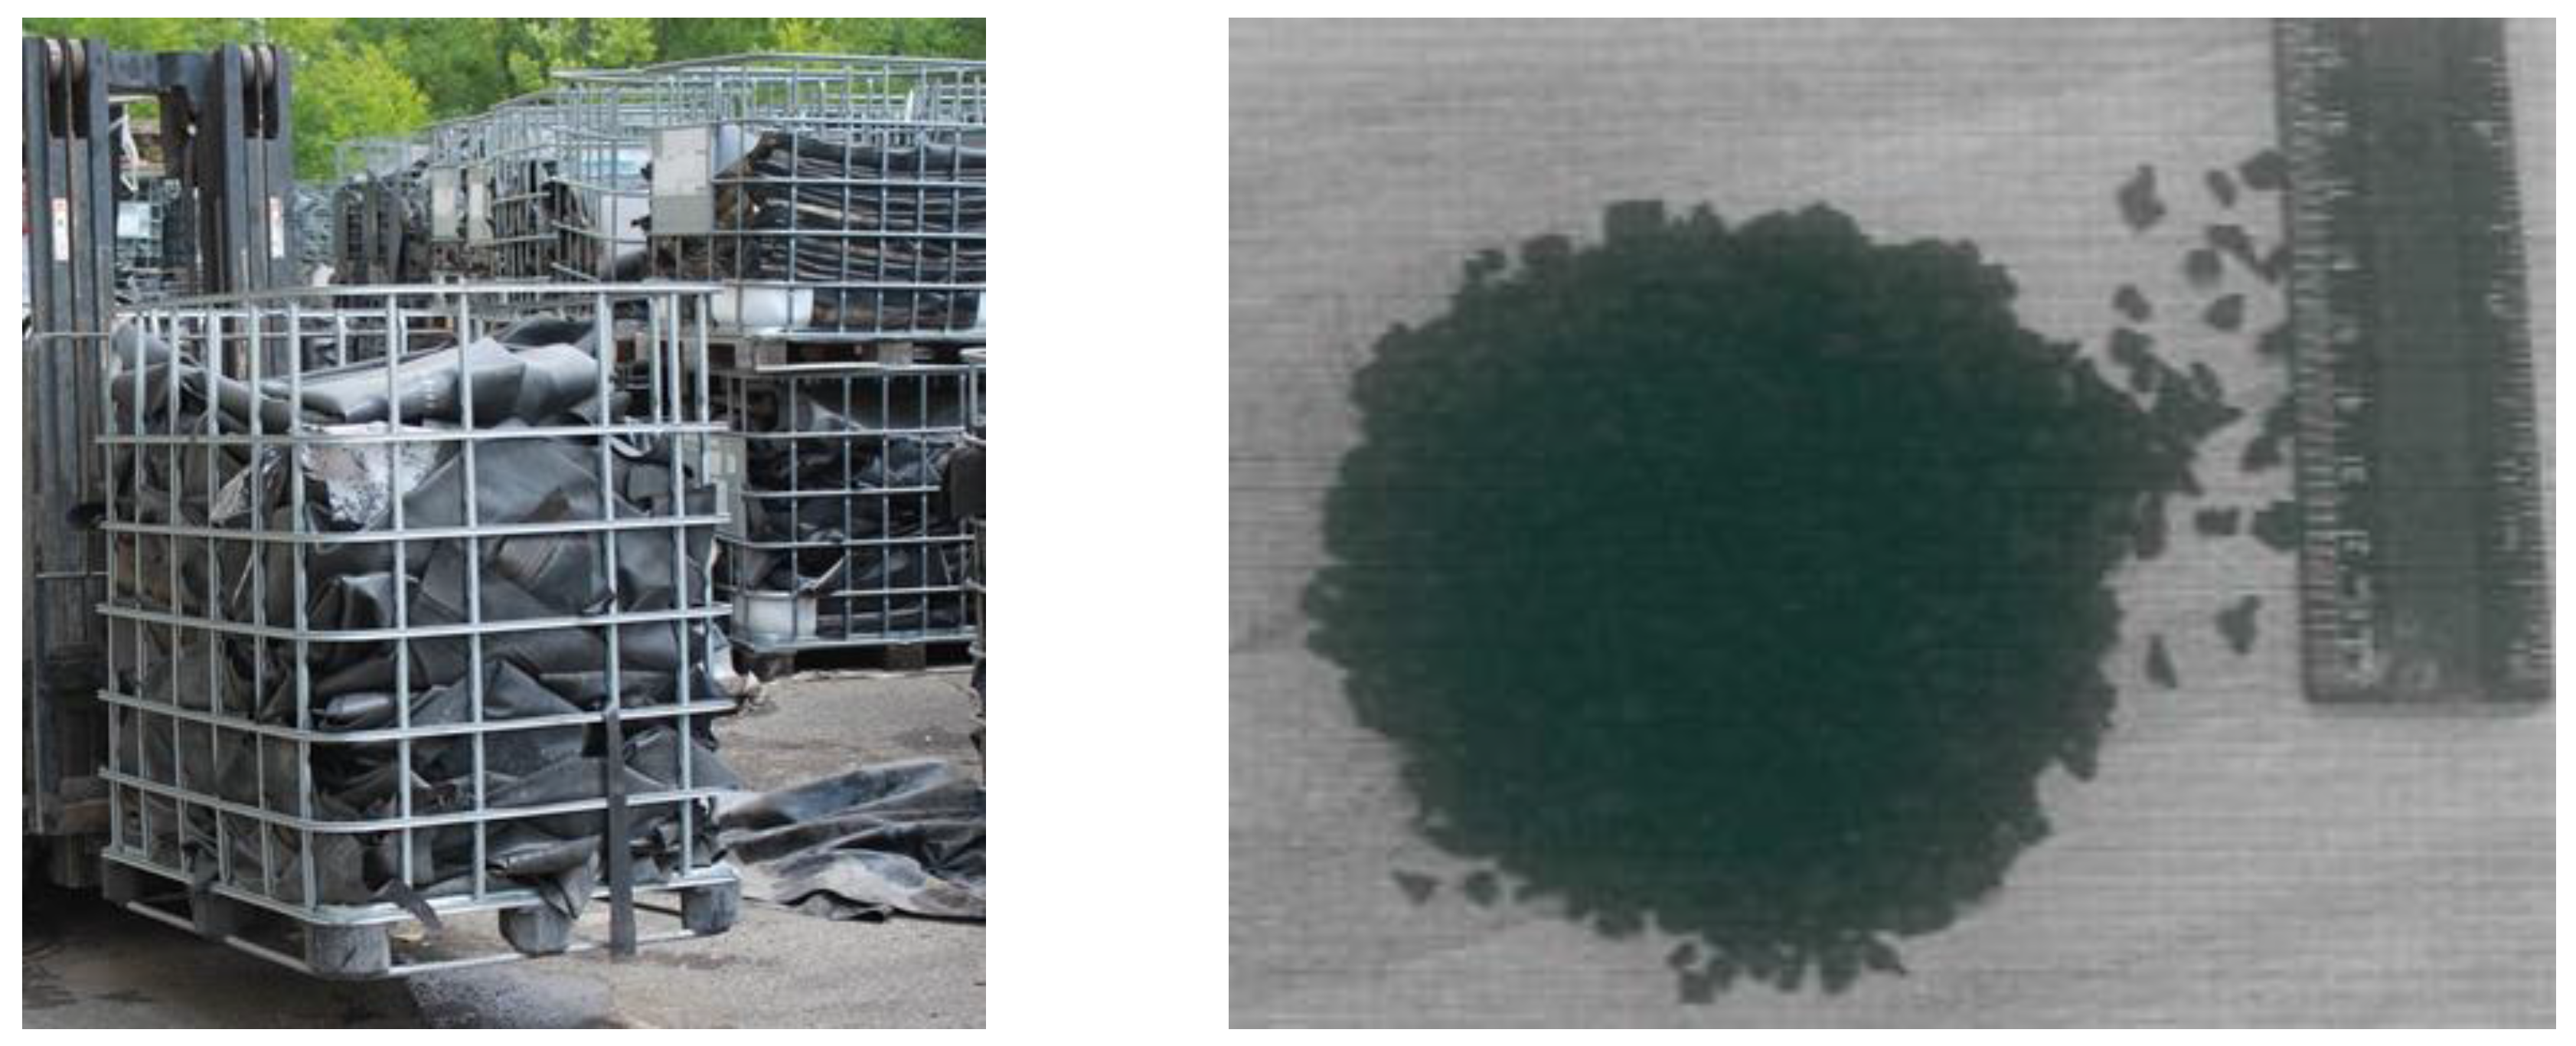
Roofing waste material is already a problem as the Environmental Protection Agency (EPA) reported that approximately 40% of landfill waste comes from construction and demolition debris, with a quarter of that generated from roofing materials [10]. Over the last 40 years, 20 billion-plus square feet of rubber roof membrane has been installed on roofs in the United States [10]. With roof membrane having a lifespan ranging from 30 to 60 years, large quantities of roof membrane will soon be dumped into landfills if alternative uses aren’t found. Luckily, recycling programs launched by the ERA have shown that recycling roof membrane is an easy process but needs comprehensive studies to properly use in Civil Engineering applications. The process starts by first removing the ballast covering the roof membrane, cutting it into smaller widths while avoiding roof fasteners and areas with adhesive, rolling it up, and shipping to the recycling facility to grind it into chips [11]. Figure 1 illustrates this process by showing the roof membrane before and after shredding. Furthermore, storage of EPDM rubber is not an issue as it is with shredded tires since roof membrane rubber is not susceptible to fire due to its higher fire resistance (flash point > 200 °C).
The objectives of the present study are to (a) determine the geotechnical engineering properties of the composite material (shredded roof membrane mixed with sand) from laboratory testing and (b) perform geotechnical design and evaluate the economic advantage of using the composite as an alternative to conventional backfill for retaining walls under static and earthquake loading conditions. The mixtures that were tested have ratios of shredded rubber and sand ranging from 100:0, 75:25, 50:50, 25:75, and 0:100%. To assess the economic advantage of using shredded rubber-sand mixtures as a lightweight backfill for retaining walls subjected to static and earthquake shaking, geotechnical design (length of toe and heel of base slab/footing) of a 6 m tall (stem height above base slab) gravity cantilever retaining wall was performed. The volume of concrete to build the structural components and volume of backfill material were computed based on the design results for each rubber-sand mixture and compared with that of conventional sand backfill.
2. Summary of Geotechnical Engineering Properties of Shredded Roof Membrane-Sand Mixture and Potential Applications in Civil Engineering
Since most of the focus has been on the laboratory testing and performance evaluation of waste tires, there is a gap in the research for using other rubber waste materials such as EPDM roof membrane that may behave similarly. Evaluating the properties and performance of such new materials may lead to cost effective, environmentally friendly, and sustainable recycling applications. In this section, the results of key laboratory tests are summarized for various shredded rubber-sand mixtures (by weight).
The tests that were performed on the shredded rubber-sand mixtures are similar to the laboratory testing performed on shredded tires by Cecich et al. [1], Moo-Young et al. [12], and Warith et al. [13]. These tests included sieve analyses, density tests, direct shear tests, and hydraulic conductivity tests to measure the grain size distribution, dry unit weight, friction angle, cohesion, and hydraulic conductivity of various shredded rubber–sand mixtures. The shredded rubber used in the laboratory testing was provided by RK HydroVac Inc. and was shredded to an average size of 1.27 mm. A medium to fine-grained sand obtained locally was used for preparing different mixtures by mixing it with shredded roof membrane. Due to the difference in size, shape and weight of the shredded rubber and sand, preparing uniform mixtures was challenging. Each of the three aforementioned mixtures containing shredded rubber and sand were thoroughly mixed by hand with extra care being taken to prevent segregation of the sand and shredded rubber particles. Each of the lab tests for the various samples was repeated two times and the results presented below are the average of the two tests. Additional details can be found in Kyser and Ravichandran [14].
2.1. Particle Size Distributions of Constituent Materials
Sieve analyses were conducted to obtain the particle size distribution which provided insight into the hydraulic conductivity, compressibility, and shear strength of the material. The tests were conducted following the ASTM D422 procedure [15]. The results for each material are presented in Figure 2.
By examining the distribution curves in Figure 2, it can be seen that the overall size of the shredded rubber is somewhat larger than that of the sand that it was mixed with. Further examination of the distribution curves shows that the shredded rubber is poorly graded, while the sand is more uniformly graded. Using Figure 2, the diameter corresponding to 50% passing (D50) of the shredded rubber was found to be 3.0 mm with the effective diameter which is the diameter corresponding to 10% passing (D10) being 2.1 mm. With these results the uniformity coefficient (Cu) and coefficient of curvature (Cc) were calculated to be 1.52 and 0.93, respectively. The sand however, has much smaller sized particles with a D50 of 0.45 mm and D10 of 0.24 mm. The Cu and Cc of the sand were calculated to be 2.29 and 0.93, respectively. The fact that the shredded rubber chips are smaller than shredded tires points out a clear advantage for the shredded rubber chips while mixing with sand since the smaller size of the shredded rubber chips will allow for easier mixing procedures. When mixing the rubber chips and sand, the large size difference does not allow for uniformity in the mixtures. The rubber chips and sand particles that are similar in size may be easier to mix in the field, allowing for easy grading practices. Easy grading practices can be advantageous for project budgets, as it will save time and cost in crew labor and equipment maintenance.
2.2. Dry Unit Weight
Determining the dry unit weight of the material is important as the self-weight affects the in situ vertical and horizontal stresses, and the settlement of underlying soil and structures. The use of this new composite material may vary depending upon the application discussed in later sections, as a change in the degree of compaction will change the unit weight. In this study, unit weight of the material in its dry state at 60% Standard Proctor compaction energy was determined following ASTM D698 [16] and as suggested in Moo-Young et al. [12] for shredded tires; a material similar to the new composite material used in this study. It should be noted that using the vibration method to compact the sample will easily segregate materials and therefore was not used. In addition, the unit weights in their uncompacted states were measured for using it as loose fill, drainage and filtration element. The results for different shredded roof membrane-sand mixtures are presented in Figure 3.
The unit weights of shredded rubber were found to be similar to that of shredded tires reported by Cecich et al. [1] and Moo-Young et al. [12]. It can be seen in Figure 3 that with the increase in percentage of shredded rubber in the mixture, the uncompacted and compacted unit weights sustainably decrease from 14.4 kN/m3 and 16.2 kN/m3, respectively for the 100% sand mixture to 5.0 kN/m3 and 6.2 kN/m3, respectively for the 100% rubber mixture. The decrease in unit weight verifies that this material can behave similarly to shredded tires, which has reasonably established literature.
2.3. Effective Friction Angle
The friction angle is another important parameter used in the geotechnical application. The shear strength of the composite coarse material is a function of its friction angle and overburden pressure. Direct shear and triaxial apparatuses are widely used for measuring the drained and undrained friction angle of frictional material in the laboratory. Between these two apparatuses, the direct shear test is an easy to use apparatus that gives reasonably accurate results. The various mixtures of shredded rubber and sand were tested in their loose state in a geotechnical laboratory using a direct shear apparatus following the standard procedures outlined in ASTM D 3080 [17]. The tests were conducted at four different normal (vertical) stresses including the reference pressure (1 atm.). For each normal stress, two tests were conducted and the results were averaged to ensure the accuracy of the results.
It was observed during testing that highly compressible mixtures with large percentages of shredded rubber did not display a peak in the shear stress vs. shear displacement plot. According to AASHTO T 236-86 [18], shear failure is also considered to occur when the sample experiences a horizontal displacement equal to 10% of the sample diameter. For these particular samples, the shear stress was considered to be at the shear displacement of 10% of the sample diameter. Additionally, it was noticed that the lines of best fit used to create the shear stress vs. normal stress plots to obtain friction angle yielded a small cohesion intercept for each test, including the 100% sand mixture. It should be noted that researchers have reported cohesion for sandy soils in direct shear tests results and attributed it to be apparent cohesion and a nonlinear Mohr-Coulomb failure envelope. Therefore, for simplicity, all cohesion values were set to zero and the best fit lines were drawn though the origin. The results of these tests are presented below in Figure 4, and are the average of each of the test results.
The best fit line for the variation of friction angle with the percentage of roof membrane presented in Figure 4 shows that, in general, the friction angle of the composite material increased from approximately 32° to 38° when the amount of roof membrane increased from 0 to 100%, respectively. It is well understood that the friction angle of a material is a function of its mineral content, geometric properties, and physical properties. In the case of the shredded rubber-sand mixtures, materials with different mineral content, geometry and physical properties were interacting during shearing. Therefore, it is difficult to provide a single reason for the observed behavior. In general, it can be due to the complex interaction of rubber particles with sand particles which increased the resistance against shearing. When the rubber particles deformed, the interaction becomes complex and the interpretation of the results becomes very complex. When the results from Figure 4 were compared to the friction angle of shredded tires reported by Cecich et al. [1], and Moo-Young et al. [12], the friction angles of shredded rubber-and mixtures were found to be notably higher. This means that the various mixtures can provide resistance against shear that is greater than that of shredded tires alone for the same normal stress as explained by Mohr-Coulomb failure equation. Therefore, not only will the amount of waste materials sent to landfills be reduced, but feasible engineering designs will also be possible without compromising on strength.
2.4. Hydraulic Conductivity
Another important engineering characteristic of the shredded rubber-sand mixtures that was determined in the laboratory was its hydraulic conductivity. Based on the particle size distribution and friction angle, it can be used as a retaining wall backfill in certain areas where there is no surcharge load expected. For such application, the material should have significantly higher hydraulic conductivity to ensure that there is no pore water pressure build-up behind the wall. The build-up of pore pressures can induce additional stress, demanding larger structures and/or decrease of the shear capacity of the composite material. Additionally, due to the much smaller sand particles being able to be placed in-between the larger rubber particles, it is important to understand how water flows through the mixture.
Past studies on shredded tires by Warith et al. [13] used the constant head test to determine hydraulic conductivity, which was also performed in this study, since the sand particles and the larger rubber particles would allow for high hydraulic conductivity to be observed. When preparing the samples for testing, compaction energy was not applied while filling the specimen tube. Therefore, the mixtures were tested in their loose state. Additionally, special care was taken to create a uniform surface at the top of the specimen tube using minimal vibration by leveling it with a straight edge. Once the samples were prepared, they were then tightly secured to the reservoir tube creating a vacuum seal. Using a laboratory permeameter, the tests were performed and the required data sets were recorded. Once the testing was complete, the results were recorded and plotted in Figure 5. It should be noted that during the testing of the 100% shredded rubber mixture, the hydraulic conductivity was so large that the head had to be reduced in order to increase the experiment time, thus reducing the effect of error in recording the time of the experiment.
The hydraulic conductivity of the various shredded rubber-sand mixtures shown in Figure 5 display an interesting trend. It can be seen that adding 25% shredded rubber did not have a significant effect on the hydraulic conductivity. Once 50% shredded rubber was added, the hydraulic conductivity increased dramatically. When compared to shredded tires, the hydraulic conductivity at 50% shredded rubber and greater matches the results of research conducted by Warith et al. [13]. The higher hydraulic conductivity for the composite material is a desirable property for many geotechnical engineering applications and will allow for free drainage with little to no build-up of pore pressures.
2.5. Potential Applications of Shredded Roof Membrane-Sand Mixture in Civil Engineering
By using shredded rubber-sand mixtures in civil engineering applications, engineers can save 20 billon square feet of dilapidated rubber roof membrane from being disposed of in landfills. The summary of experimental results presented in the previous sections shows that the new composite material has many desirable properties for using it as a replacement for heavy granular soil.
The results show that the shredded rubber-sand mixtures have a low dry unit weight, a high friction angle, and can be extremely porous once at least 50% shredded rubber is added to the mixture. All of these properties in combination with each other can lead to civil engineering designs that are just as sustainable as those with other lightweight materials such as shredded tires. Since the rubber is naturally lighter than soil, its dry unit weight in shredded form is lower than that of soil fill. The lowered dry unit weight will decrease the stresses induced on structures leading to designs that can be economical. Moreover, since the roof membrane rubber is lighter, fill mixtures with large rubber ratios can be placed on soils that are soft and compressible and not induce large settlements. Additionally, the direct shear testing of the roof membrane rubber with and without sand has shown that it has a high friction angle. Results show, in general, that the shredded rubber has higher shear resistance than that of sand. This indicates that the composite material can be used in situations where shearing failure planes may develop in embankments or roadway subgrades. Lastly, the pore distribution of the particles with at least 50% rubber becomes large enough for water to flow freely through it. While the shredded rubber-sand mixture has proven to behave well in the laboratory, it is currently an unused material that has many potential uses. To help fill the void left in this field of study, a potential application of shredded rubber-sand mixtures is discussed below.
3. Geotechnical Design and Analysis of Retaining Wall Backfilled with Recycled Shredded Roof Membrane-Sand Mixture
While there are many potential applications of the shredded rubber-sand mixtures as lightweight fill, its use as retaining wall backfill is of particular interest. Due to the large amounts of material needed for backfill volume, shredded rubber mixed with sand has the potential to drastically reduce landfill volumes by diverting the roof membrane for reuse. Additionally, much smaller retaining walls can be built when lightweight backfill is used, leading to cost savings in concrete volume and excavation volume as shown by the research on shredded tires in retaining walls by Cecich et al. [1] and Ravichandran and Huggins [4]. Since there is no research quantifying the benefits of shredded rubber-sand backfills, the aim of this example problem is to do so by determining the cost savings when using it as retaining wall backfill. A total of five backfill mixtures were studied, which included the 100:00, 75:25, 50:50, 25:75, and 0:100 shredded rubber:sand mixtures previously discussed. Using the results obtained from laboratory testing, the retaining wall dimensions and cost for these four mixtures were compared to the dimensions and cost of a retaining wall backfilled with conventional sand fill. These analyses were conducted for the static condition with no earthquake loading and the dynamic condition where earthquake loading was applied to determine the applicability of shredded rubber in seismically active areas.
3.1. Problem Definition and Methodology
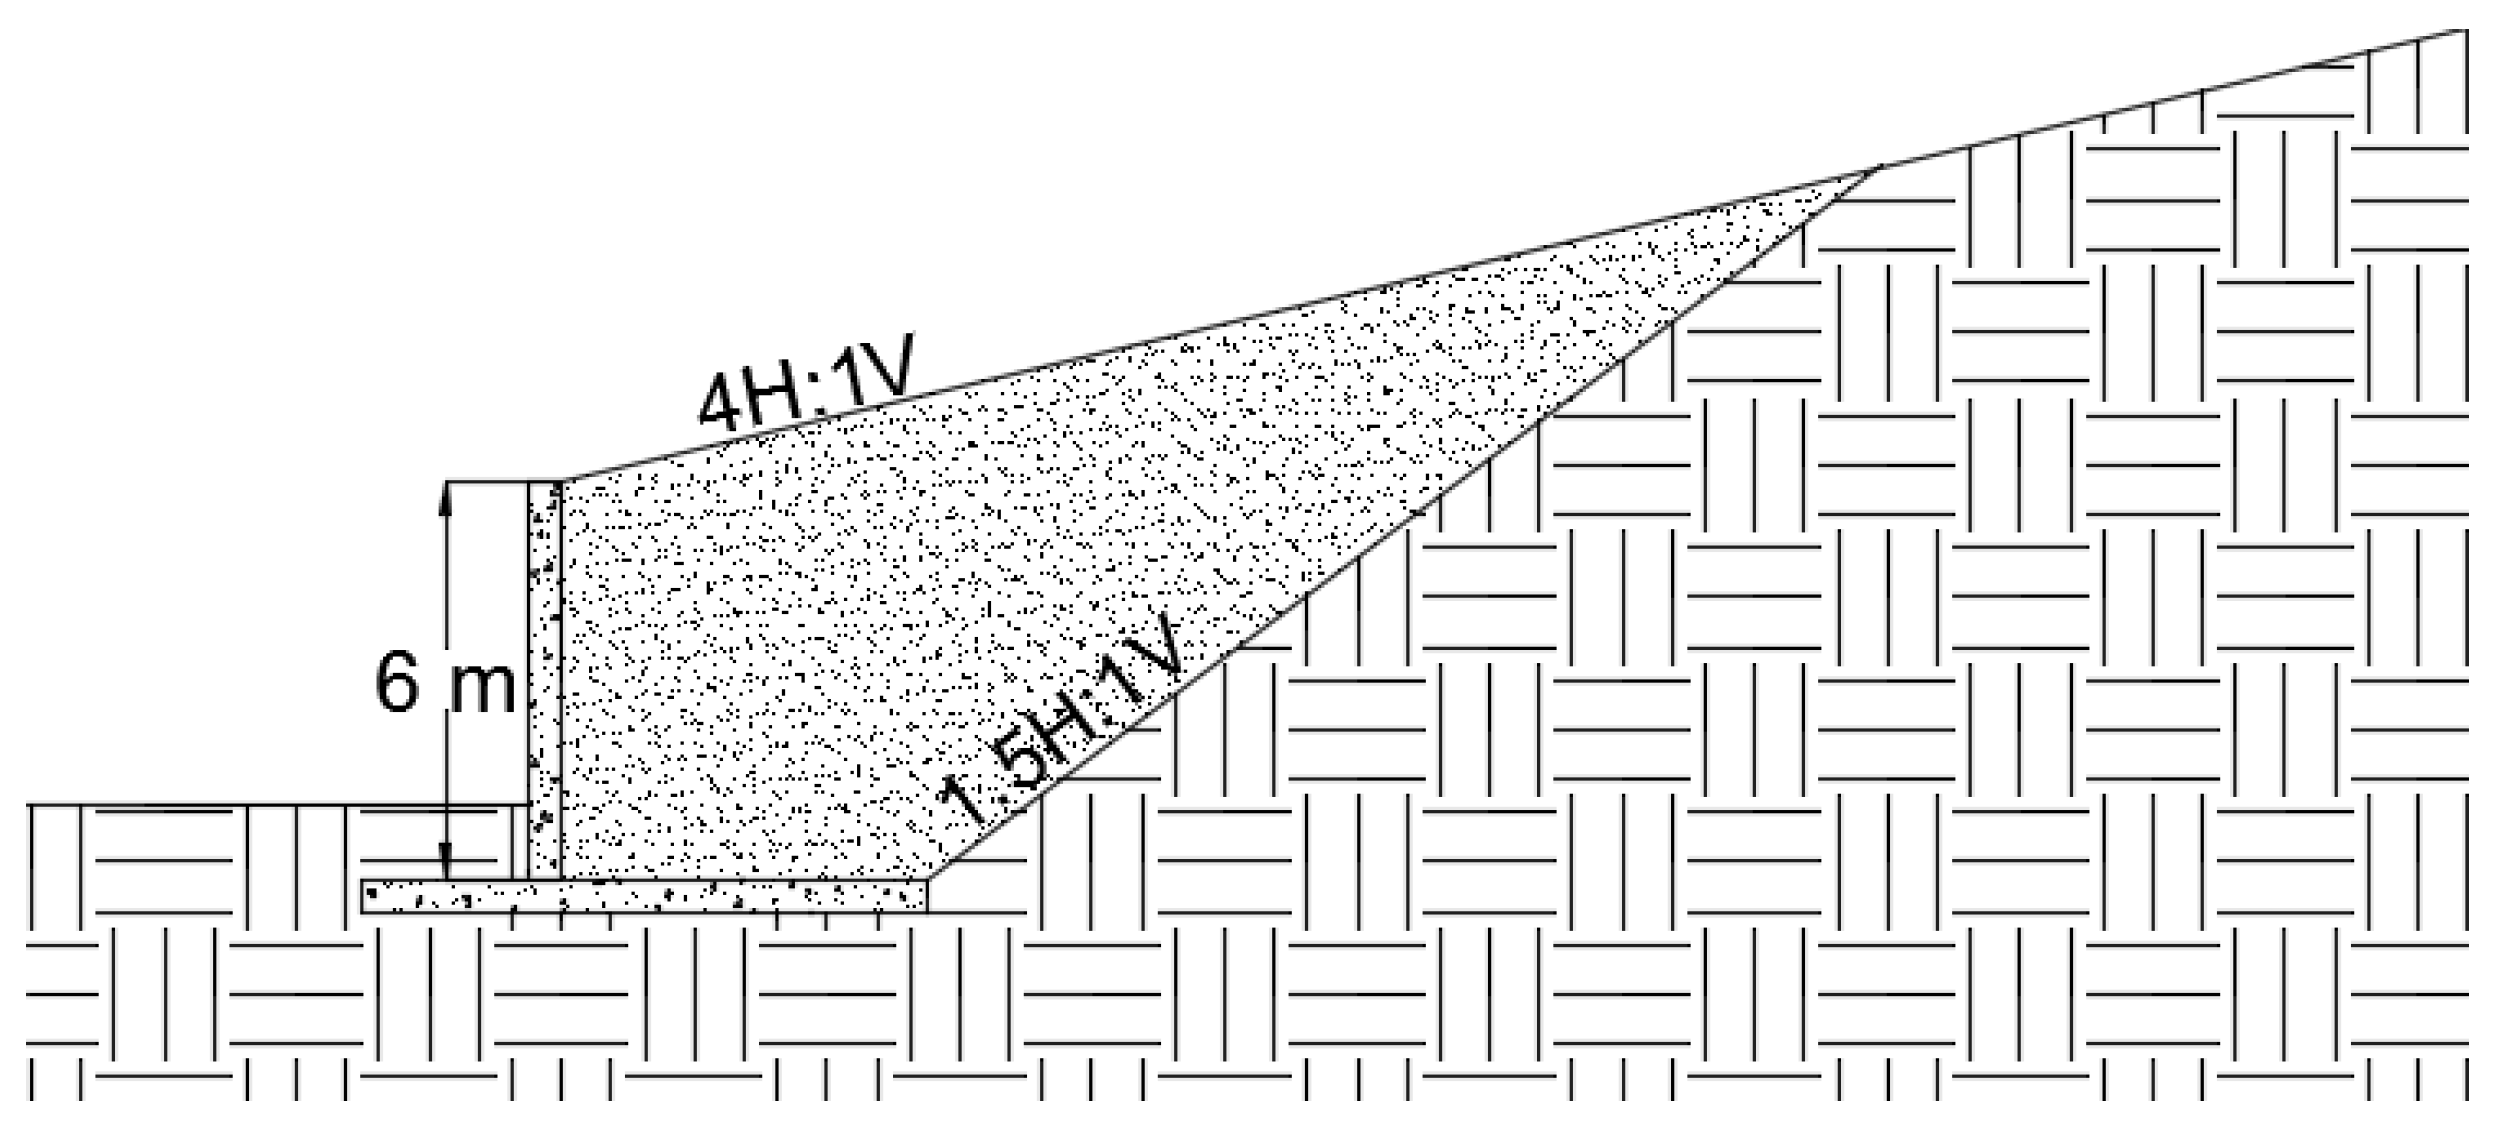
This problem includes a 6 m high cantilever gravity wall with a backfill inclination of 4H:1V as illustrated in Figure 6. The toe of the retaining wall is buried 1 m below the in situ soil which is assumed to contain some clayey soil. The slope of the backfill material is considered to be 1.5H:1V, which is deemed as being a practical inclination value. Groundwater will not be part of the retaining wall designs and is assumed to be deep below the footing of the retaining wall.
As is the typical method among engineers today, the Allowable Stress Design (ASD) method [19] was used along with Coulomb’s earth pressure theory when calculating the retaining wall dimensions, considering the passive pressure acting on the toe to be negligible. The Mononobe Okabe method [20,21] was used for the dynamic condition to determine the seismic active earth pressure coefficient (Kae). Factors of safety against overturning failure, sliding failure, and bearing capacity failure were set to the minimum values for the static and dynamic condition discussed below. The earthquake used for dynamic case was the 1940 El Centro Earthquake that struck Imperial Valley, California, which registered a magnitude of 7.0 on the Richter scale and had a peak ground acceleration (PGA) of 0.33 [22]. As per standard practice, a horizontal seismic coefficient (kh) of one-half the PGA was used in the analysis while the vertical seismic coefficient (kv) was set to be zero.
3.2. Properties of the Composite Material (Sand-Shredded Rubber Mixture) for Design
Values needed for the designing process of the various retaining walls were gathered from the laboratory tests that were conducted and are presented in Table 1 below. The properties of the in situ soil are assumed values that are typically used in design, while the values of the 100% sand mixture are assumed values of sand backfill typically used when compacted to 95% or higher of the dry unit weight.
3.3. Geotechnical Design of Retaining Wall
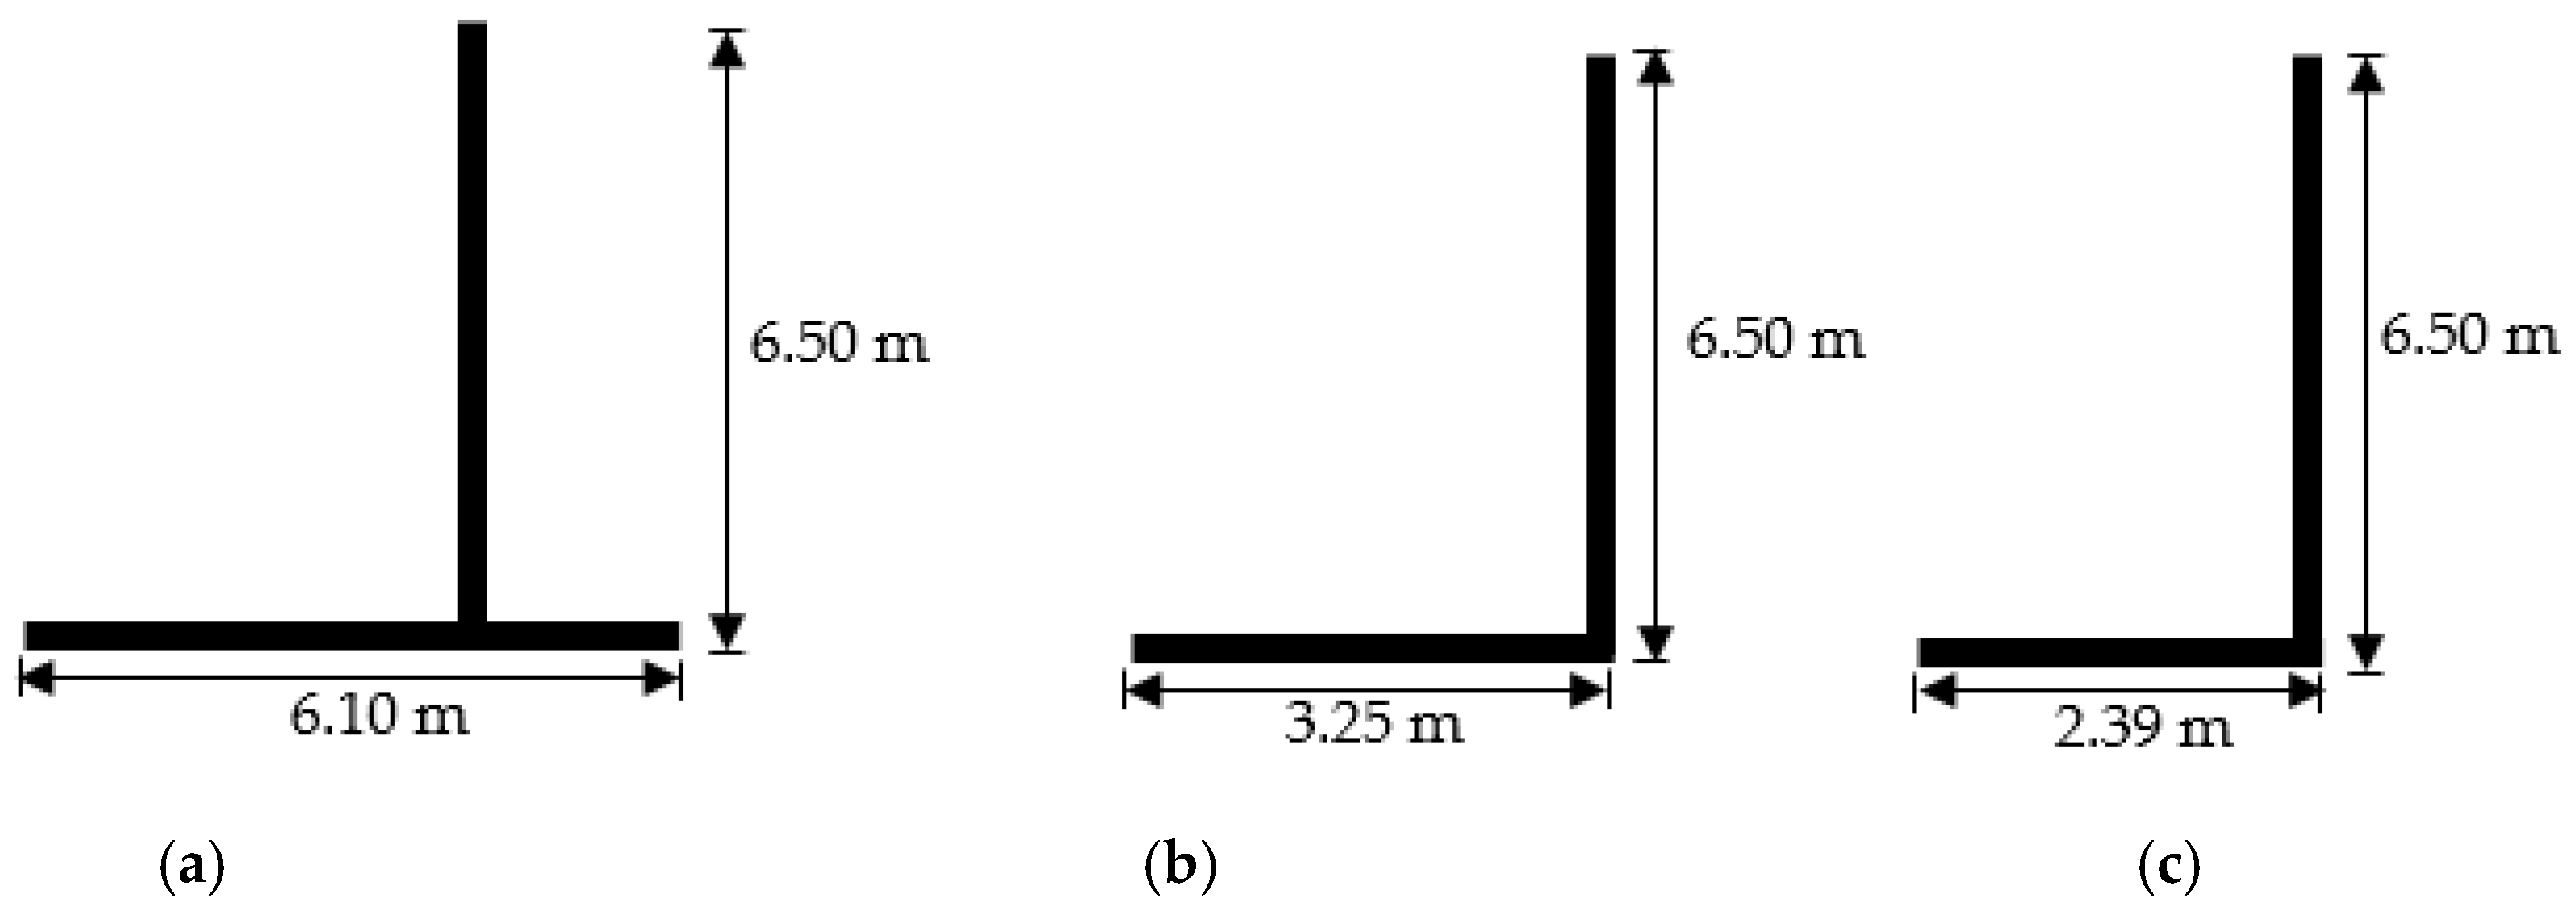
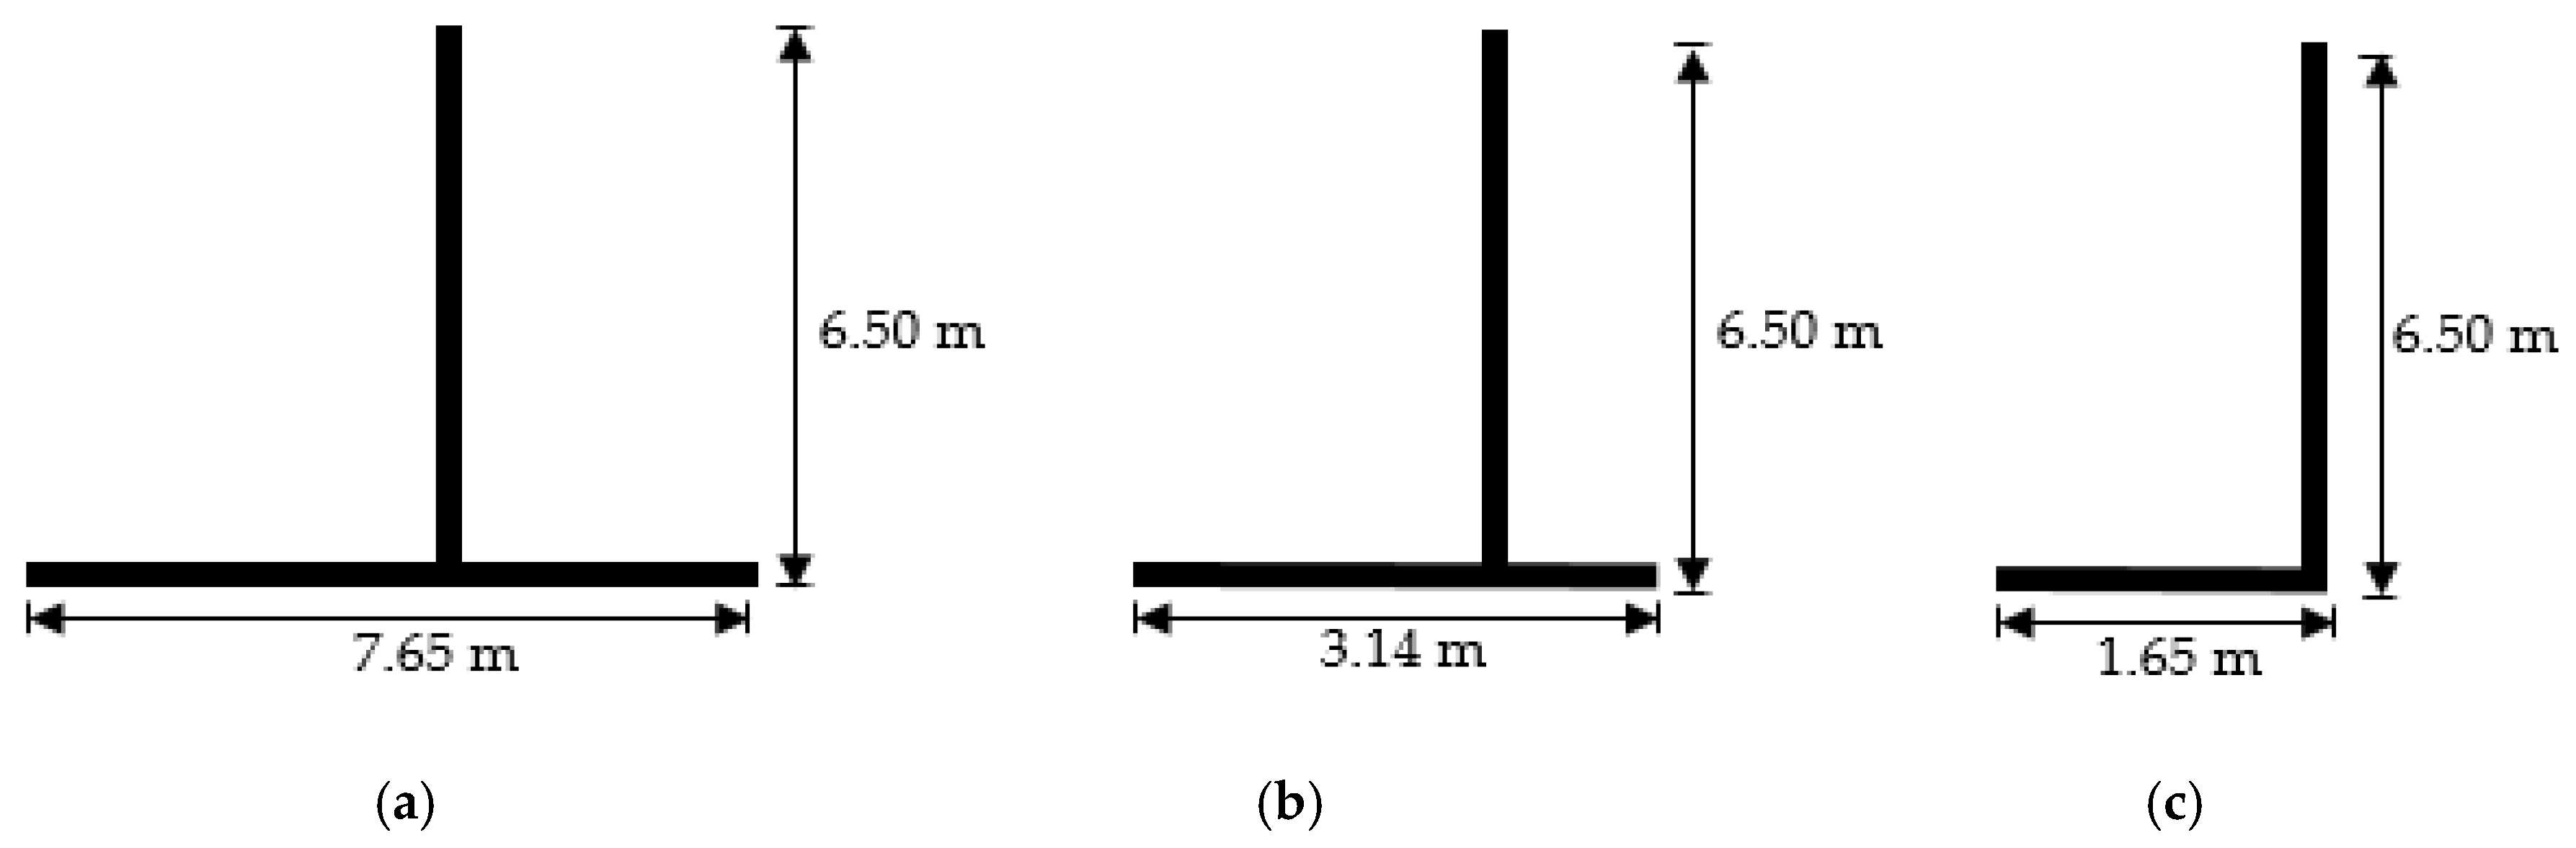
The lateral active earth pressures behind the wall were determined by using the dry unit weight and friction angle results for the various shredded rubber-sand mixtures derived from lab testing along with the Coulomb lateral earth pressure theory for the static condition and the Mononobe Okabe method [20,21] for the dynamic condition. Once the earth pressures were established, the ASD method [19] was used to determine the dimensions of the retaining walls with the various backfill ratios that could provide the minimum factor of safeties for overturning, sliding, and bearing capacity failure. This included the minimum factor of safety of 2.0 for the static design with clay type in situ soils and a minimum factor of safety of 1.10 for the dynamic design as is typically required by engineers today. The retaining wall dimensions for both the static and dynamic conditions were continually changed until they met the minimum factors of safety for overturning, sliding, and bearing capacity failures. As presented in Table 2 and Table 3 below, the retaining wall dimensions were able to be reduced to a very small size when more shredded rubber was added to the backfill, while still meeting the minimum factors of safety presented in Table 4. Furthermore, schematics of the retaining walls for the static condition illustrated in Figure 7 and for the dynamic condition illustrated in Figure 8, show the drastic reduction in the dimensions when more shredded rubber was added to the backfill material.
3.4. Results of the Retaining Wall Designs in the Static and Dynamic Loading Conditions
When comparing the retaining wall dimensions for both conditions, it can be seen in Figure 7 and Figure 8 that the size of the retaining walls and the excavation volumes decreased as more shredded rubber was added to the sand. This is the direct result of the decrease in dry unit weight and increase in friction angle as more rubber was mixed with sand, as illustrated in Figure 3 and Figure 4 in the laboratory testing discussion. In the Coulomb Pressure Theory and Mononobe Okabe method [20,21], as the unit weight decreased and the friction angle increased, the lateral active earth pressures against the wall decreased. Therefore, the lowest earth pressure observed was in the 100% shredded rubber backfill, resulting in the smallest wall dimensions and excavation volume. When compared to the retaining wall for the 100% sand backfill, the reduction of earth pressure allowed for the reinforced concrete volume to be largely reduced. Additionally, the lowered earth pressures allowed for smaller heel sizes in the retaining walls, resulting in smaller excavation volumes. These reductions can be clearly seen in Table 5 and Table 6 below when comparing the volumes of reinforced concrete and backfill per unit length for the various retaining walls. It was also observed that for the dynamic condition once shredded rubber was added to the backfill, a design where no heel is used becomes possible. By eliminating the heel, the fill volumes become the same for all four retaining walls in the dynamic condition using shredded rubber in the backfill. However, when comparing cut volumes presented in Table 6, it can be seen that they experienced a non-linear decrease from that of the 100% backfill cut volume. This is a direct result of the various shredded rubber-sand mixtures having various shrinkage factors, which caused the cut volume to fluctuate.
3.5. Discussion on Retaining Walls Backfilled with the Composite Material
From reviewing the retaining wall dimensions for the static and dynamic conditions, it can be seen that as more EPDM rubber is used, the footing sizes can be reduced while still meeting the minimum factors of safety. Eventually the heel can be completely taken out to create an “L” shape retaining wall. However, due to the large stress acting solely on the toe of the retaining wall, larger quantities of reinforcing steel will be needed. When calculating the retaining wall dimensions, it was observed that the primary advantage of using this material was that the low unit weight, high friction angle, and high hydraulic conductivity of the shredded rubber-sand mixtures reduced the active earth pressure acting behind the wall. As the unit weight decreased, the effective horizontal stress acting on the wall decreased. Furthermore, the higher friction angle of the shredded rubber provided larger shear resistance. Since the shredded rubber lowered the horizontal stress acting on the wall and can handle large shearing forces, the amount of force that was transferred to the wall in the form of the active earth pressure coefficients Ka and Kae for the static and dynamic condition, respectively, were lowered. With less pressure on the wall with the increasing amount of EPDM rubber, smaller dimensions and a reduction in the amount of materials needed to construct the wall can still provide safe designs. Furthermore, while the hydraulic conductivity of the backfill is not considered directly in the calculations, it should be noted that with the water being allowed to freely drain, pore pressures behind the wall cannot build-up. If these pore pressures are allowed to build-up they will induce unwanted stress on the wall, requiring larger designs.
It was also noticed in the designs for both the static and dynamic condition that as more EPDM rubber was added to the backfill, the chances for overturning failure increased. This is evident in the factors of safety presented in Table 4. In the case of the static loading condition, the critical factor of safety that controls the design changed from sliding to overturning in the 75% rubber: 25% sand backfill and in the case of dynamic loading condition, the change occurred for backfill with 100% rubber. The reduced pressures on the wall caused by the shredded rubber equates to a smaller vertical component of the resultant force (Pa and Pae) acting on the wall, which decreased resistance to overturning. The high chance of overturning also resulted in these designs having issues meeting the eccentricity requirement in the bearing capacity analysis. It was found that the resultant force from the soil acting on the bottom of the footing was outside the middle third of the footing (eccentricity ≥ width/6) and was acting too far into the heel. This issue was particularly noticeable for the dynamic condition since the seismic earth pressure was larger and acted at a higher location on the wall than the lateral active earth pressure in the static condition. This resulted in a much larger overturning moment than the static condition. The most economical way to correct these issues for both the static and dynamic conditions was to extend the toe to the minimum eccentricity requirement (eccentricity = width/6). It was noticed that even once the eccentricity was set to the lowest possible value, the factors of safety illustrated in Table 4 for the retaining walls with shredded rubber in the dynamic condition couldn’t be reduced below the minimum 1.10, which results in overdesign of the retaining walls under the dynamic loading condition.
4. Special Considerations for Field Application
It should also be noted that if mixtures of shredded rubber and sand were to be used in the field, care should to be taken to ensure that the material is properly mixed and that high volume change upon loading does not occur. Segregation of the material was an issue during lab testing that had to be addressed due to the small sized sand particles falling between the larger sized rubber particles. A study by Yoon et al. [8] where field studies were conducted for an embankment made of shredded tires and sand showed that proper mixing of these materials can be done with a front end loader, which can also be done with mixtures of shredded rubber and sand. Additionally, a study by Edil and Bosscher [23] has shown that preloading the embankment using a soil cap at least one meter in thickness can reduce compressibility and potential settlement of the rubber particles from shredded tires when loaded. The similarities of shredded tires and shredded rubber mean that this measure will be effective for shredded rubber as well. An alternative method for scenarios where they will be mixed and have a load applied is to have the shredded rubber and sand premixed and placed in bags. If the sand and shredded rubber are mixed and bagged properly, the segregation and compressibility issues may be reduced.
5. Cost Analysis
Since smaller lateral active earth pressures occur when shredded rubber is added to the sand in both the static and dynamic condition, smaller dimensions for the retaining walls are possible that still meet the design requirements. This will lead to cost savings in the amount of reinforced concrete needed to build the retaining wall. Based on the cost of concrete per unit length presented in Table 5 and Table 6, cost savings can range from 23% to 44% under static loading condition and 19% to 30% under dynamic loading condition when using shredded rubber-sand mixture compared to conventional granular soil backfill. Furthermore, the smaller walls will decrease labor costs and increase productivity saving additional money.
After speaking with recycling facility managers in various cities for the price of shredded EPDM rubber, it was discovered that rubber shred to the 3 mm size used in this study can range between $0.10/lbs. to $0.15/lbs. This equates to an average cost of $135m3 ($0.12/lbs.) based on the un-compacted dry unit weight of EPDM rubber from Figure 3. Compared to the cost of granular fill of $15.70/m3 that was obtained from local grading contractors, recycled EPDM rubber is expensive when used as fill. It was also discovered that the recycling facilities can shred the EPDM rubber to a cheaper price of $0.08/ lbs. ($90/m3) if shred to a larger 1–2 in (2.5–5.0 cm) nominal size, which is still expensive compared to sand. A cost analysis for all five retaining walls based on the volume of concrete and backfill needed for static and dynamic case are presented in Table 5 and Table 6, respectively. Using the prices above, a local cost of reinforced concrete of $122.95/m3, and weighted prices for the three backfill mixtures with EPDM rubber and sand, the final cost per unit length for all five walls was determined. It can be seen from Table 5 and Table 6, that despite the wall size and excavation volume shrinking considerable, the current cost of recycled EPDM rubber is too large for cost savings to occur.
Prior research by others on shredded tires has shown that using shredded roof membrane as fill is economical, but that is not the case for shredded rubber. Currently, the cost of shredding tires to a 1–2 inches nominal size is approximately $0.04/lbs., which is half the cost of shredded rubber at that size. However, the cost of shredded rubber at a 3 mm size does match the cost to shred tires to a 3 mm size, due to the challenge associated with grinding the rubber to a very small size.
Scrap tires are currently economical, due to the environmental and public health concern associated, which has caused the government to set-up a “tipping fee” to motivate people to recycle them. This tipping fee is derived from a tax put on new tires when purchased and is used to pay whoever is responsible for removing tires from landfills. This covers some of the cost to handle the tires, thereby decreasing the cost for recycling facilities to buy and sell scrap tires. Presently no tipping fee exists for roof membrane, which is driving up the price to buy shredded rubber. However, there are several methods that could be put into practice to lower the price of shredded rubber. Primarily, the government needs to catch up to the issue of 20 billon square feet of roof membrane coming to the end of its lifespan and establish a tipping fee to handle this material. Secondly, the technology to shred roof membrane needs to match the need to dispose of it in large quantities. Since a fair portion of the cost to recycle roof membrane comes from the tearing off and transportation of the rubber to the recycling facilities, a mobile unit could be devised to allow for shredding on-site during the roofing tear-off projects. Applying these methods in practice will allow for the use of shredded rubber in infrastructure, and will drive the market for recycling this material. While these methods will lower the cost of shredded rubber, the unit rate costs can still vary. They should be evaluated for each project specific condition, since availability, local markets, and distance to the recycling facility will affect cost.
6. Conclusions
Since past research on shredded tires has shown that using shredded rubber as lightweight fill can show promising results in decreasing landfill volume and increasing infrastructure sustainability, other sources of shredded rubber should be studied. By conducting a laboratory testing regiment on recycled shredded roof membrane, its engineering properties were quantified and a void left in this area of research was filled. From the test results, it was determined that shredded rubber mixed with and without sand has similar properties to that of shredded tires. By using these properties to design retaining walls backfilled with the various ratios of shredded rubber and sand while varying the loading to include earthquake loading, it is proven that the size of the retaining walls and backfill volumes can be greatly reduced. Furthermore, they still provide sufficient factor of safety values in areas that are highly seismic as well as those with low seismic activity. Despite the smaller reinforced concrete and excavation volumes, the current price of shredded rubber is too large to experience cost savings when compared to granular fill. The roof membrane lacks of a tipping fee that currently allows shredded tires to be economical as lightweight fill as well as recycling technology that can process it cheaply.
As we are approaching the time when 20 billion square feet of roof membrane will reach the end of its lifespan, there is a need to repurpose this material. The success seen of roof membrane reducing the size of retaining walls also means that it has the potential to be used in MSE walls. Furthermore, lab testing results show the potential for use in embankment fills with and without geosynthetics, in subgrade layers for roadways, and in drainage layers for landfill cover systems. Although since no such research has been done to test the suitability of shredded rubber-sand mixtures in these systems, future work including analytical design, full scale or small scale modeling, or simulation using finite element analysis is needed.
Acknowledgments
The authors would like to thank the reviewers and the editorial team for their constructive comments and suggestions to improve the quality of the manuscript.
Author Contributions
Bennett Livingston conducted the research presented in this manuscript under the supervision of Nadarajah Ravichandran.
Conflicts of Interest
The authors declare no conflict of interest.
References
- Cecich, V.; Gonzales, L.; Hoisaeter, A.; Williams, J.; Reddy, K. Use of shredded tires as lightweight backfill material for retaining structures. Waste Manag. Res. 1996, 14, 433–451. [Google Scholar] [CrossRef]
- Grimes, B.H.; Steinbeck, S.; Amoozegar, A. Analysis of tire chips as a substitute for stone aggregate in nitrification trenches of onsite septic systems: Status and notes on the comparative microbiology of tire chip versus stone aggregate trenches. North Carol. OnSite Wastewater Sect. Dep. Environ. Health (DEH-OSWS) 2003, 4, 18–21. [Google Scholar]
- Hoppe, E.J.; Mullen, W.G. Final Report: Field Study of A Shredded-Tire Embankment in Virginia; Virginia Transportation Research Council: Charlottesville, VA, USA, 2004. [Google Scholar]
- Ravichandran, N.; Huggins, L. Applicability of shredded tire chips as a lightweight retaining wall backfill in seismic regions. In Proceedings of the Geo-Congress 2014: Geo-characterization and Modeling for Sustainability, Atlanta, GA, USA, 23–26 February 2014; Volume 234, pp. 3496–3505. [Google Scholar]
- Reddy, K.R.; Stark, T.D.; Marella, A. Beneficial use of shredded tires as drainage material in cover systems for abandoned landfills. Pract. Period. Hazard. Toxic Radioact. Waste Manag. 2010, 14, 47–60. [Google Scholar] [CrossRef]
- Kang, J.M.; Lee, J.; Kim, Y.S.; Hong, S.S. Frost heave protection using soil-shredded tire mixture. In Proceedings of the Fifth Biot Conference on Poromechanics, Vienna, Austria, 10–12 July 2013; pp. 1314–1319. [Google Scholar]
- Humphrey, D.N. Effectiveness of design guidelines for use of tire derived aggregates as lightweight embankment fill. In Proceedings of the Recycled materials in geotechnics, Baltimore, MD, USA, 19–21 October 2004; pp. 61–74. [Google Scholar]
- Yoon, S.; Prezzi, M.; Siddiki, N.Z.; Kim, B. Construction of a test embankment using a sand–tire shred mixture as fill material. Waste Manag. 2006, 26, 1033–1044. [Google Scholar] [CrossRef] [PubMed]
- Tatlisoz, N.; Edil, T.B.; Benson, C.H. Interaction between reinforcing geosynthetics and soil-tire chip mixtures. J. Geotech. Geoenviron. Eng. 1998, 124, 1109–1119. [Google Scholar] [CrossRef]
- Russo, M.; Hutchinson, M. EPDM A Roof System for Every Climate. Available online: http://www.epdmroofs.org/epdm-todays-choice/epdm-roof-for-every-climate (accessed on 11 October 2016).
- EPDM Roofing Association. Available online: http://www.epdmroofs.org/epdm-todays-choice/recycling#sthash.7rZDJn2u.dpufv> (accessed on 14 August 2016).
- Moo-Young, H.; Sellasie, K.; Zeroka, D.; Sabnis, G. Physical and chemical properties of recycled tire shreds for use in construction. J. Environ. Eng. 2003, 129, 921–929. [Google Scholar] [CrossRef]
- Warith, M.A.; Evgin, E.; Benson, P.A.S. Suitability of shredded tires for use in landfill leachate collection systems mixture as fill material. Waste Manag. 2004, 26, 1033–1044. [Google Scholar]
- Kyser, D.; Ravichandran, N. Properties of chipped rubber roofing membrane and sand mixtures for civil engineering applications. ASCE J. Build. Eng. 2016, 7, 103–113. [Google Scholar]
- ASTM D422-63. Standard Test Method for Particle-Size Analysis of Soils; ASTM International: West Conshohocken, PA, USA, 2007. [Google Scholar]
- ASTM D698. Standard Test Methods for Laboratory Compaction Characteristics of Soil Using Standard Effort; ASTM International: West Conshohocken, PA, USA, 2012. [Google Scholar]
- ASTM D3080/D3080M-11. Standard Test Method for Direct Shear Test of Soils under Consolidated Drained Conditions; ASTM International: West Conshohocken, PA, USA, 2011. [Google Scholar]
- AASHTO T 236. Standard Method of Test for Direct Shear Test of Soils under Consolidated Drained Shear Conditions; American Association of State Highway and Transportation Officials System: Washington, DC, USA, 2014. [Google Scholar]
- Das, B.M. Principles of Foundation Engineering; Global Engineering: Boston, MA, USA, 2014. [Google Scholar]
- Mononobe, N.; Matsuo, H. On the determination of earth pressures during earthquakes. In Proceedings of the World Engineering Congress, Tokyo, Japan, 30 October–7 November 1929; Volume 9, pp. 179–187. [Google Scholar]
- Okabe, S. General theory of earth pressures. J. Jpn. Soc. Civ. Eng. 1926, 12, 311. [Google Scholar]
- Hays, W.W. Procedures for estimating earthquake ground motions. United States Government Printing Office: Washington, DC, USA, 1980. [Google Scholar]
- Edil, T.B.; Bosscher, P.J. Engineering proper-ties of tire chips and soil mixtures. Geotech. Test. J. 1994, 17, 453–464. [Google Scholar]
Figure 1.
Roof membrane rubber cuts (photo courtesy of EPDMroofs.org) and shreds.

Figure 2.
Particle size distribution of shredded rubber and sand.
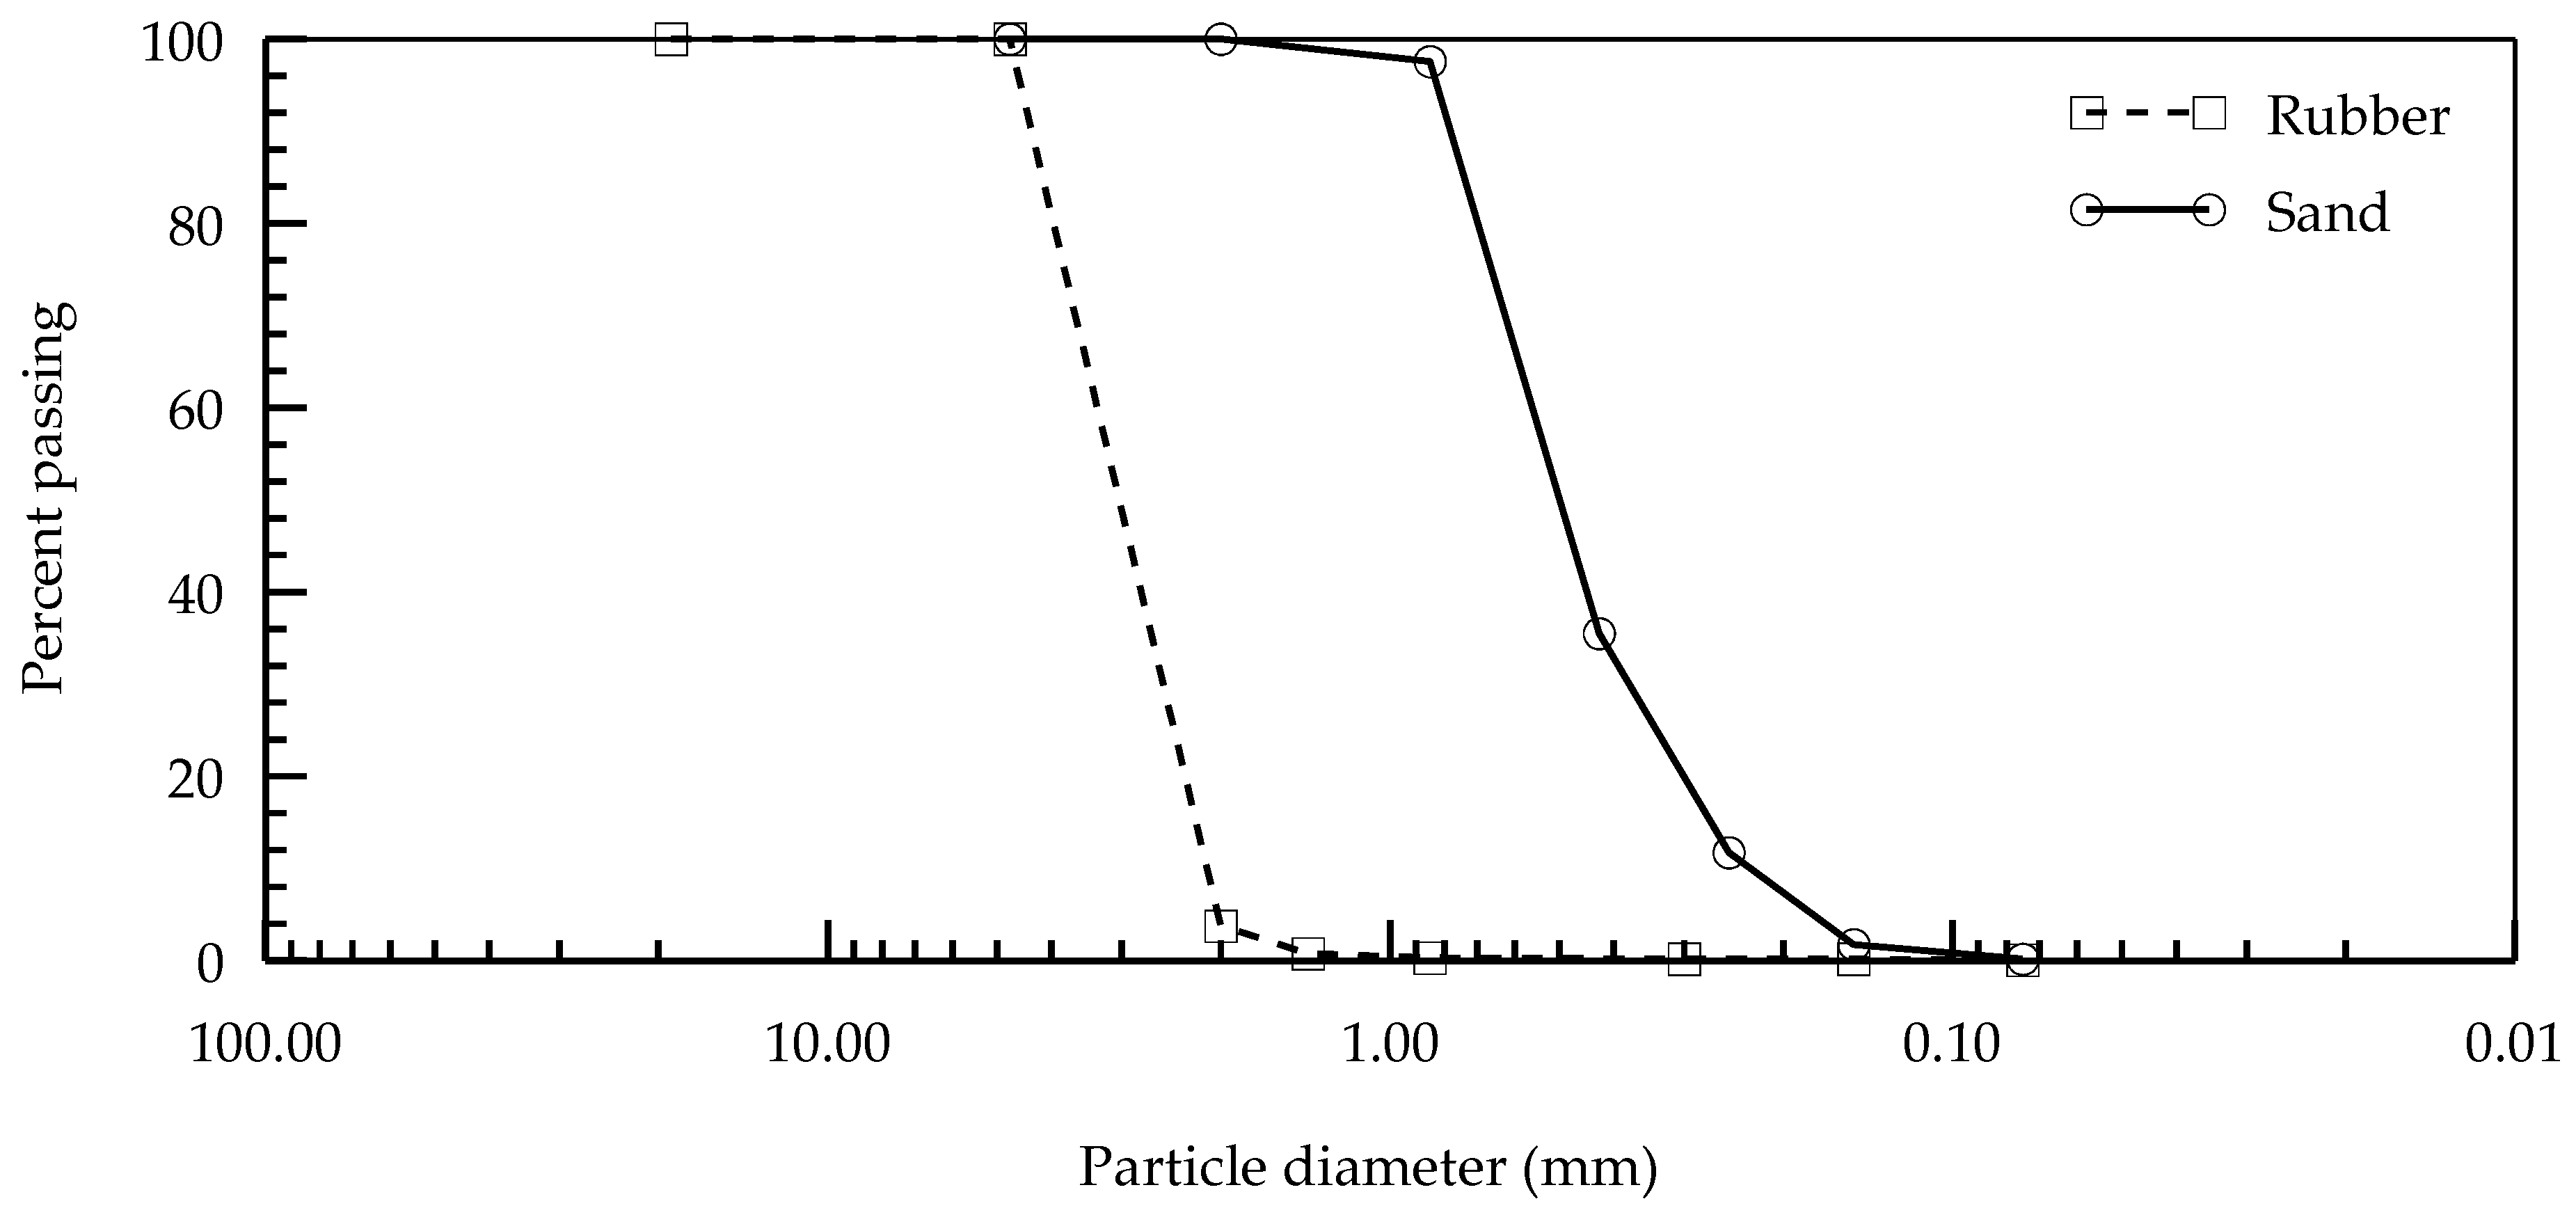
Figure 3.
Variation of dry unit weight of the composite material with percentage of shredded roof membrane.
Figure 3.
Variation of dry unit weight of the composite material with percentage of shredded roof membrane.
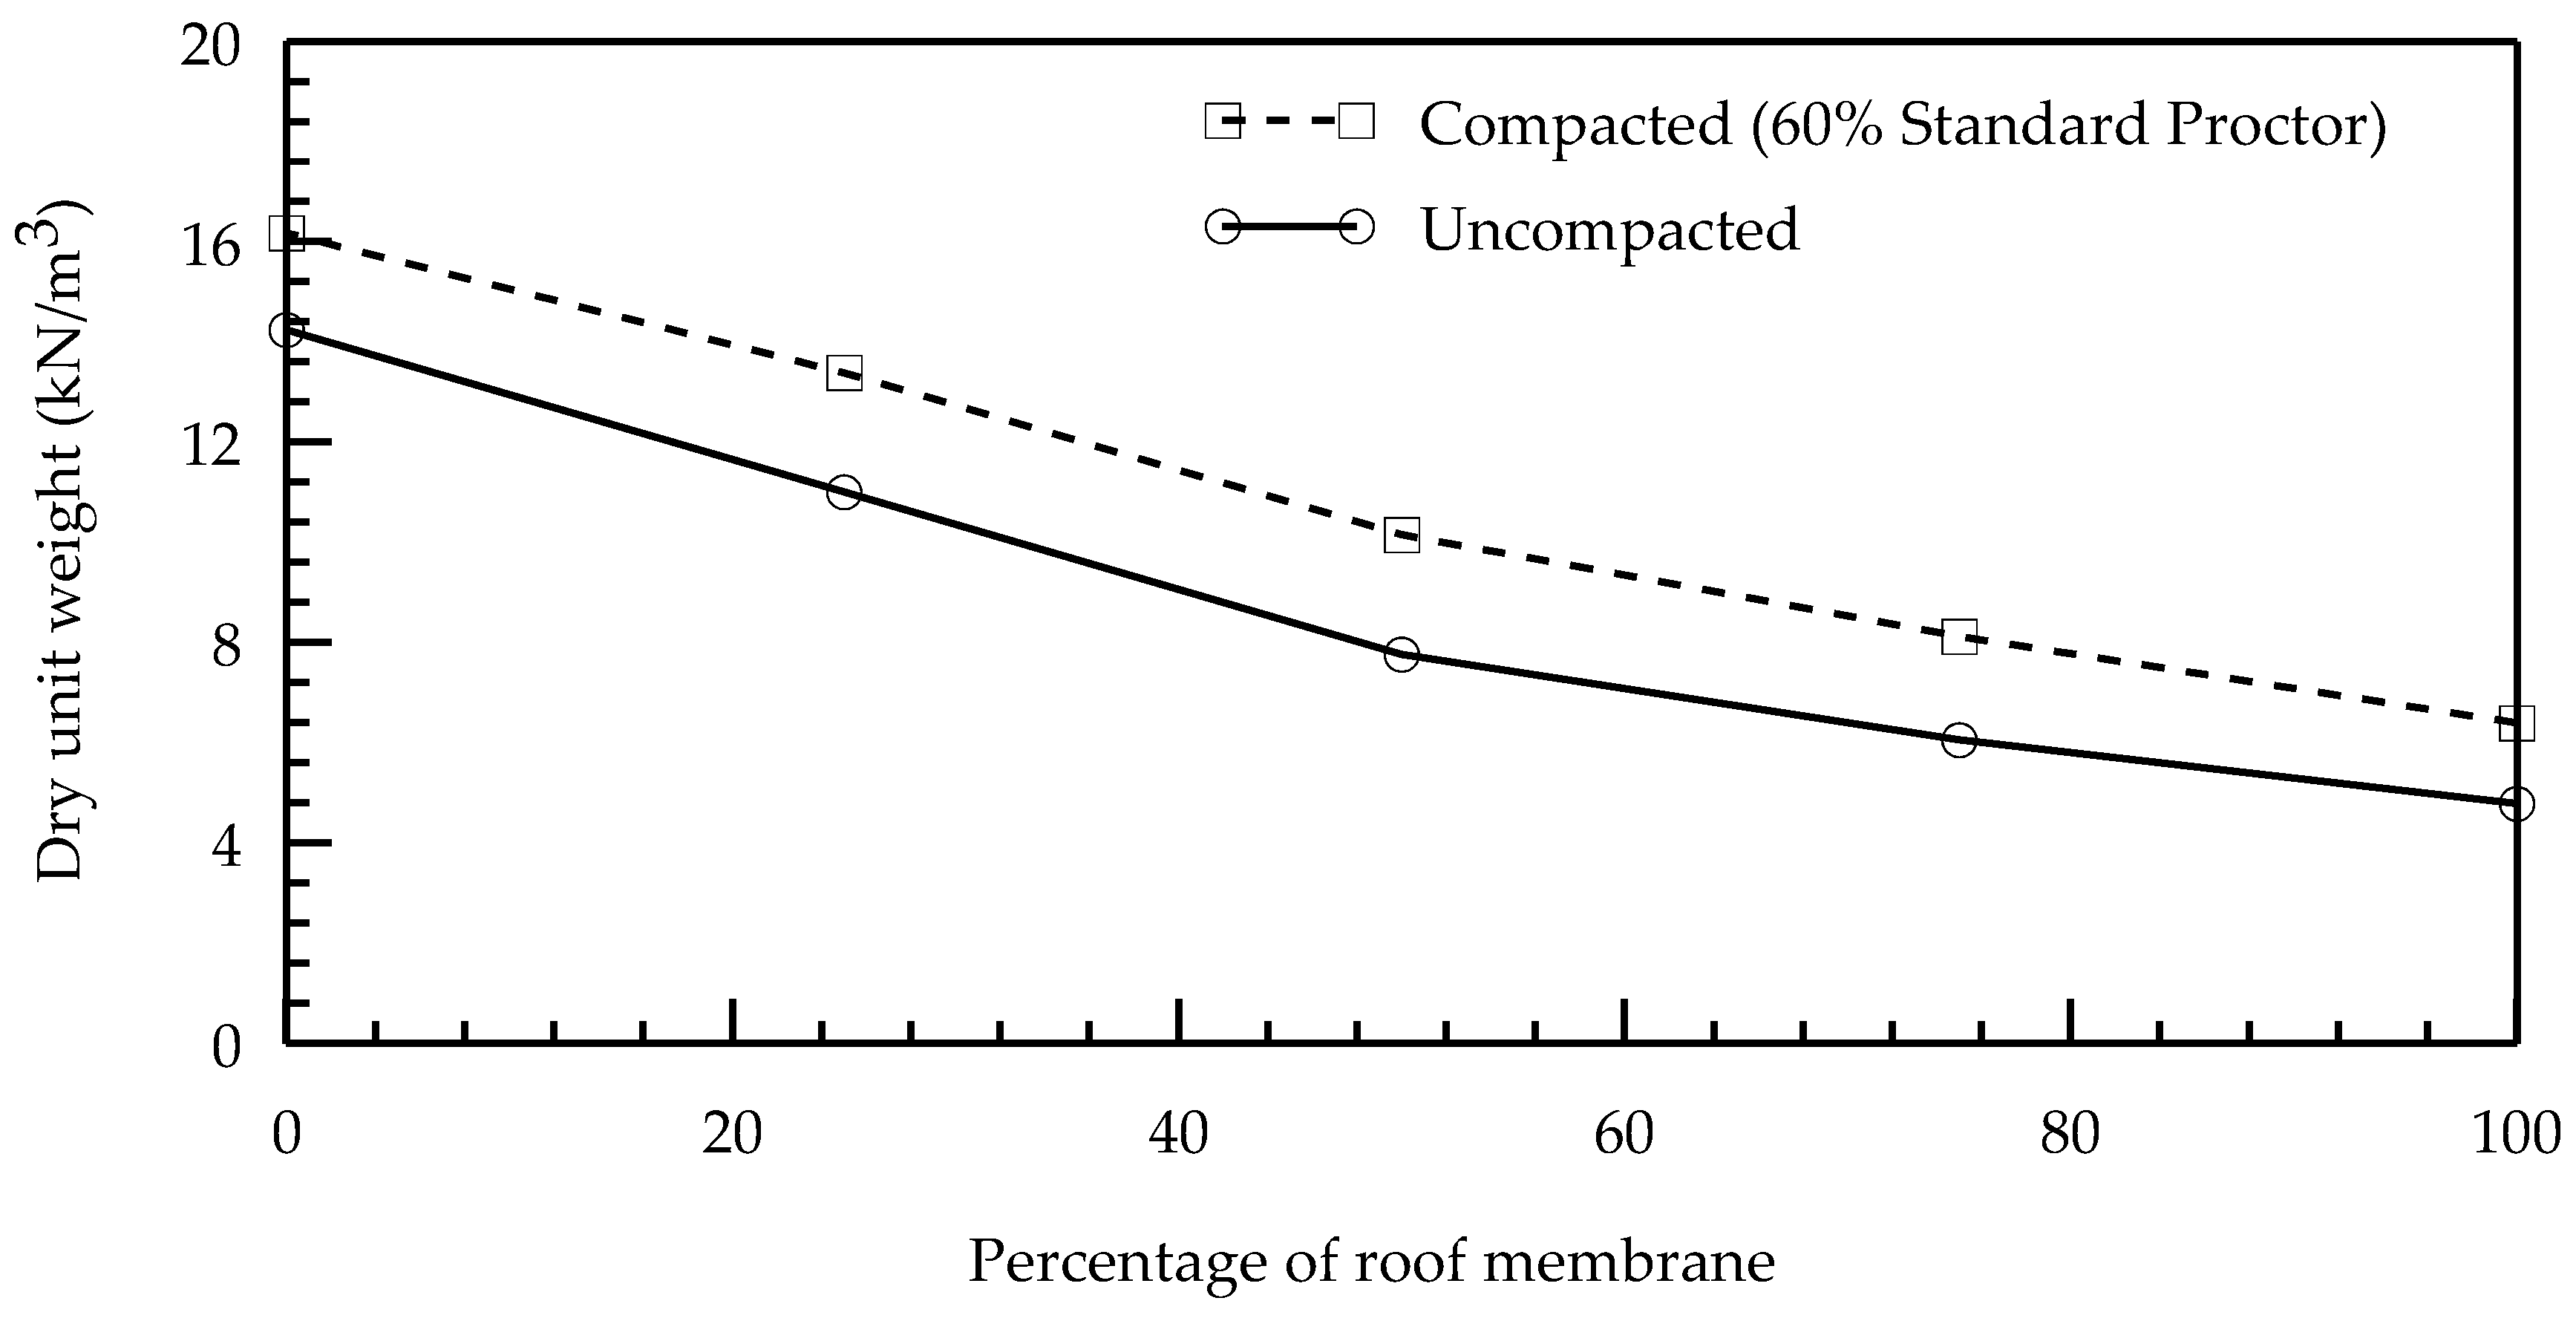
Figure 4.
Variation of effective friction angle with percentage of shredded roof membrane.
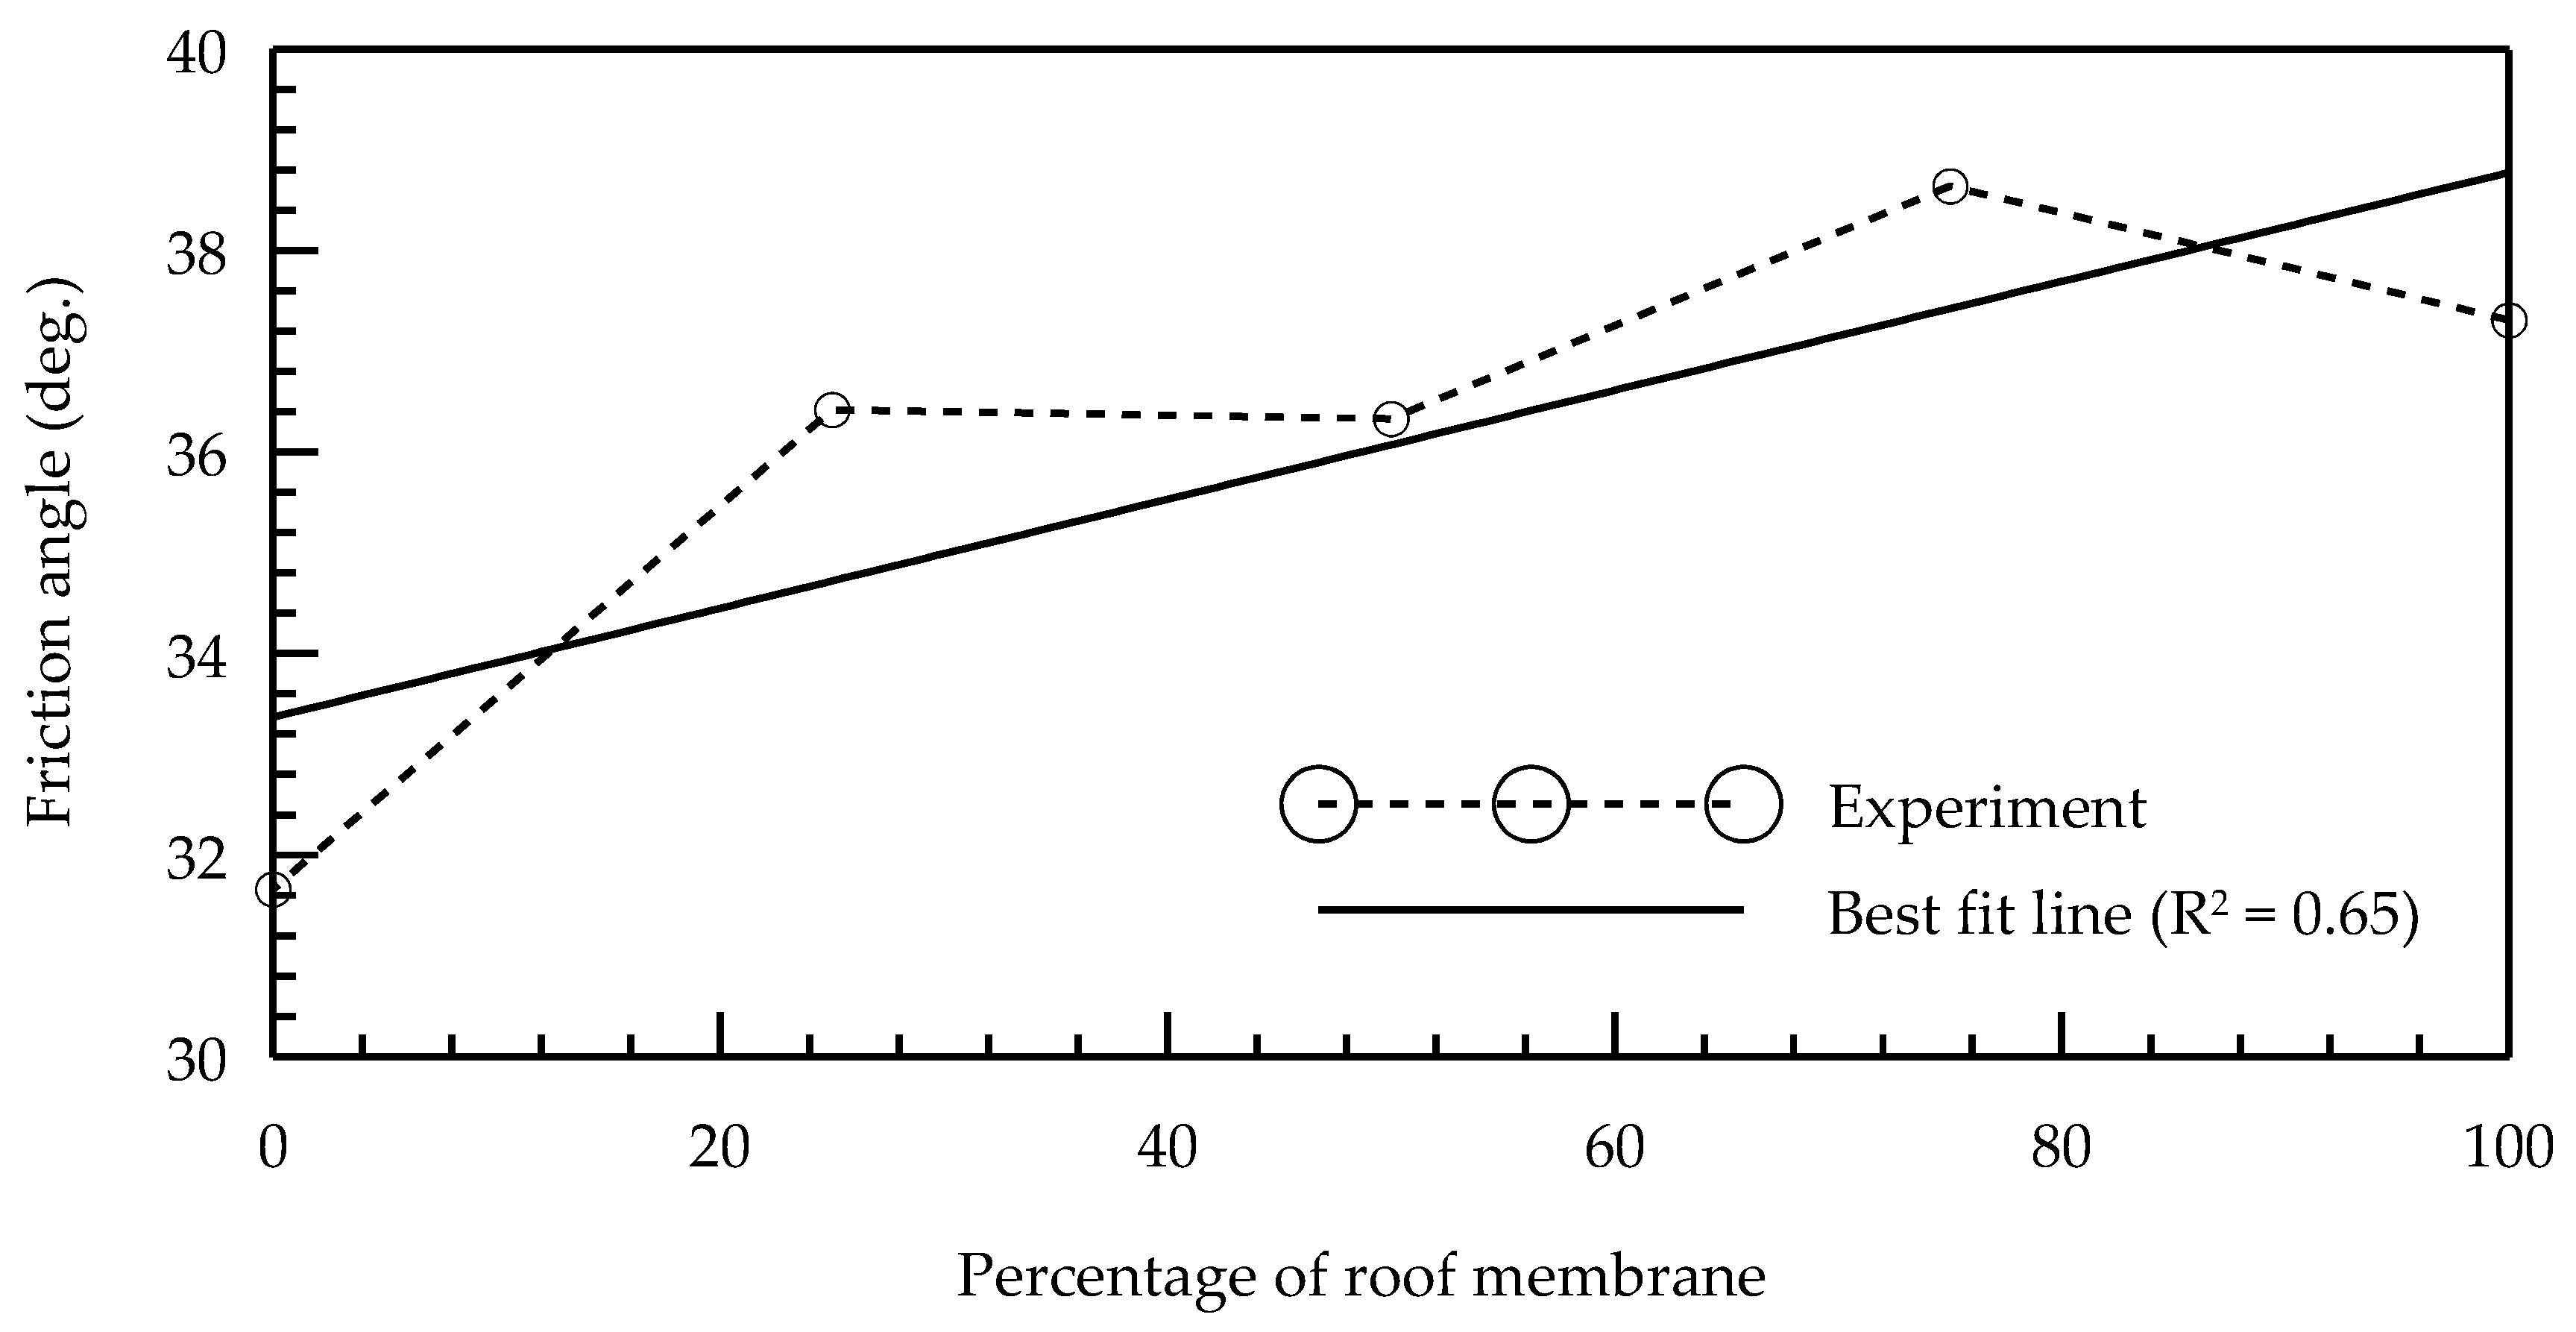
Figure 5.
Variation of hydraulic conductivity with percentage of shredded roof membrane.
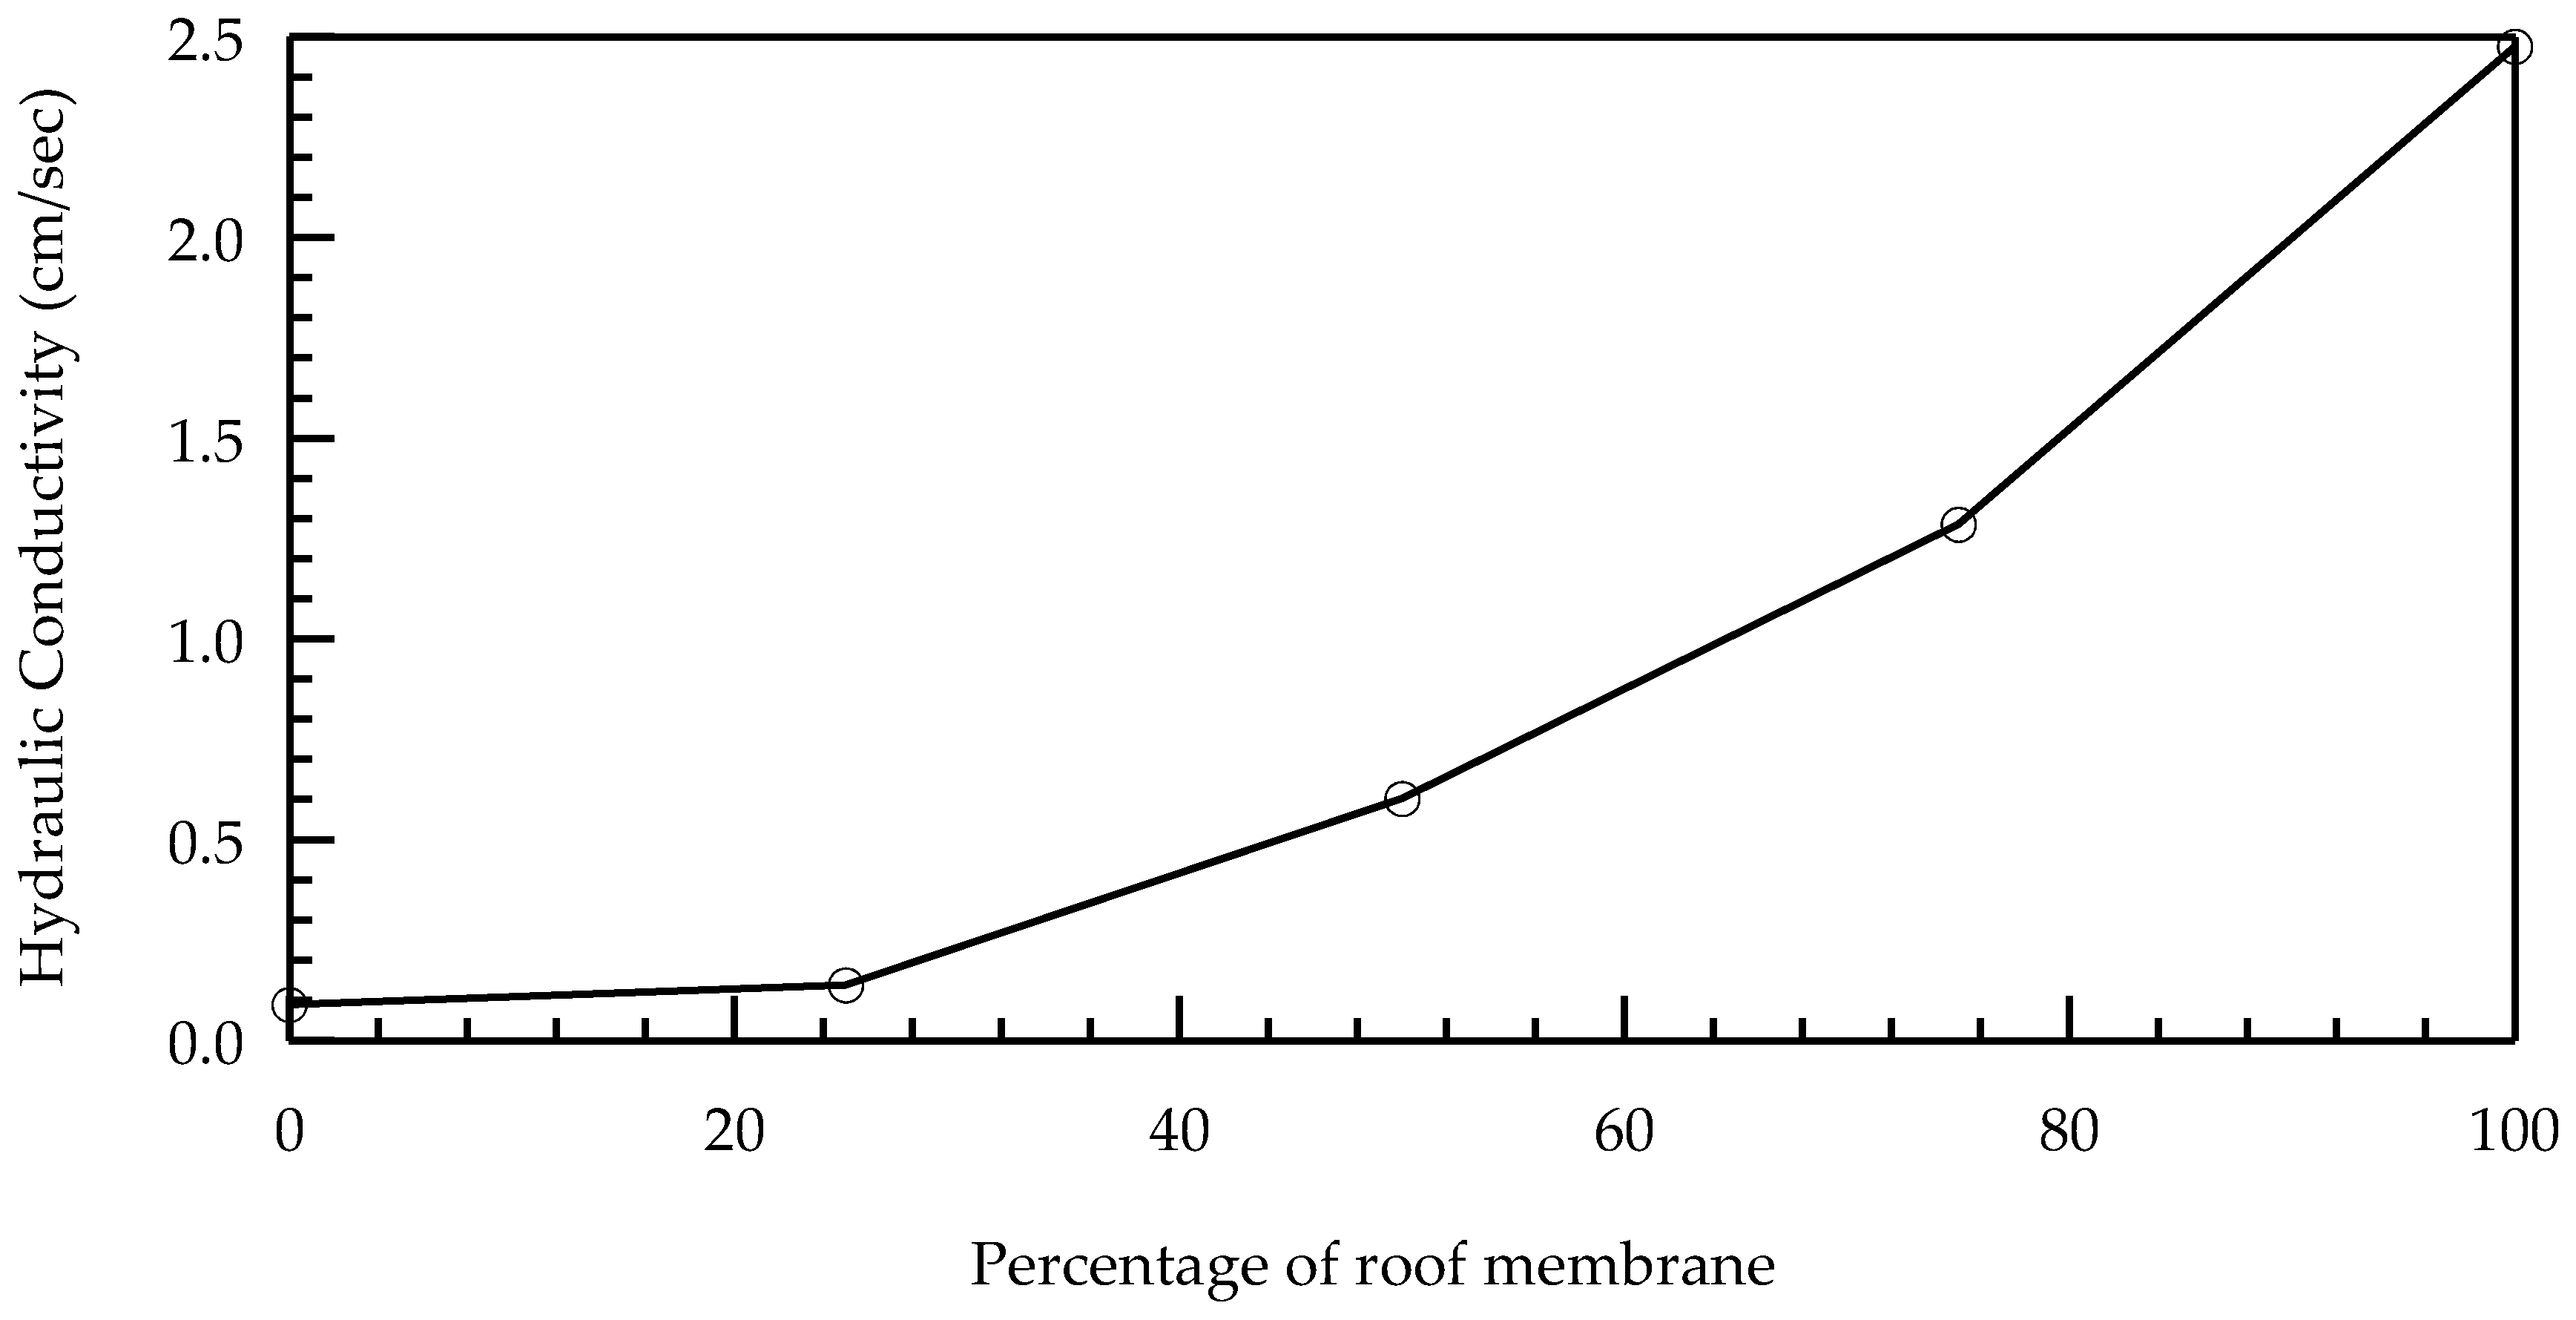
Figure 6.
Design model for various backfill mixtures.

Figure 7.
Design outcomes for static condition (a) 100% Sand (b) 50% Rubber: 50% Sand (c) 100% Rubber (thickness of base slab and stem = 0.5 m).
Figure 7.
Design outcomes for static condition (a) 100% Sand (b) 50% Rubber: 50% Sand (c) 100% Rubber (thickness of base slab and stem = 0.5 m).

Figure 8.
Design outcomes for earthquake loading condition (a) 100% Sand (b) 50% Rubber: 50% Sand (c) 100% Rubber (thickness of base slab and stem = 0.5 m).
Figure 8.
Design outcomes for earthquake loading condition (a) 100% Sand (b) 50% Rubber: 50% Sand (c) 100% Rubber (thickness of base slab and stem = 0.5 m).

Table 1.
Properties of in situ and backfill materials used in design.
| Material | Unit Weight (kN/m3) | Friction Angle (deg.) | Cohesion (kPa) |
|---|---|---|---|
| In situ Soil | 18.07 | 28.00 | 30 |
| Standard backfill | 18.85 | 34.00 | 0 |
| Rubber:sand ratio = 100:0 | 6.39 | 37.31 | 0 |
| Rubber:sand ratio = 75:25 | 8.12 | 38.64 | 0 |
| Rubber:sand ratio = 50:50 | 10.15 | 36.33 | 0 |
| Rubber:sand ratio = 25:75 | 13.38 | 36.42 | 0 |
| Rubber:sand ratio = 0:100 | 16.17 | 31.66 | 0 |
Table 2.
Design outcomes for static loading condition.
| Material (Rubber:Sand Ratio) | Toe Length (m) | Heel Length (m) |
|---|---|---|
| 100:0 | 3.90 | 3.25 |
| 25:75 | 2.33 | 1.60 |
| 50:50 | 1.73 | 0.91 |
| 75:25 | 1.25 | 0.40 |
| 100:0 | 1.15 | 0.00 |
Table 3.
Design outcomes for earthquake loading condition.
| Material (Rubber:Sand Ratio) | Toe Length (m) | Heel Length (m) |
|---|---|---|
| 0:100 | 4.60 | 1.00 |
| 25:75 | 3.26 | 0.00 |
| 50:50 | 2.75 | 0.00 |
| 75:25 | 2.13 | 0.00 |
| 100:0 | 1.89 | 0.00 |
Table 4.
Computed factor of safeties.
| Material (Rubber:Sand Ratio) | Mode of Failure | Factor of Safety-Static Load | Factor of Safety-Earthquake Load |
|---|---|---|---|
| 0:100 | Overturning | 3.48 | 1.89 |
| Sliding | 2.00 | 1.10 | |
| Bearing capacity | 11.00 | 6.46 | |
| 25:75 | Overturning | 2.55 | 1.66 |
| Sliding | 2.00 | 1.17 | |
| Bearing capacity | 9.11 | 5.36 | |
| 50:50 | Overturning | 2.17 | 1.67 |
| Sliding | 2.00 | 1.35 | |
| Bearing capacity | 8.15 | 5.88 | |
| 75:25 | Overturning | 2.00 | 1.67 |
| Sliding | 2.14 | 1.59 | |
| Bearing capacity | 7.83 | 6.47 | |
| 100:0 | Overturning | 2.01 | 1.68 |
| Sliding | 2.13 | 1.75 | |
| Bearing capacity | 8.74 | 6.93 |
Table 5.
Project costs and material volumes for static loading condition.
| Material (Rubber:Sand Ratio) | Volume of Concrete Per Unit Length (m3) | Cost of Concrete Per Unit Length ($) | Amount of Backfill Per Unit Length (m3) | Cost of Backfill Per Unit Length ($) | Cost of Materials Per Unit Length ($) |
|---|---|---|---|---|---|
| 0:100 | 6.83 | $839.12 | 93.08 | $1460.95 | $2300.07 |
| 25:75 | 5.22 | $641.17 | 69.97 | $3180.36 | $3821.53 |
| 50:50 | 4.57 | $561.87 | 62.99 | $4737.35 | $5299.22 |
| 75:25 | 4.08 | $501.01 | 56.74 | $5955.12 | $6456.14 |
| 100:0 | 3.83 | $470.28 | 54.48 | $7339.16 | $7809.44 |
Table 6.
Project costs and material volumes for earthquake loading condition.
| Material (Rubber:Sand Ratio) | Volume of Concrete Per Unit Length (m3) | Cost of Concrete Per Unit Length ($) | Amount of Backfill Per Unit Length (m3) | Cost of Backfill Per Unit Length ($) | Cost of Materials Per Unit Length ($) |
|---|---|---|---|---|---|
| 0:100 | 6.05 | $743.84 | 65.69 | $1003.31 | $1747.14 |
| 25:75 | 4.88 | $599.99 | 50.70 | $2304.29 | $2904.28 |
| 50:50 | 4.63 | $568.64 | 51.92 | $3904.75 | $4473.39 |
| 75:25 | 4.32 | $530.52 | 51.92 | $5449.68 | $5980.20 |
| 100:0 | 4.20 | $515.77 | 54.48 | $7339.16 | $7854.93 |
© 2017 by the authors. Licensee MDPI, Basel, Switzerland. This article is an open access article distributed under the terms and conditions of the Creative Commons Attribution (CC BY) license (http://creativecommons.org/licenses/by/4.0/).
Share and Cite
MDPI and ACS Style
Livingston, B.; Ravichandran, N. Properties of Shredded Roof Membrane–Sand Mixture and Its Application as Retaining Wall Backfill under Static and Earthquake Loads. Recycling 2017, 2, 8. https://doi.org/10.3390/recycling2020008
AMA Style
Livingston B, Ravichandran N. Properties of Shredded Roof Membrane–Sand Mixture and Its Application as Retaining Wall Backfill under Static and Earthquake Loads. Recycling. 2017; 2(2):8. https://doi.org/10.3390/recycling2020008
Chicago/Turabian StyleLivingston, Bennett, and Nadarajah Ravichandran. 2017. "Properties of Shredded Roof Membrane–Sand Mixture and Its Application as Retaining Wall Backfill under Static and Earthquake Loads" Recycling 2, no. 2: 8. https://doi.org/10.3390/recycling2020008