Automatic Recognition of Speed Limits on Speed-Limit Signs by Using Machine Learning

School of Engineering, Department of Robotics, Kindai University, Takayaumenobe 1, Higashihiroshima 739-2116, Japan
J. Imaging 2017, 3(3), 25; https://doi.org/10.3390/jimaging3030025
Submission received: 30 May 2017
/
Revised: 30 June 2017
/
Accepted: 1 July 2017
/
Published: 5 July 2017
(This article belongs to the Special Issue Color Image Processing)
Abstract
:This study describes a method for using a camera to automatically recognize the speed limits on speed-limit signs. This method consists of the following three processes: first (1) a method of detecting the speed-limit signs with a machine learning method utilizing the local binary pattern (LBP) feature quantities as information helpful for identification, then (2) an image processing method using Hue, Saturation and Value (HSV) color spaces for extracting the speed limit numbers on the identified speed-limit signs, and finally (3) a method for recognition of the extracted numbers using a neural network. The method of traffic sign recognition previously proposed by the author consisted of extracting geometric shapes from the sign and recognizing them based on their aspect ratios. This method cannot be used for the numbers on speed-limit signs because the numbers all have the same aspect ratios. In a study that proposed recognition of speed limit numbers using an Eigen space method, a method using only color information was used to detect speed-limit signs from images of scenery. Because this method used only color information for detection, precise color information settings and processing to exclude everything other than the signs are necessary in an environment where many colors similar to the speed-limit signs exist, and further study of the method for sign detection is needed. This study focuses on considering the following three points. (1) Make it possible to detect only the speed-limit sign in an image of scenery using a single process focusing on the local patterns of speed limit signs. (2) Make it possible to separate and extract the two-digit numbers on a speed-limit sign in cases when the two-digit numbers are incorrectly extracted as a single area due to the light environment. (3) Make it possible to identify the numbers using a neural network by focusing on three feature quantities. This study also used the proposed method with still images in order to validate it.
1. Introduction
As one part of research related to Intelligent Transport Systems (ITS), in Japan, much research has been conducted regarding Advanced cruise-assist Highway Systems (AHS), aiming to ensure the safety and smoothness of automobile driving [1,2,3,4,5,6,7,8,9]. AHS is composed of the following sections: information collection, support for driver operations, and fully automated driving. The means of information collection include the use of radar to detect obstacles in front, and camera images for detecting traffic signs and signals. Driving support systems using radar have already been commercialized and are installed in many vehicles. However, driving support systems using cameras remain in the research phase both for use on expressways and ordinary roads. Commercialization of these systems will require the following for accurate and stable provision of information about the vehicle surroundings to the driver: high processing speed, high recognition accuracy, detection of all detectable objects without omission, and robustness in response to changes in the surrounding environment.
It is said that when driving, a driver relies 80–90% on visual information for awareness of the surrounding conditions and for operating the vehicle. According to the results of investigations, large numbers of accidents involving multiple vehicles occur due to driver inattention which results in the driver not looking ahead while driving, distracted driving, or failure to stop at an intersection. Of such accidents, those that result in death are primarily due to excessive speed. Therefore, from the perspective of constructing a driver support system, it will be important to automatically detect the speed limit and provide a warning display or voice warning to the driver urging him/her to observe the posted speed limit when the vehicle is travelling too fast.
Traffic restriction signs such as “vehicle passage prohibited” and “speed limits” have a round external shape and are distinguished by a red ring around the outside edge. There have been many proposals regarding methods of using this distinguishing feature to extract traffic signs from an image [10,11,12,13,14,15,16,17,18,19,20,21,22,23,24,25,26,27,28,29,30]. Frejlichwski [10] proposed the Polar-Fourier greyscale descriptor, which applies the information about silhouette and intensity of an object, for extracting an object from a digital image. Gao et al. [11] proposed the novel local histogram feature representation to improve the traffic sign recognition performance. Sun et al. [12] proposed an effectiveness and efficient algorithm based on a relatively new artificial network, extreme learning machine in designing a feasible recognition approach. Liu et al. [13] proposed a new approach to tackle the traffic sign recognition problem by using the group sparse coding. Zaklouta et al. [14] proposed the real-time traffic sign recognition system using an efficient linear SVM with HOG features. Stallkamp et al. [15] compared the traffic sign recognition performance of humans to that of a state-of-art machine learning algorithm. Berger et al. [16] proposed a new approach for traffic sign recognition based on the virtual generalizing random access memory weightless neural networks (VG-RAM WNN). Gu et al. [18] proposed the dual-focal active camera system to obtain a high-resolution image of the traffic signs. Zaklouta et al. [19] proposed a real-time traffic sign recognition system under bad weather conditions and poor illumination. Ruta et al. [20] proposed novel image representation and discriminative feature selection algorithm in a three-stage framework involving detection, tracking and recognition. Chen et al. [22] proposed the reversible image watermarking approach that works on quantized Discrete Cosine Transform (DCT) coefficients. Zhang [23] proposed the method to pre-pure feature points by clustering to improve the efficiency of the feature matching. Zhang et al. [24] proposed a multiple description method based on fractal image coding in image transformation. Zin et al. [25] proposed a robust road sign recognition system under various illumination conditions to work for various types of circular and pentagonal road signs. Kohashi et al. [26] proposed the high speed and high accurate road sign recognition method which is realized by emitting near-infrared ray to respond to bad lighting environment. Yamauchi et al. [27] proposed the traffic sign recognition method by using string matching technique to match the signatures to template signatures. Matsuura, Uchimura et al. [28,30] proposed the algorithm for estimation of internal area in the circular road signs from color scene image. Yabuki et al. [29] proposed an active net for region detection and a shape extraction. Many recognition methods have been proposed using means such as template matching and improved template matching, or using applied genetic algorithms [30] and neural network [29]. A method using shape features [21], and an Eigen space method based on the KL transform [17] have also been proposed. These have generally delivered good results. However, before commercialization of these methods is possible, a number of problems arising during the actual processing will have to be resolved. These problems include the need to convert an extracted image of unknown size to an image that is approximately the same size as the template, the need to make corrections for rotation and displacement, and the large time that is required for these processing calculations.
The method for traffic sign recognition [21] previously proposed by the authors of this study was focused on extracting traffic signs in real time from a moving image as a step toward system commercialization. As a result, the recognition method proposed was a relatively simple method that was based on the geometric features of the signs and that was able to shorten the processing time. Because it extracted the geometric shape on the sign and then conducted recognition based on its aspect ratio, the method was not able to identify the numbers on a speed-limit sign, all of which have identical aspect ratios. However, in consideration of the fact that excessive speed is a major cause of fatal accidents, and because recognition of the speed-limit signs that play a major role in preventing fatal accidents and other serious accidents is more important, a speed-limit sign recognition method utilizing an Eigen space method based on the KL transform was proposed [17]. This method yielded a fast processing speed, was able to detect the targets without fail, and was robust in response to geometrical deformation of the sign image resulting from changes in the surrounding environment or the shortening distance between the sign and vehicle. However, because this method used only color information for detection of speed-limit signs, precise color information settings and processing to exclude everything other than the signs are necessary in an environment where many colors similar to the speed-limit signs exist, and further study of the method for sign detection is needed.
Aiming to resolve the problems with the method previously proposed, this study focuses its consideration on the following three points, and proposes a new method for recognition of the speed limits on speed-limit signs. (1) Make it possible to detect only the speed-limit sign in an image of scenery using a single process focusing on the local patterns of speed-limit signs. (2) Make it possible to separate and extract the two-digit numbers on a speed-limit sign in cases when the two-digit numbers are incorrectly extracted as a single area due to the light environment. (3) Make it possible to identify the numbers using a neural network without performing precise analysis related to the geometrical shapes of the numbers.
Section 2 describes a speed-limit sign detection method using the AdaBoost classifier based on image LBP feature quantities. Section 3 describes a method of reliably extracting individual speed numbers using an image in a HSV color space, and a method of classifying the indicated speed number image using a neural network that learned the probabilistic relationship between the feature vectors of the numbers and the classifications. Section 4 describes the discussion of this study and the remaining problem points.
2. Detection of Speed-Limit Signs
Figure 1 shows a landscape image which includes 40 km/h speed-limit signs installed above a road as seen looking forward from the driver’s position during driving. Because one sign is at a distance in the image, it is too small and is difficult to recognize. However, there is another speed-limit sign in a position close to the center of the image. The two red shining objects in the center are traffic signals. The speed-limit sign is round in shape, with a red ring around the outer edge and blue numbers on a white background indicating the speed limit.
The image acquired from the camera uses the popular RGB. In order to obtain the hue information, the image is converted to the popular Hue, Saturation, Value (HSV) [31,32,33]. The resulting image is expressed as independent Hue, Saturation, and Value parameters, providing color information that is highly robust in terms of brightness. When the threshold value with respect to Hue H expressed at an angle of 0–2π is set to , this yields the HSV image shown in Figure 2a. As shown in Figure 2b, when the image is converted to a binary image where only the regions where the Hue is within the set threshold value appear white and all other regions appear black, we can see that parts other than the sign have also been extracted.
Because regions other than the sign are included in the binary image as shown in Figure 2b, first at the labeling process for the extracted regions we remove the white regions that have small areas, and next we perform contour processing for the labeled regions. The roundness of the region is calculated from the area and peripheral length which are obtained as the contour information, and only the regions considered to be circular are extracted. The results are as shown in Figure 3.
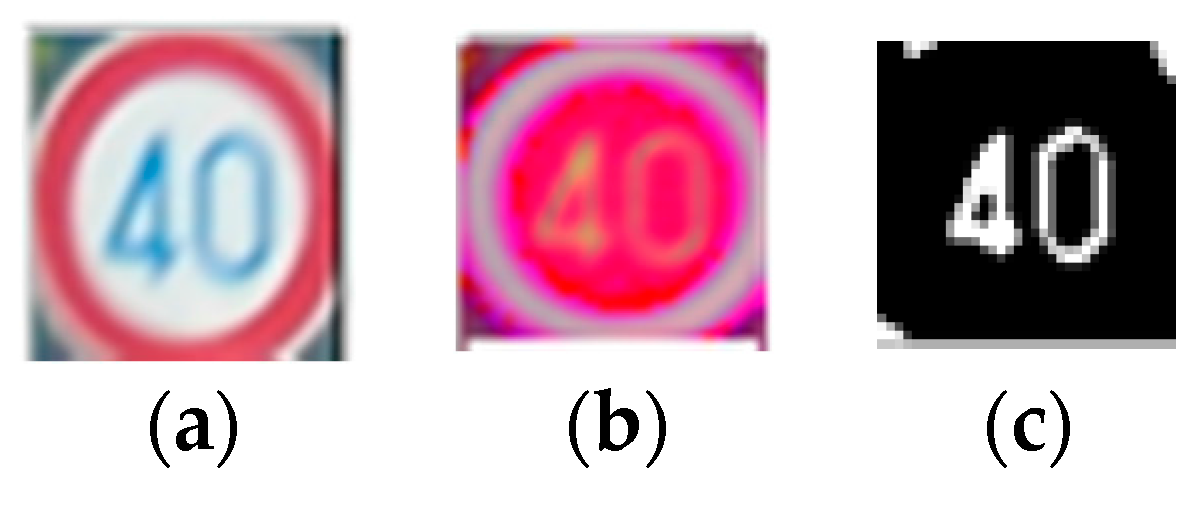
When the bounding box around the red circle is added based on the binary image of the extracted traffic sign (Figure 3), we obtain the coordinates of the top left and bottom right corners of the speed-limit sign. Based on these corners, we are able to extract only the part corresponding to the traffic sign from the landscape image (Figure 1). The extracted image is shown in Figure 4a. After converting this image to a HSV image (Figure 4b), and performing a binarization process by setting the threshold for the blue, the result is the extracted speed limit of 40 km/h, as can be seen in Figure 4c.
Outdoors, even when imaging the same scene, Hue, Saturation, and Value vary depending on the time, such as day or night, and when imaging the scene from different directions. As a result, it is necessary to use a processing method which considers these differences when extracting the signs. However, this requires making precise settings in advance to handle all of the various situations that may occur.
This study attempted to find a method of determining the speed-limit sign pattern (feature quantities) in the image by converting the image to a grayscale image so that the color differences are converted to differences in grayscale levels, instead of using the color information directly. The AdaBoost classifier [34] is used to detect the speed-limit signs based on feature quantities extracted from the image. The AdaBoost classifier is a machine learning algorithm that combines a number of simple classifiers (weak classifiers) with detection accuracy that is not particularly high to create a single advanced classifier (strong classifier).
Local binary pattern (LBP) feature quantities [35,36,37] are used as the feature quantities. LBP find the differences between the target pixel and the eight neighboring pixels, and assigns values of one if positive and zero if negative, and express the eight neighboring pixels as a binary number to produce a 256-grade grayscale image. These feature quantities have a number of characteristics, including the fact that they can be extracted locally from the image, are resistant to the effects from image lighting changes, can be used to identify the relationships with the surrounding pixels, and require little calculation cost.
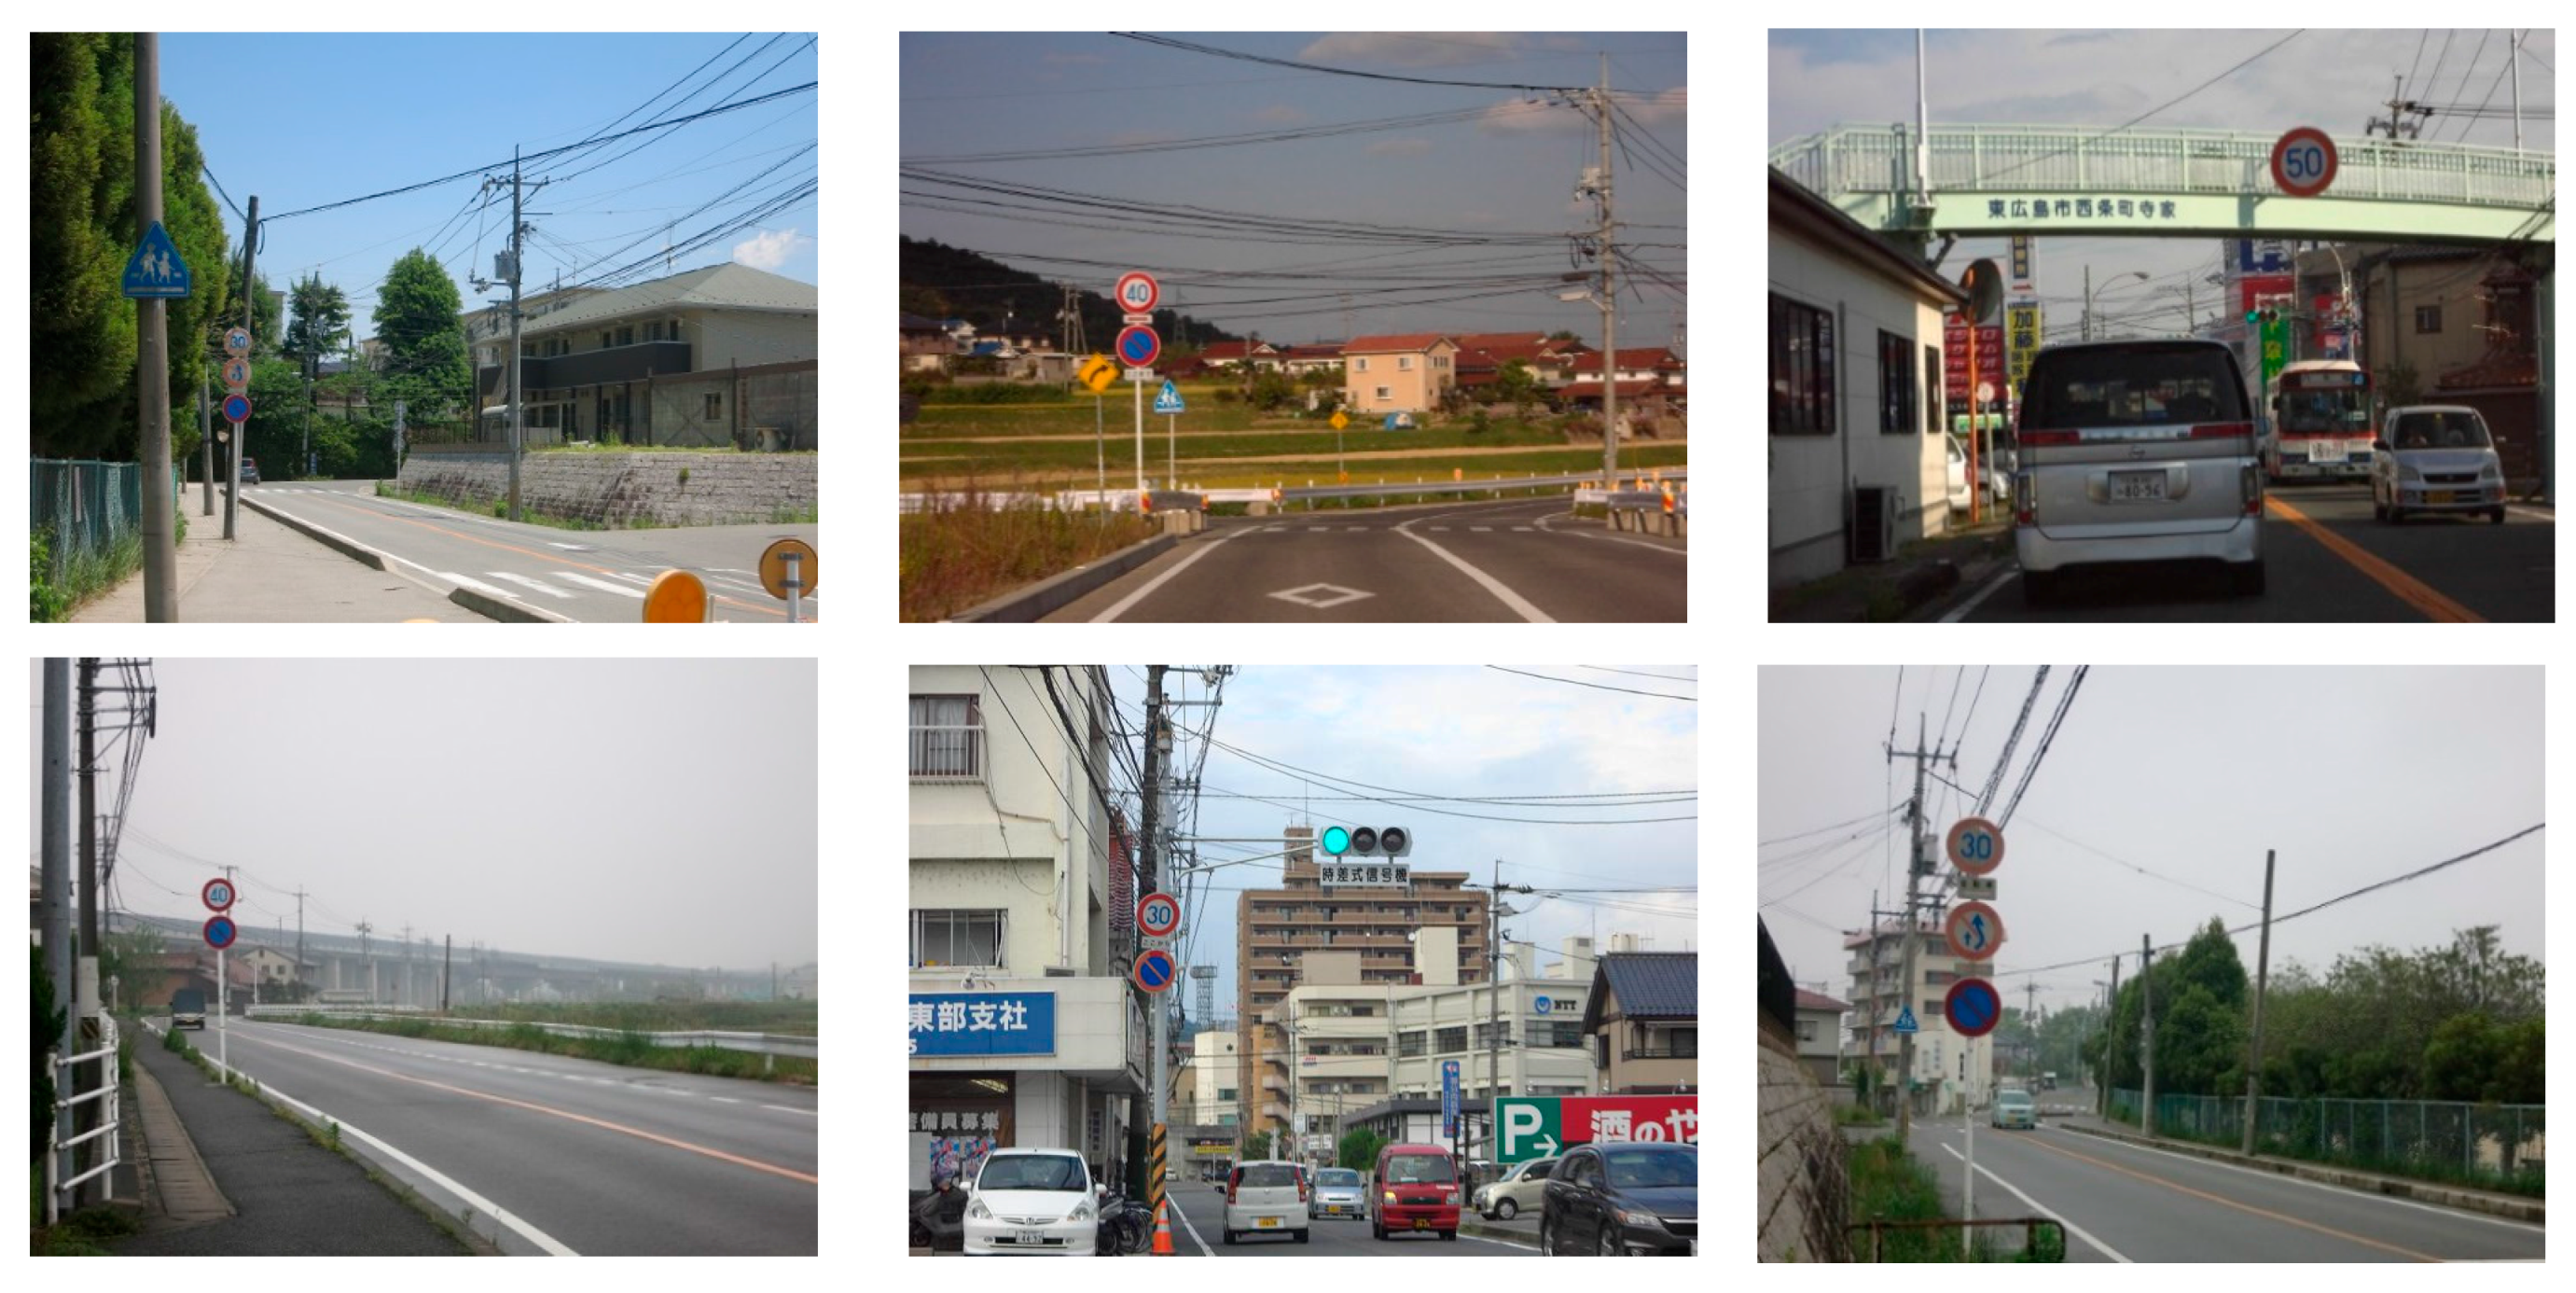
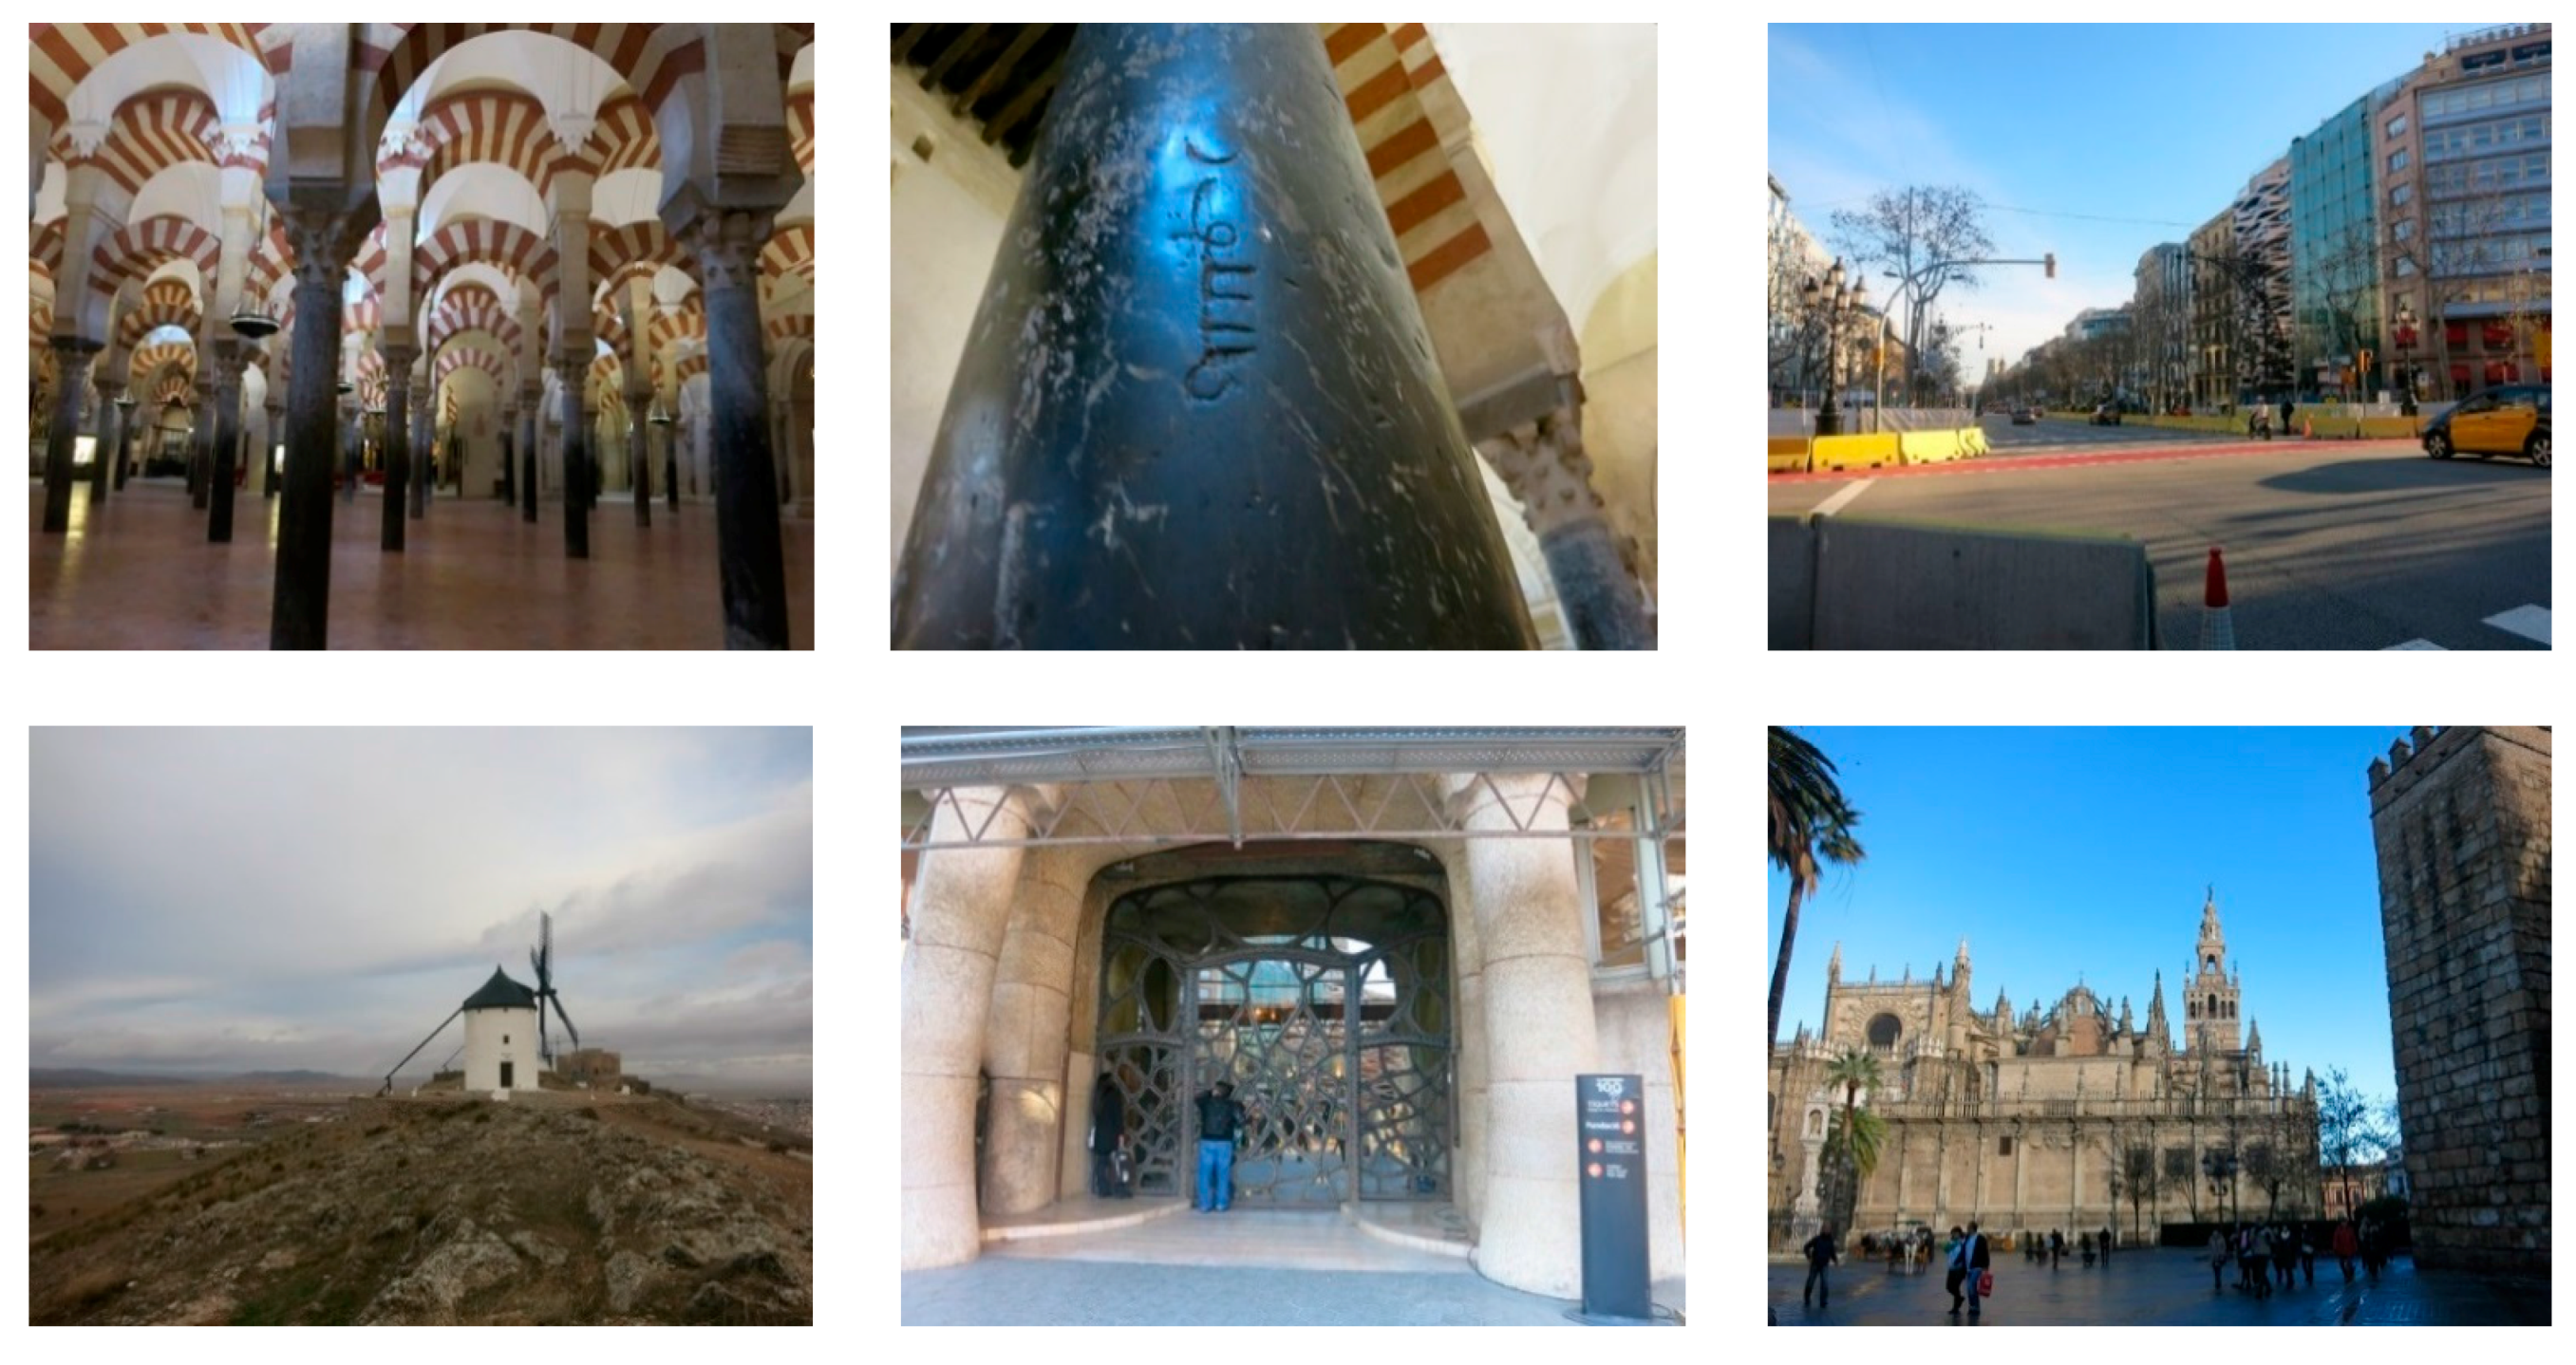
200 images which contained speed-limit signs (positive images) and 1000 images which did not contain speed-limit signs (negative images) were used for training set. A testing set of 191 images was prepared separately from the training set. The positive images included images of a variety of conditions including images with clear sign colors, images with faded sign colors, and images of signs photographed at an angle. Examples of the positive and negative images are shown in Figure 5 and Figure 6.
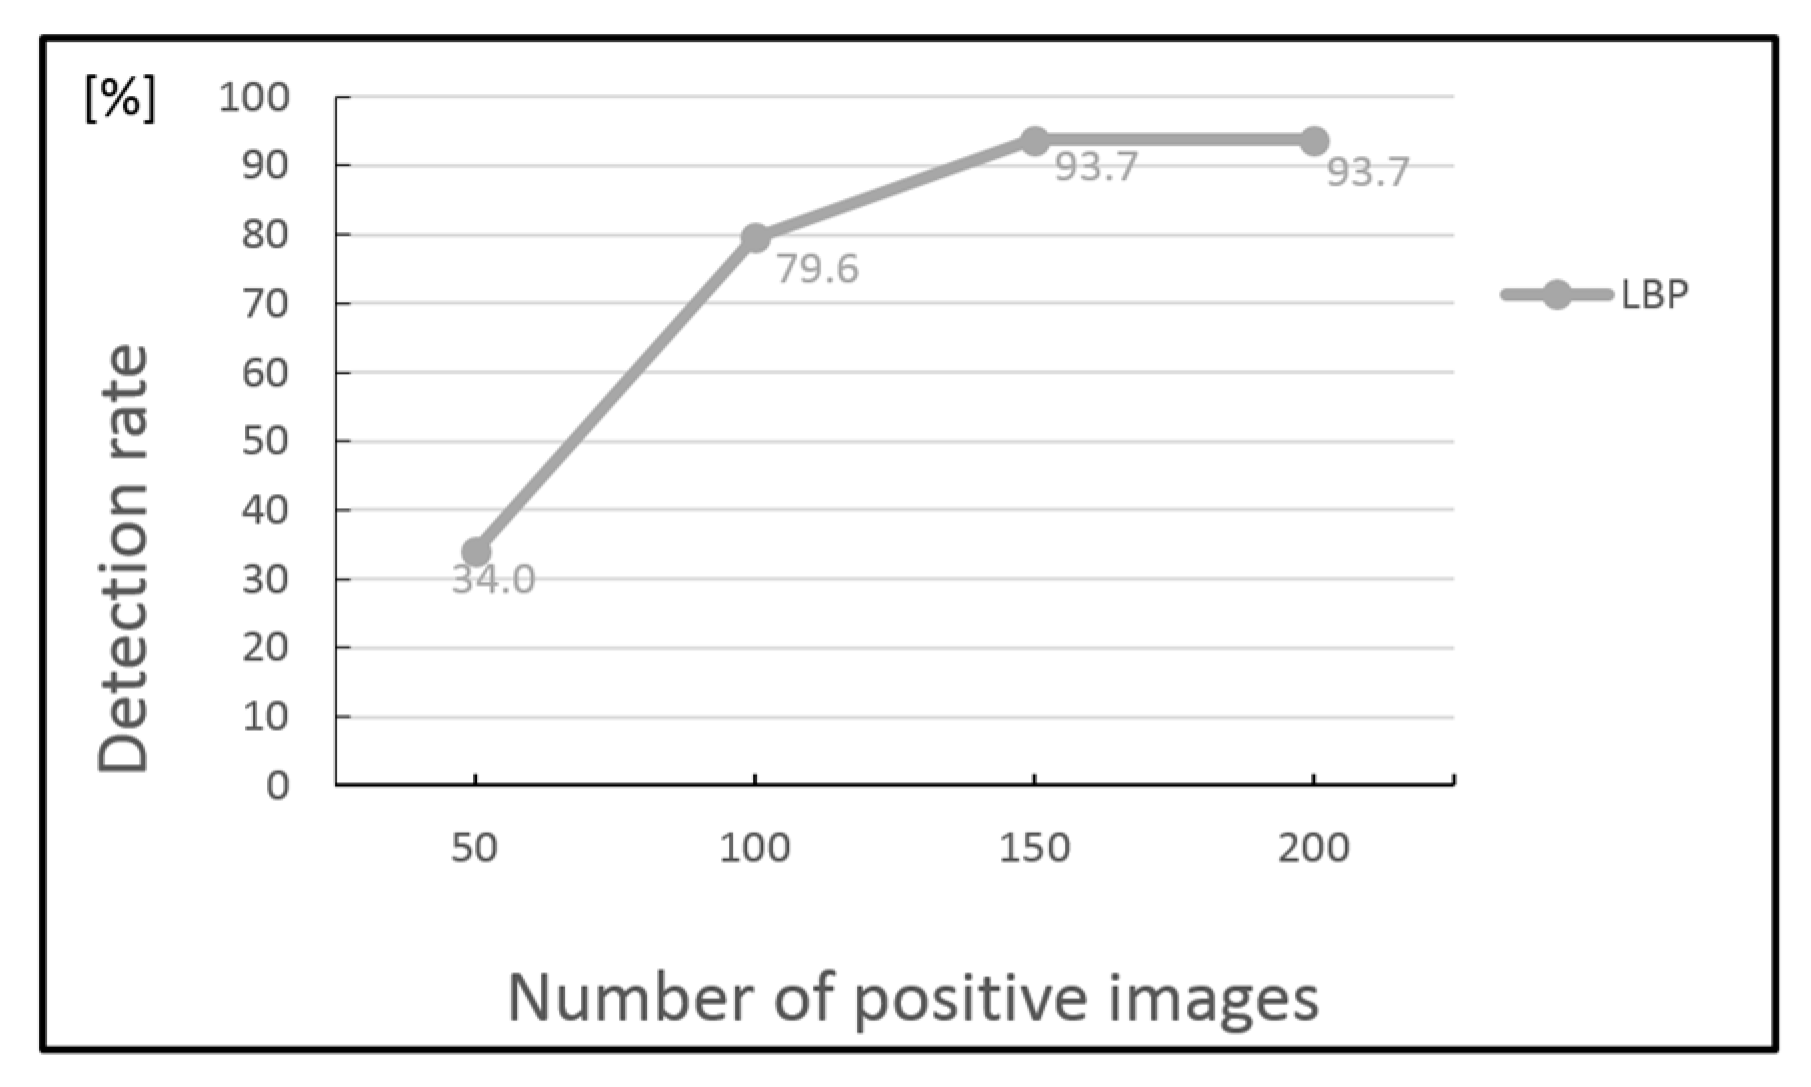
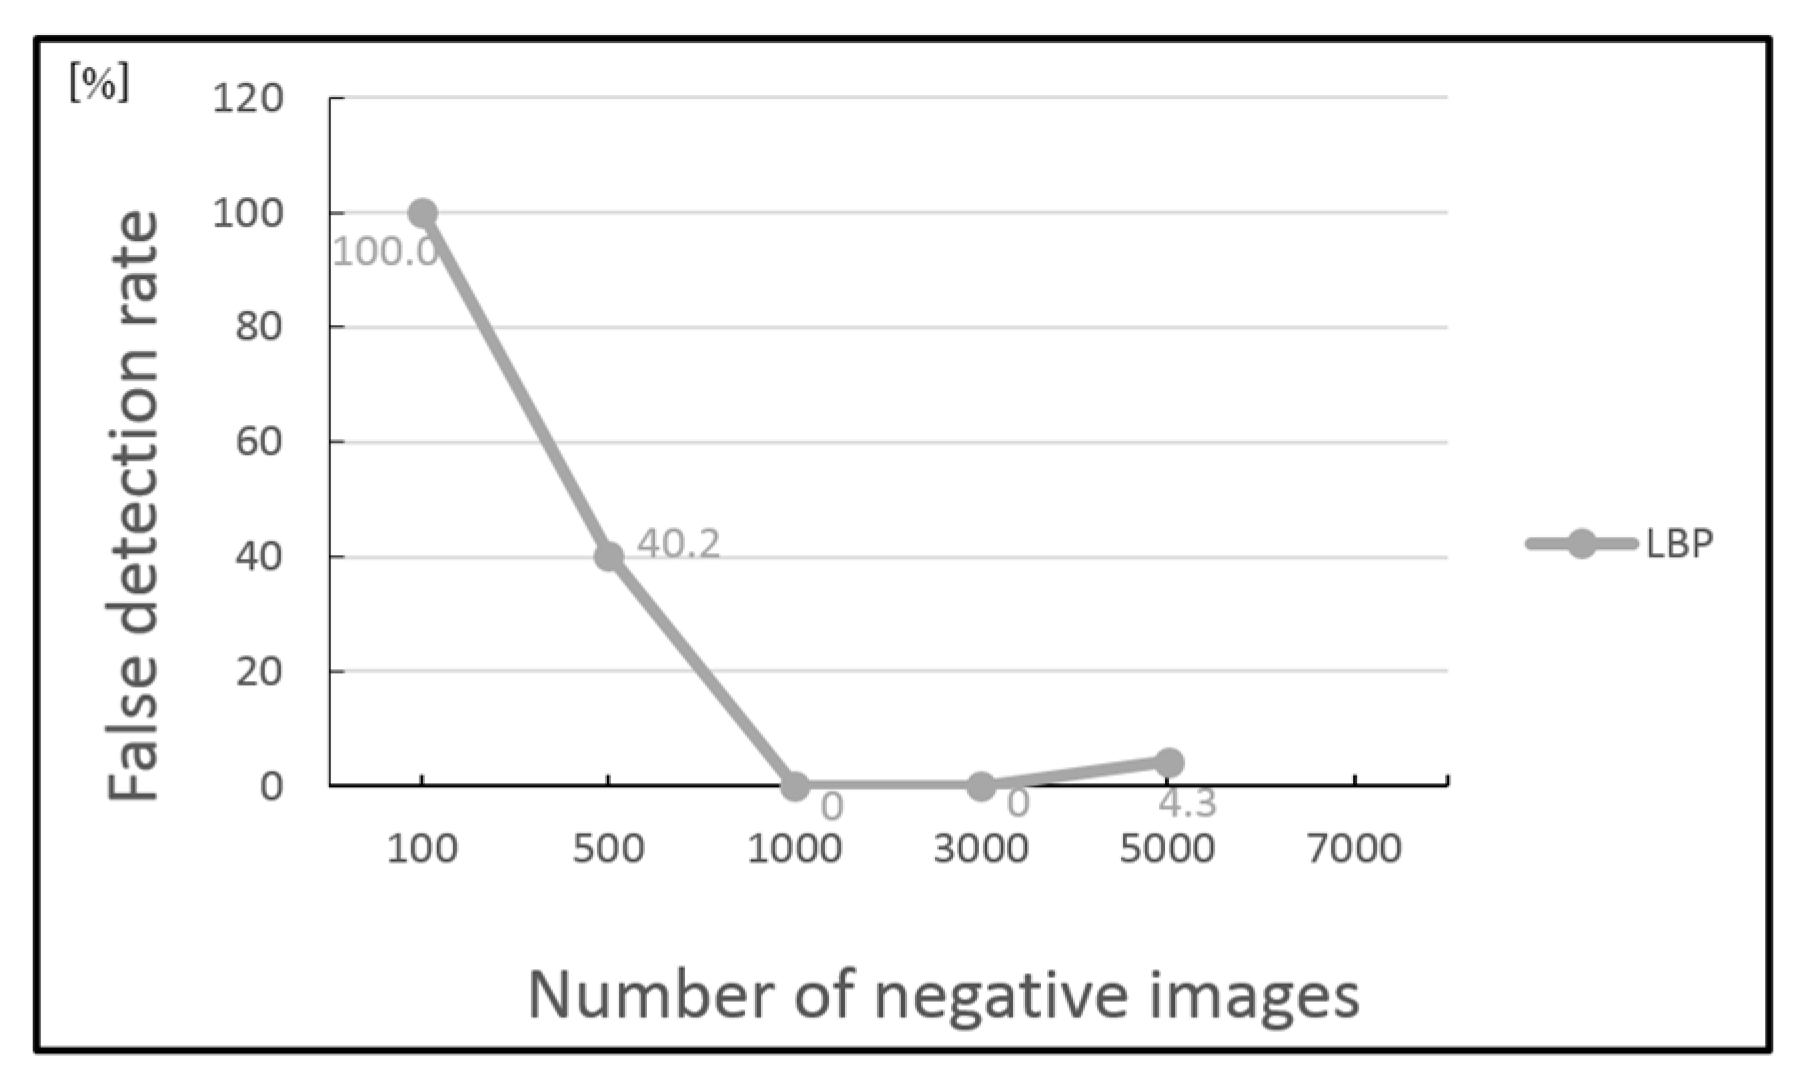
Figure 7 shows the changes in the detection rate when the number of positive images was increased from 50 to 100, 150, and 200 for the same 1000 negative images. It shows that increasing the number of positive images increases the detection rate. Figure 8 shows the changes in the false detection rate (= (Number of detected areas that are not speed-limit signs)/Number of detected speed-limit signs)) when the number of negative images was increased from 100 to 7000. It shows that although the false detection rate dropped to 0 (%) with 1000 and 3000 negative images, a small number of false detections occurred when the number of negative images was 5000 or more. It is believed that using too many negative images results in excessive learning or conditions where learning cannot proceed correctly.
Figure 9 shows the detection results when an AdaBoost classifier that was created using 200 positive images and 1000 negative images was used with a testing set of 191 images that were different from the training set. The detection rate was 93.7(%) and the false detection rate was 0 (%). This means that out of the 191 images that this method was used with, there were 12 images in which the speed-limit sign was not detected, however, all 179 detected areas were actually speed-limit signs. Images a–g in Figure 9 show cases when the speed-limit sign was detected, and images (h) and (i) in Figure 9 show cases when the speed-limit sign was not detected.
3. Recognition of Speed Limits on Speed-Limit Signs
The speeds on speed limit signs on ordinary roads in Japan are mostly speeds of 30 km, 40 km, and 50 km per hour. This section describes the method of recognizing the numbers on the speed-limit signs that were extracted using the method in Section 2.
The methods for identifying numbers and letters include a statistical approach and a parsing approach. The statistical approach is a method that evaluates the class to which the observed pattern most resembles based on the statistical quantities (average, variance, etc.) of feature quantities from a large quantity of data. The parsing approach considers the pattern of each class to be generated in accordance with rules, and identifies the class of the observed pattern by judging which of the class rules were used to generate it. Recently, the use of neural networks as a method of machine learning based on statistical processing makes it relatively simple to configure a classifier with good classifying performance based on learning data [38,39]. As a result, this method is frequently used for character recognition, voice recognition, and the other pattern recognition. It is said that a neural network makes it possible to acquire a non-linear identification boundary through learning, and delivers pattern recognition capabilities that are superior to previous technologies. Therefore, for the method in this study, a neural network was used to learn the probabilistic relationship between the number feature vectors and classes based on learning data, and to judge which class a target belonged to, being based on the unknown feature vectors acquired by measurement.
In this study, a 3-layer neural network was created, with the input layer, output layer, and intermediately layer each composed of four neurons.
The neural network learning data was prepared as follows. Individual numbers were extracted from images of speed-limit signs captured under a variety of conditions as shown in Figure 10, and were converted to grayscale images. The images were then resized to create four images: 5 × 5, 10 × 10, 15 × 15, and 20 × 20. 35 images of the number 0, 20 images of the number 3, 35 images of the number 4, and 20 images of the number 5 were prepared.
For each image, the following three feature quantities were calculated to create the feature quantity file: brightness, horizontal and vertical projection. Examples of feature quantities for each number are shown in Figure 11.
Using the fact that the numbers are printed on speed-limit signs in blue, the number areas are extracted based on color information. Because the Hue, Saturation, Value (HSV) color specification system is closer to human color perception than the red, green, blue (RGB) color specification system, the image is converted from a RGB image to a HSV image, and the Hue, Saturation, and Value parameters are adjusted to extract only the blue number. As shown in Figure 12, there are cases when the two-digit numbers cannot be separated, such as when the same parameters are used to process images acquired in different light environments, or when the image is too small. This study attempted to resolve this problem by using a variable average binarization process. If the image was acquired at a distance of 60–70 m from the sign, because the size of the image was 40 pixels or less, this problem was resolved by automatically doubling the image size before the number extraction process was performed. When the distance to the sign is approximately 70 m or more, the sign image itself is too small and it is not possible to extract the numbers.
The following is a detailed description of the processing used to extract each of the numbers on speed-limit signs.
As shown in Figure 4a, a speed limit sign consists of a red circle on the periphery with the numbers printed in blue on a white background inside the circle. Rather than directly extracting the numbers from the blue area, the speed limit sign extracted from the color image is converted to a grayscale image, and that image is subjected to variable average binarization to produce the image shown in Figure 13a. The parts that are higher than a threshold for the Value inside and outside the red circle are converted to white, and all other parts are converted to black.
Because the area of the speed-limit sign detected in the image is a square that contacts the outer edges of the red circle, the numbers are located approximately in the center of the square. In consideration of this, processing is focused only on the square area at the center. Since the surrounding areas contain large amounts of white area (noise), this means that the process for removing the noise can be omitted. Extracting the area near the center and performing reverse processing yields the image shown in Figure 13b.
Figure 13c shows the contours extracted from the borders between the white areas and black areas in Figure 13b. The areas inside the multiple extracted contours are calculated. For the number 0 part, there are both inner and outer contours. Therefore, with both the number 3 contour and the two number 0 contours, there are a total of three contours in the number candidate images, and they occupy a large area in the image. After acquiring the contours with the three largest areas and filling them in, this yields two filled-in areas. For these two areas, the centroid of each area is found and the vertical coordinate value (Y coordinate) of each is calculated. The number 3 and number 0 on the speed-limit sign are described using approximately the same vertical coordinate of position. Therefore, when the Y coordinates of the filled-in areas described above are approximately the same, the number 3 and number 0 areas are used as the mask image for the image in Figure 13b. This mask image is used to perform mask processing of Figure 13b to produce the number candidate areas shown in Figure 13d.
In addition, the dilation-erosion processing was performed to eliminate small black areas inside white objects in case that they exit in Figure 13d, and then a contour processing was performed to separate the areas again, producing Figure 13e. From this contour image (in this case, two contours), bounding rectangles with no inclination are found. Only the areas with aspect ratios close to those of the number 3 and number 0 are surrounded with the red bounding rectangles as shown in Figure 13f and are delivered to the recognition processing. The numbers 0 and 1 are assigned to indicate the delivery order to the recognition processing.
The area is divided using the rectangles contacting the peripheries of the number candidate areas as shown in Figure 13f. Each of these rectangular areas is separately identified as a number area. Therefore, the coordinate information for the number areas inside the speed limit sign is not used during the processing.
Following is an explanation of the application of this method to video. When image acquisition begins 150–180 m in front of the speed limit sign, detection begins in the distance range of 100–110 m. The distance at which recognition of the sign numbers begins is 70–90 m. Sufficient recognition was confirmed at 60–70 m. In this test, the processing time was on average 1.1 s/frame. The video camera image size was 1920 × 1080. The PC specs consisted of an IntelR CoreTM i7-3700 CPU @ 3.4 GHz and main memory of 8.00 GB.
At a vehicle speed of 50 km/h, a distance of 70 m is equivalent to the distance travelled in 5 s. Because the processing time for this method at the current stage is approximately 1 s, it is possible to inform the driver of the speed limit during that time.
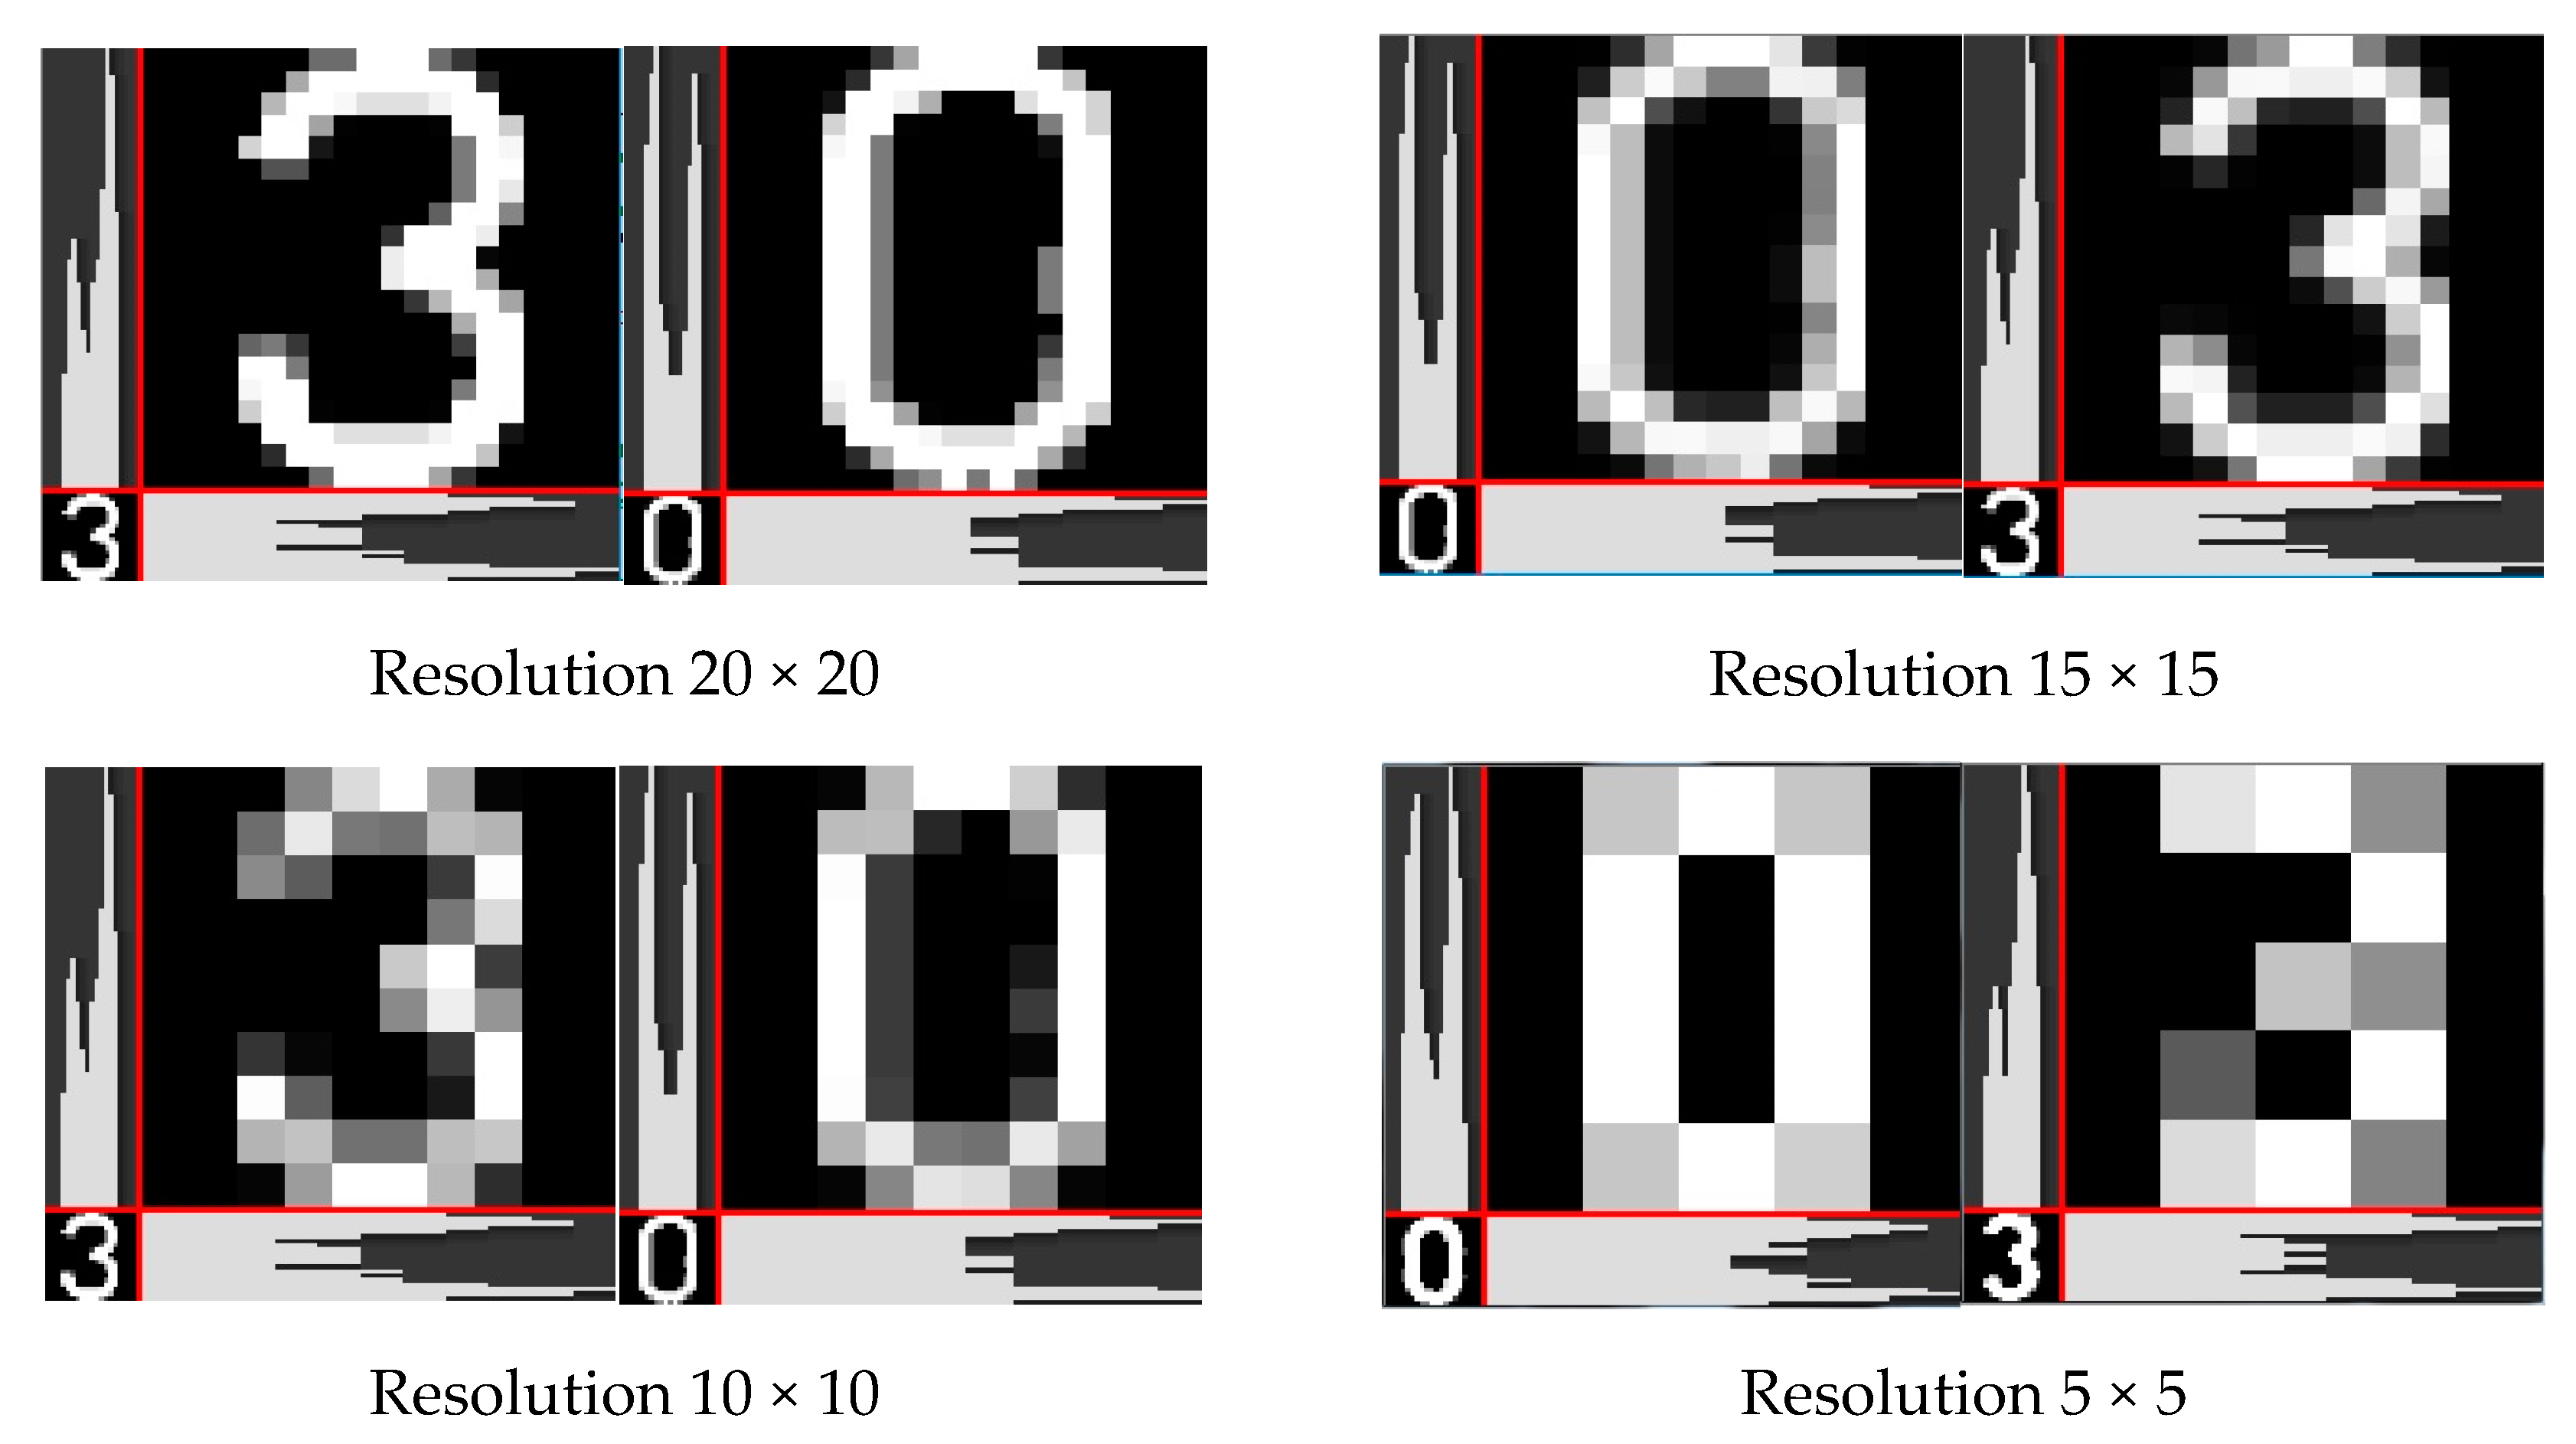
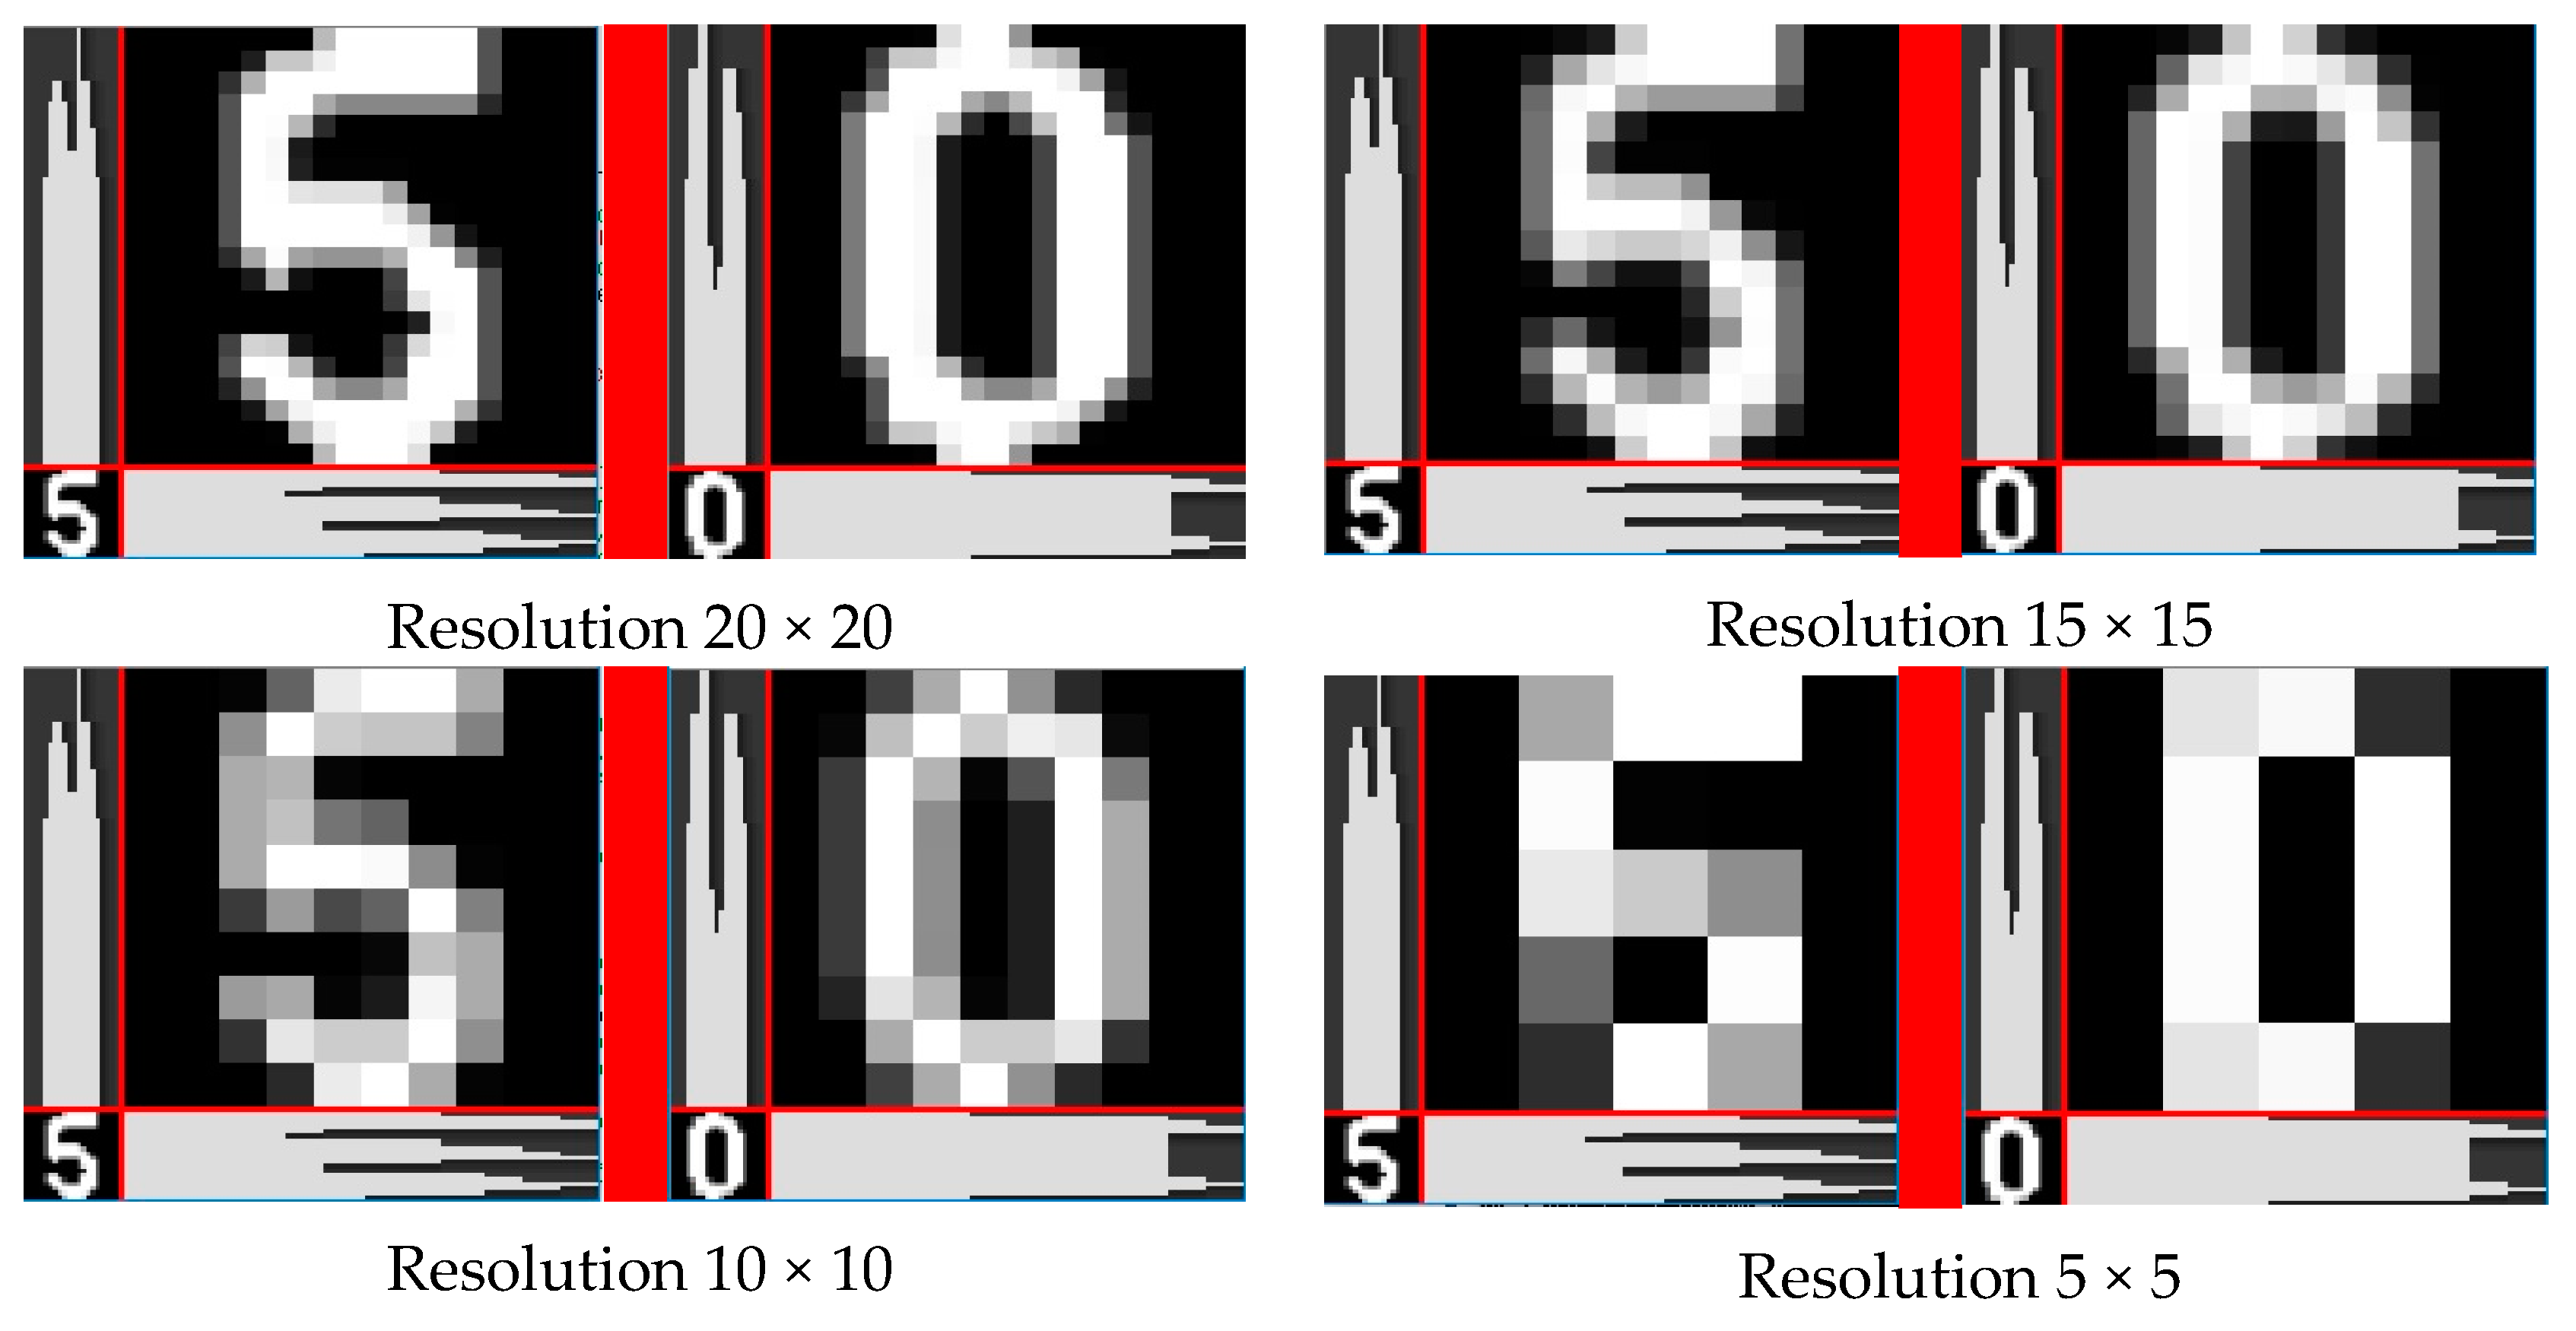
In order to identify what number each input image corresponds to, the 3 feature quantities of brightness, vertical and horizontal projection were calculated for each separated and extracted number image. These were then input into a neural network that had completed learning. Number recognition was then performed at each of the image resolutions (5 × 5, 10 × 10, 15 × 15, 20 × 20). Images of the feature quantities at each resolution for the extracted numbers 30, 40, and 50 are shown in Figure 14, Figure 15 and Figure 16. Identification results for 30 km, 40 km, and 50 km per hour speed limits are shown in Figure 17, Figure 18 and Figure 19.
Figure 17 shows the recognition results for the 30 km/h speed limit. When the resolution was 20 × 20, the 30 km/h speed limit was falsely recognized as 00 km/h. At all other resolutions, it was recognized correctly as 30 km/h.
Figure 18 shows the recognition results for the 40 km/h speed limit. It was recognized correctly as 40 km/h only at the 5 × 5 resolution. At other resolutions, it was falsely recognized as 43 km/h.
Figure 19 shows the recognition results for the 50 km/h speed limit. It was correctly recognized as 50 km/h at the 5 × 5 recognition. It was falsely recognized as 55 km/h at the 20 × 20 resolution, and 53 km/h at the 15 × 15 and 10 × 10 resolutions.
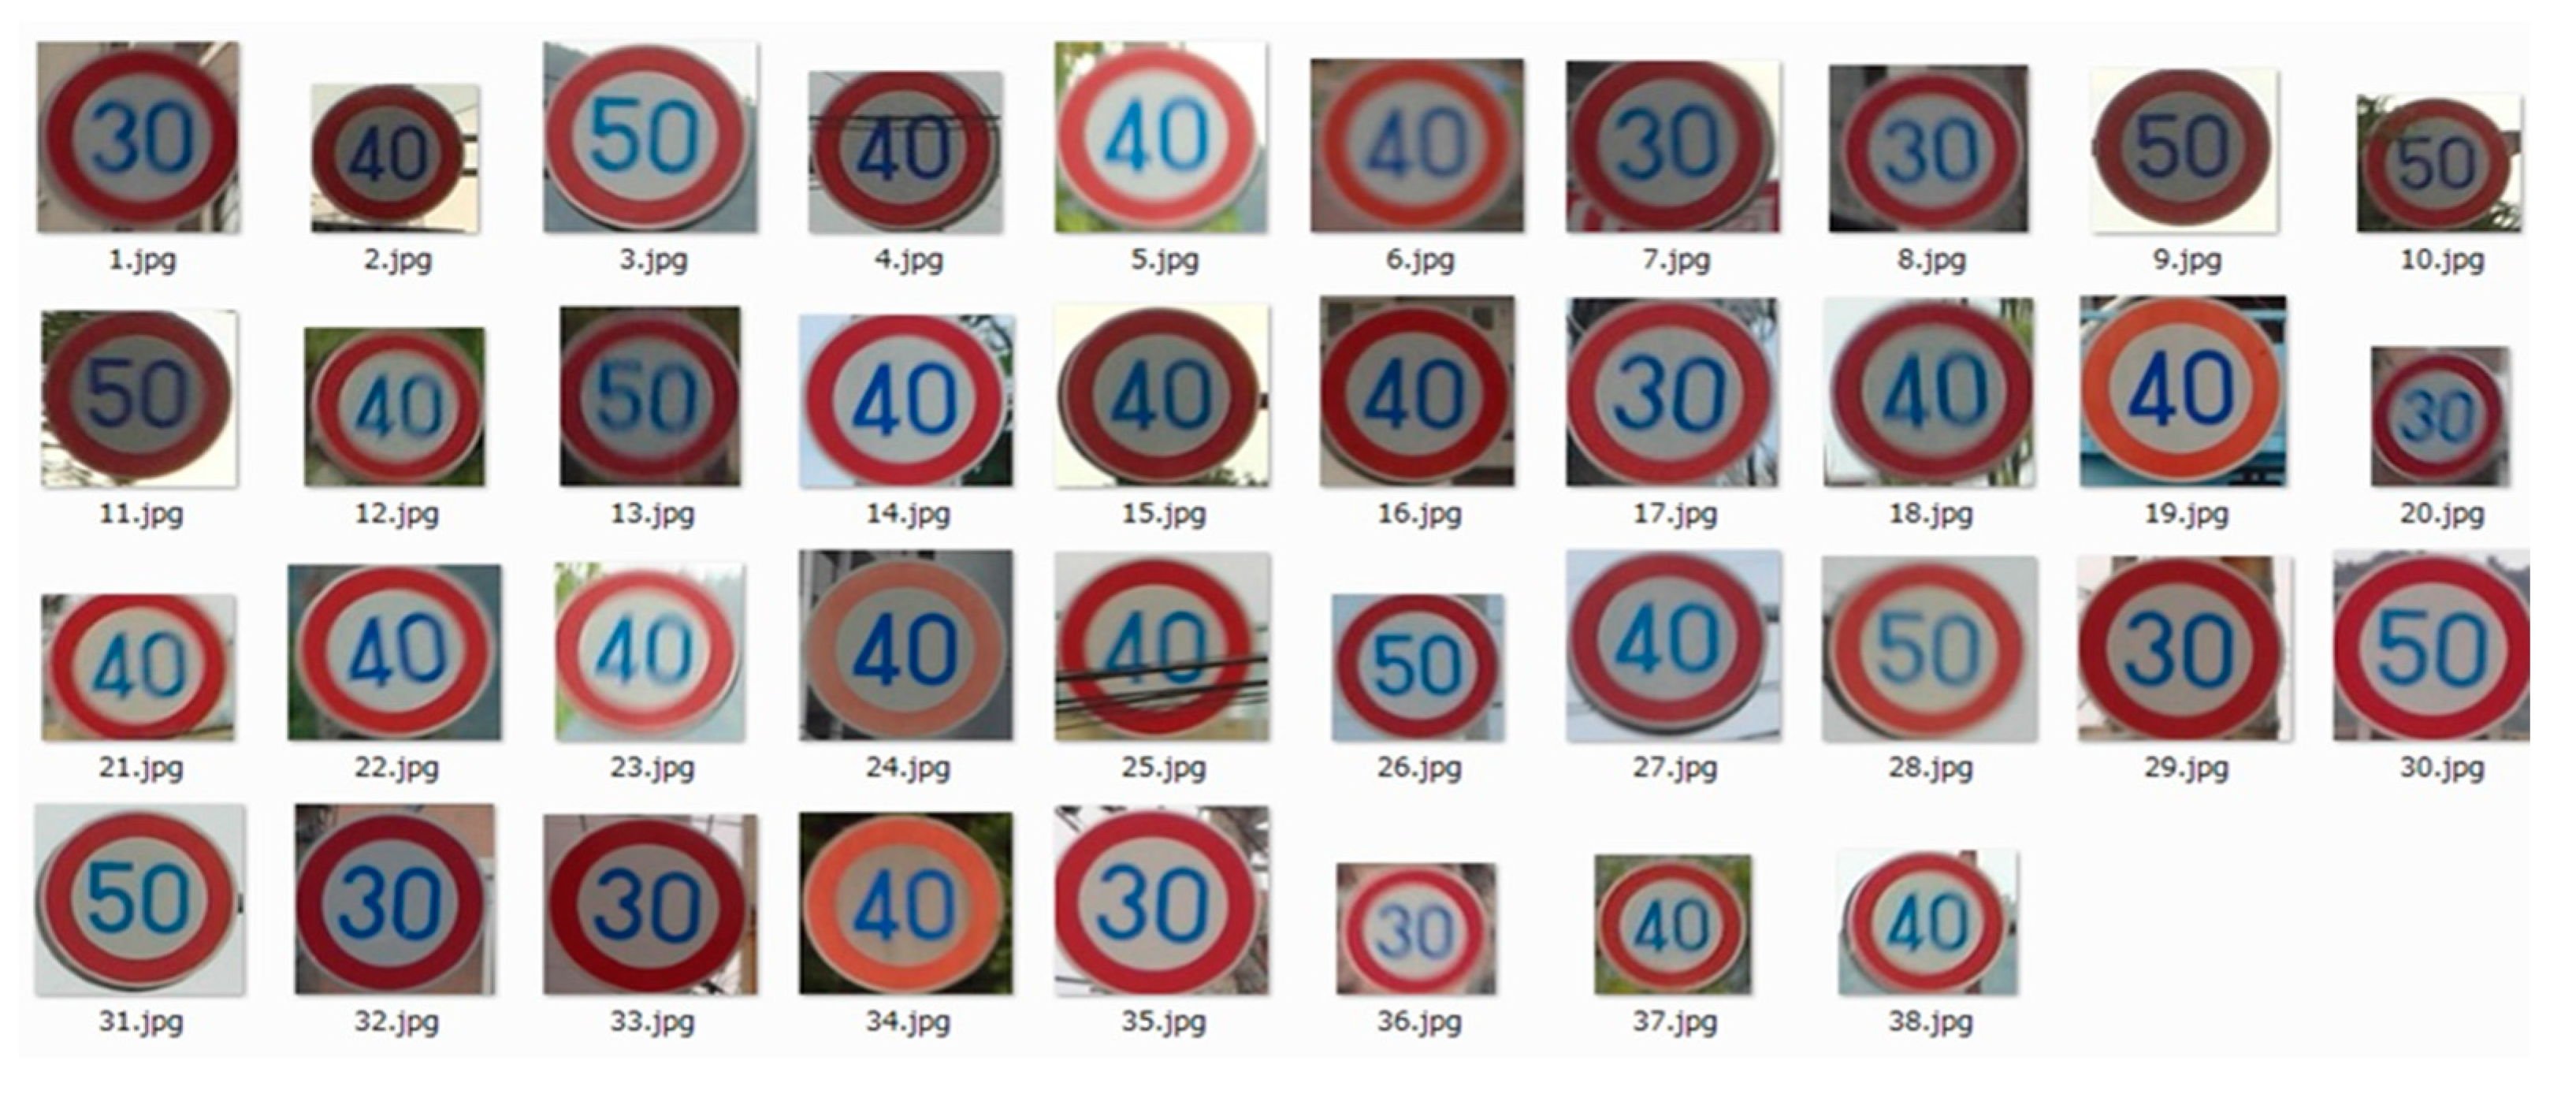
When the recognition conditions of 191 speed-limit signs were investigated, although there was almost no false recognition of 4 and 5 as other numbers, there were many cases of the numbers 0 and 3 each being falsely recognized as the other. Using the feature quantities in Figure 11, it was separately confirmed that when the Value of certain pixels in the number 3 is deliberately changed, it may be falsely recognized as 0. Conversely, when the same is done with the number 0 it may be falsely recognized as 3. Changing the Value of certain pixels means that depending on the threshold settings for Value, Saturation, and Hue when the sign numbers are extracted during actual processing, the grayscale Value of those pixels may vary. It is thought that this is the reason why the numbers 0 and 3 are falsely recognized as each other. When the lower limit values for Value and Saturation were set to 60 for the 38 images shown in Figure 20, then it was not possible to correctly extract the blue area numbers and false recognition occurred in the resolution 5 × 5 recognition results for 2.jpg, 10.jpg, 20.jpg, 26.jpg, and 36.jpg. For the 5 images where false recognition occurred, when the Saturation lower limit was set to 55 and the Value lower limit was set to 30, false recognition occurred in only 1 image (20.jpg). This shows that a slight difference in the threshold settings for Value, Saturation, and Hue will result in a small difference in the number feature quantities, and this has an effect on neural network recognition.
The speed recognition rate results for 191 extracted speed limit signs at each of the 4 resolutions (5 × 5, 10 × 10, 15 × 15, 20 × 20) are shown in Table 1.
The methodology of this study involved identifying the four numbers 0, 3, 4, and 5 individually for speed limits 30 km/h, 40 km/h, and 50 km/h. Therefore, the recognition rate for a two-digit number was considered to be the recognition rate when both of the numbers were correctly identified, and this recognition rate was presented for each resolution. Because the numbers were recognized individually, there remained the problem of false recognition due to the effects of the extraction process for the number 0 and number 3. As a result, as shown in Figure 17, Figure 18, and Figure 19, speed limits which do not actually exist (00 km/h, 43 km/h, and 53 km/h) were indicated. When such speed limits that do not exist are present in the recognition results, they can be easily identified as false recognition. Finally, it will be necessary to improve the methodology by performing a repeated recognition process when such results occur.
It shows that the recognition rate was highest with the 5 × 5 resolution image, and decreased at higher resolutions. This is believed to be because when the resolution is higher, the discrimination ability increases and numbers can only be recognized when the feature quantities are a nearly perfect match. Conversely, when the resolution is lower, the allowable range for each feature quantity increases, increasing the invariability of the feature quantities. This means that identification at low resolutions is not largely affected by some degree of difference in feature quantities between the evaluation image and learning images.
4. Discussion
The recognition method previously proposed by the author and others had a number of problems that needed to be resolved, including the inability to recognize the speed printed on the signs, and the need for a process to eliminate all parts other than the detected speed sign because the method uses only color information. This study proposed a method which converts the color image to a grayscale image in order to convert color differences to differences in grayscale levels, and uses the resulting pattern information during the speed limit sign detection process. During the process for recognizing the speed printed on a speed limit sign, first the RGB color space is converted to a HSV color space, and a variable average binarization process is applied to that image, allowing the individual speed numbers printed in blue to be reliably extracted. A neural network is then used to recognize the speed numbers in the extracted number areas.
Detection of the speed limit signs was performed using an AdaBoost classifier based on image LBP feature quantities. Feature quantities that can be used include Haar-like feature quantities, HOG feature quantities, and others, however, LBP feature quantities are the most suitable for speed limit sign detection because the LPB feature quantity learning time is shortest and because the number of false detection target types is smaller than with other feature quantities.
For number recognition, four image resolutions (5 × 5, 10 × 10, 15 × 15, 20 × 20) were prepared, and of these the 5 × 5 resolution showed the highest recognition rate at 97.1%. Although the 5 × 5 resolution is lower than the 20 × 20 resolution, it is thought that false detections were fewer because the feature quantities for each number have a certain invariability at lower resolutions. The percentage in which the speed limit sign was detected and the number part of the sign was correctly identified was 85%. Based on this, it will be necessary to improve the speed limit sign detection accuracy in order to improve the overall recognition rate.
The remaining issues include cases when the speed limit sign is not detected using only the feature quantities used in this study, and cases when number extraction was not successful due to signs with faded colors, signs that were backlit, or signs that were partially hidden by trees or other objects. In the future, it will be necessary to improve detection and recognition for the issues above. Because the processing time at the current stage is 1.1 s, and is too long for appropriately informing the driver, steps to shorten the processing time will also be necessary. It is possible that the use of a convoluted neural network or similar means may result in further improvement, and it will be necessary to perform comparison studies to determine the relative superiority compared to the method in this study. It is thought that improvements to these issues will be of increasing utility in driver support when automated driving is used.
Acknowledgments
I would like to thank Kenji OKA who provides great support for this study and to everyone who discussed this study at the conference or the meeting.
Author Contributions
Shigehrau Miyata contributed to the design of the study, and to write the initial draft and the final version of the manuscript. I have contributed to data collection, data analysis and interpretation in the preparation of the manuscript. I am accountable for all aspects of the work in ensuring that questions related to the accuracy or integrity of any part of the work are appropriately investigated and resolved.
Conflicts of Interest
I or my institution at any time did not receive or services from a third party (government, commercial, private foundation, etc.) for any aspect of the submitted work (including but not limited to grants, data monitoring board, study design, manuscript preparation, statistical analysis, etc.).
References
- Yamaguchi, H.; Kojima, A.; Miyamoto, T.; Takahashi, H.; Fujunaga, K. A Robust Road Sign Recognition by Superposing Extracted Regions from Successive Frame. IEICE Trans. D-II 2007, 90, 494–502. (In Japanese) [Google Scholar]
- Uchida, S.; Iwamura, M.; Omach, S.; Kise, K. Category Data Embedding for Camera-Based Character Recognition. IEICE Trans. D-II 2006, 89, 344–352. (In Japanese) [Google Scholar]
- Kimura, S.; Tano, H.; Sakamoto, T.; Shiroma, H.; Ohashi, Y. Traversal Region and Obstacle Detection Using Tilted-Plane-Based Stereo Vision. Robot. Soc. Jpn. 2005, 23, 59–66. (In Japanese) [Google Scholar]
- Mo, G.; Aoki, Y. A Recognition Method for Traffic Sign in Color Image. IEICE Trans. D-II 2004, 87, 2124–2135. (In Japanese) [Google Scholar]
- Doermann, D.; Liang, J.; Li, H. Progress in Camera-Based Document Image Analysis. In Proceedings of the Seventh International Conference on Document Analysis and Recognition, Edinburgh, UK, 6 August 2003; pp. 606–616. [Google Scholar]
- Hsu, S.; Huang, C. Road Sign Detection and Recognition Using Matching Pursuit Method. Image Vis. Comput. 2001, 19, 119–129. [Google Scholar] [CrossRef]
- Uchimura, K.; Wakiyama, S.; Fujino, M. Extraction of Circular Traffic Sign Using Limited Color Indication. IEICE Trans. D-II 2000, 83, 855–858. (In Japanese) [Google Scholar]
- Gavrila, D.M. Multi-Feature Hierarchical Template Matching Using Distance Transforms. In Proceedings of the 19th International Conference on Pattern Recognition (ICPR 2008), Tampa, FL, USA, 8–11 Decmber 1998; pp. 439–444. [Google Scholar]
- Piccioli, G.; de Michieli, E.; Parodi, P.; Campani, M. Robust Method for Road Sign Detection and Recognition. Image Vis. Comput. 1996, 14, 209–223. [Google Scholar] [CrossRef]
- Frejlichwski, D. Application of the Polar-Fourier Greyscale Descriptor to the Automatic Traffic Sign Recognition. In Proceedings of the International Conference Image Analysis and Recognition (ICIAR), Niagara Falls, Canada, 22–24 July 2015; pp. 506–513. [Google Scholar]
- Gao, J.; Fang, Y.; Li, X. Learning Local Histogram Representaion for Efficient Traffic Sign Recognition. In Proceedings of the 2015 8th International Congress on Image and Signal Processing (CISP 2015), Shenyang, China, 14–16 October 2015; pp. 631–635. [Google Scholar]
- Sun, Z.-L.; Wang, H.; Lau, W.-S.; Seet, G.; Wang, D. Application of BW-ELM model on traffic sign recognition. Neurocomputing 2014, 128, 153–159. [Google Scholar] [CrossRef]
- Liu, H.; Liu, Y.; Sun, F. Traffic sign recognition using group sparse coding. Inf. Sci. 2014, 266, 75–89. [Google Scholar] [CrossRef]
- Zaklouta, F.; Stanciulescu, B. Real-time traffic sign recognition in three stages. Rob. Auton. Syst. 2014, 62, 16–24. [Google Scholar] [CrossRef]
- Stallkamp, J.; Schlipsing, M.; Salmen, J.; Igel, C. Man vs. computer: Benchmarking machine learning algorithms for traffic sign recognition. Neural Netw. 2012, 32, 323–332. [Google Scholar] [CrossRef] [PubMed]
- Berger, M.; Forechi, A.; De Souza, A.F.; Neto, J.D.O. Traffic Sign Recognition with VG-RAM Weightless Neural Networks. In Proceedings of the 2012 12th International Conference on Intelligent Systems Design and Applications (ISDA 2012), Kochi, India, 27–29 November 2012; pp. 315–319. [Google Scholar]
- Miyata, S.; Ishikawa, T.; Nakamura, H.; Takehara, S. Traffic Sign Recognition utilizing an Eigen Space Method Based on the KL Transform. Adv. Mater. Res. 2012, 452–453, 876–882. [Google Scholar] [CrossRef]
- Gu, Y.; Yendo, T.; Tehrani, M.P.; Fujii, T.; Tanimoto, M. Traffic sign detection in dual-focal active camera system. In Proceedings of the 2011 IEEE Intelligent Vehicles Symposium (IV 2011), Baden-Baden, Germany, 5–9 June 2011; pp. 1054–1059. [Google Scholar]
- Zaklouta, F.; Stanciulescu, B. Real-time traffic sign recognition using spatially weighted HOG trees. In Proceedings of the 2011 15th International Conference on Advanced Robotics (ICAR 2011), Tallinn, Estonia, 20–23 June 2011; pp. 61–66. [Google Scholar]
- Ruta, A.; Li, Y.; Liu, X. Real-time traffic sign recognition from video by class-specific discriminative features. Pattern Recognit. 2010, 43, 416–430. [Google Scholar] [CrossRef]
- Miyata, S.; Yanou, A.; Nakamura, H.; Takehara, S. Road Sign Feature Extraction and Recognition sing Dynamic Image Processing. Innov. Comput. Inf. Control 2009, 5, 4105–4113. [Google Scholar]
- Chen, C.C.; Kao, D.S. DCT-Based Zero Replacement Reversible Image Watermarking Approach. Innov. Comput. Inf. Control 2008, 4, 3027–3036. [Google Scholar]
- Zhang, X. Improvement of a Feature-Based Image Mosaics Algorithm. Innov. Comput. Inf. Control 2008, 4, 2759–2764. [Google Scholar]
- Zhang, Z.; Ahao, Y. Multiple Description Image Coding Based on Fractal. Innov. Comput. Inf. Control 2007, 3, 1615–1623. [Google Scholar]
- Zin, T.T.; Hama, H. A Robust Road Sign Recognition Using Segmentation with Morphology and Relative Color. Inst. Image Inf. Telev. Eng. 2005, 59, 1333–1342. [Google Scholar] [CrossRef]
- Kohashi, Y.; Ishikawa, N.; Nakajima, M. Automatic Recognition of Road Signs in Bad Lighting Environment; IEICE Techical Report; IEICE (Institute of Electronics, Information and Communication Engineers): Tokyo, Japan, 2003; Volume 103, pp. 57–62. (In Japanese) [Google Scholar]
- Yamauchi, H.; Takahashi, H. A Road Sign Recognition Technique by Tracing Outline Vectors. Inst. Image Inf. Telev. Eng. 2003, 57, 847–853. [Google Scholar] [CrossRef]
- Matsuura, D.; Yamauchi, H.; Takahashi, H. Extracting Circular Road Sign Using Specific Color Distinction and Region Limitation. Syst. Comput. Jpn. 2002, 38, 90–99. [Google Scholar] [CrossRef]
- Yabuki, N.; Matsuda, Y.; Kataoka, D.; Sumi, Y.; Fukui, Y.; Miki, S. A Study on an Automatic Stop of Computation in Active Net; Technical Report; IEICE (Institute of Electronics, Information and Communication Engineers): Tokyo, Japan, 2000; Volume 99, pp. 69–76. (In Japanese) [Google Scholar]
- Uchimura, K.; Kimura, H.; Wakiyama, S. Extraction and Recognition of Circular Road Signs Using Road Scene Color Image. IEICE Trans. A 1998, J81–A, 546–553. (In Japanese) [Google Scholar]
- Rehrmann, V.; Priese, L. Fast and Robust Segmentation of Natural Color Scenes. In Proceedings of the 3rd Asian Conference on Computer Vision, Hongkong, China, 8–10 January 1998; pp. 598–606. [Google Scholar]
- Zhang, Y.J.; Yao, Y.R. Color Image Segmentation Based on HSI model. High Technol. Lett. 1998, 4, 28–31. [Google Scholar]
- Miyahara, M.; Yoshida, Y. Mathematical Transform of (R,G,B) Color Space to Munsel (H,V,C) Color Data. Proc. SPIE 1988. [Google Scholar] [CrossRef]
- Schapire, R.E. Explaining AdaBoost. In Empirical Inference; Springer: Berlin/Heidelberg, Germany, 2013; pp. 37–52. [Google Scholar]
- Takala, V.; Ahonen, T.; Pietikainen, M. Block-Based Methods for Image Retrieval Using Local Binary Patterns. In Proceedings of the SCIA 2005, Joensuu, Finland, 19–22 June 2005; pp. 882–891. [Google Scholar]
- Ojala, T.; Pietikainen, M.; Maenpaa, T. Multiresolution Gray-Scale and Rotaion Invariant Texture Classification with Local Binary Pattern. IEEE Trans. Pattern Anal. Mach. Intell. 2002, 24, 971–987. [Google Scholar] [CrossRef]
- Ojala, T.; Pietikainen, M.; Hardwood, D. A Comparative Study of Texture Measures with Classification Based on Feature Distribution. Pattern Recognit. 1996, 29, 51–59. [Google Scholar] [CrossRef]
- Kecman, V. Learning and Soft Computing; The MIT Press: Cambridge, MA, USA, 2001. [Google Scholar]
- Bishop, C.M. Neural Networks for Pattern Recognition; Oxford University Press: Oxford, UK, 1995. [Google Scholar]
Figure 1.
Typical landscape image that includes a speed-limit sign as seen during driving.
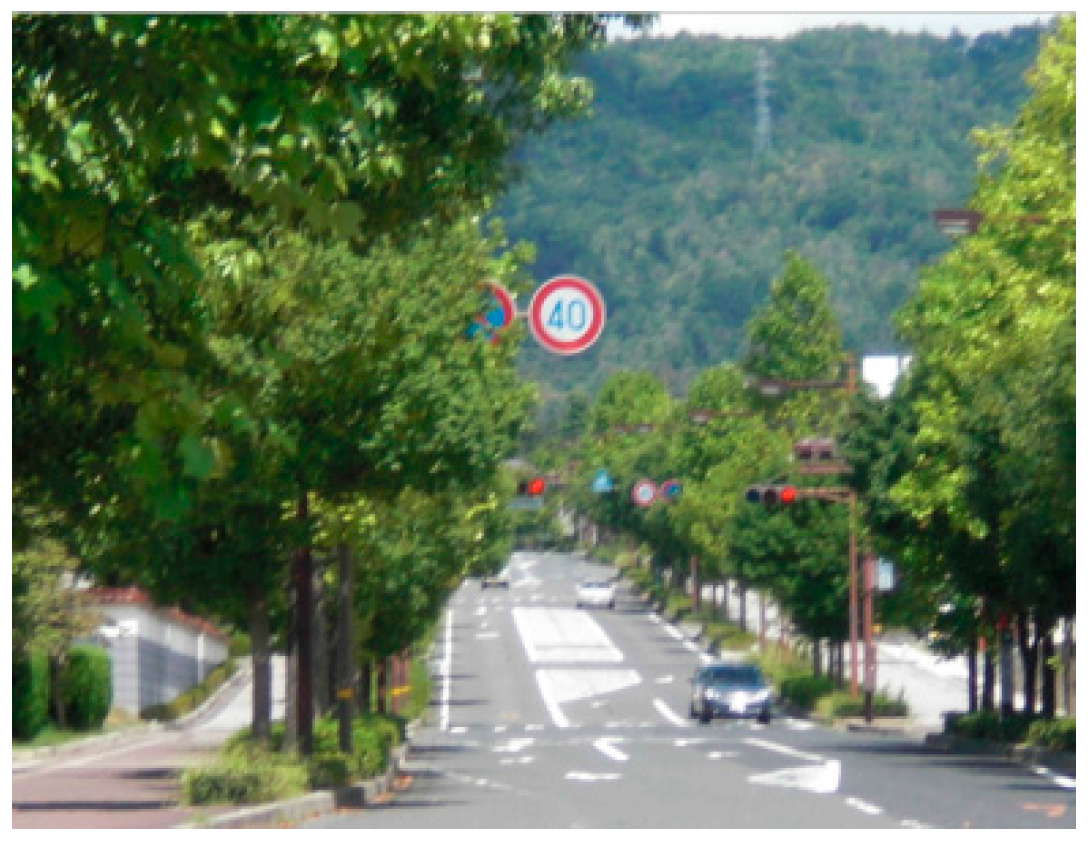
Figure 2.
(a) Hue, Saturation and Value (HSV) image and (b) image of extracted Hue regions when a threshold value is set for Hue (H) in order to extract the red ring at the outer edge of the sign.
Figure 2.
(a) Hue, Saturation and Value (HSV) image and (b) image of extracted Hue regions when a threshold value is set for Hue (H) in order to extract the red ring at the outer edge of the sign.
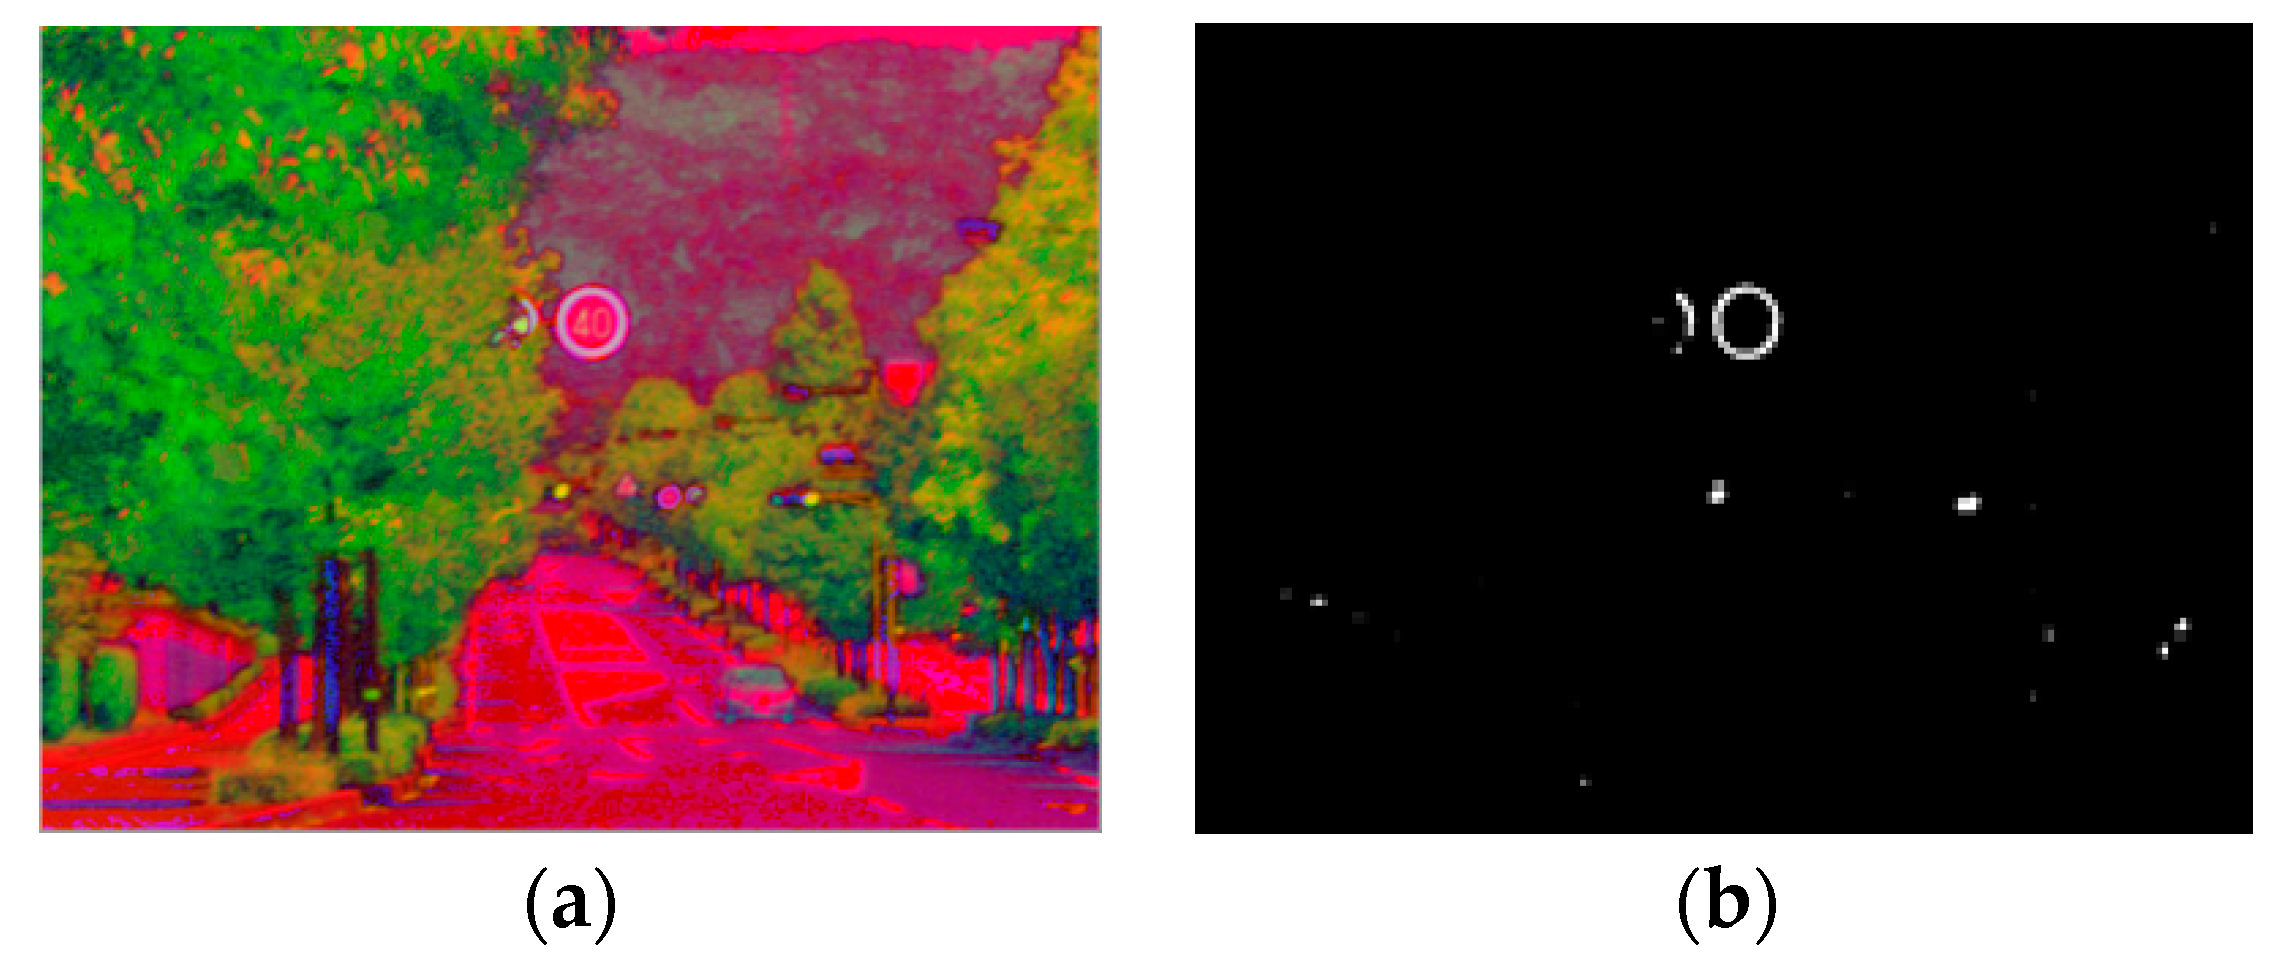
Figure 3.
Round traffic sign extracted based on the labeling process.
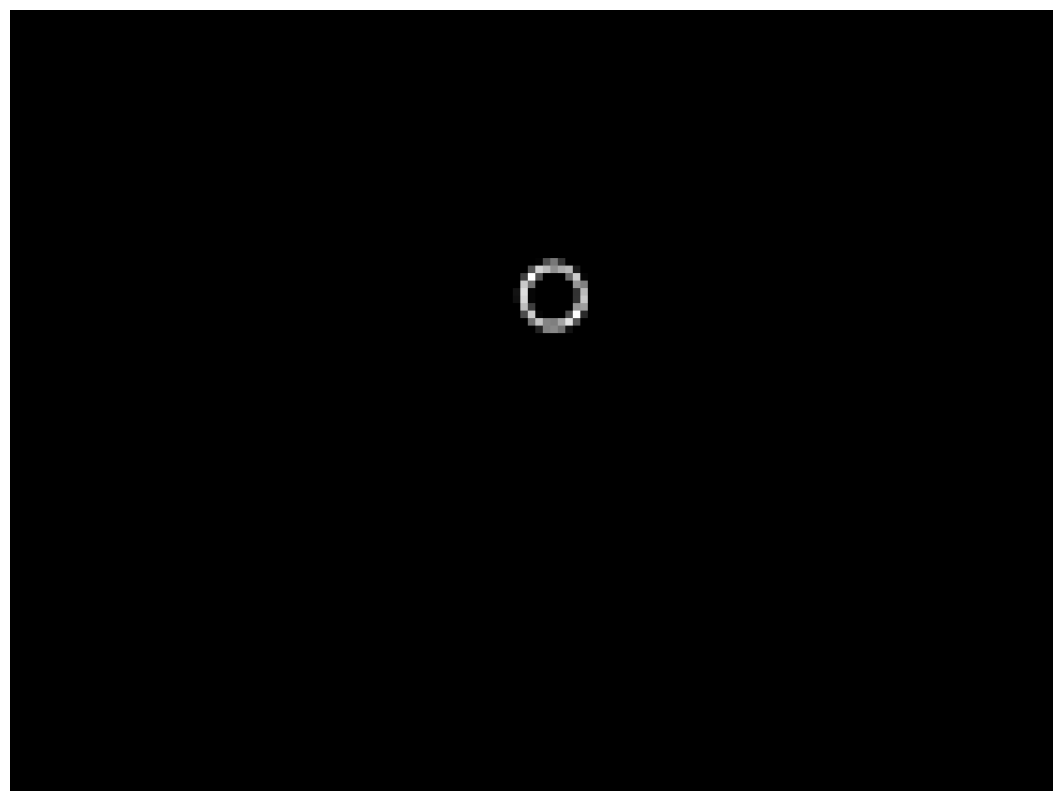
Figure 4.
Extracted speed limit. (a) RGB image of Speed-limit sign extracted from the landscape image; (b) HSV image converted from RGB image (a); (c) Binarized image of image (b) by setting the threshold for the blue.
Figure 4.
Extracted speed limit. (a) RGB image of Speed-limit sign extracted from the landscape image; (b) HSV image converted from RGB image (a); (c) Binarized image of image (b) by setting the threshold for the blue.

Figure 5.
Examples of images containing speed-limit signs (positive images) in a variety of conditions.
Figure 5.
Examples of images containing speed-limit signs (positive images) in a variety of conditions.

Figure 6.
Examples of images not containing speed-limit signs (negative images).

Figure 7.
Change in detection rate when 1000 negative images were used and the positive images were increased from 50 to 200.
Figure 7.
Change in detection rate when 1000 negative images were used and the positive images were increased from 50 to 200.

Figure 8.
Changes in false detection rate when 200 positive images are used and the number of negative images is increased from 100 to 7000.
Figure 8.
Changes in false detection rate when 200 positive images are used and the number of negative images is increased from 100 to 7000.

Figure 9.
Examples of detected and undetected speed-limit signs. Images (a–g) show cases when the speed-limit sign was detected. Images (h) and (i) show cases when the speed-limit sign was not detected.
Figure 9.
Examples of detected and undetected speed-limit signs. Images (a–g) show cases when the speed-limit sign was detected. Images (h) and (i) show cases when the speed-limit sign was not detected.
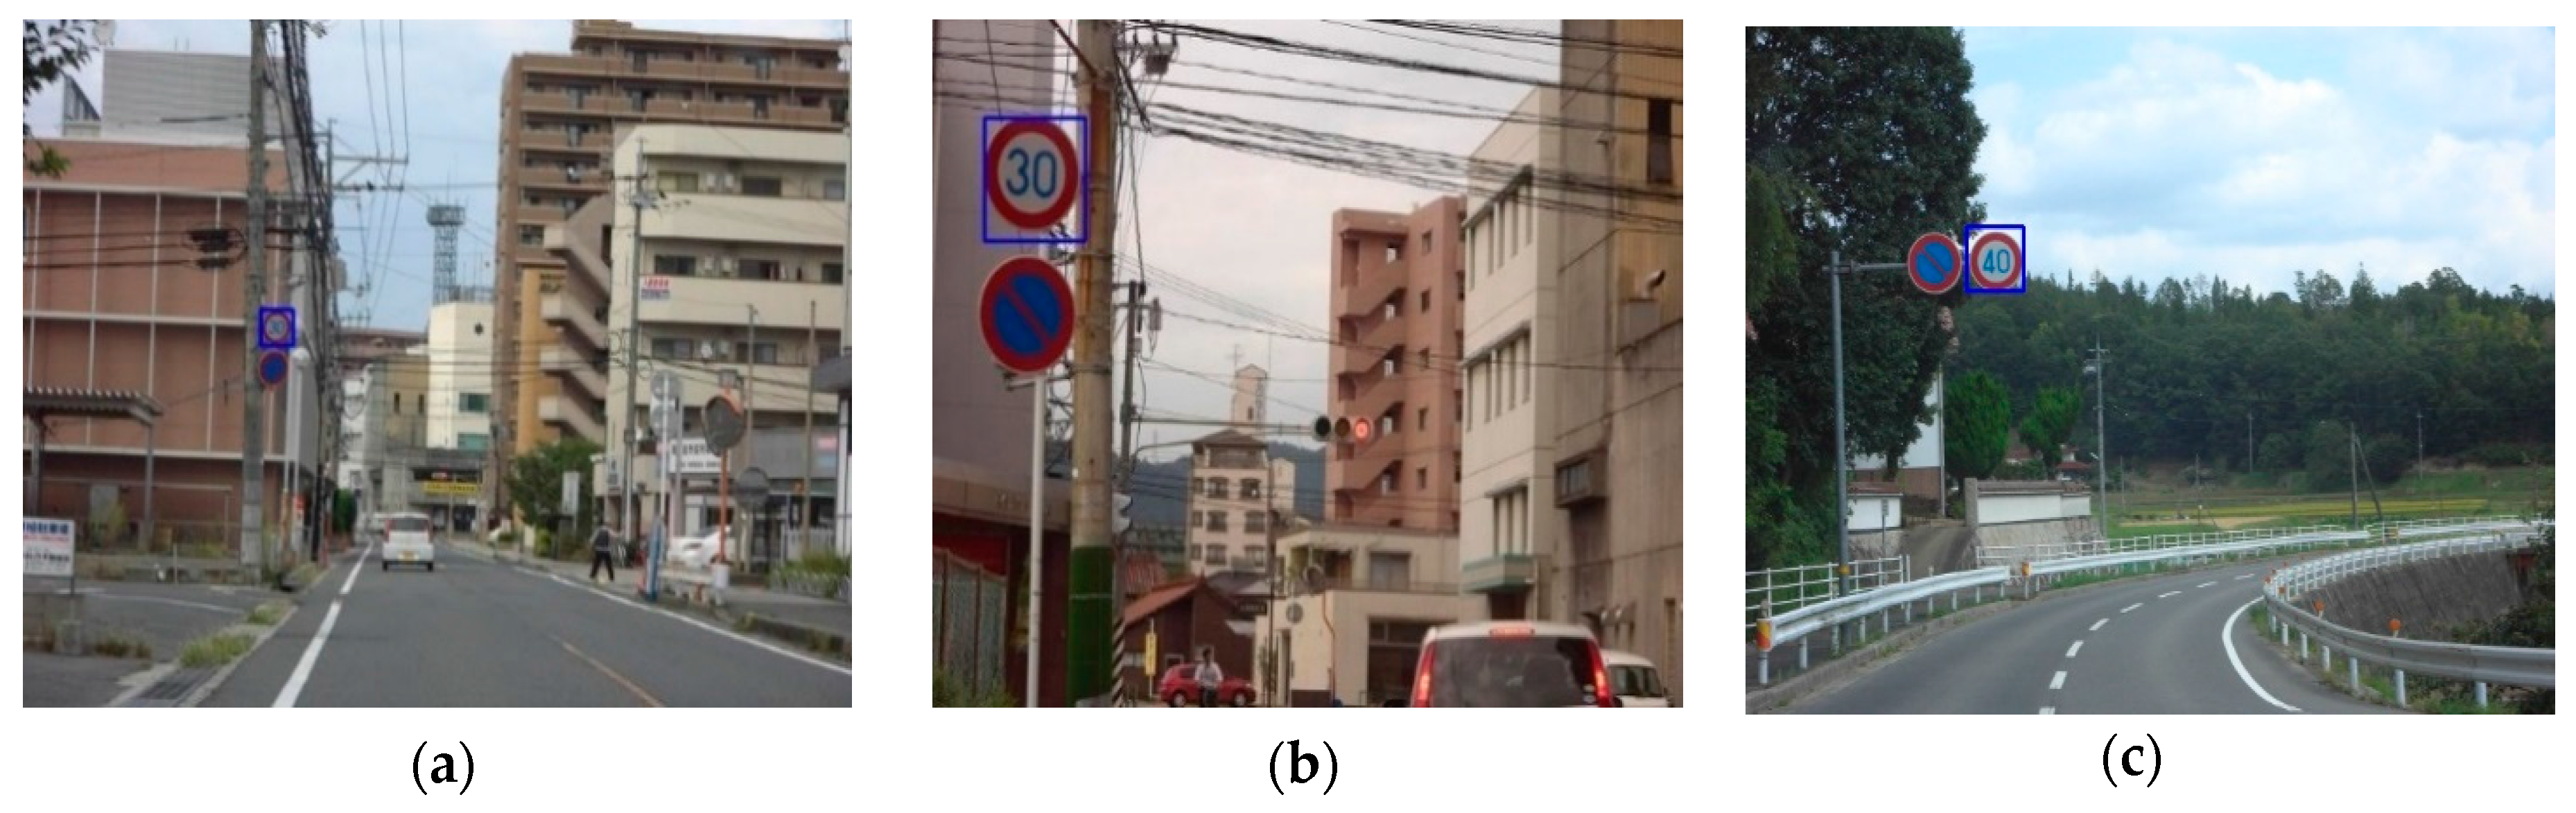
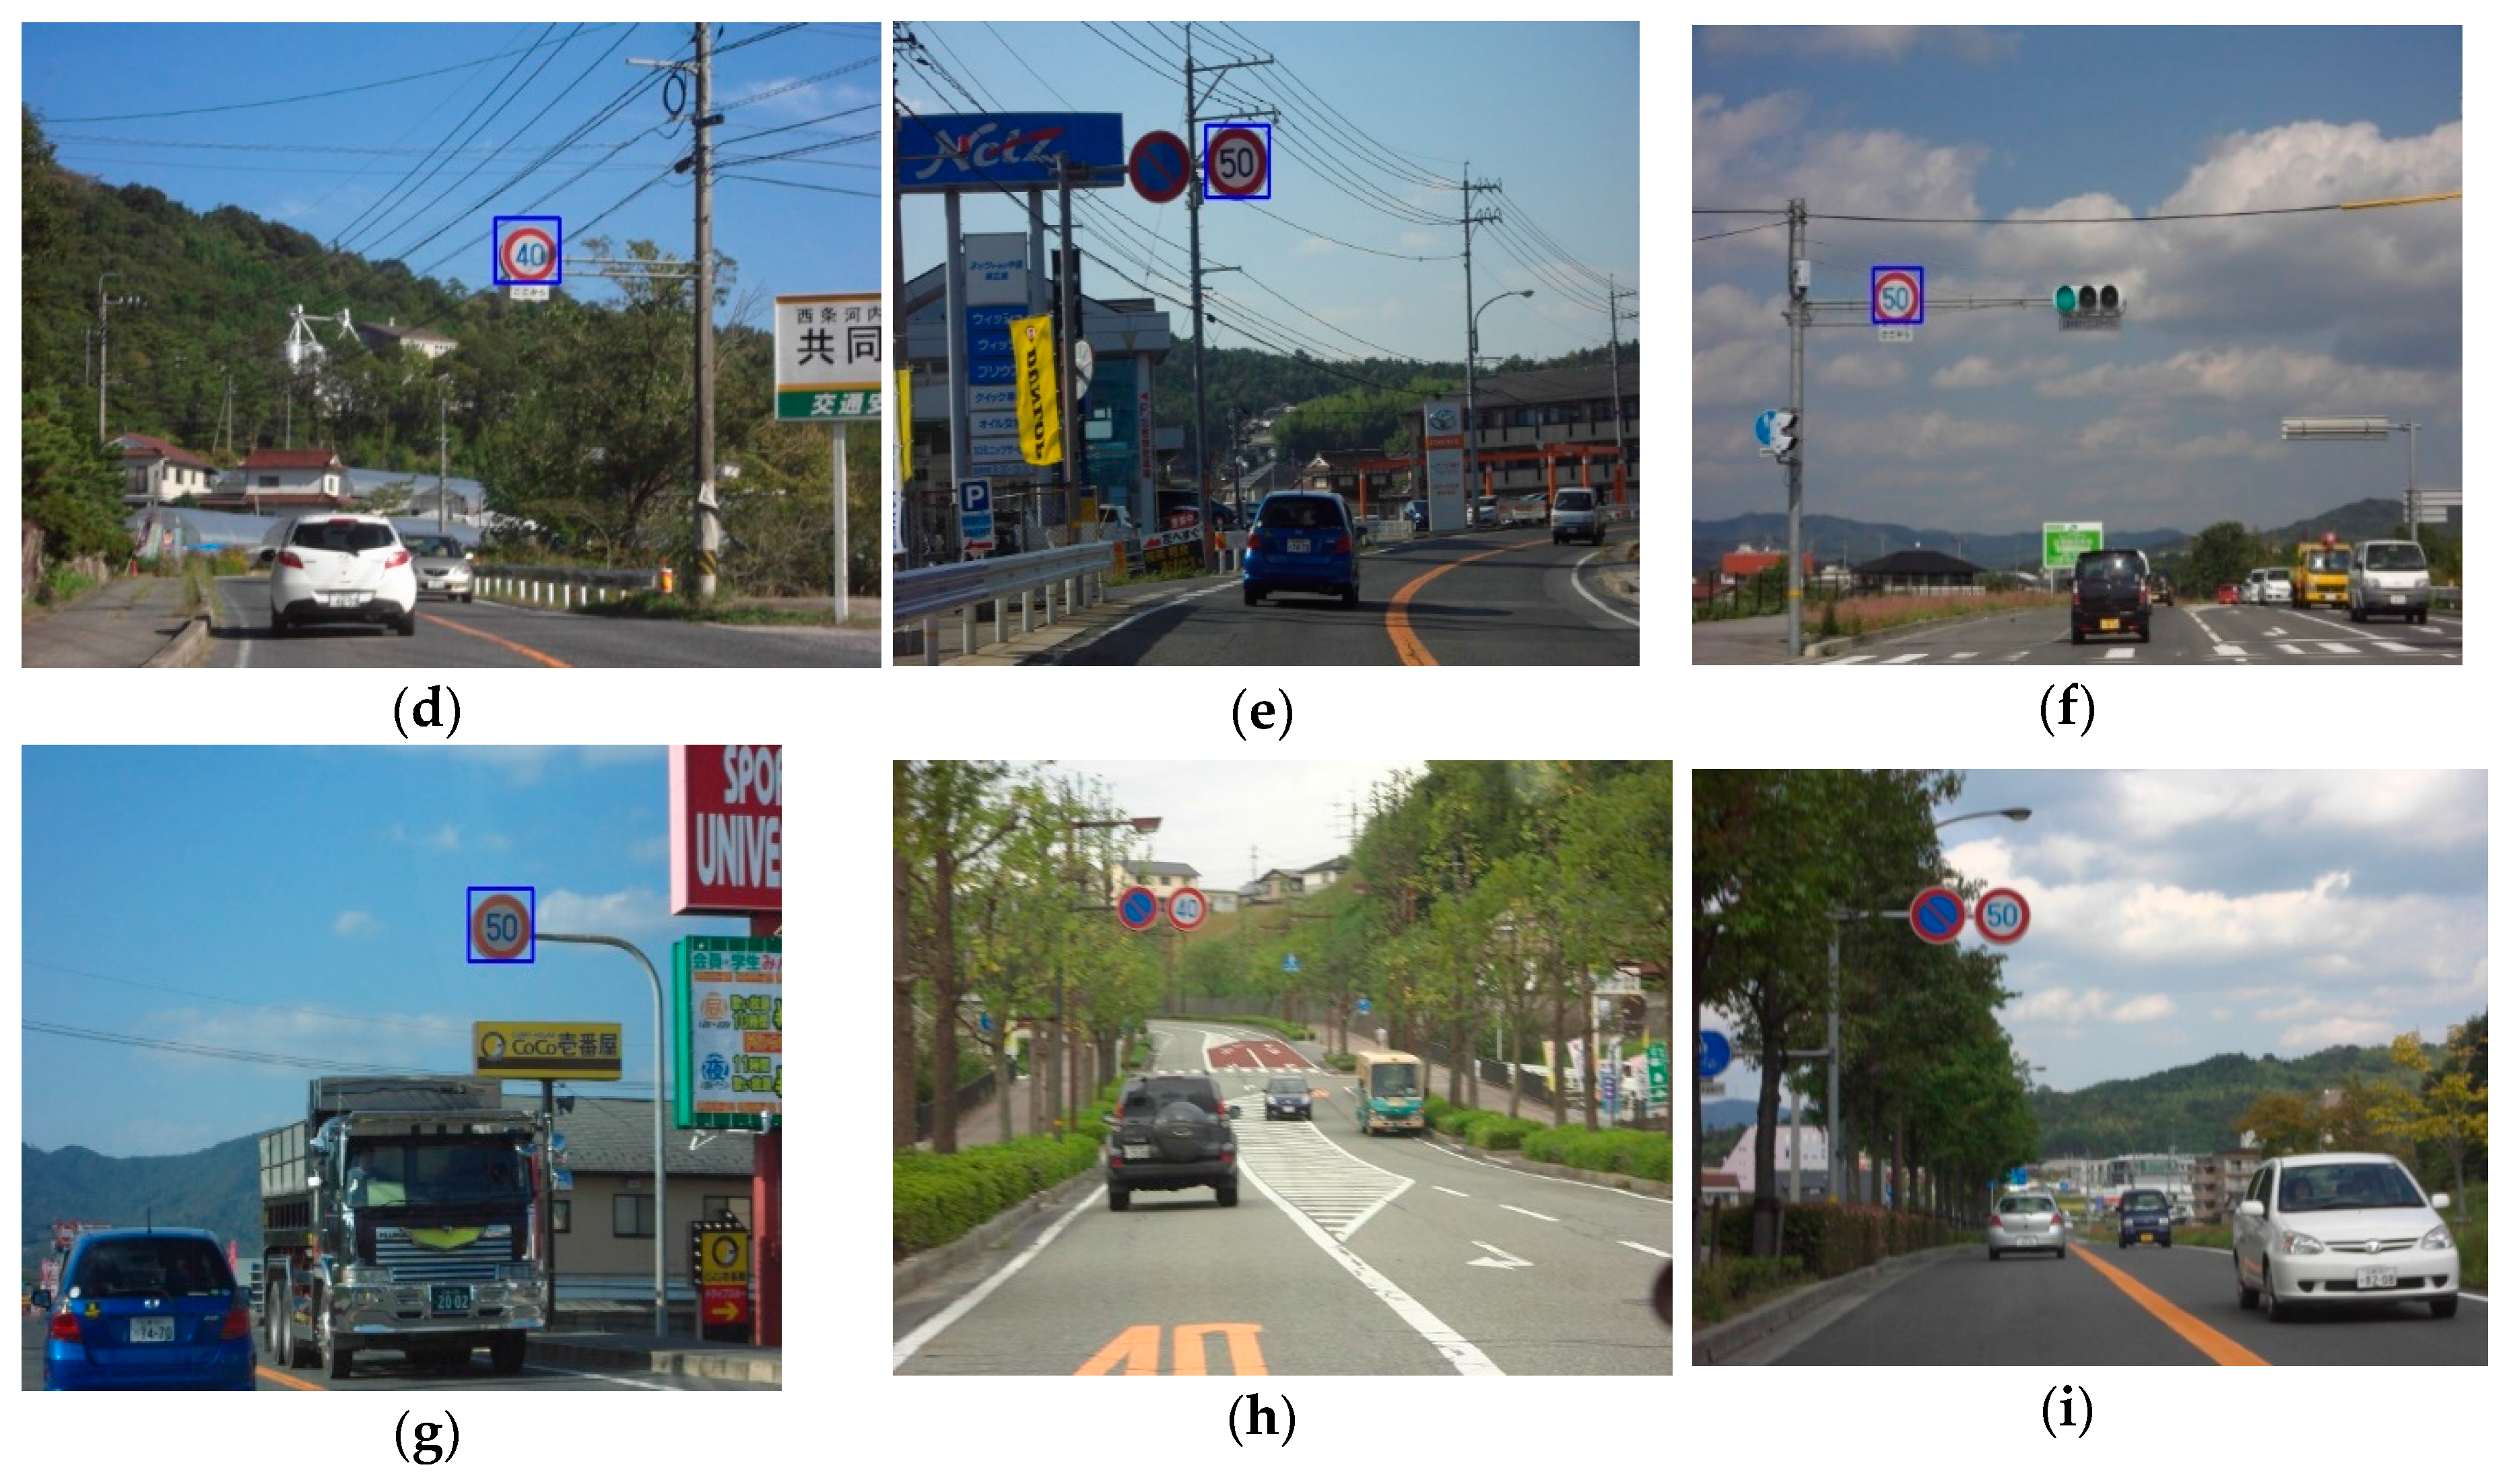
Figure 10.
Training images for Number 0, 3, 4, 5 cut out from the images acquired from the camera.
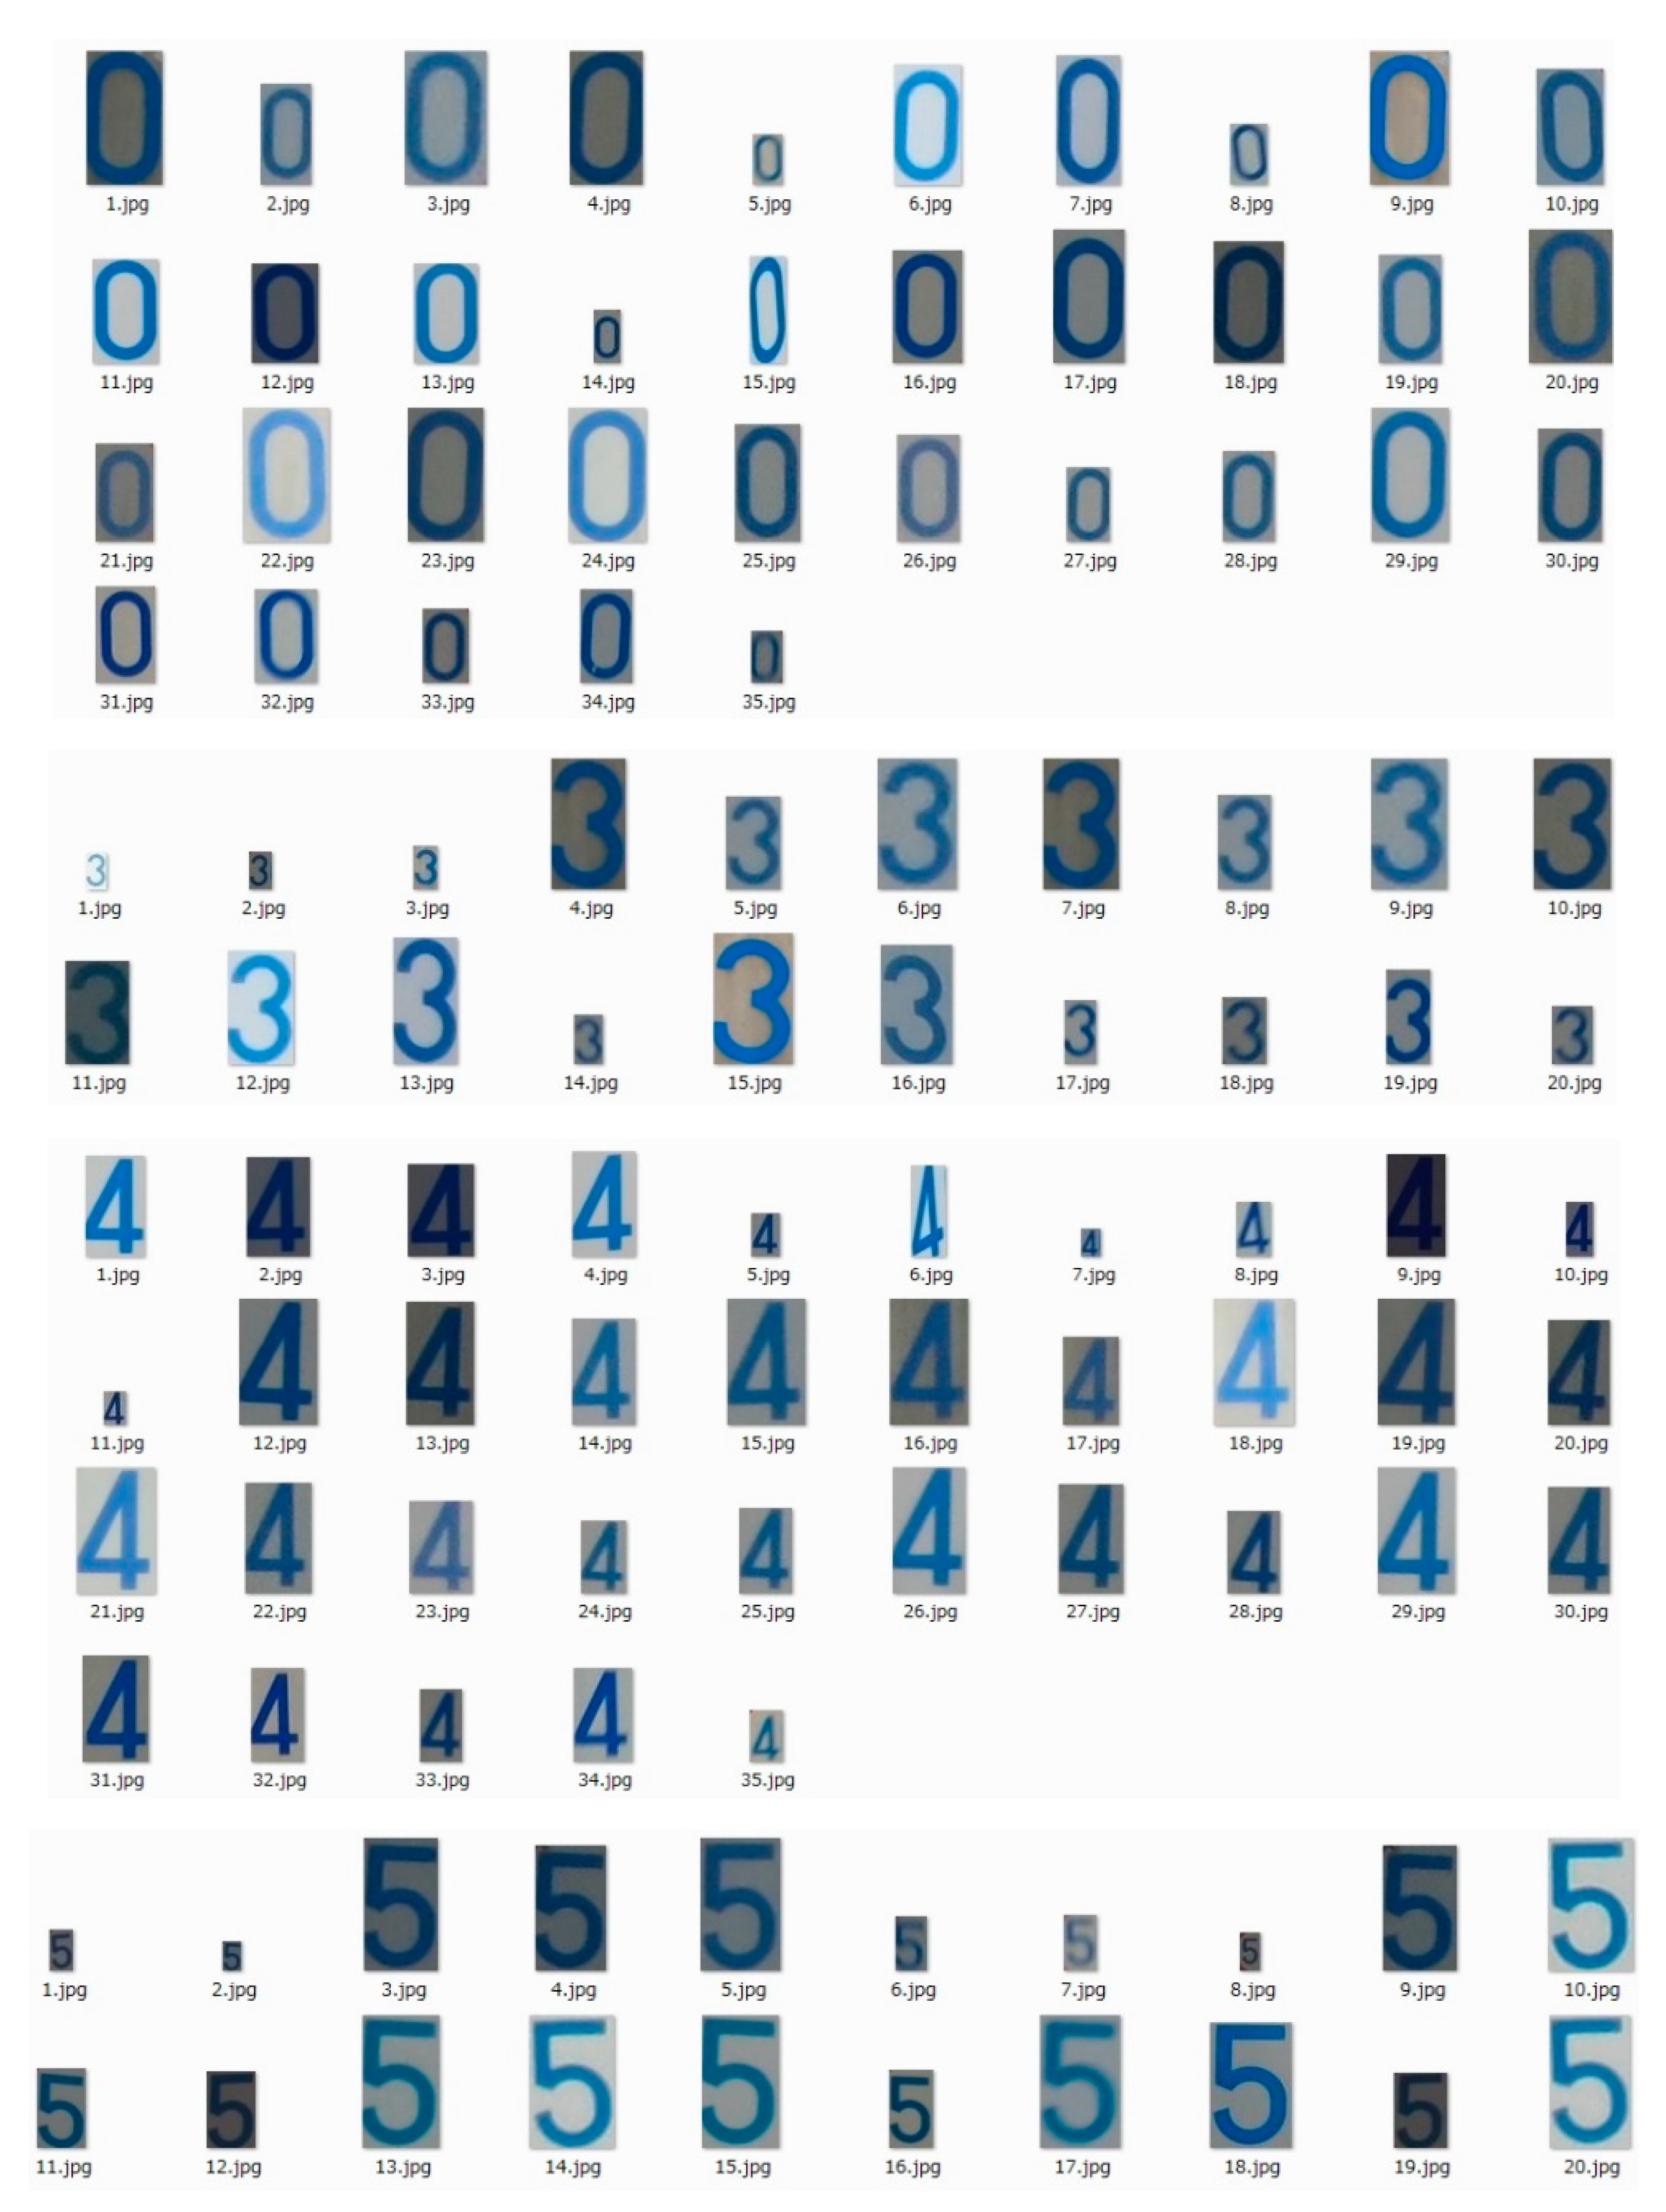
Figure 11.
Examples of three feature quantities for each number 0, 3, 4, and 5.
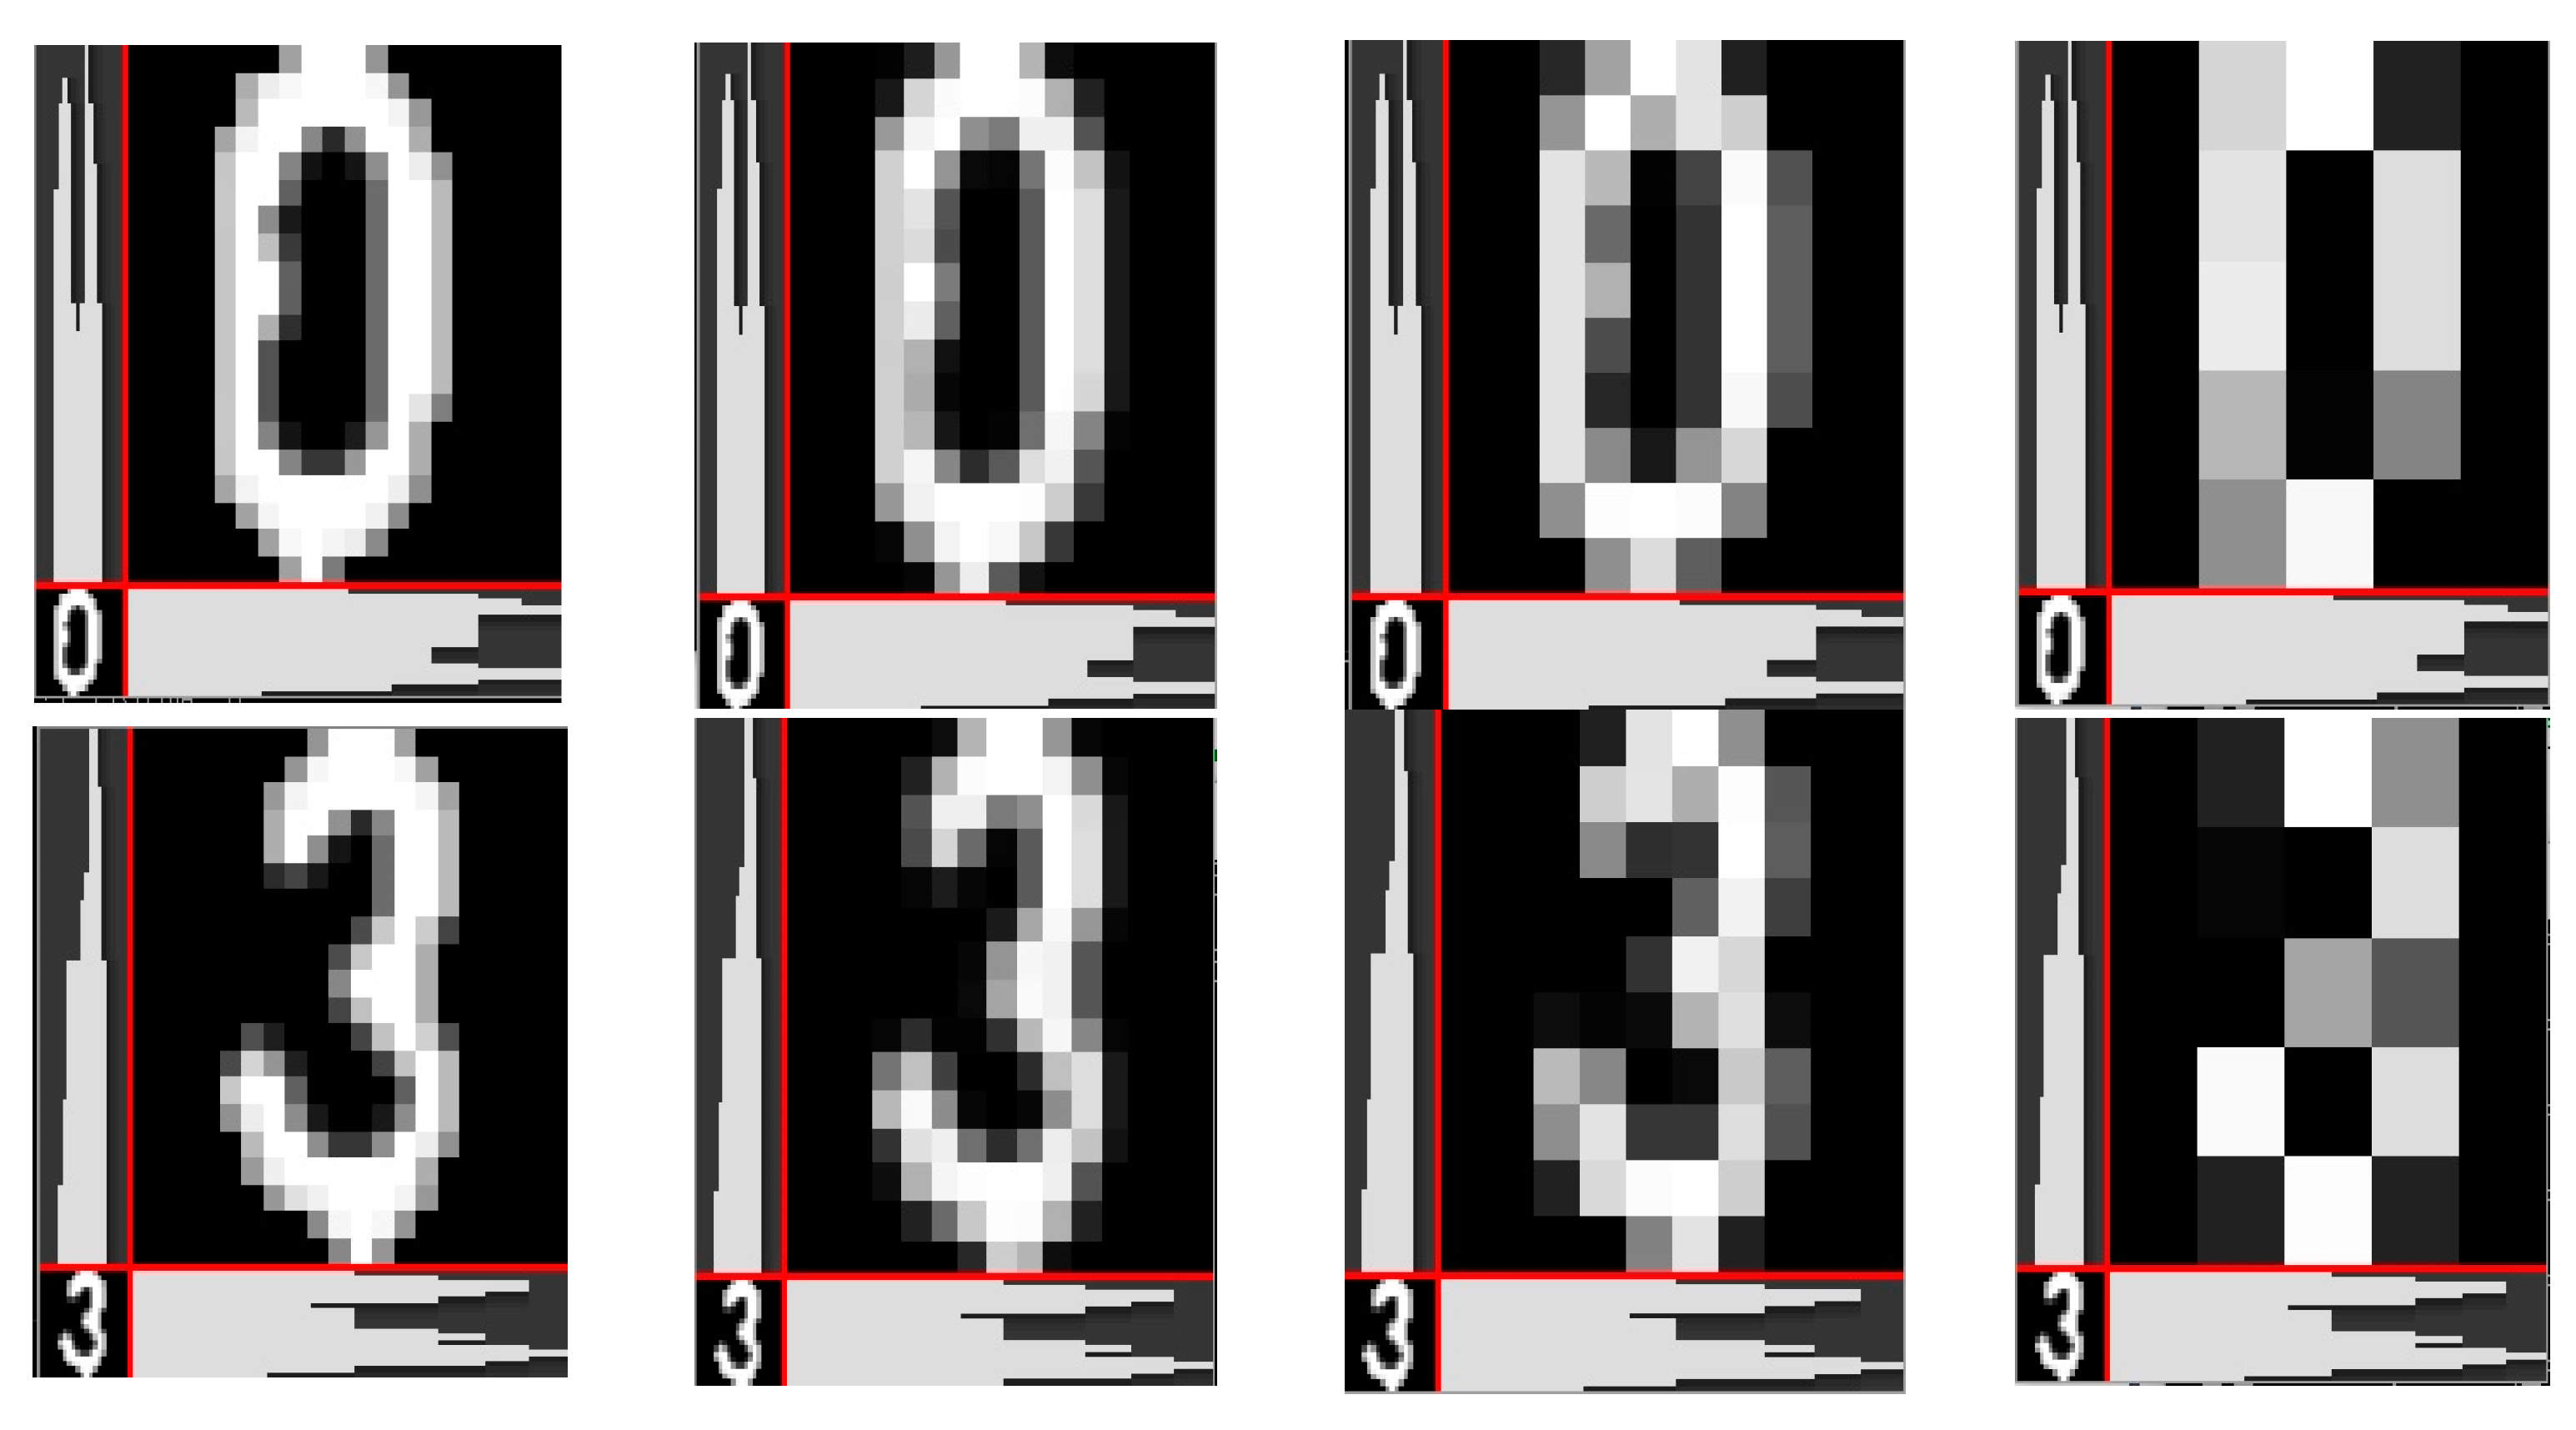
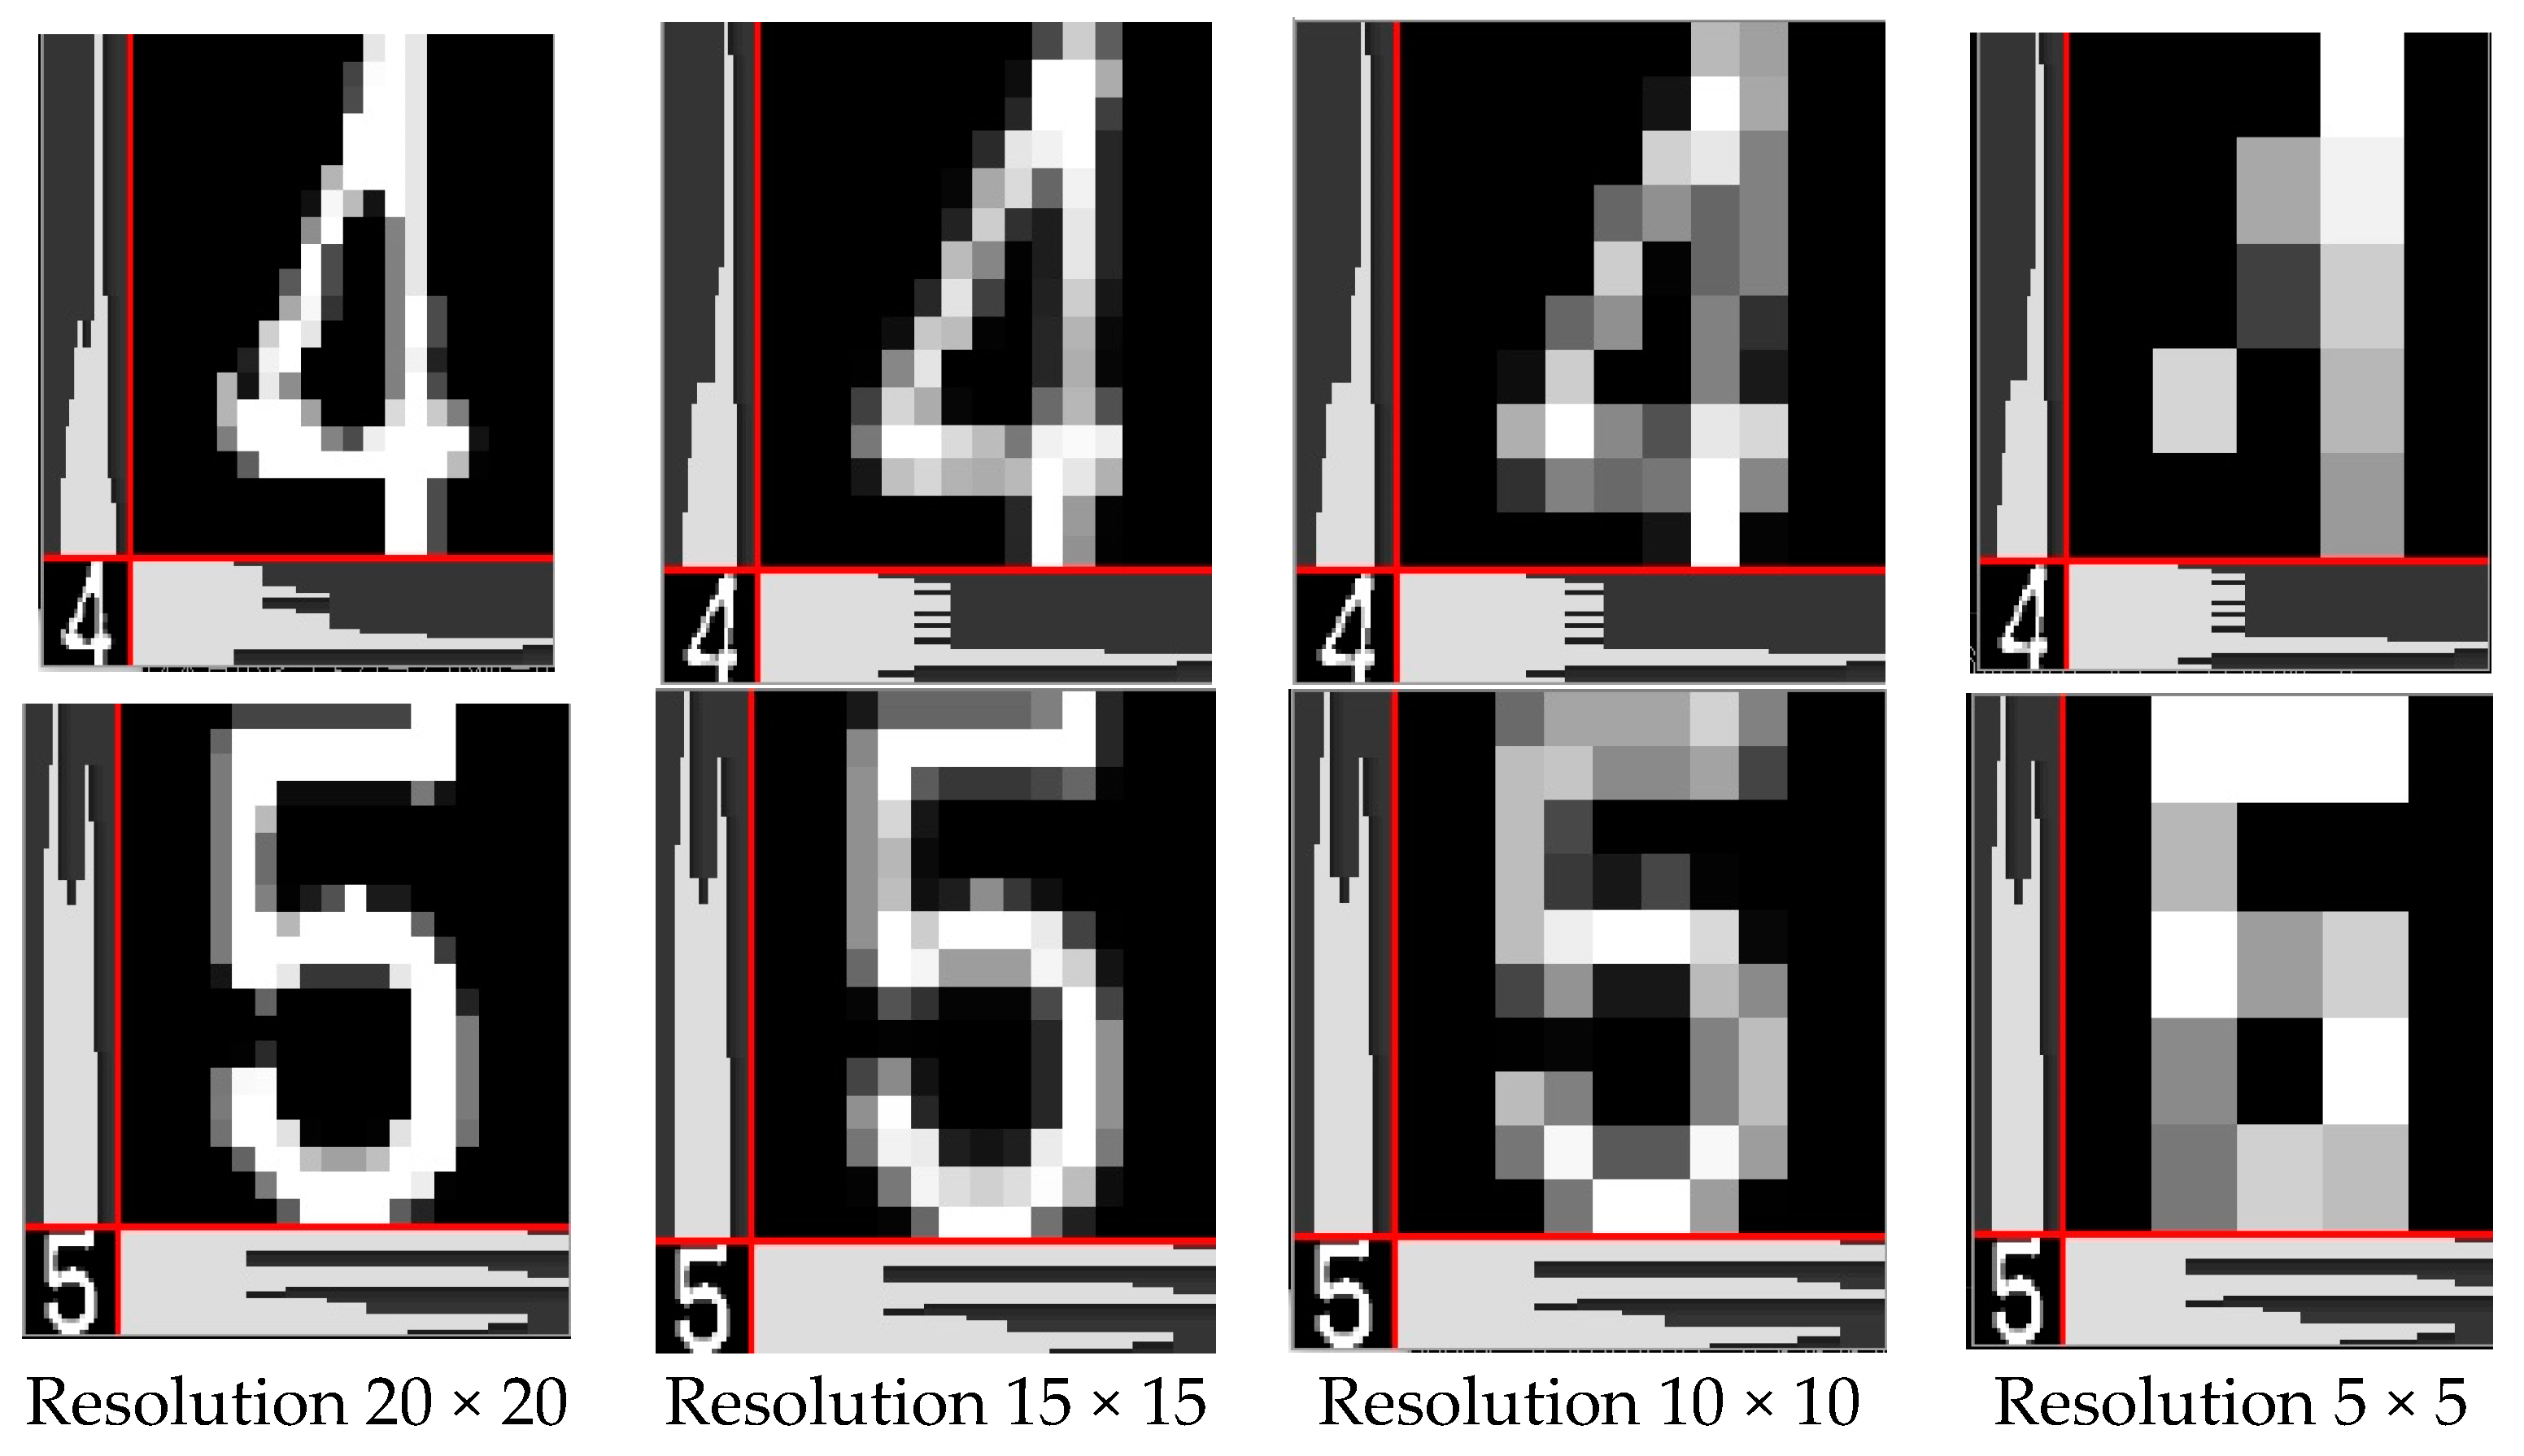
Figure 12.
When two numbers are combined and detected as a single area.
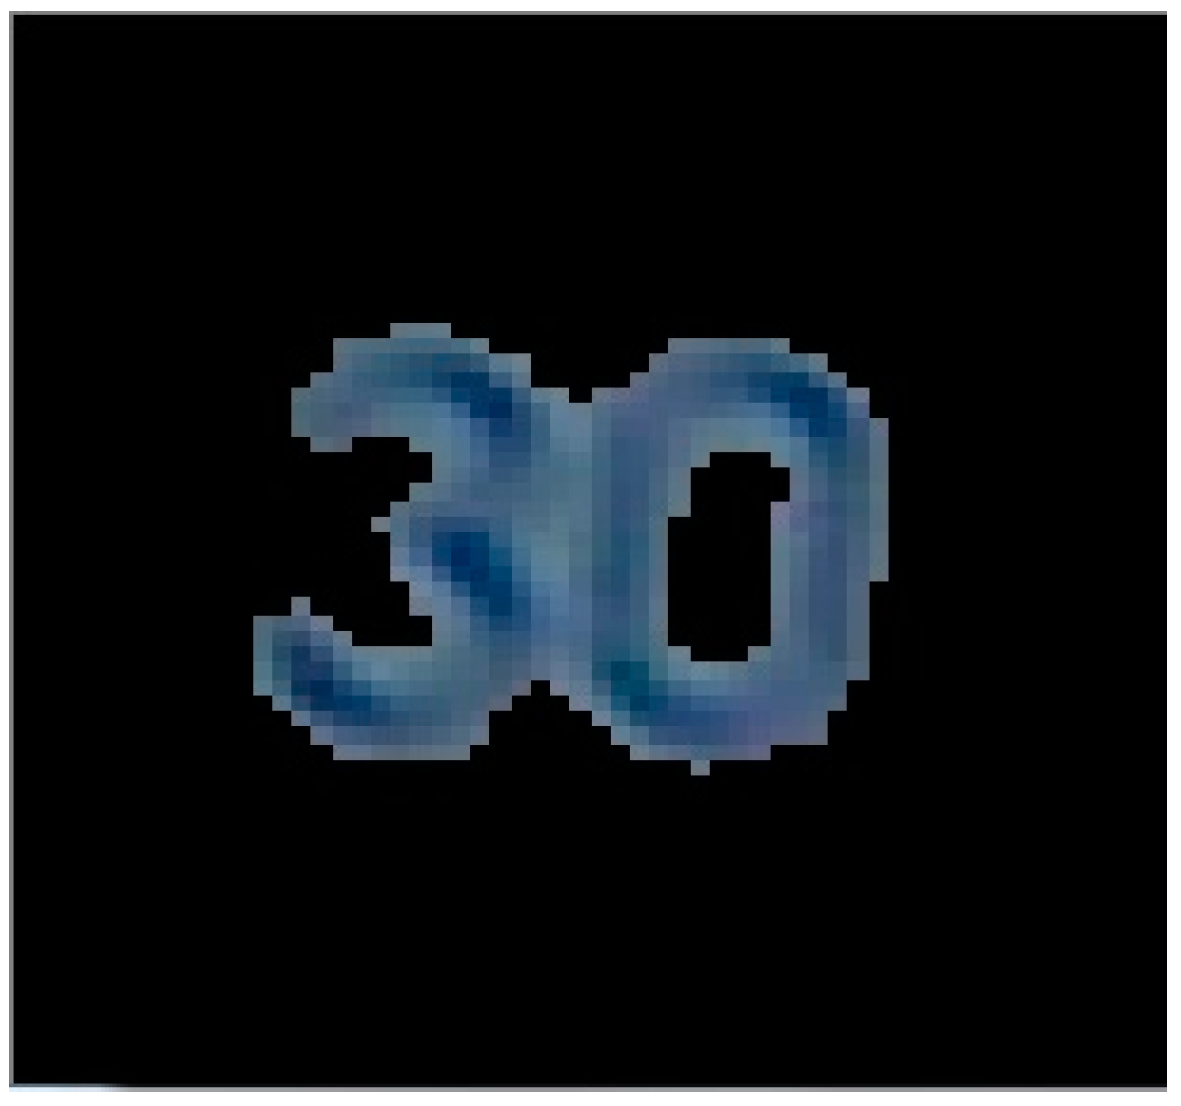
Figure 13.
Detailed description of the processing used to extract the numbers on speed-limit signs. (a) Image following application of a variable average binarization processing to the grayscale image of the detected speed-limit sign; (b) Image with central area of image (a) extracted and black/white reversed; (c) Contours image of boundary between white areas and black areas in image (b); (d) Number candidate area obtained from mask processing of image (b) using a mask image obtained by using contours image (c); (e) Image following application of contour processing after dilation-erosion (closing) processing of the number candidate areas to eliminate small black areas inside the white objects; (f) Number image delivered to recognition processing when the contour area satisfies the aspect ratio of numbers.
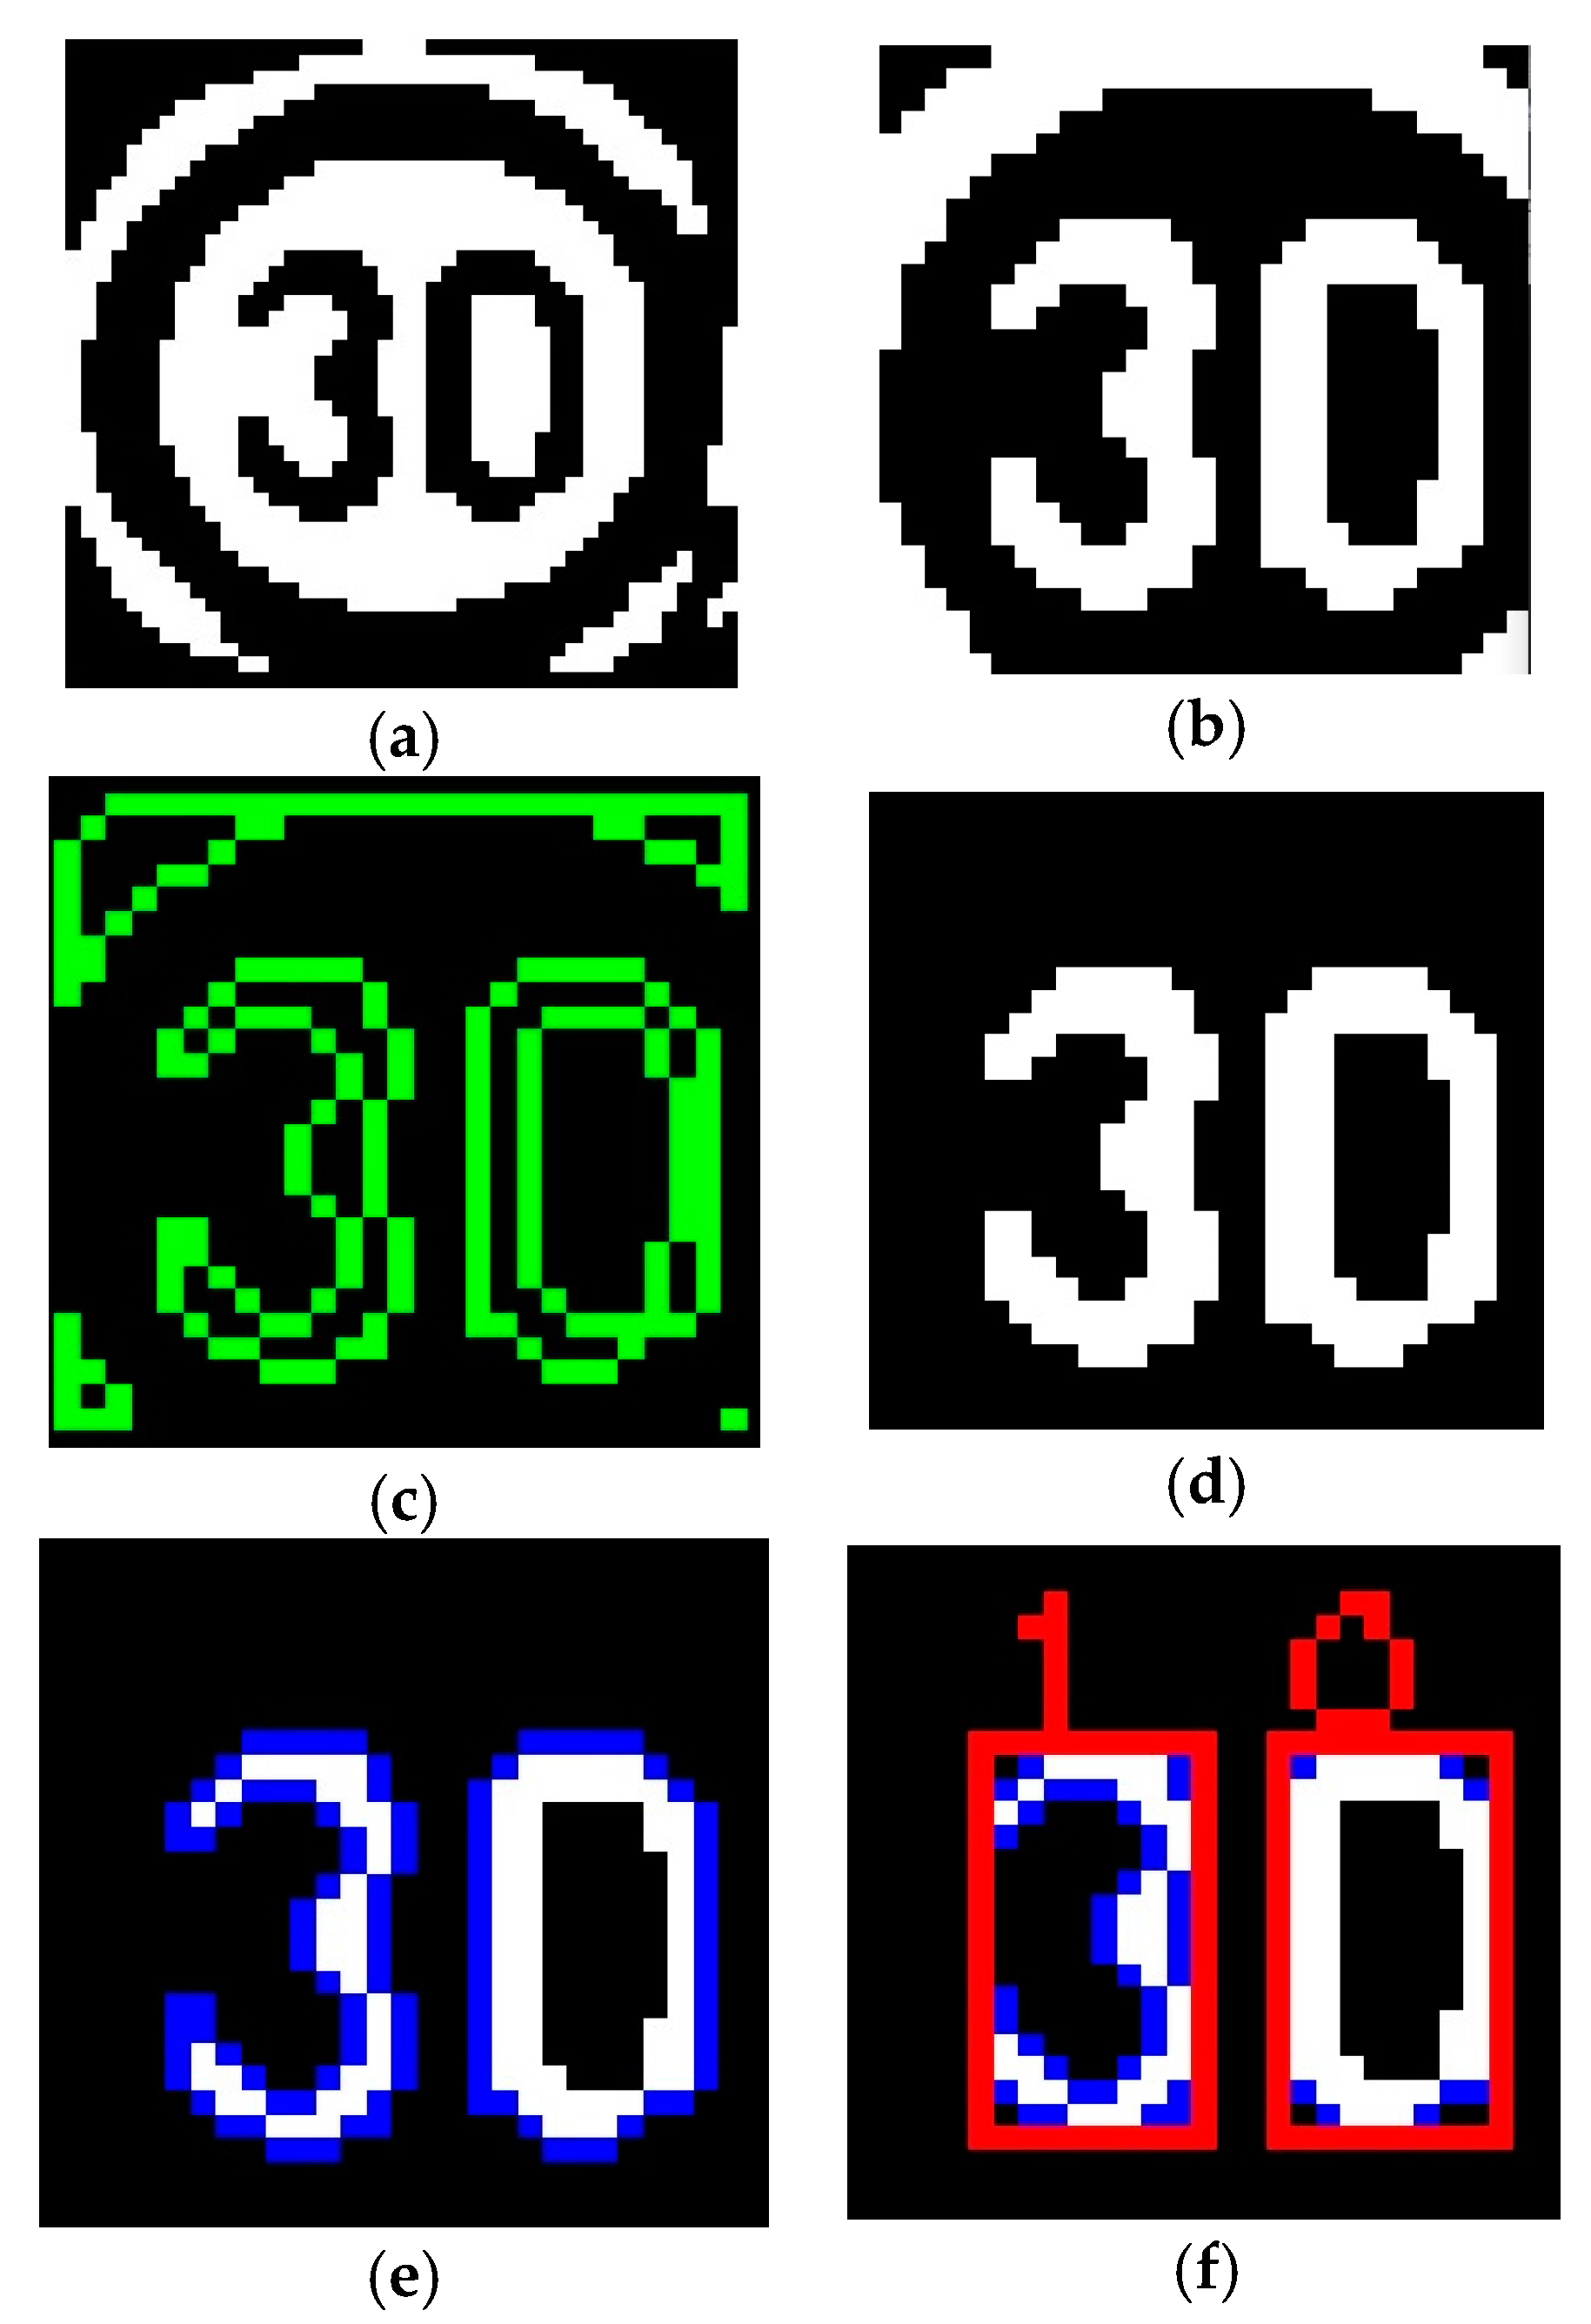
Figure 14.
Three feature quantities at each resolution for the extracted number 30.

Figure 15.
Three feature quantities at each resolution for the extracted number 40.
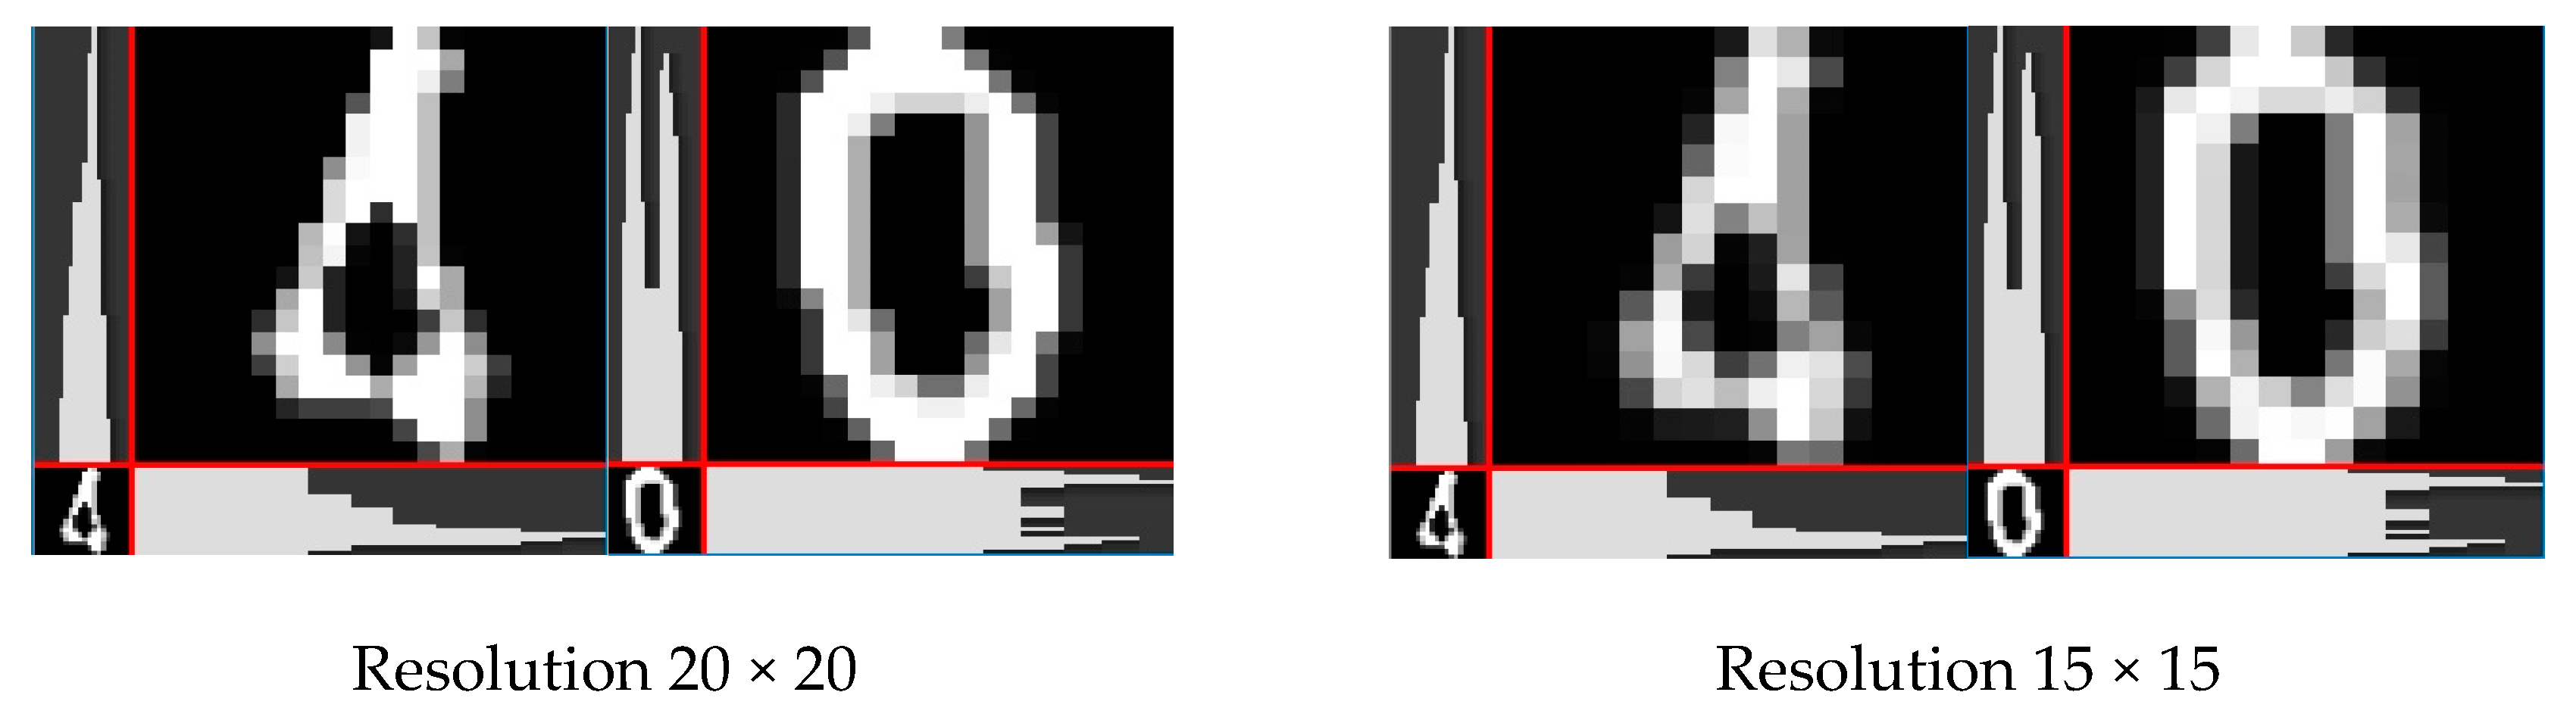
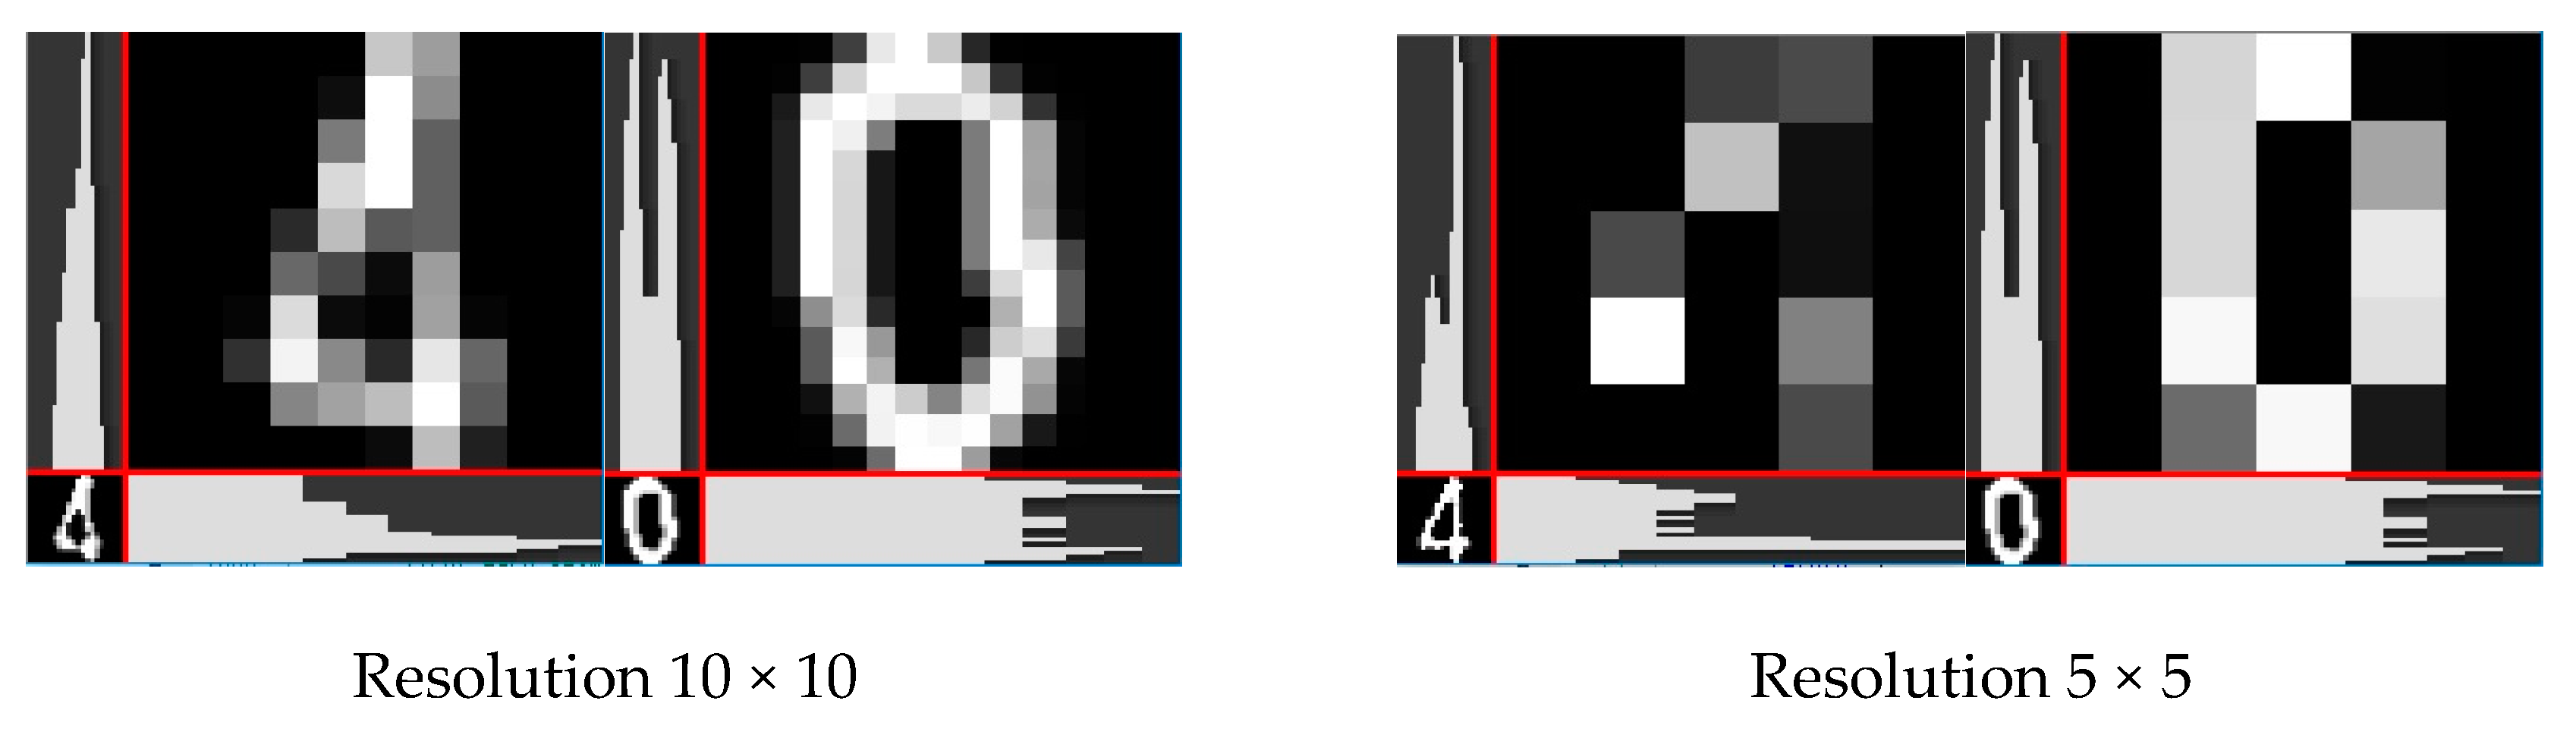
Figure 16.
Three feature quantities at each resolution for the extracted number 50.

Figure 17.
Example of recognition results for 30 km speed-limit sign.
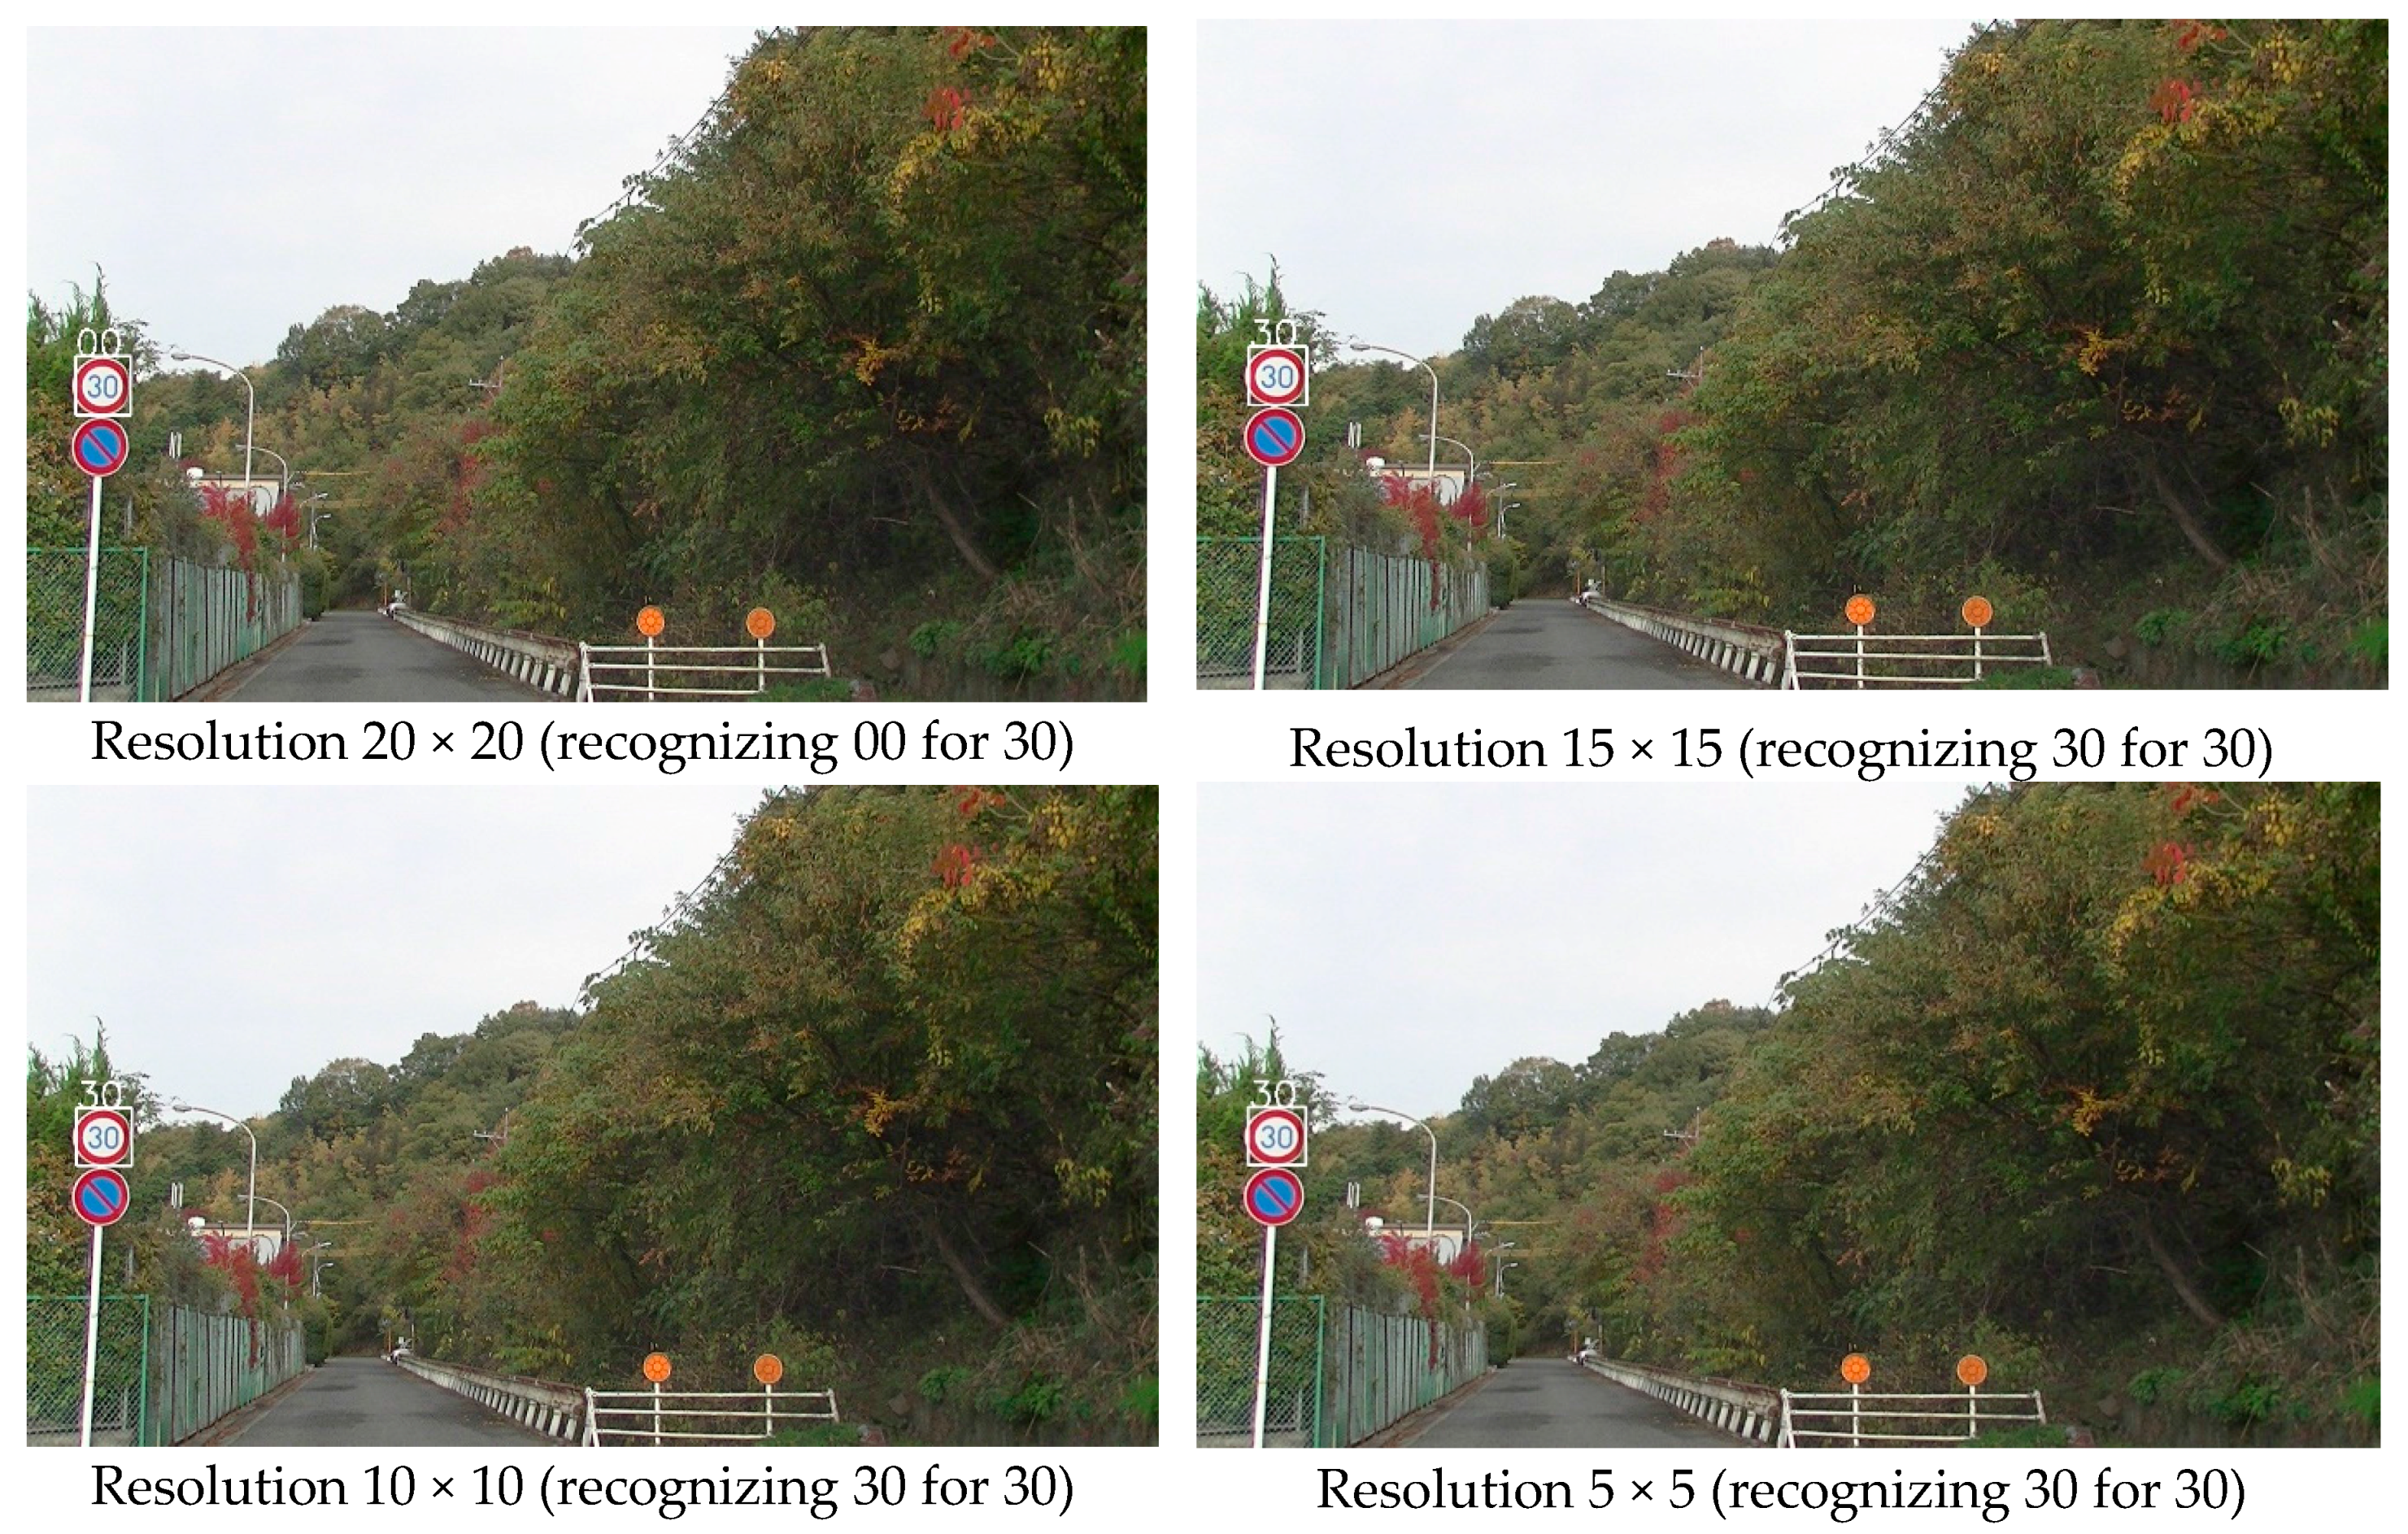
Figure 18.
Example of recognition results for 40 km speed-limit sign.
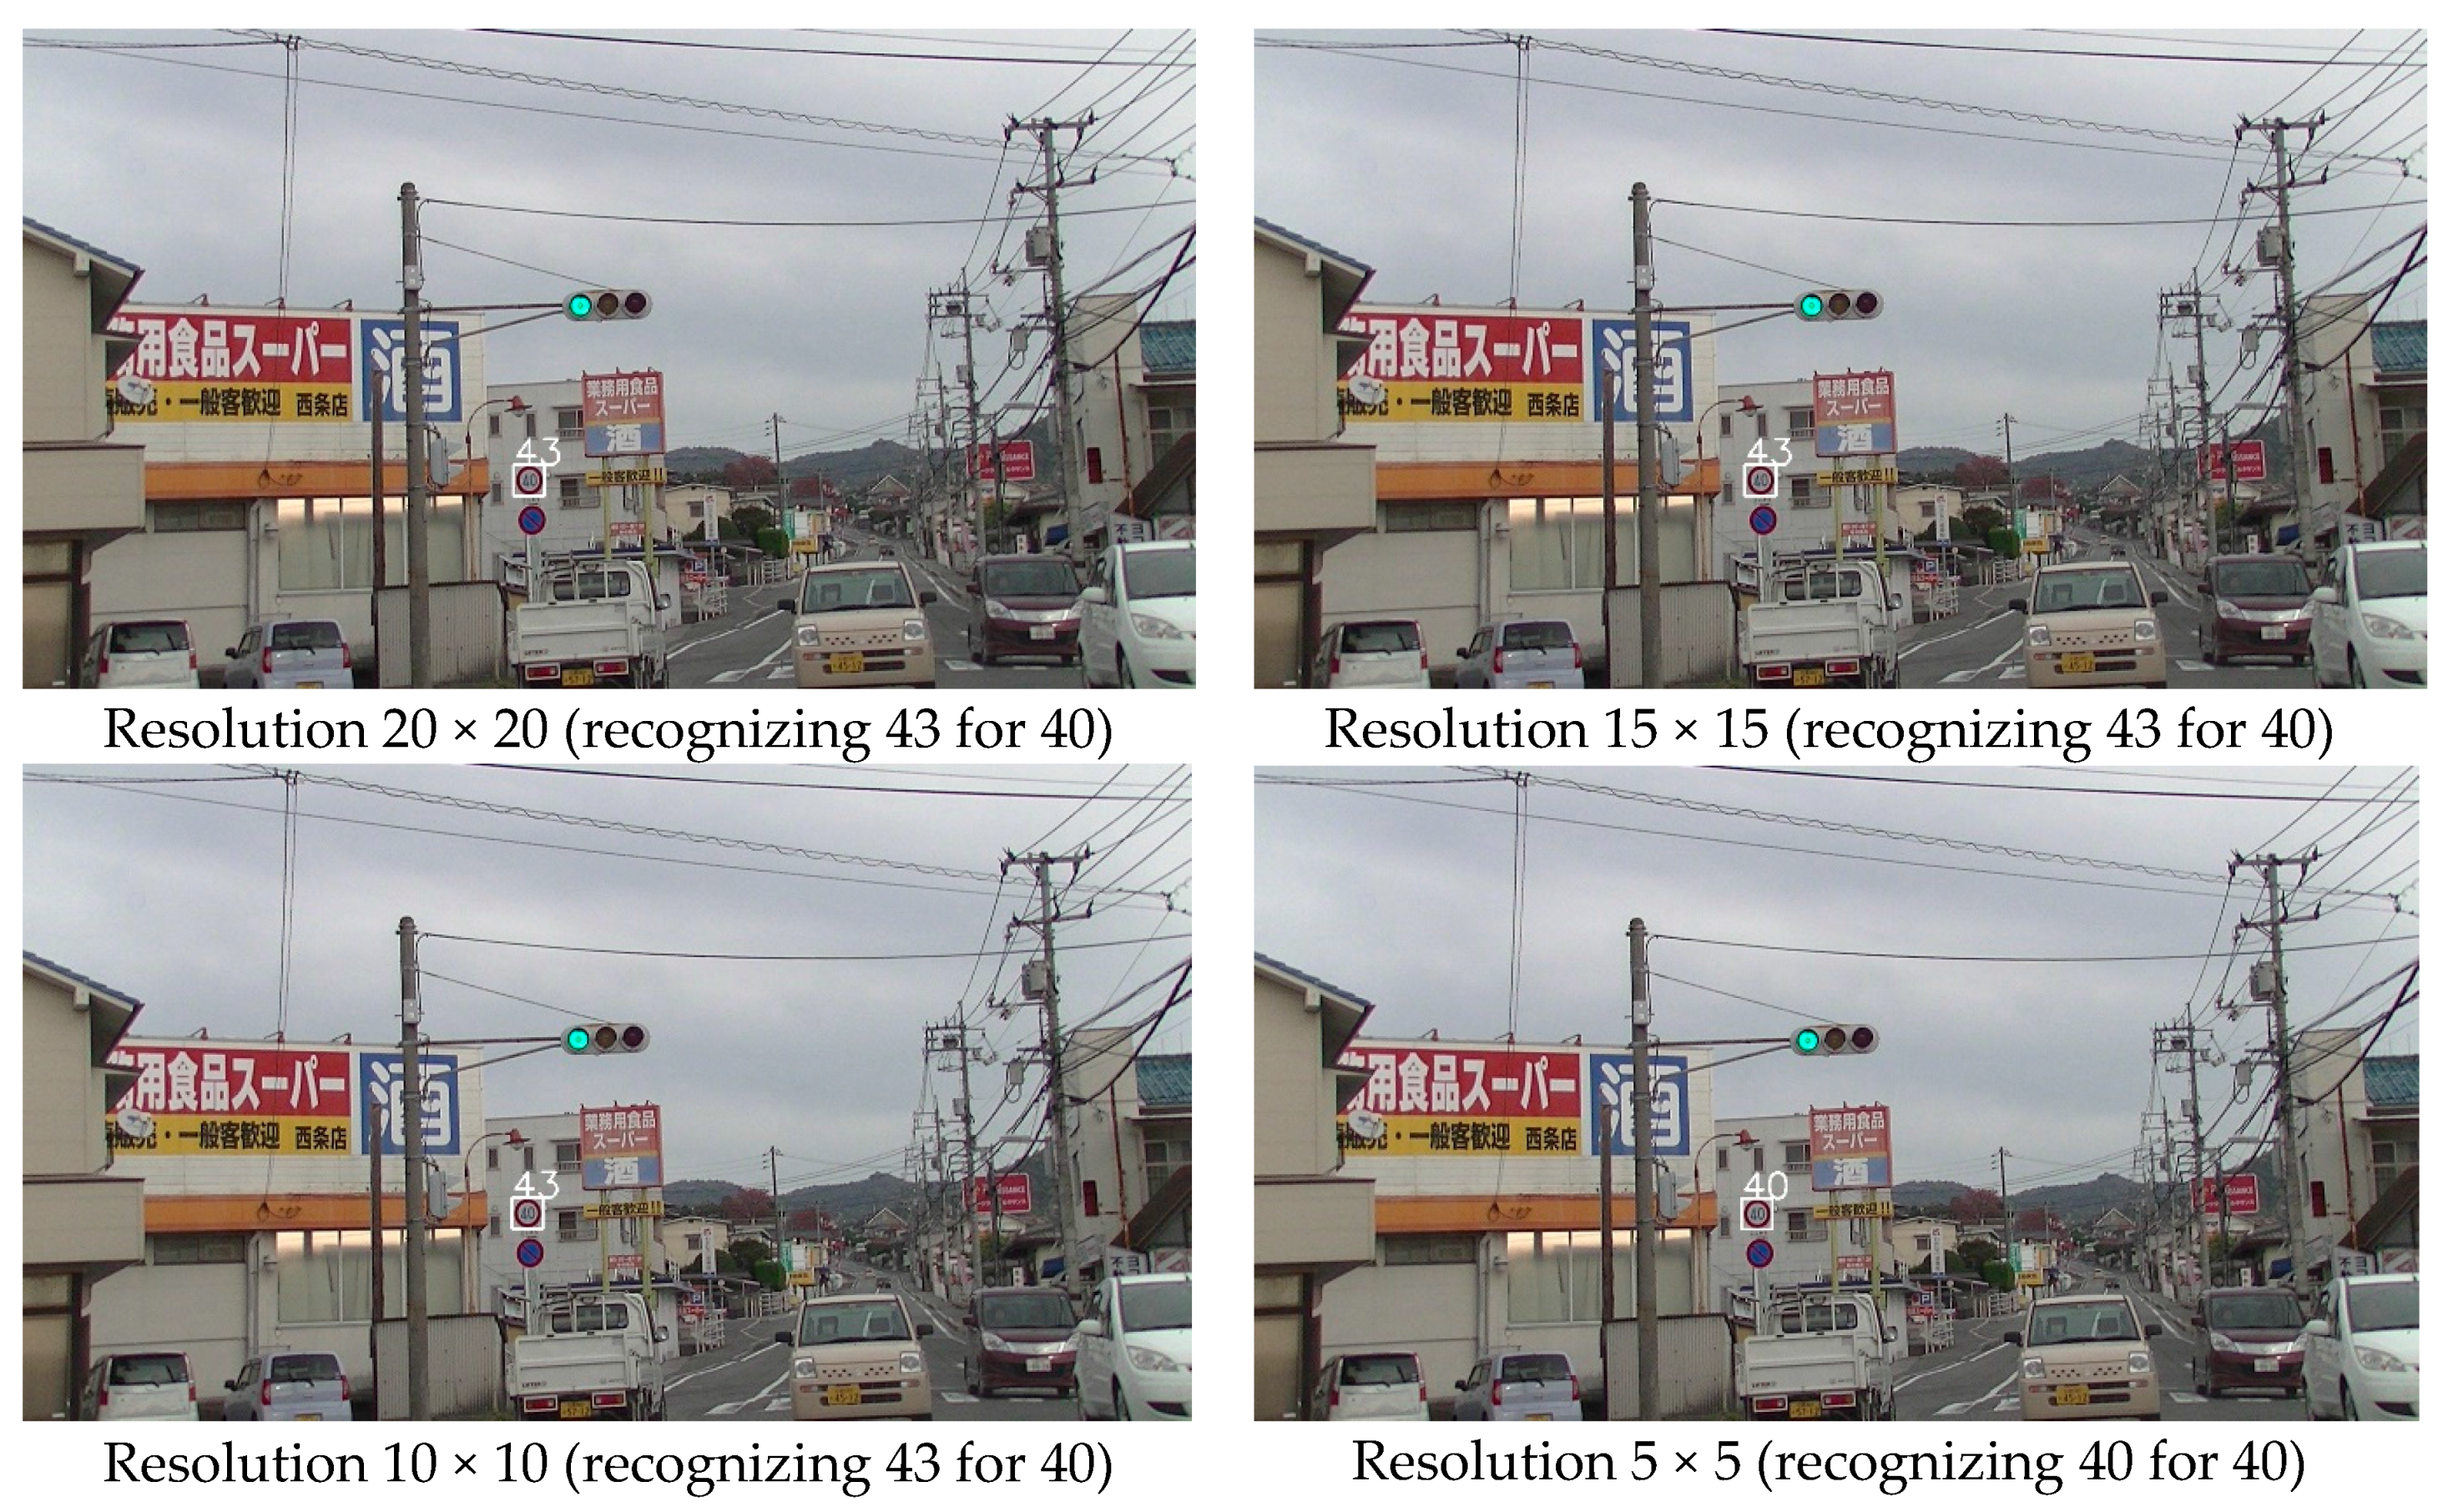
Figure 19.
Example of recognition results for 50 km speed-limit sign.

Figure 20.
Effects of different lower limit values for Saturation and Value on the recognition results.
Figure 20.
Effects of different lower limit values for Saturation and Value on the recognition results.

Table 1.
Recognition results for the four kinds of resolution.
| Resolution (Pixels) | Recognition (%) |
|---|---|
| 5 × 5 | 97.1 |
| 10 × 10 | 77.8 |
| 15 × 15 | 85.6 |
| 20 × 20 | 77.8 |
© 2017 by the author. Licensee MDPI, Basel, Switzerland. This article is an open access article distributed under the terms and conditions of the Creative Commons Attribution (CC BY) license (http://creativecommons.org/licenses/by/4.0/).
Share and Cite
MDPI and ACS Style
Miyata, S. Automatic Recognition of Speed Limits on Speed-Limit Signs by Using Machine Learning. J. Imaging 2017, 3, 25. https://doi.org/10.3390/jimaging3030025
AMA Style
Miyata S. Automatic Recognition of Speed Limits on Speed-Limit Signs by Using Machine Learning. Journal of Imaging. 2017; 3(3):25. https://doi.org/10.3390/jimaging3030025
Chicago/Turabian StyleMiyata, Shigeharu. 2017. "Automatic Recognition of Speed Limits on Speed-Limit Signs by Using Machine Learning" Journal of Imaging 3, no. 3: 25. https://doi.org/10.3390/jimaging3030025
Note that from the first issue of 2016, this journal uses article numbers instead of page numbers. See further details here.