Monitoring of the Nirano Mud Volcanoes Regional Natural Reserve (North Italy) using Unmanned Aerial Vehicles and Terrestrial Laser Scanning

La Venta Esplorazioni Geografiche, Via Priamo Tron 35/F, 31100 Treviso, Italy
J. Imaging 2017, 3(4), 42; https://doi.org/10.3390/jimaging3040042
Submission received: 27 June 2017
/
Revised: 5 September 2017
/
Accepted: 13 September 2017
/
Published: 30 September 2017
(This article belongs to the Special Issue 3D Imaging)
Abstract
:In the last years, measurement instruments and techniques for three-dimensional mapping as Terrestrial Laser Scanning (TLS) and photogrammetry from Unmanned Aerial Vehicles (UAV) are being increasingly used to monitor topographic changes on particular geological features such as volcanic areas. In addition, topographic instruments such as Total Station Theodolite (TST) and GPS receivers can be used to obtain precise elevation and coordinate position data measuring fixed points both inside and outside the area interested by volcanic activity. In this study, the integration of these instruments has helped to obtain several types of data to monitor both the variations in heights of extrusive edifices within the mud volcano field of the Nirano Regional Natural Reserve (Northern Italy), as well as to study the mechanism of micro-fracturing and the evolution of mud flows and volcanic cones with very high accuracy by 3D point clouds surface analysis and digitization. The large amount of data detected were also analysed to derive morphological information about mud-cracks and surface roughness. This contribution is focused on methods and analysis performed using measurement instruments as TLS and UAV to study and monitoring the main volcanic complexes of the Nirano Natural Reserve as part of a research project, which also involves other studies addressing gases and acoustic measurements, mineralogical and paleontological analysis, organized by the University of Modena and Reggio Emilia in collaboration with the Municipality of Fiorano Modenese.
1. Introduction on Mud Volcanoes
The term mud volcanoes refers to geological structures of emissions of saline water associated with hydrocarbon liquids, mud and gases. These volcanic buildings are generally cone-shaped, and result from the expulsion of muddy material, rock fragments, gases and fluids [1,2]. Methane is the most frequent among the gases, normally connected to the formation and accumulation of hydrocarbons at greater depths.
The main morphological elements of mud volcanoes are craters, mud flows, irregularly shaped terrains characterized by mud-cracking and mud pool (or salses).
These volcanic structures can reach up to a few kilometers in diameter and several hundred meters in height and are present in many areas of our planet that are generally characterized by rapid sedimentation rates, compressive tectonic activity, subduction zones and other tectonic settings that can lead to the formation of preferential structural pathways discharging fluids and gases accumulated in deep reservoirs. Anticlines are geological structures where mud volcanoes are commonly found, and are perturbed by earthquakes as they amplify the seismic wave’s propagation [3].
This type of volcanic edifices show different cyclic phases of activity, including catastrophic events and periods of relative quiescence characterized by moderate activity. The frequency of eruptions seems essentially controlled by local pressure regime within the fluid reservoirs, while the eruptive mechanism seem strongly dependent on the state of consolidation and gas content.
Mud volcanoes have been documented in many parts of the world (Azerbaijan, Georgia, Romania, Italy, Iraq, Iran, Myanmar, New Zeland, India, Malasya, Gulf of Mexico, Venezuela, Trinidad, Colombia and many others).
This study has considered the Italian Northern Appennines mud volcanoes area of the Nirano Regional Natural Reserve in Emilia Romagna (Italy).
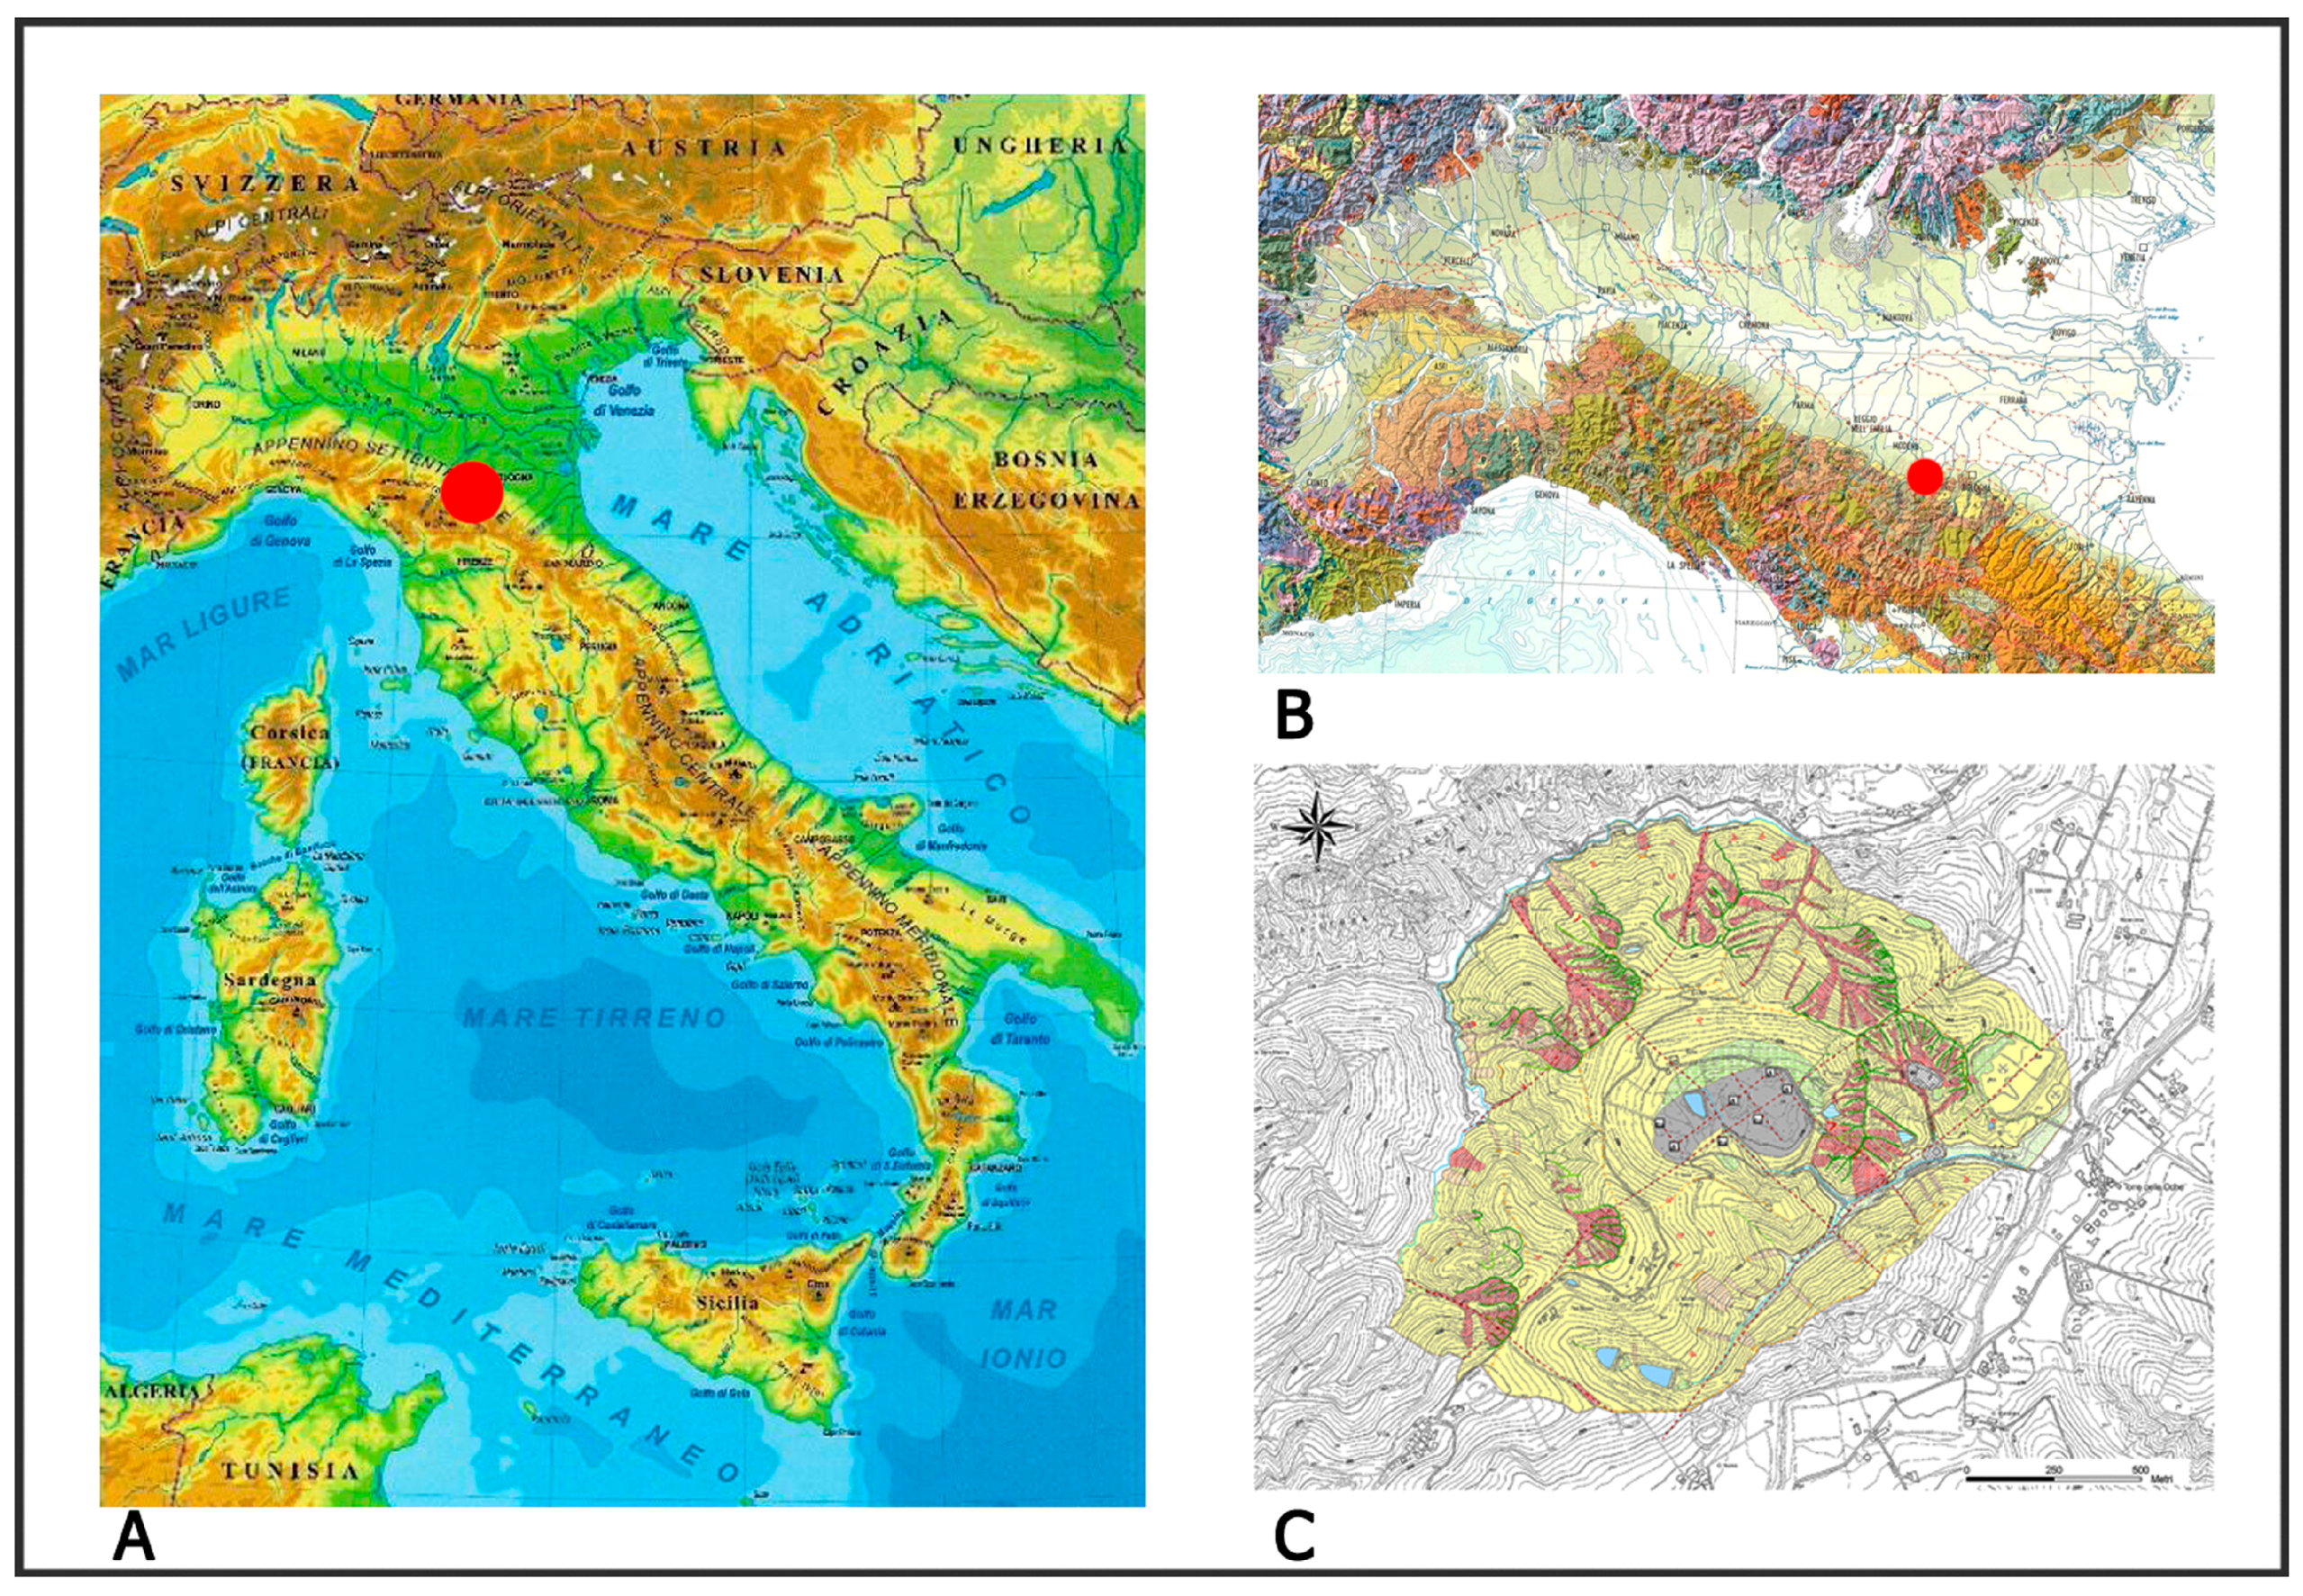
Salse di Nirano Natural Regional Reserve is located in the Western sector of the Modena Apennines margin (Figure 1), which belongs to the Northern Apennines and is characterized by compressive structures which correspond to the “Emilia Folds”.
The main geological structure of the Italian Northern Apennines consists of stacked NE-verging tectonic units resulted mainly from the Oligocene-Miocene continental collision between the Western margin of the Adria microplate and the Corsica-Sardinia block. The Ligurian Units are the uppermost of the thrust wedge.
The Northern Apennines are characterized by faults and folds affecting the Quaternary sediments. In the sector of Emilia Romagna Region where the Natural Reserve of Nirano is located, the current tectonic activity is shown by earthquakes that are mostly concentrated both along the foothills and in the Po Plain.
Lower Pliocene to the Lower Pleistocene sediments mostly outcrop in the Southern part of the Modena Apennines margin, where these deposits are generally transgressive on the Jurassic-Eocene Ligurian Units (made up of deep-sea sediments followed by thick sequences of calcareous or turbidites sediments), while to the North they are covered by alluvial deposits of the Middle-Upper Pleistocene.
The substratun of the Nirano mud volcano field area is referable to the Argille Azzure Formation, which overlies the underlying Eocene-Miocene, Epi-Ligurian and Cretaceous Ligurian Units.
The territory of the Natural Reserve covers a total area of about 200 ha [4] with elevations ranging from 140 to 308 m a.s.l., while the Nirano mud volcanoes field area is formed by four main vents composed of a number of individual active cones (or gyrophons) defining structural trends oriented N55° E. The actives cones occur within an elliptical depression of about 500 m long and 350 m wide [5], whose area is about 10 ha and of its floor is incised less than 60 m and has an altitude between 200 and 220 m a.s.l. [6].
2. Materials and Methods
In this study, several measurement instruments were used to obtain different kind of data for comparison and analysis.
Total Station Theodolite (TST) and GPS receivers have been used to obtain precise elevation and coordinate position data measuring fixed points both inside and outside the area interested by volcanic activity. The used instrument is a Trimble 5603, a robotic total station with distances measurements accuracy of ±3mm on a range of 5–200 m (with or without reflector) while a triple frequency and full time RTK Leica RX1200 (Leica Geosystems, Heerbrugg, Switzerland) was utilized for the GPS measurements. Other 3D measurement tools as Terrestrial Laser Scanner (TLS) and Unmanned Aerial Vehicles (UAV) were used to get high-resolution 3D modelling of the volcanic complexes.
The laser scanner used to monitor the Nirano mud volcanoes complex is a Leica HDS7000 (Leica Geosystems, Heerbrugg, Switzerland) (Figure 2), a phase-difference scanner provided with an external camera (Canon D7000 with wide angle lens) (Nikon, Tokyo, Japan) necessary to take photographs used to colour the point clouds.
TLS offer a series of advantages with respect to the traditional survey instruments, particularly operational speed, accuracy, high number of measured points on long distances, and the possibility to use the laser reflectance value for surface analysis is very important especially for geological purposes [7]. The three volcanic complexes were scanned individually using standard settings: 12 mm resolution, time per-scan of 3:40 min, use of the external camera and 4 circular targets positioned for each scan used in order to improve scans alignment and common workflows for data preparation and analysis.
In order to monitor the three main areas of the Nirano mud volcanoes through TLS, two different campaigns were carried out (the first in June 2015, the second in May 2016), performing a total of 41 scans and 328 photographs (8 from each scan position) for the first, while 39 scans and 312 photographs were performed for the second campaign.
The integration of different measurement systems have helped to obtain several types of data to monitor both the variations in height of the volcanic areas considered on a large scale, such as the study of the mechanism of micro-fracturing and the evolution of mud flows with very high details by point clouds surface analysis.
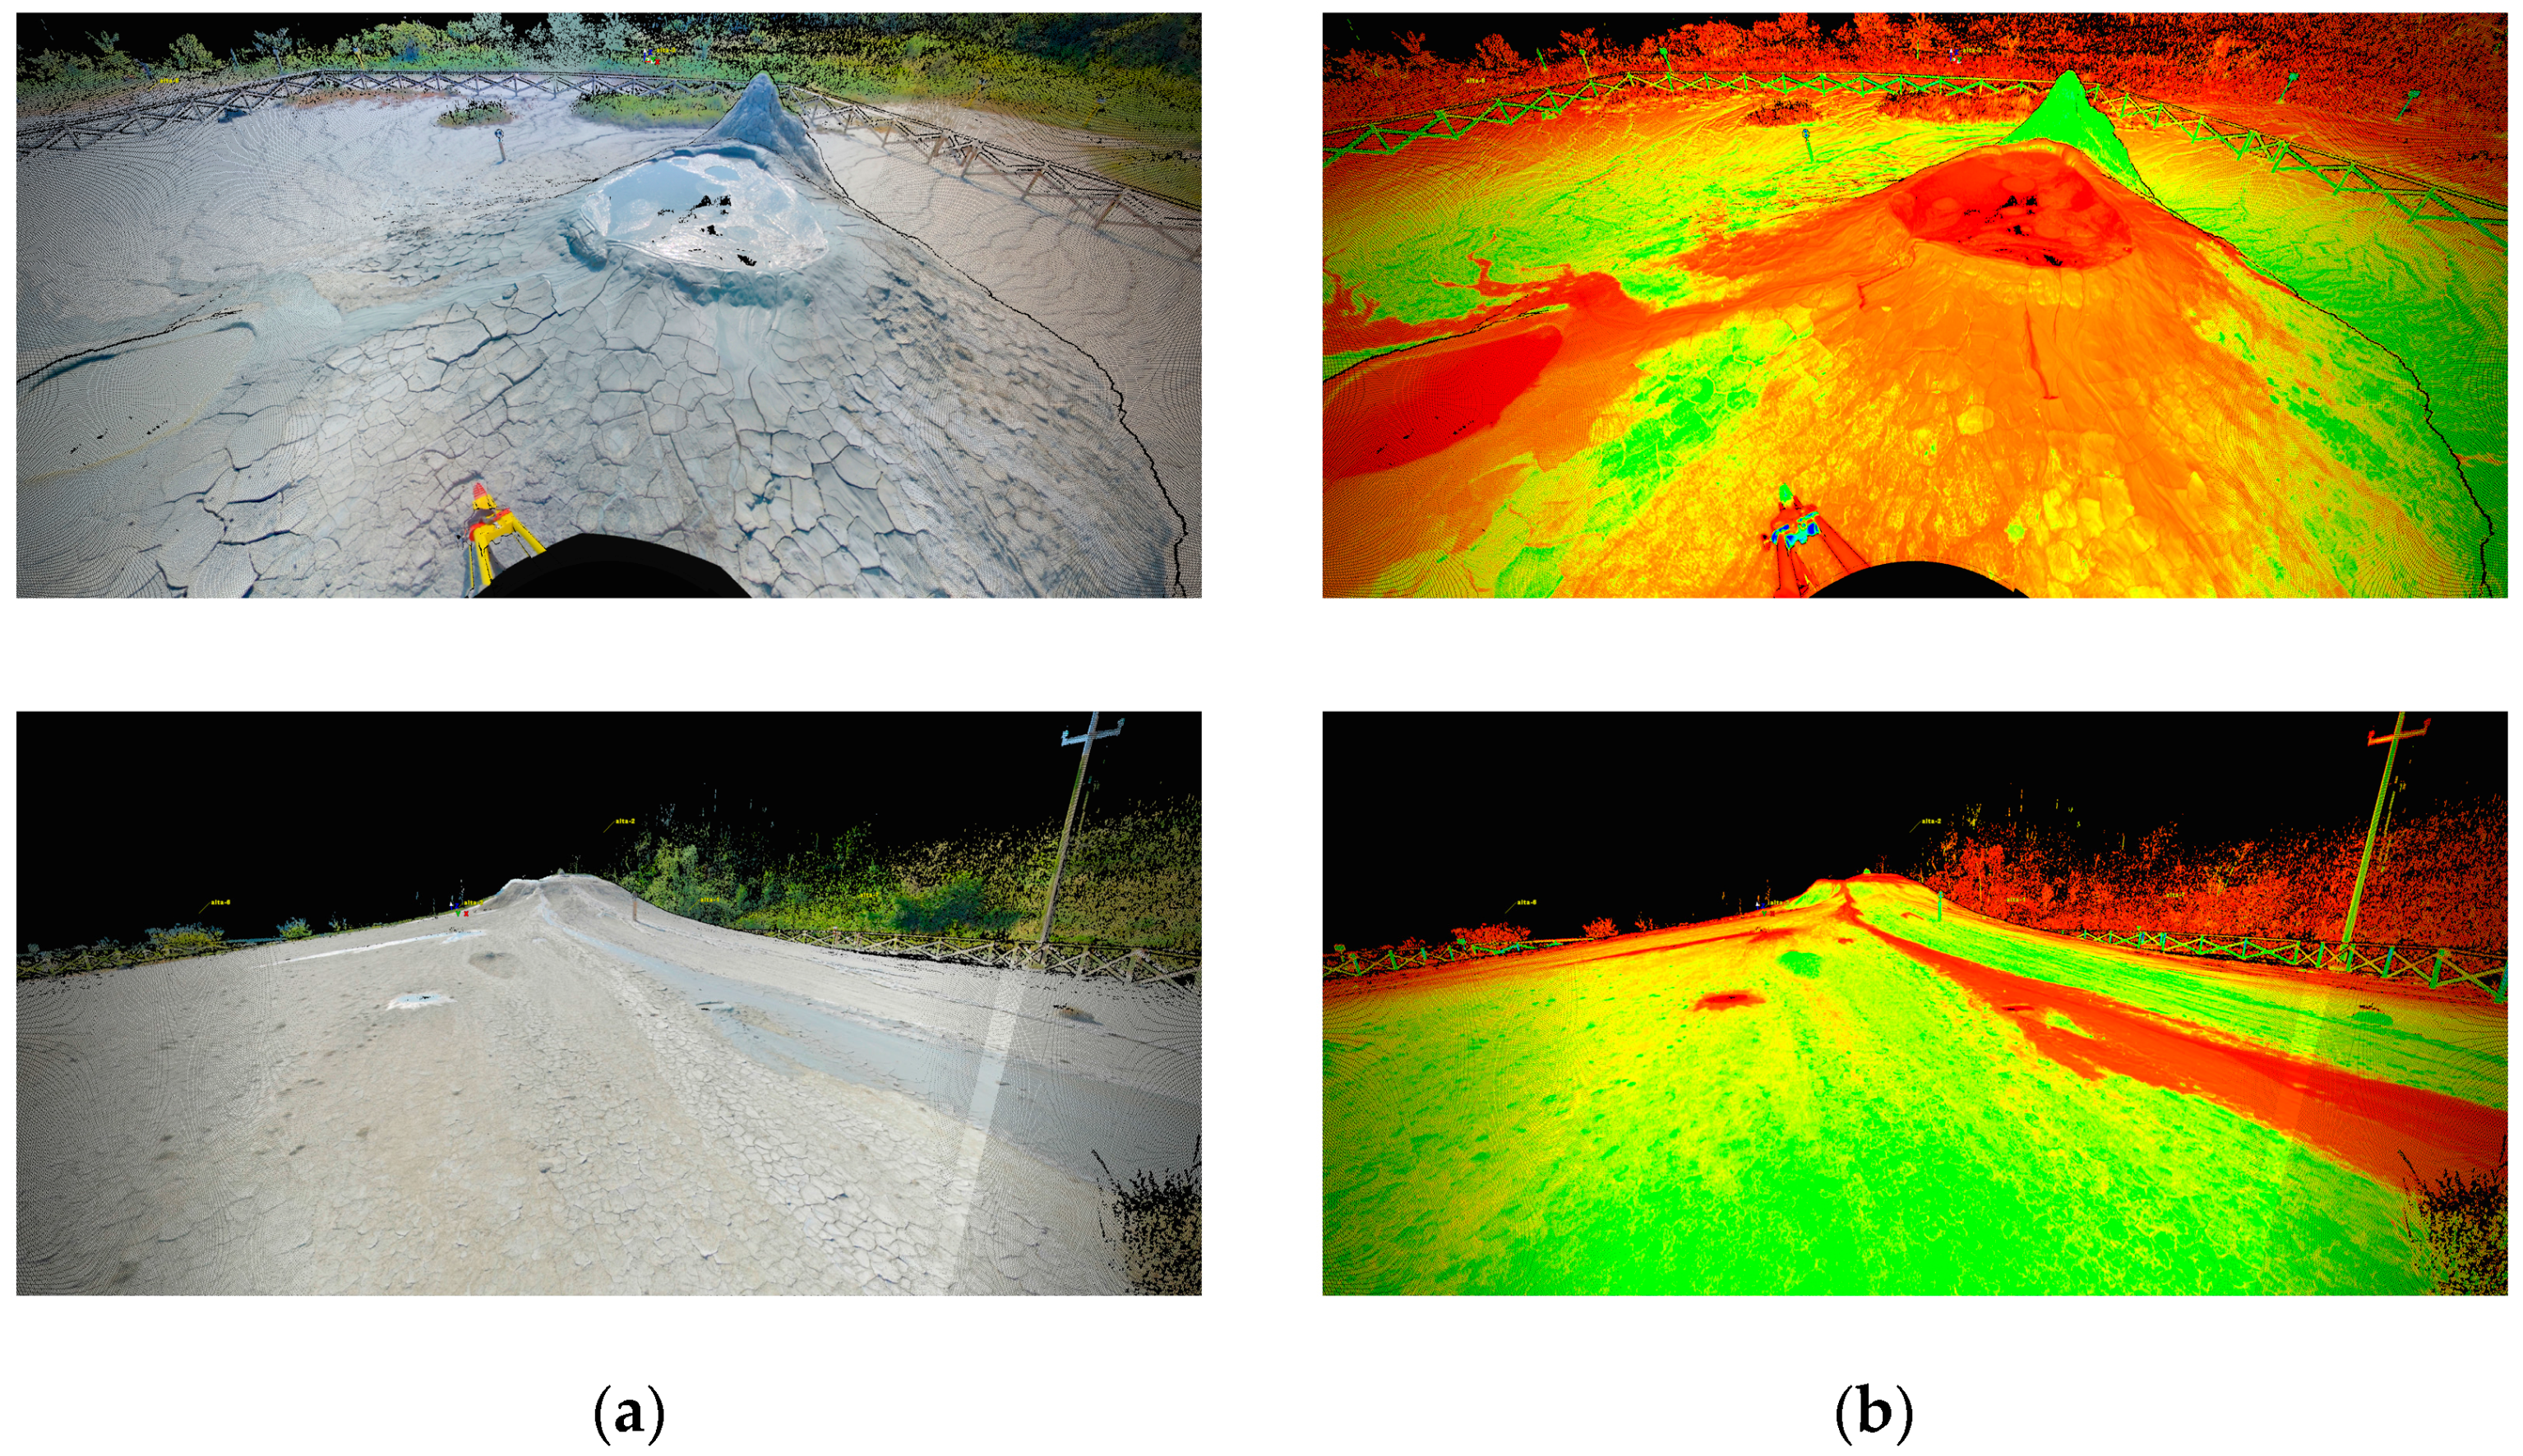
Data elaboration was mainly performed with the software Leica Cyclone, which allows to import the scans, proceed with their alignment and assign RGB values directly on the point clouds (Figure 3) by the photos taken during the survey, while other operations such as surface analysis, 2D and 3D poli-line extrapolating and drawings in order to realize plans and sections, were performed with other softwares such as Auto-CAD 2014 and CloudCompare (ver. 2.6.2), an open source software that allow to visualize and work with point cloud and meshes.
In addition to the laser scanning surveys, the use of UAV allowed us to obtain detailed images performing several flights at altitudes of 40–70 m from the ground over the three main volcanic fields of the Nirano Regional Natural Reserve. From the photographs it was possible to compare pictures taken at different times, as well as to produce accurate 3D models using software for structure from motion and derive geo-referenced ortophotos and digital terrain models (DTMs) [8].
The UAV used is a carbon fibre frame quad-copter equipped with GPS system (NAZA-M), compass altimeter and barometer, propellers of 16cm in diameter and 4 cells batteries lipo (5000 Mah), which usually guarantee 25–30 min of fly with the camera mounted on (Canon Power Shot S110) that have allowed us to obtain more than 350 overlapping and geo-tagged images.
Two different campaigns were performed to obtain photogrammetric 3D models with UAV of the three main areas of the Nirano mud volcano field (August 2015 and June 2016).
3. Data Analysis
The researches realized for this study were performed over a period of one year between May 2015 and June 2016. During this period, several topographic measurements campaigns were carried out using different measurement instruments.
Data derived by TST and GPS were compared mainly to verify variations in height, measuring the same fixed points that were also used as Ground Control Point (GCP) to geo-reference the 3D models obtained from UAV images and as control points for the scans alignment.
The information obtained from both laser scanning and photogrammetric tools are the first results of a series of operations in the field, but also the interim data which lead to further elaborations according to the needs and research purposes. The main goal of the project was to compare the evolution trendings of the mud volcanic complexes for the security of the Reserve, but considering type of data, especially the derived from TLS and UAV, it was possible to realize further geo-morphological analysis.
3.1. Terrestrial Laser Scanning Data
After completing the process of coloration and scans union, the result was a coloured 3D point cloud on which it was possible to perform drawings and data analysis.
Due to the morphological conformation of the Nirano Natural Reserve (which includes three separate volcanic complexes) it was necessary to scan the volcanic complexes individually and create 3 separated workflow areas that were analysed among with the same processes.
The software used to import the point cloud and build the model spaces is the Leica Cyclone (version 9.1), which consists of a series of modules necessary to acquire the point clouds, register and work with the scans using several tools.
To colour the point cloud, it was used the software PT-Gui to create panoramic and cubic photos, that were merged with the point cloud to colour each scans using the appropriate tools “appereances” and “edit photo” in Cyclone, which allows to colour a point cloud by selecting three common points on the cubic photos and on the point cloud.
Before to proceed with the registration of the model spaces, it was necessary to check the error of scans union (which was on average of 4 mm based on aligment of circular targets used during the scans and on the fixed points measured also with TST and GPS), than it was possible to start with the drawing operations using the model space tools, that allows the visualization of the point clouds with the possibility to manually draw and extract automatically 3D poli-line that could be exported directly in other software for further analysis.
Auto-CAD and Cloud Compare LT were used to draw topographic 2D plans and sections of the detected areas and to calculate point cloud roughness [9]. The data obtained from the two surveys, performed in June 2015 and May 2016, were processed with the software Cyclone and 3DReshaper and exported as dxf (for Auto-CAD) and pts (for CC) file formats for further geological analysis.
3.2. UAV Photogrammetry Data
In the last few years, photogrammetry from UAV’s has opened up new possibilities in the domain of the close range plane for the creation of three-dimensional information on the ground and has emerged as a valid complementary solution to the land acquisition. Moreover, the possibility to obtain 3D models from aerial photographs have been greatly improved thanks to the use of software for “Structure From Motion” (SFM), that through specific algorithms allows the reconstruction of 3D geometry and camera position of an object from a sequence of two-dimensional images captured from multiple viewpoints [10].
In this study, after the acquisition of photographs, the useful frames were selected and divided depending on the areas of the three main volcanic sectors of the Nirano field to have more defined data with a faster processing, and then were processed using the software Capturing Reality to create 3D textured point clouds and geo-referenced by entering points with known coordinates, also using the measurements derived by TST and GPS on the fix wood pickets as Ground Control Point (GCP), obtaining an average pixel-size ground resolution of 0.042 m.
Data derived from photogrammetry were exported as form of point cloud, geo-referenced orthophotos and DEMs (Digital Elevation Models). As results, the point cloud obtained were imported in Cyclone, with which it was possible to create TIN meshes and compare these data with those derived by TLS.
The data derived by the two different campaings were also compared as form of ortophotos and Digital Terrain Models, and used for the digitization of mud flows (Figure 4).
4. Results
The main objective of this project was to study the mud volcanic complexes of the Nirano Natural Reserve using technologies such as terrestrial laser scanning and photogrammetric techniques, that are increasingly used to track the evolution of natural surfaces in 3D with very high resolution and accuracy.
In this study, the information obtained with these techniques were used to analyse surface changes by the comparison of point clouds.
4.1. Digitization and Surfaces Interpretation
Digitization is considered one of the best solution to export precise data from 3D point clouds, but in most cases this operation must be performed manually and may be interpreted in different ways.
There are several tools that allows to extract digitized features from a point cloud using the software Leica Cyclone, one of which is the possibility to digitize directly with 3D CAD poli-line some parts of interests and export them to derive geometric features [11].
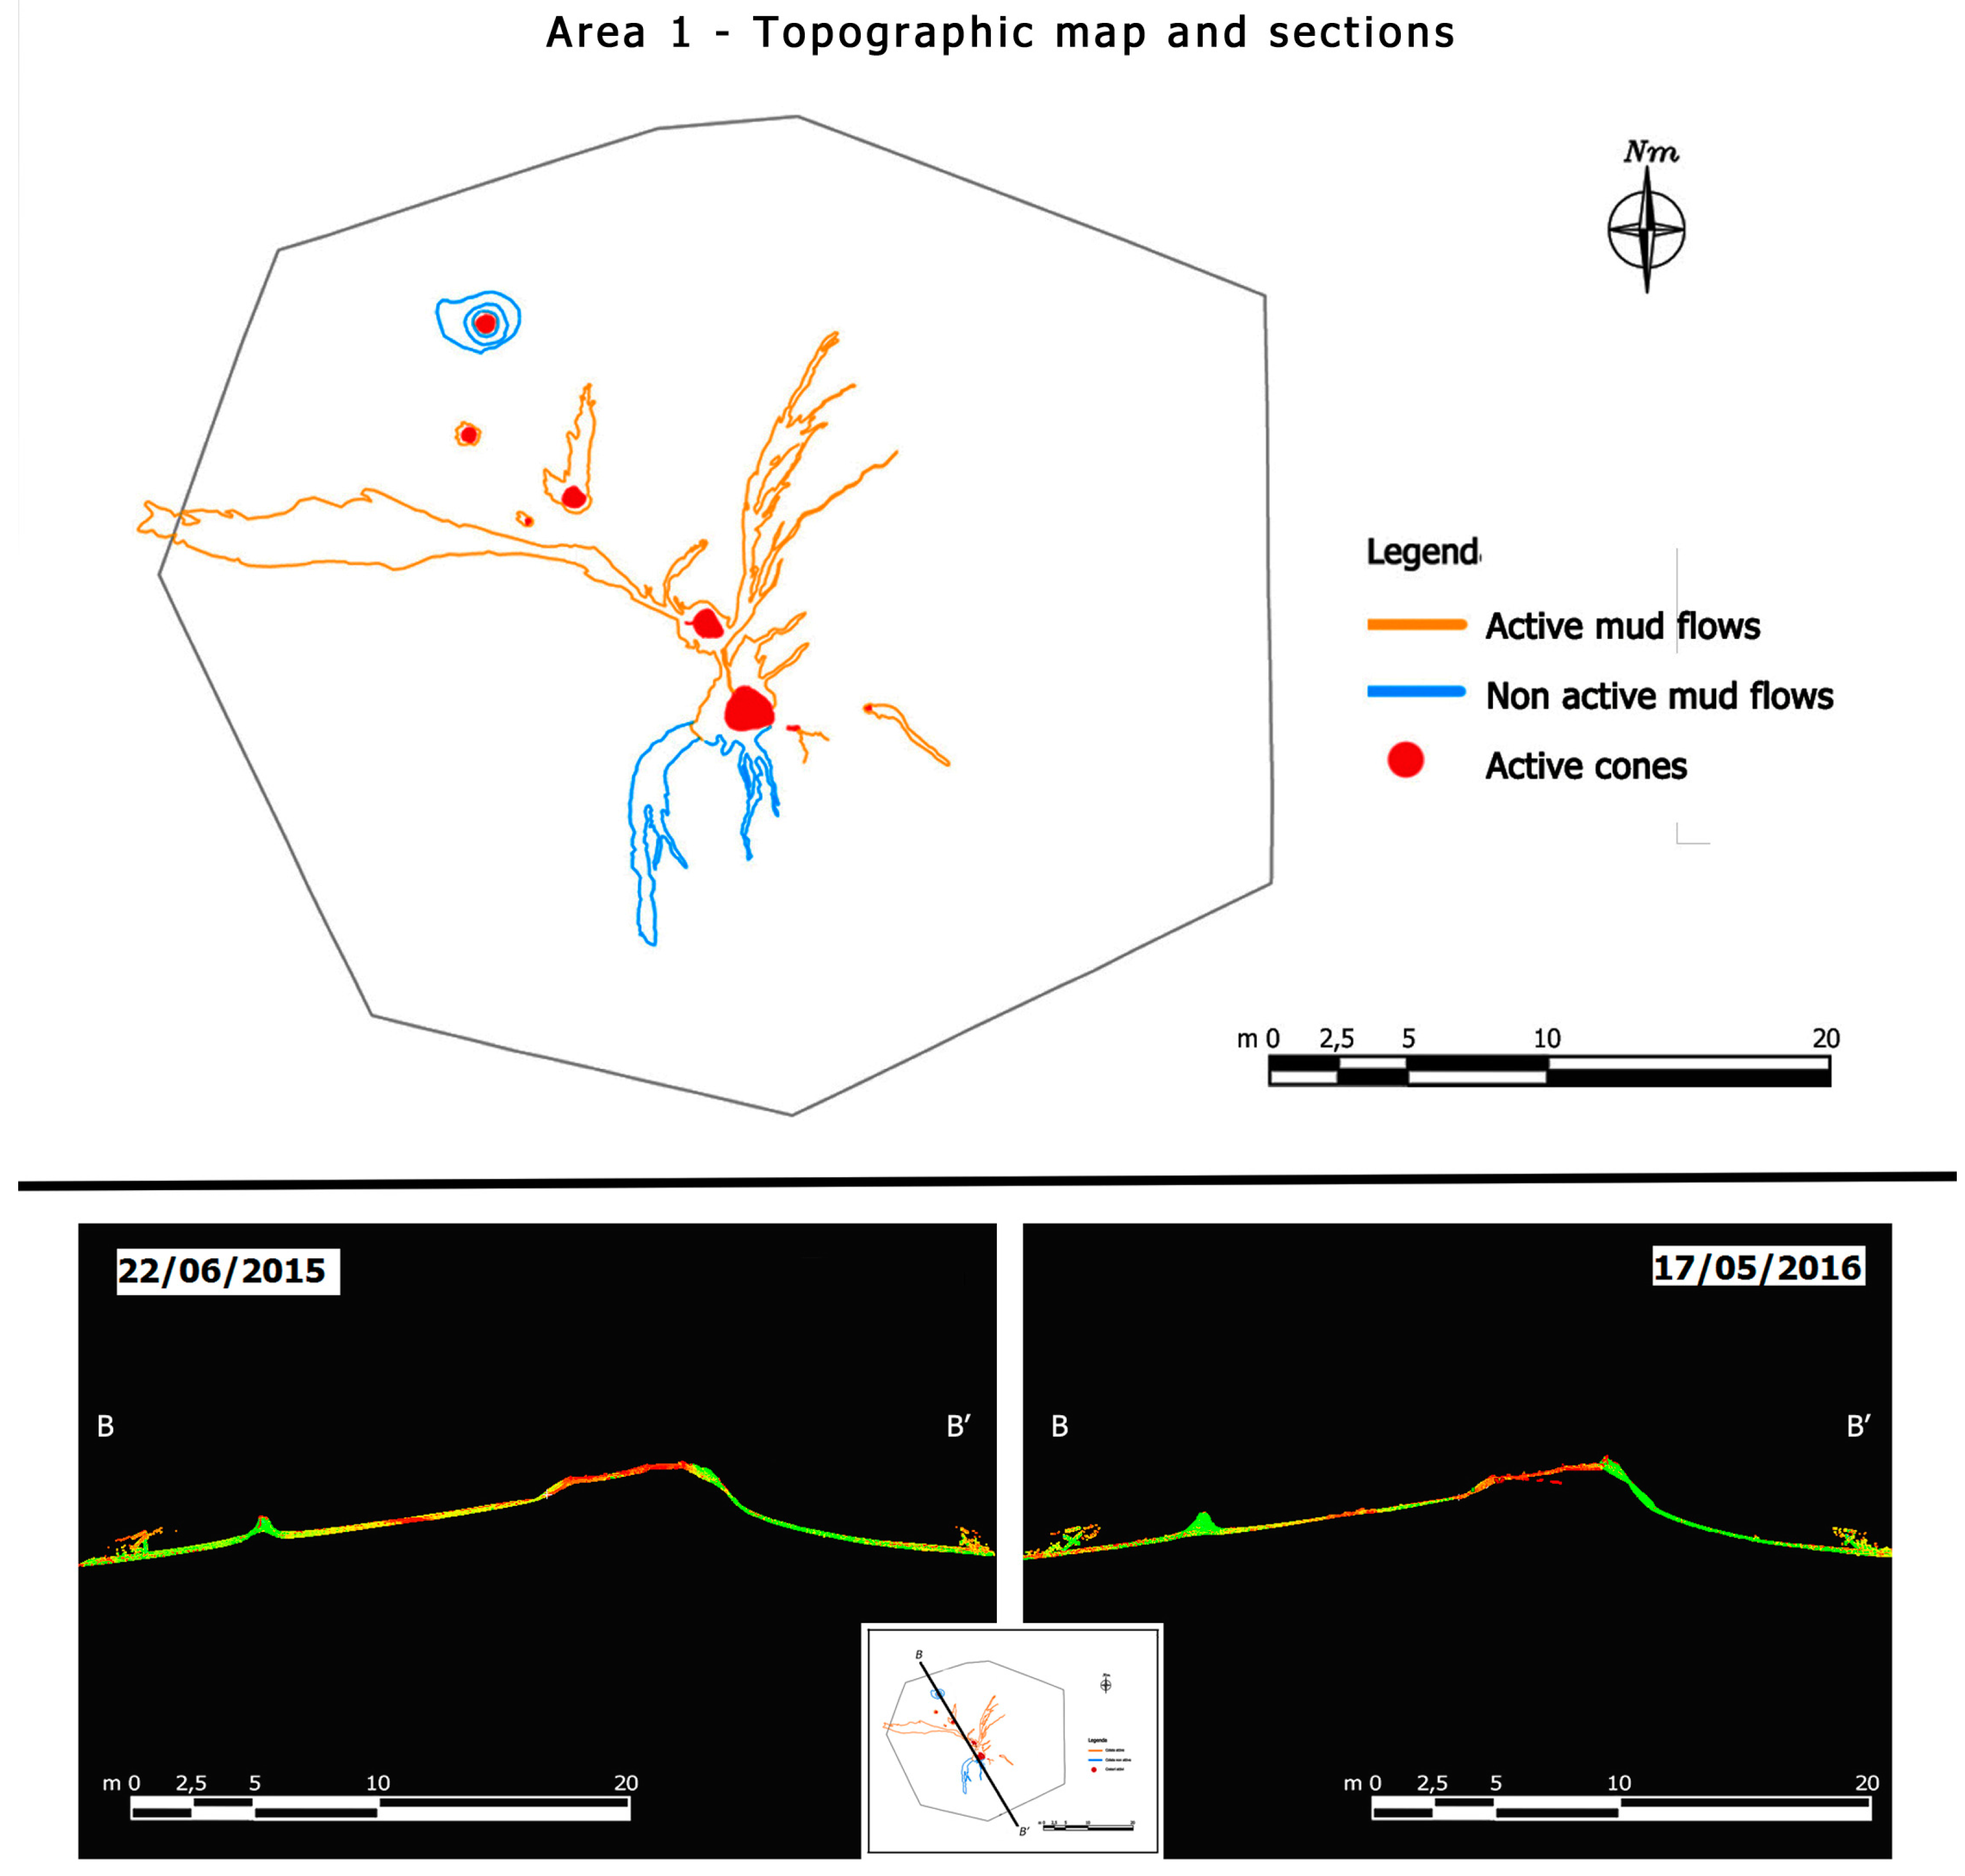
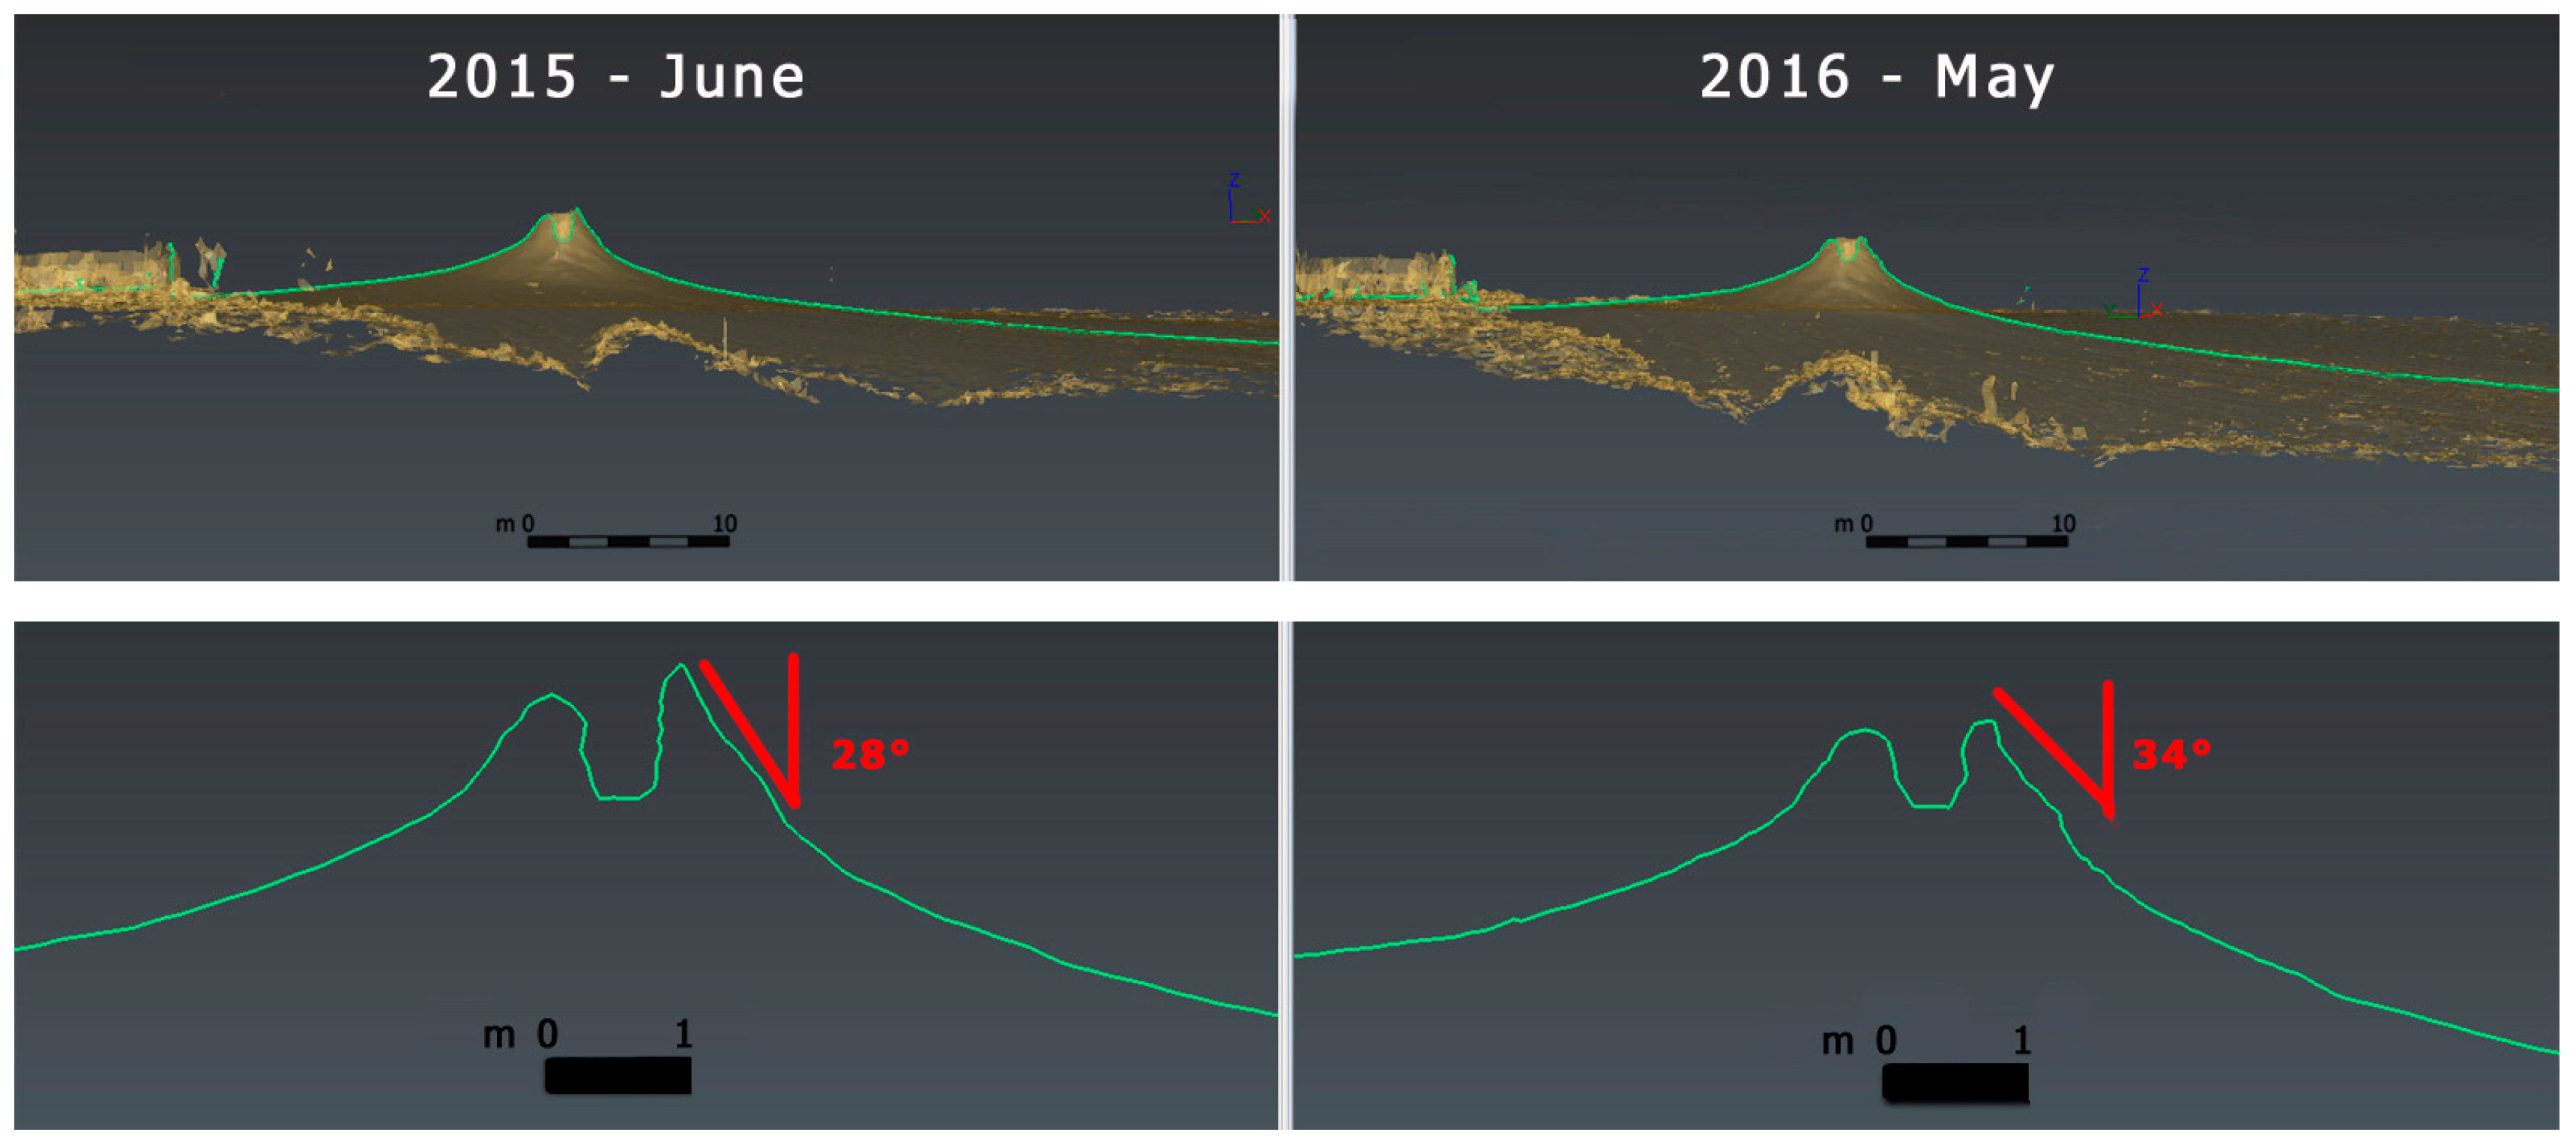
The derived data were subsequently elaborated with CAD software to carry out bi-dimensional maps (plans and sections) (Figure 5) with detailed information and subdivision of the type of cones based on their activity and diameter. Digitization tools were also used to compare the data obtained from the laser scanning surveys performed in 2015 and in 2016 extrapolating topographic sections along specific directions. In some particular cases, this type of comparison showed very well the morphological variations of the volcanic cones (Figure 6).
4.2. Mud-Cracks Analysis
The terrain in the surrounding areas of mud volcanic buildings is generally made up by regular small ground fractures of variable size caused by the dessecation related to drying and wetting cycles processes.
Thanks to the use of TLS instruments it was possible to acquire a large amount of data on the detected mud-crack surfaces and proceed with their analysis. The most interesting observations are related to their size, shape and position, but other useful data could be easily revealed by measuring the extent of their gap and surface detachment.
These information may be put in relation with other physical external parameters (i.e., temperature or humidity) and with the grade of activity of mud volcanoes, in order to understand what are the main mechanisms of dissecation and mud-crack development related to the evolution of mud volcanoes.
4.3. Roughness Analysis
Terrain roughness is an important input for several applications such as morphological studies and natural processes modelling [9]. This type of analysis can be computed with open-source software such as Cloud Compare LT, which allows to import a large variety of laser scanner format or point clouds and mesh derived from software for structure from motion and estimate roughness value by calculating the distance between each point and its best fitting plane computed on the nearest point. For this type of analysis only the data derived from TLS have been compared in different parts of the volcanic structures.
The obtained results have highlighted different values due to the presence of fluids in some parts of the volcanic buildings (especially in the surrounding parts of the emission cones) and also depending on the height of the structures between the lower cones (characterized by planar morphologies) and the highest (characterized by vertical cone shape forms) (Figure 7).
4.4. Data Comparisons and Interpretation
3D models derived from laser scanning and photogrammetry were compared with different methods.
DEM comparison is considered one of the most common methods of data analysis derived from point cloud used in the context of geomorphological applications. In this work, laser scanning and photogrammetry DEM have been compared to highlight variations of the height of the cone, and it was also possible to compare the mud flows that have shown the most significant changes.
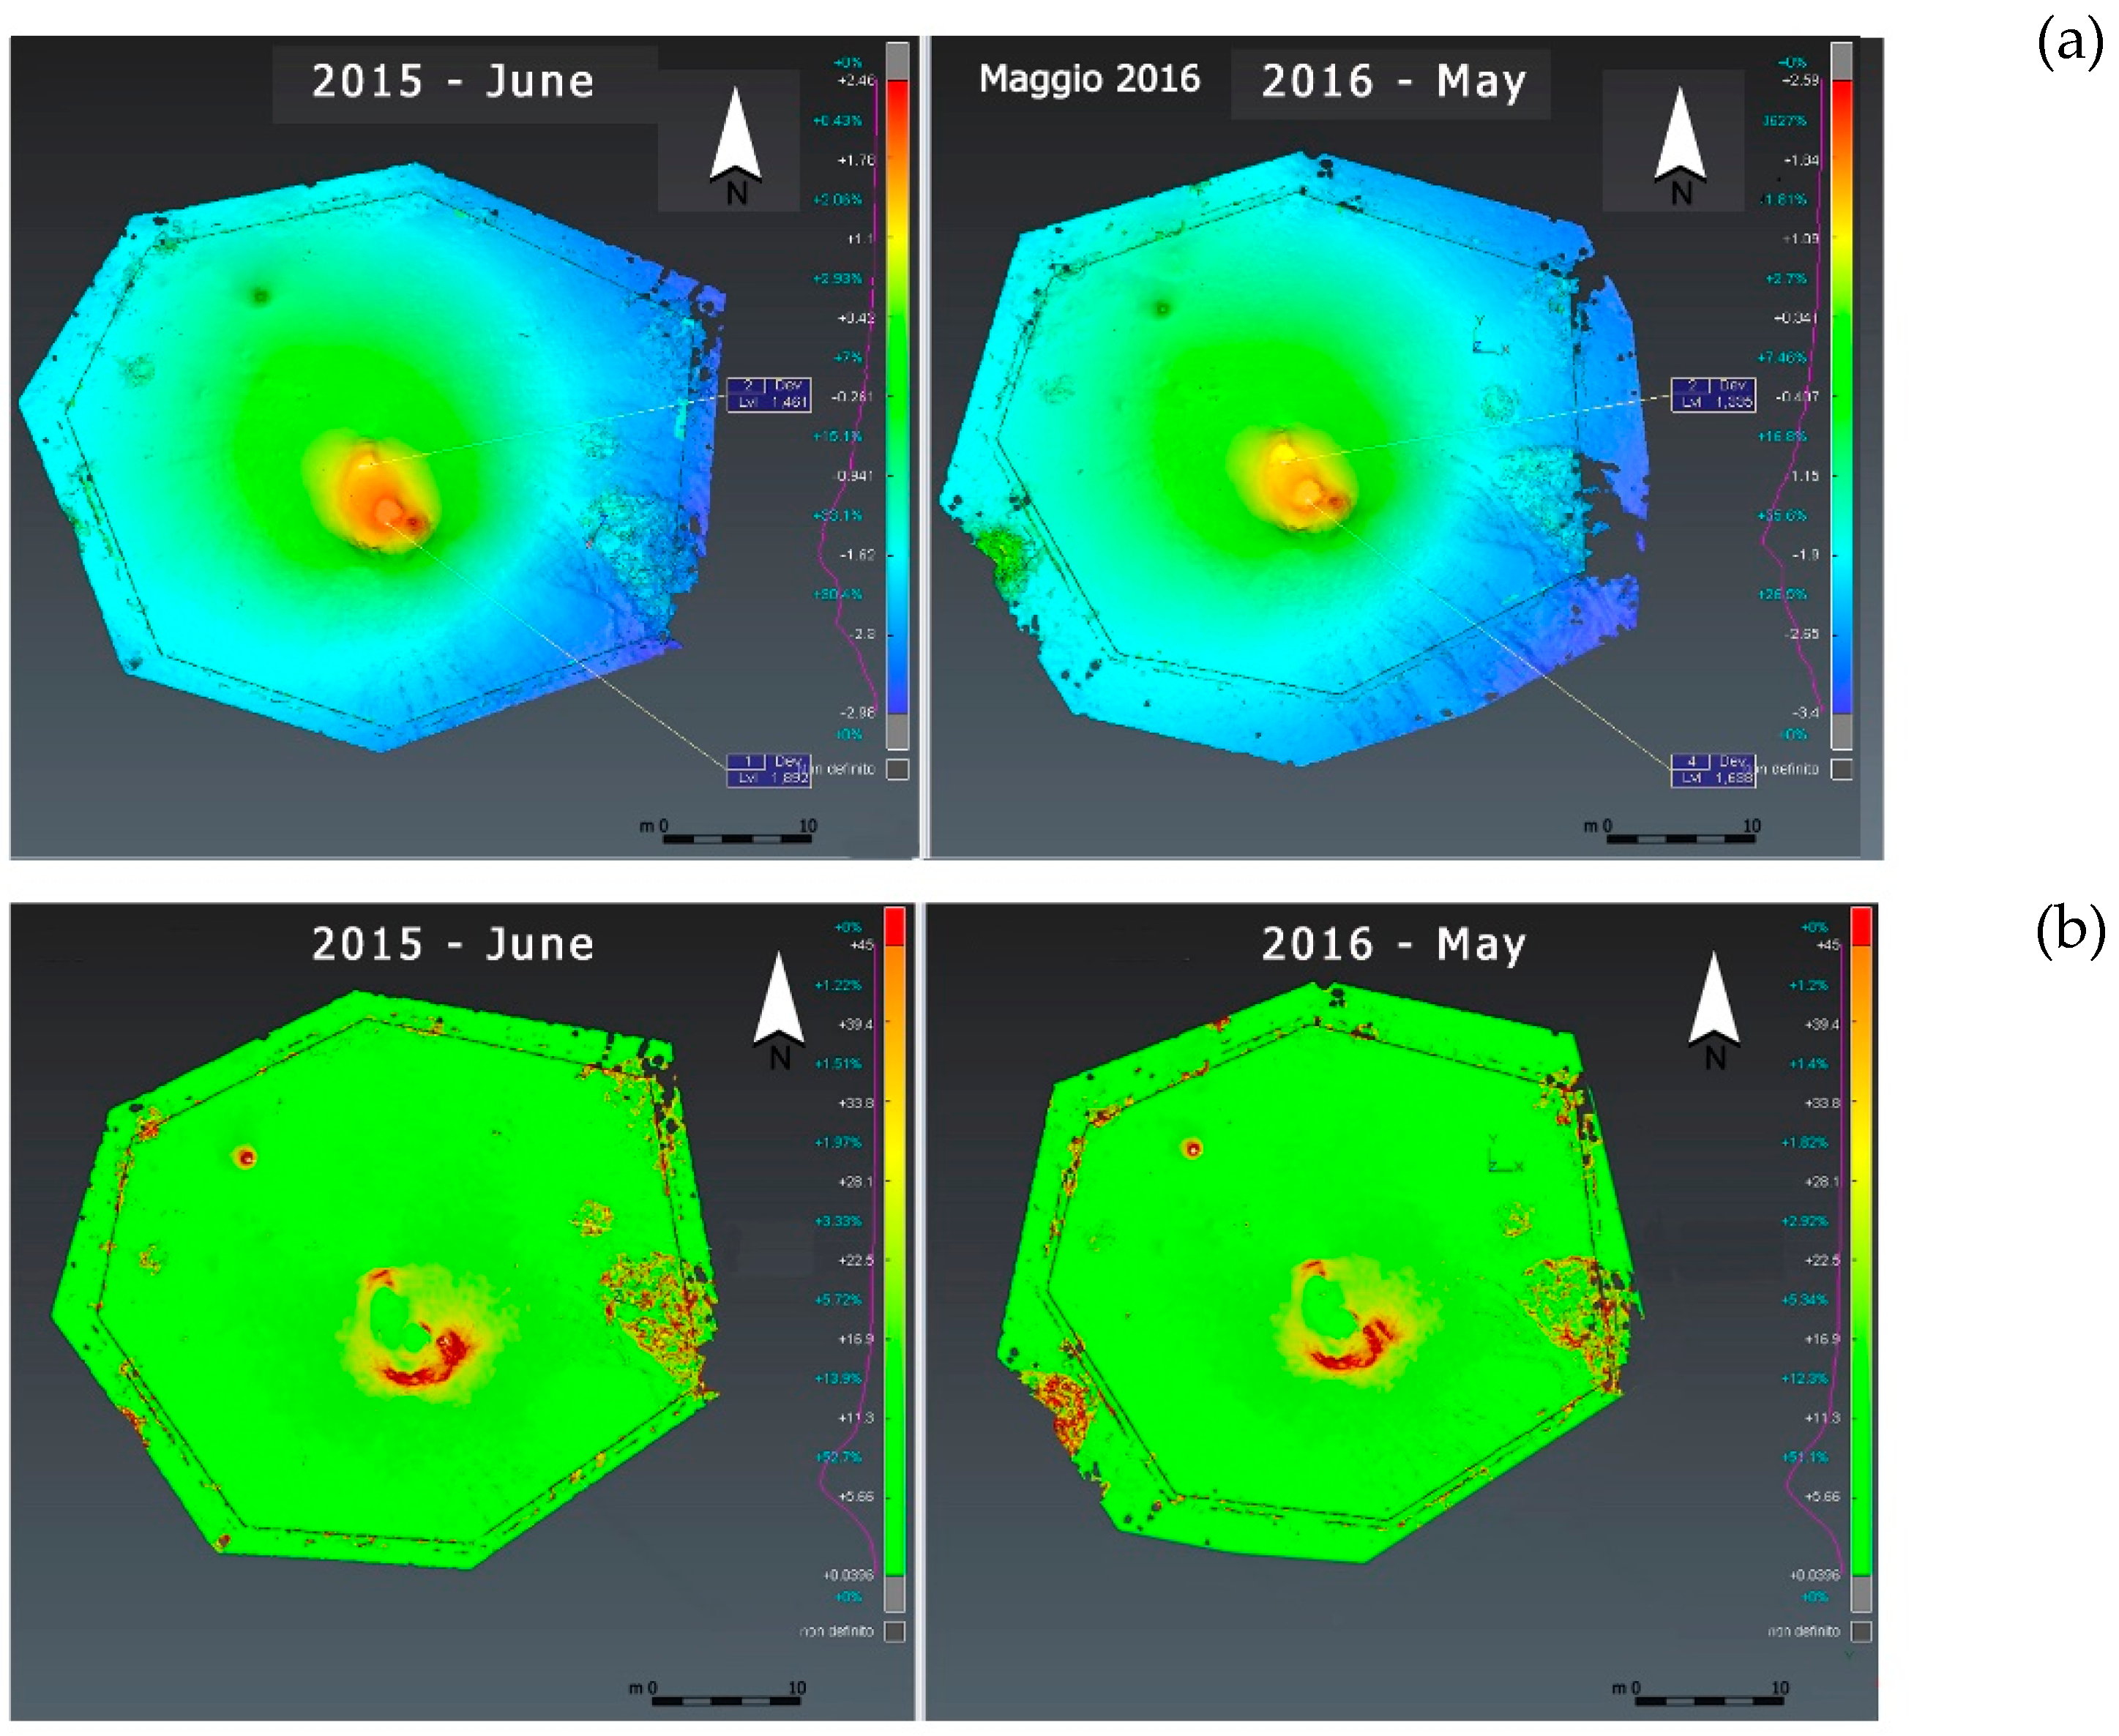
The software 3D Reshaper allowed the elaboration of different types of terrain models that have been used to compare the mud volcanic areas, highlighting the variation of the upper part of the cones (especially on the main cone of Area 1), presence of vegetation and mud flows (Figure 8).
Using the software Leica Cyclone it was also possible to import the 3D point clouds obtained from both laser scanner and photogrammetry techniques, and convert into meshes in order to calculate contour lines [12].
The 3D models elaborated from UAV images were analysed with the same parameters of the scans, obtaining comparable data even if on different levels of detail.
5. Discussion
As described, the use of different measurement instruments requires different methods of working approach for field operations as well as for data processing and analysis.
The most important advantage of the use of tools such as laser scanner and UAV is the possibility to obtain a large amount of data with very high grade of precision and resolution in a very short time [13].
Moreover, these information can be merged together with those derived from other “classical” survey techniques that in this study were very important to define coordinate and altitude position of nails and pickets. In this way, it was possible to compare different methodologies having greater control on the quality of the acquired data.
6. Conclusions
The aim of this article is to demonstrate how the use of laser scanning and photogrammetry ensures a good solution for monitoring rapidly evolving geological structures. In integration with total station and GPS, 3D measurement instruments obtained through TLS can guarantee the acquisition of a large amount of data that could be used to draw detailed topographic maps and work on specific analysis for geological purposes.
In this study, the topographic surveys made during this first campaign of the “Salse di Nirano monitoring” project allowed to obtain important information for future monitoring. Data acquired in this period have been compared on a short period of about one year. For this reason, it will be interesting to acquire new data in future to integrate the dataset and compare the results.
Supplementary Materials
The following are available online at www.mdpi.com/2313-433X/3/4/42/s1, Video S1: The Nirano mud volcanoes—Photogrammetry & terrestrial laser scanning point cloud—Author: T. Santagata, Video S2: Riserva Naturale delle Salse di Nirano—Author: T. Santagata.
Acknowledgments
Author is very grateful to the members of the “Salse di Nirano monitoring” working group, in particular to: Albarello D., Castaldini D., Coratza P., Papazzoni C., Vezzalini M.G. (University of Modena and Reggio Emilia), De Nardo M. T. (SSGS, Emilia Romagna Region), Martinelli G. (ARPA Reggio Emilia), Dadomo A., Galli P., Camorani M.C. and Studio Laserscangst of Reggio Emilia for providing the measurement instruments used for this work, the Natural Reserve of Salse di Nirano and the municipality of Fiorano Modenese.
Conflicts of Interest
The author declares no conflict of interest.
References
- Kopf, A.J. Significance of mud volcanism. Rev. Geophys. 2002, 40, 1005. [Google Scholar] [CrossRef]
- Bonini, M. Mud volcanoes: Indicators of stress orientation and tectonic controls. Earth Sci. Rev. 2012, 115, 121–152. [Google Scholar] [CrossRef]
- Lupi, M.; Saenger, E.H.; Fuchs, F.; Miller, S.A. Lusi mud eruption triggered by geometric focusing of seismic waves. Nat. Geosci. 2013, 6, 642–646. [Google Scholar] [CrossRef]
- Castaldini, D.; Chiriac, C.; Ilies, D.C.; Valdati, J. Geomorphological sensitivity: The case study of the Natural Reserve of “Salse di Nirano” (Modena Apennines). In Geomorphological Sensitivity and System Response; Camerino-Modena Apennines: Italy, 2003; pp. 57–66. [Google Scholar]
- Bonini, M. Elliptical mud volcano caldera as stress indicator in an active compressional setting (Nirano, Pede-Apennine margin, Northern Italy). Geology 2008, 36, 131–134. [Google Scholar] [CrossRef]
- Castaldini, D.; Valdati, J.; Ilies, D.C.; Chiriac, C.; Bertogna, I. Geo-tourist map of the Natural Reserve of Salse di Nirano (Modena Apennines, (Northern Italy). Ital. J. Quat. Sci. 2005, 18, 245–255. [Google Scholar]
- Lague, D. Accurate 3D comparison of complex topography with terrestrial laser scanner: Application to the Rangitikei canyon (N-Z). Int. Soc. Photogramm. Remote Sens. 2013, 82, 10–26. [Google Scholar] [CrossRef]
- Barazzetti, L.; Remondino, F.; Scaioni, M.; Brumana, R. Fully automatic UAV image-based sensor orientation. In Proceedings of the ISPRS Commission I Symposium International Archives of Photogrammetry, Remote Sensing and Spatial Information Sciences, Calgary, AB, Canada, 3–11 July 2008; Volume 38. [Google Scholar]
- Rutzinger, M.; Bremer, M.; Ragg, H. Roughness Estimation from Point Clouds—A Comparison of Terrestrial Laser Scanning and Image Matching by Unmanned Aerial Vehicle Acquisitions. In Proceedings of the EGU General Assembly 2013, Geophysical Research Abstracts, Vienna, Austria, 7–12 April 2013; Volume 15. [Google Scholar]
- Ullman, S. The interpretation of structure from motion. Proc. R. Soc. Lond. 1979, 203, 405–426. [Google Scholar] [CrossRef] [PubMed]
- Santagata, T.; Lugli, S.; Camorani, M.E.; Ercolani, M. Laser scanner survey and Tru View application of the Grotta della Lucerna, a roman mine for lapis specularis. In Proceedings of the International Congress of Speleology in Artificial Cavities, Rome, Italy, 11–17 March 2015; pp. 143–147. [Google Scholar]
- Santagata, T.; Sauro, F.; Spotl, C.; Festi, D.; Oeggl, K.D.; Dal Molin, L.; Kadded, F.; Camorani, M.; Ropmeo, A. The Cenote Project: Monitoring a high altitude ice cave in the Dolomites, Italy. In Proceedings of the 17th International Congress of Speleology, Sidney, Australia, 23–29 July 2017; Volume 2, pp. 86–88. [Google Scholar]
- Fabbri, S.; Sauro, F.; Santagata, T.; Rossi, G.; De Waele, J. High-resolution 3-D mapping using terrestrial laser scanning as a tool for gromorphological and speleological studies in caves: An example from the Lessini mountains (North Italy). Geomorpology 2016. [Google Scholar] [CrossRef]
Figure 1.
Localization of the study site (A,B) and geomorphological map of the Regional Natural Reserve of “Salse di Nirano” (C) from Castaldini et al., 2005 [6].
Figure 1.
Localization of the study site (A,B) and geomorphological map of the Regional Natural Reserve of “Salse di Nirano” (C) from Castaldini et al., 2005 [6].

Figure 2.
The Leica HDS7000 laser scanner during the operations on field. Photo: Santagata T.
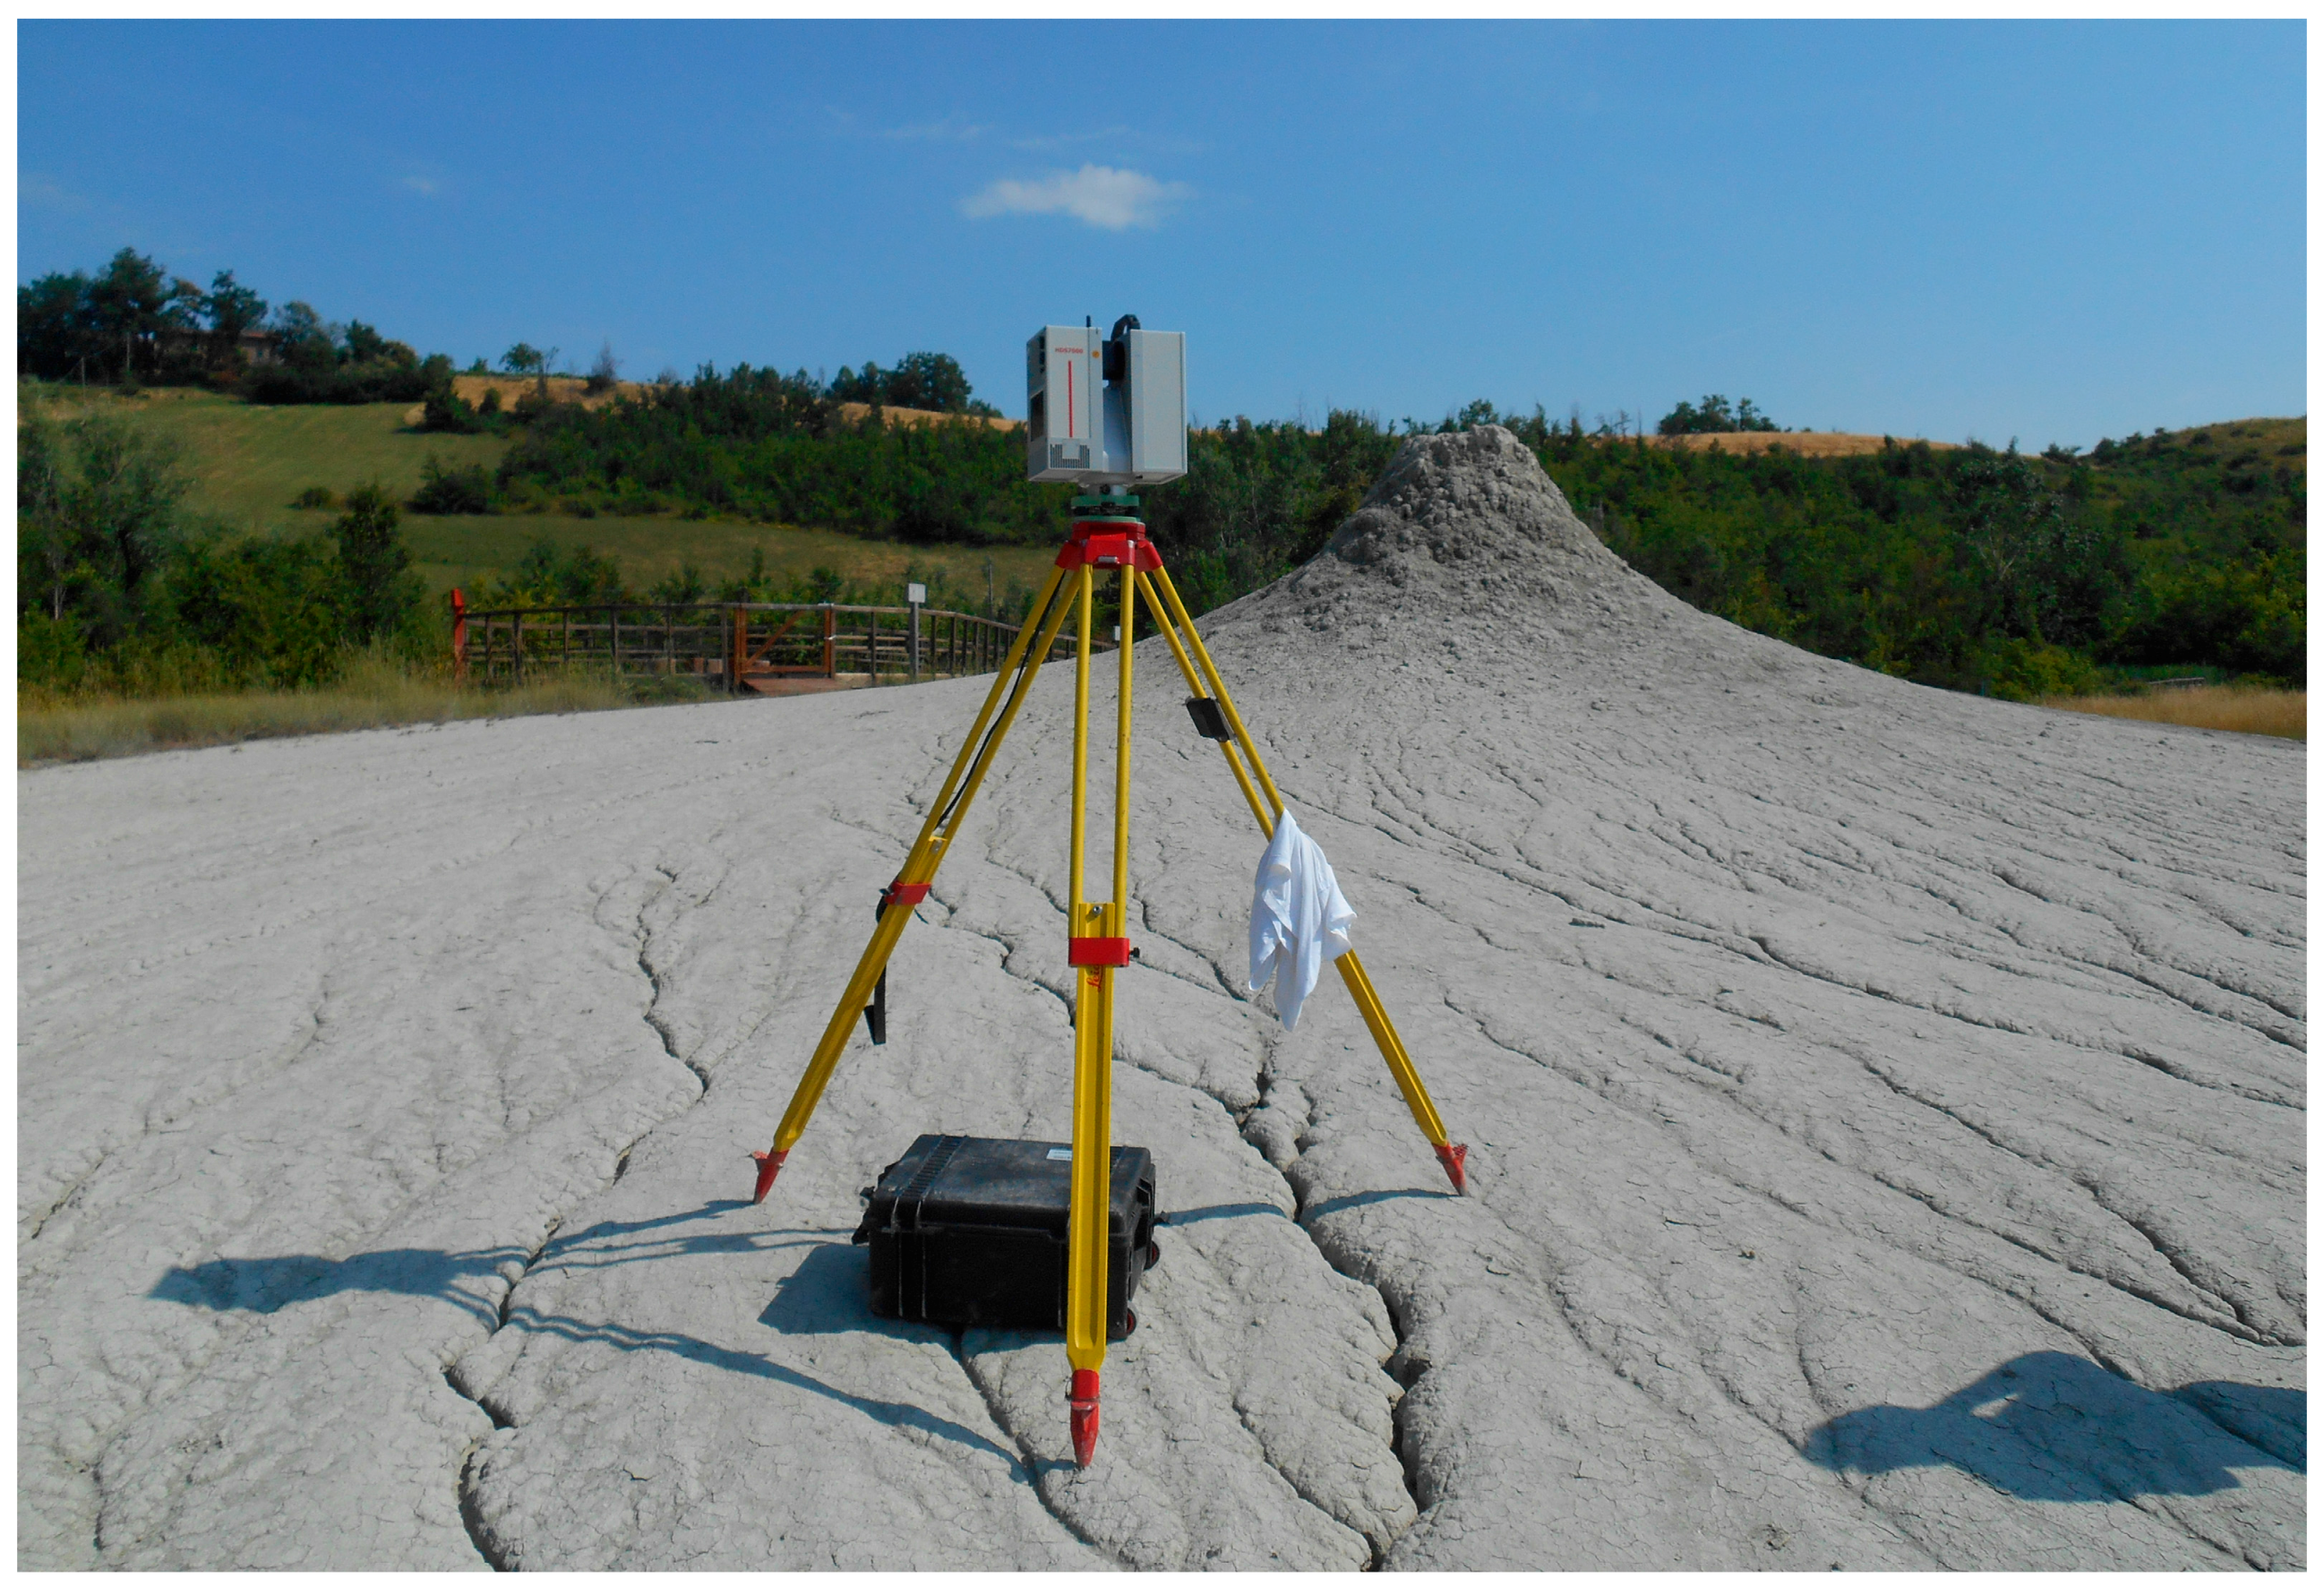
Figure 3.
Point cloud from terrestrial laser scanning visualized with RGB values (a) and intensity value (b).
Figure 3.
Point cloud from terrestrial laser scanning visualized with RGB values (a) and intensity value (b).

Figure 4.
UAV photogrammetry comparison of the ortophotos obtained by the two survey campaigns realized.
Figure 4.
UAV photogrammetry comparison of the ortophotos obtained by the two survey campaigns realized.
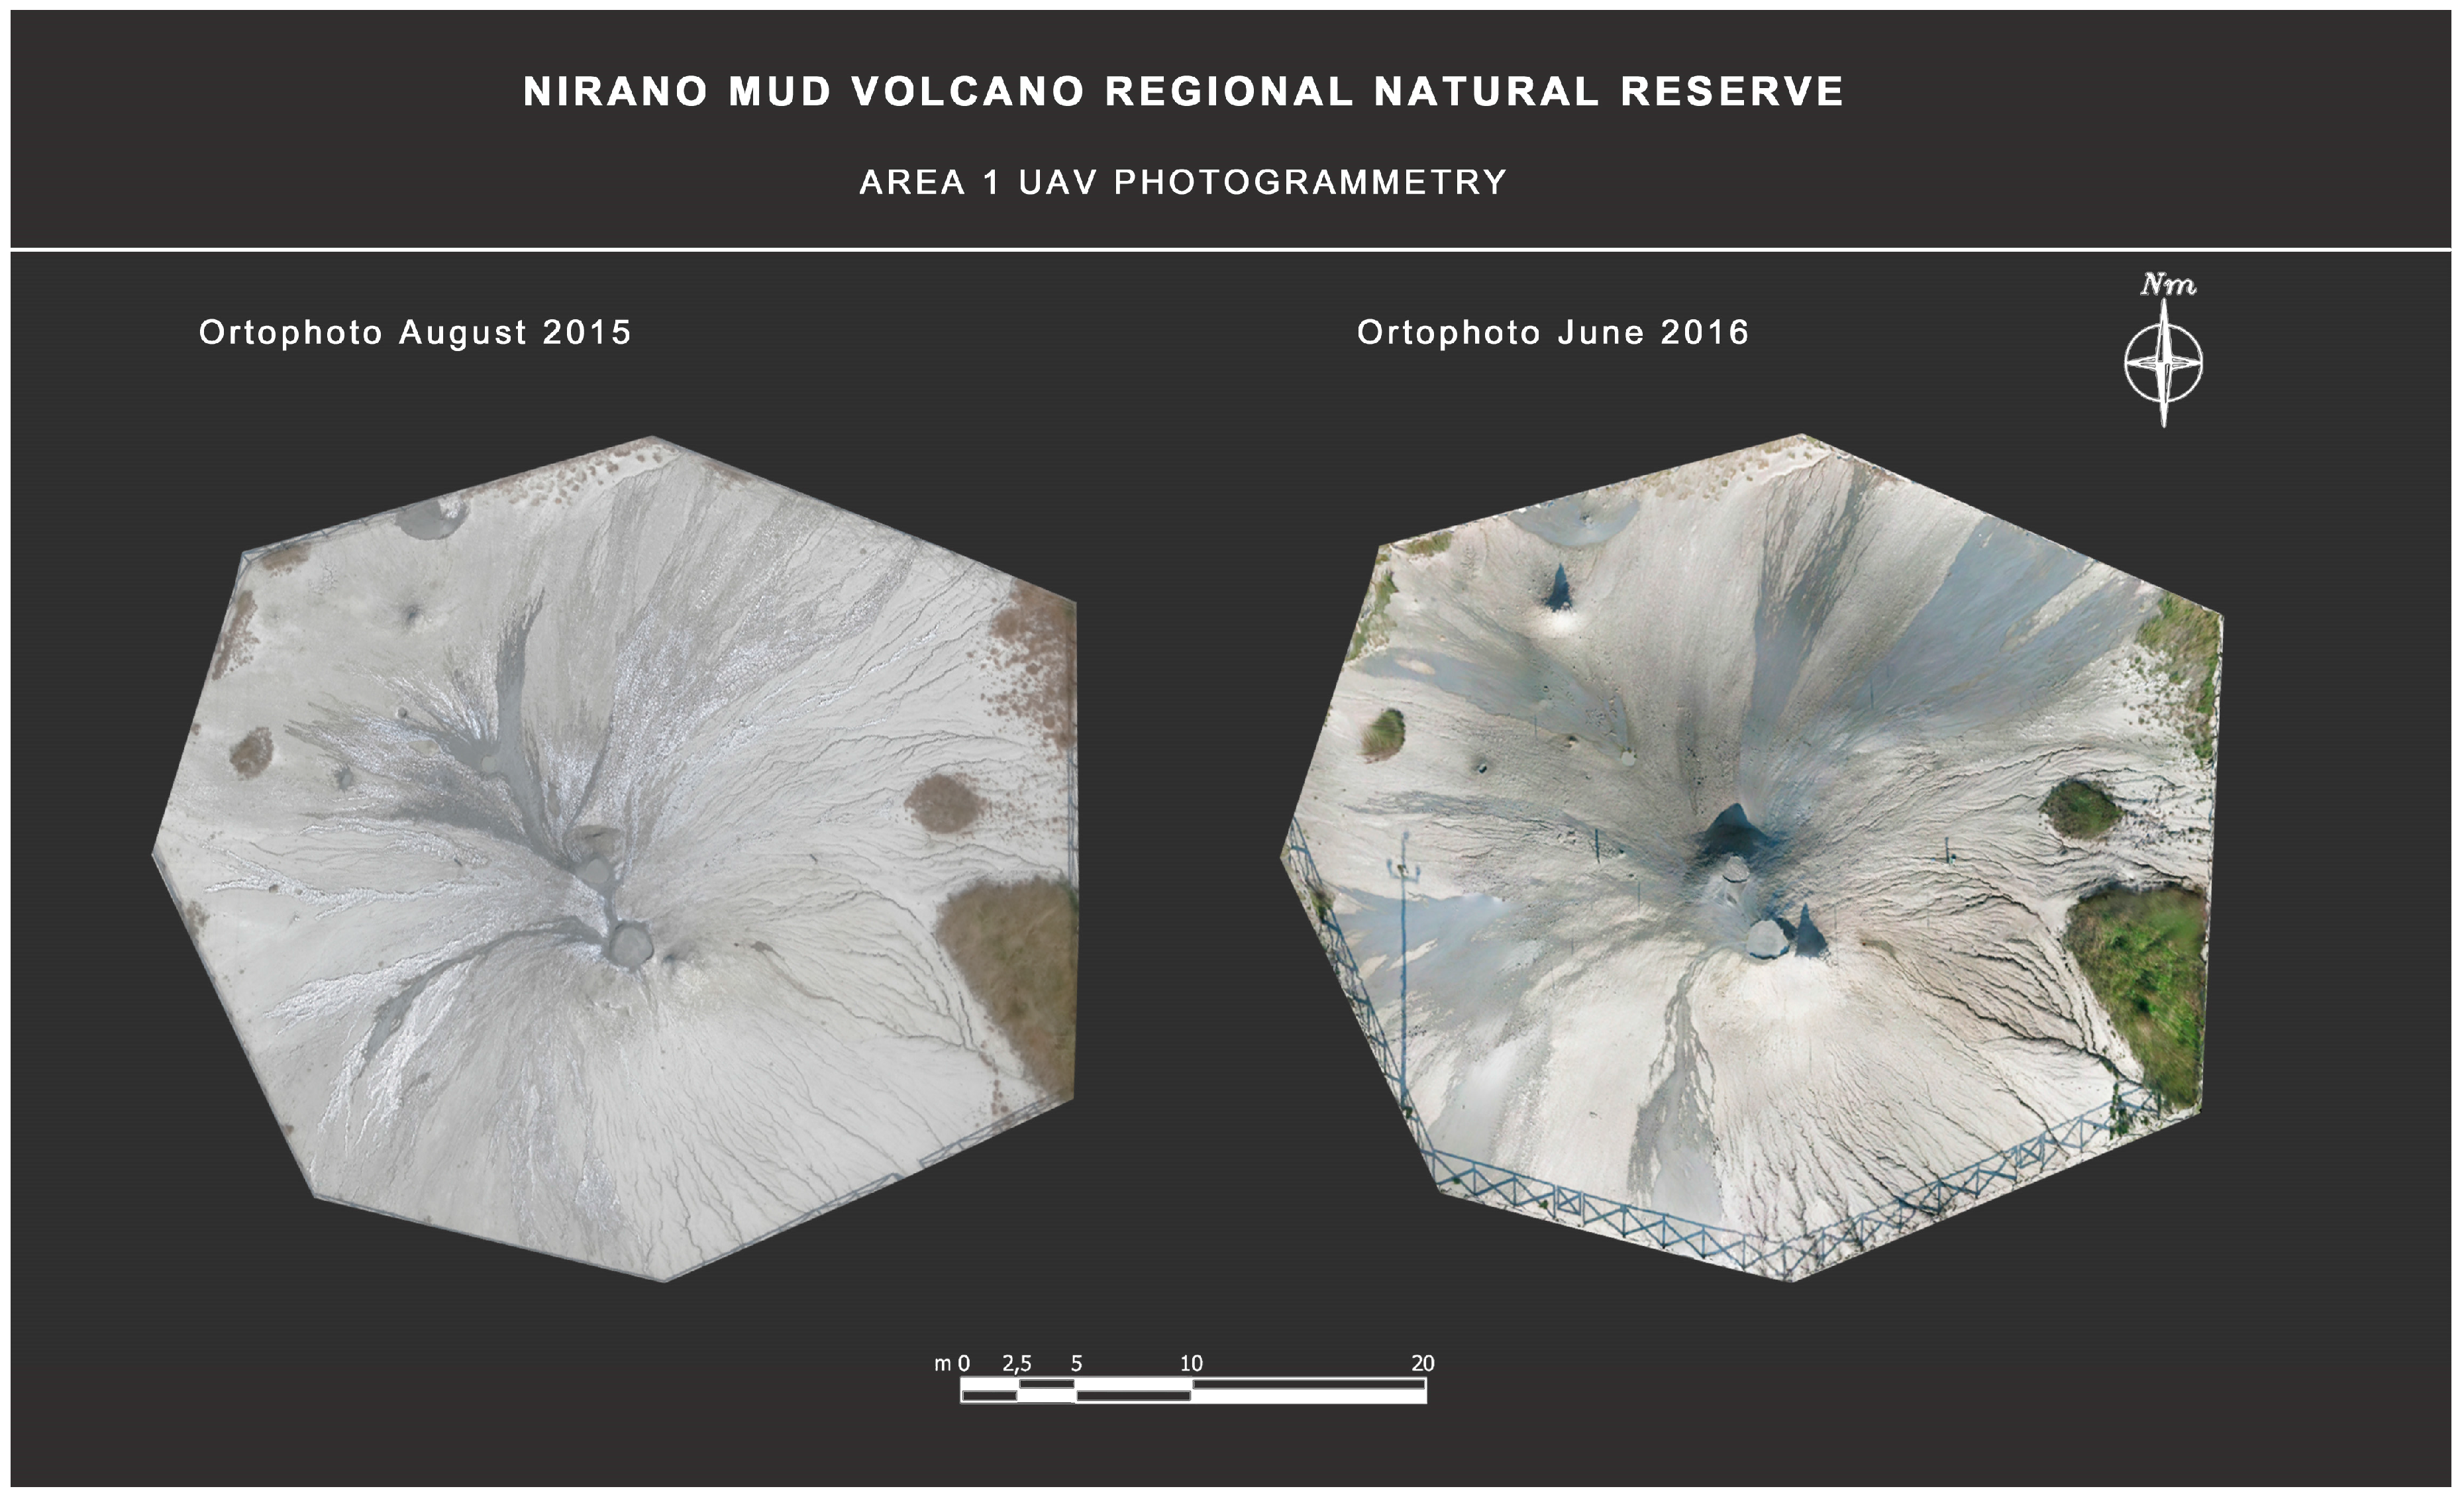
Figure 5.
Topographic map and sections of one of the three main volcanic fields derived from digitization of point clouds.
Figure 5.
Topographic map and sections of one of the three main volcanic fields derived from digitization of point clouds.

Figure 6.
Measurement of the angular variations of one of the main cone of the Niranofield (located in the Area 3) by digitization of laser scanning point cloud.
Figure 6.
Measurement of the angular variations of one of the main cone of the Niranofield (located in the Area 3) by digitization of laser scanning point cloud.

Figure 7.
Roughness point cloud analysis performed with Cloud Compare on the Area 3 of the Nirano Natural Reserve.
Figure 7.
Roughness point cloud analysis performed with Cloud Compare on the Area 3 of the Nirano Natural Reserve.
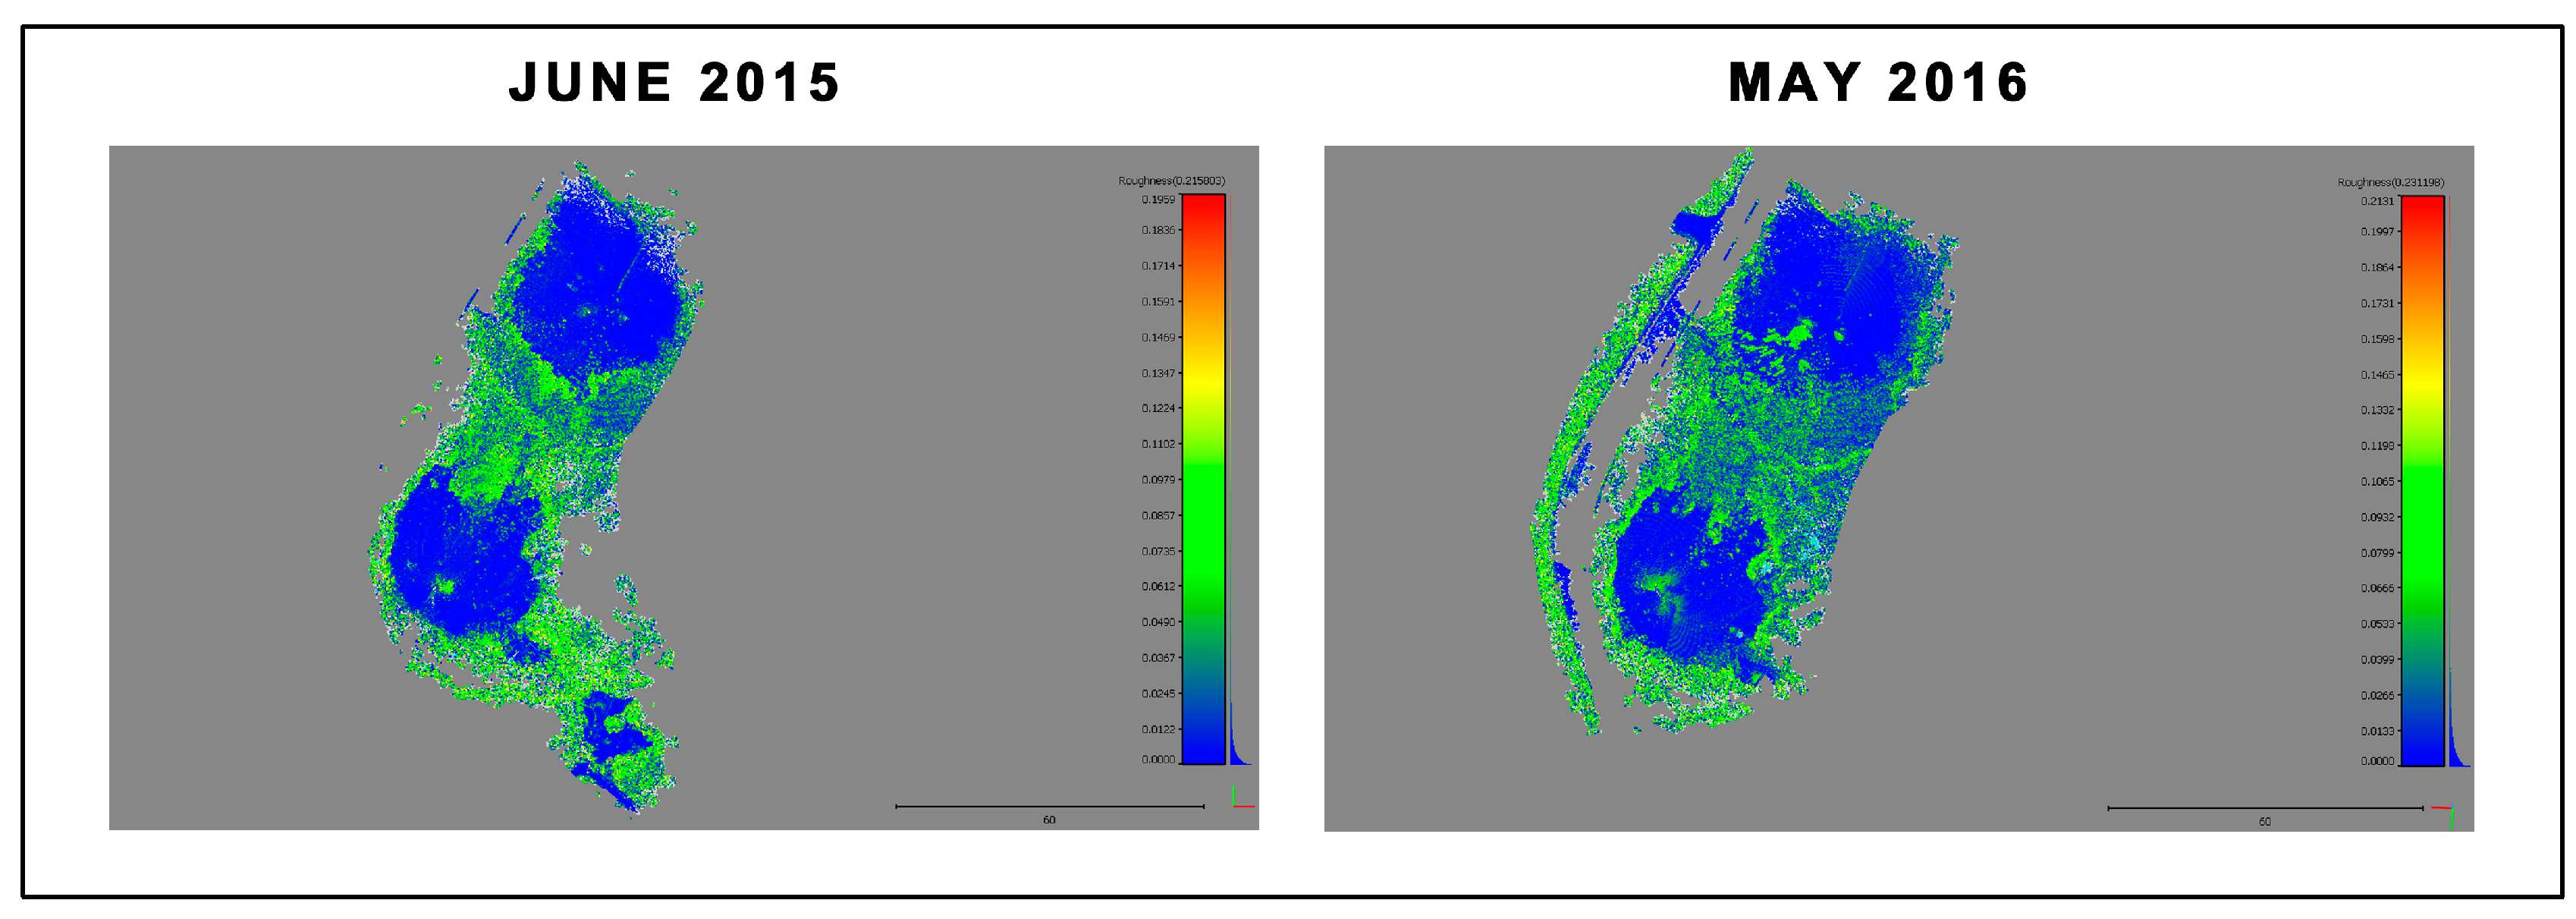
Figure 8.
Levelness (a) andDigital Elevation Models (b) comparison of the terrain of Area 1 derived from terrestrial laser scanning data.
Figure 8.
Levelness (a) andDigital Elevation Models (b) comparison of the terrain of Area 1 derived from terrestrial laser scanning data.
© 2017 by the author. Licensee MDPI, Basel, Switzerland. This article is an open access article distributed under the terms and conditions of the Creative Commons Attribution (CC BY) license (http://creativecommons.org/licenses/by/4.0/).
Share and Cite
MDPI and ACS Style
Santagata, T. Monitoring of the Nirano Mud Volcanoes Regional Natural Reserve (North Italy) using Unmanned Aerial Vehicles and Terrestrial Laser Scanning. J. Imaging 2017, 3, 42. https://doi.org/10.3390/jimaging3040042
AMA Style
Santagata T. Monitoring of the Nirano Mud Volcanoes Regional Natural Reserve (North Italy) using Unmanned Aerial Vehicles and Terrestrial Laser Scanning. Journal of Imaging. 2017; 3(4):42. https://doi.org/10.3390/jimaging3040042
Chicago/Turabian StyleSantagata, Tommaso. 2017. "Monitoring of the Nirano Mud Volcanoes Regional Natural Reserve (North Italy) using Unmanned Aerial Vehicles and Terrestrial Laser Scanning" Journal of Imaging 3, no. 4: 42. https://doi.org/10.3390/jimaging3040042
Note that from the first issue of 2016, this journal uses article numbers instead of page numbers. See further details here.