Sensing Light with LEDs: Performance Evaluation for IoT Applications


Department of Information Engineering, Polytechnic University of Marche, Via Brecce Bianche 12, 60131 Ancona (AN), Italy
*
Author to whom correspondence should be addressed.
†
These authors contributed equally to this work.
J. Imaging 2017, 3(4), 50; https://doi.org/10.3390/jimaging3040050
Submission received: 30 September 2017
/
Revised: 5 November 2017
/
Accepted: 5 November 2017
/
Published: 12 November 2017
(This article belongs to the Special Issue Imaging in Internet of Things)
Abstract
:The Internet of Things includes all the technologies allowing the connection of everyday objects to the Internet, in order to gather measurements of physical quantities and interact with the surrounding environments through telecommunication devices with embedded sensing and actuating units. The measurements carried out with different LEDs demonstrate the possibility of using these devices both as transmitters and as optical sensors, in addition to their ability to discriminate incident wavelengths, thus making them bi-directional transceivers for Internet of Things (IoT) applications, particularly suitable in the context of Visible Light Communication (VLC). In particular, a methodological tool is provided for selecting the LED sensor for VLC applications.
1. Introduction
The new trend introduced by Internet of Things (IoT) devices and networks has brought a new perspective for off-the-shelf products’ research and development. IoT devices, such as smart watches, home appliances, smart lights, wearable devices and more, communicate among themselves mostly over a radio channel. High deployment of IoT wireless networks jointly with former consolidated radio protocols (i.e., WiFi, Bluetooth, etc.) is saturating the radio medium, increasing the interference between wireless devices and electromagnetic pollution. A recent and attractive solution is given by Visible Light Communication (VLC) [1,2], which allows transmitting data over the band of visible light (400 nm–700 nm or 430 THz–700 THz; Figure 1), by the use of illumination systems. VLC technology is designed to exploit the energy used to light up the environment in order to transmit data while illuminating. This particular characteristic of VLC systems allows one to obtain considerable energy savings in data transmission, especially with the use of LEDs as optical sources. Whereas the information is transmitted by light in the visible spectrum, the signal is confined within the surrounding environment that is illuminated, thus reducing interference with other VLC systems. Furthermore, an additional first physical security level for the channel access is also guaranteed with respect to wireless radio networks, since the light is generally bounded by dividing walls of indoor environments. Sending information from a lamp is possible by the use of light modulation schemes, which result in being easier to implement through LED devices instead of bulb lamps. The information is thus related to the presence of light (on/off) by controlling the blinking of the device. The human eye is not able to perceive the switching of the LED if the blinking rate of the LED transceiver is greater then 50 Hz [3], but it perceives a static image of the LED lighted. To avoid harming human eyes, a frequency of at least 200 Hz is recommended [1].
A practical implementation ensuring this result is the IEEE 802.15.7 standard [2] that defines an appropriate idle sequence (Figure 2) to be used when the device is not transmitting. During the idle sequence transmission, the LED appears as switched on with a light intensity proportional to the idle sequence’s duty cycle. Otherwise, during data transmission, the compensation symbols maintain a constant brightness.
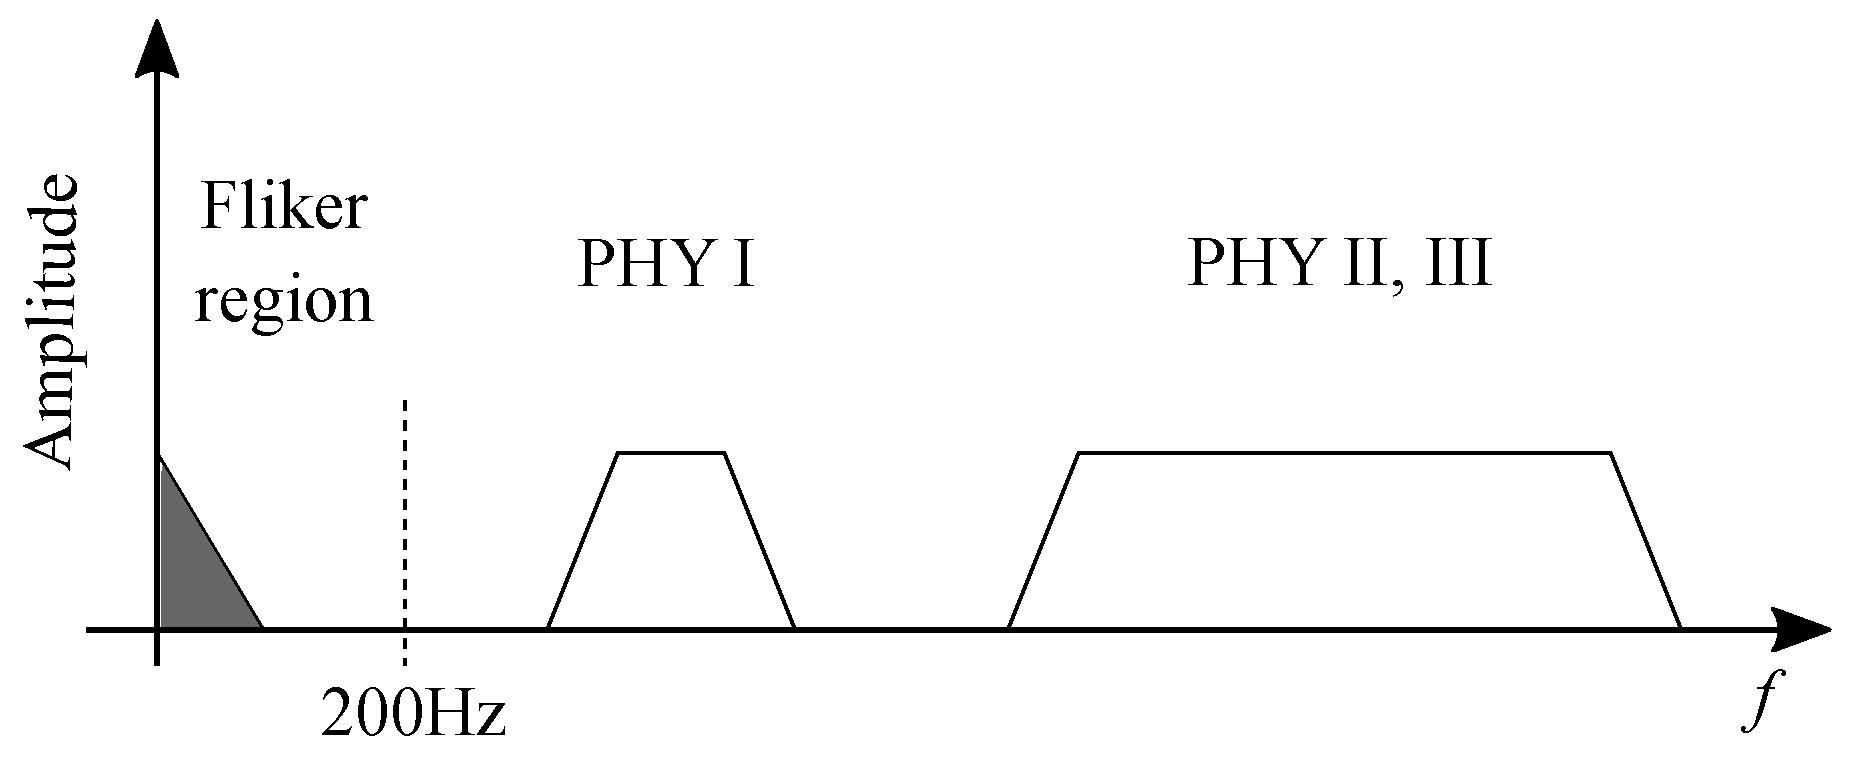
During the off time of the idle sequence (Figure 2), the standard allows the data transmission on the optical channel, using the On-Off Keying (OOK) modulation with a Variable Pulse Position Modulation (VPPM) for the physical levels PHYI and PHYII (see Figure 3) or a Color Shift Keying (CSK) [2,4,5] in the PHYIII band. Sending data with the above modulation techniques requires the control of the dimming of the light source, in such a way so as to maintain the user-selected brightness settings. This result is achieved by inserting compensation symbols in the frame and adjusting the pulse width of the transmitted symbols.
To transmit data over an optical channel, wired or wireless, an optical source (laser or LED) and a sensor able to convert the incoming light into an electrical current are necessary. This operation is generally performed by photo-diodes, but it has been proven that LEDs are adequate [6] to achieve such conversion. Moreover, the technological evolution of LEDs, in terms of luminous efficacy, switching speed, energy savings, durability and low manufacturing costs [7,8], makes LEDs (phosphor converted (PC), multi-chip, , resonant cavity (RC) [9], and more) suitable for transmitting data in the context of VLC applications. Using such devices, it is also possible to design LED-to-LED communication [10,11,12] and then reduce the hardware requirements of VLC systems, merging the transmitter and receiver into a single device.
1.1. LED as Optical Receiver
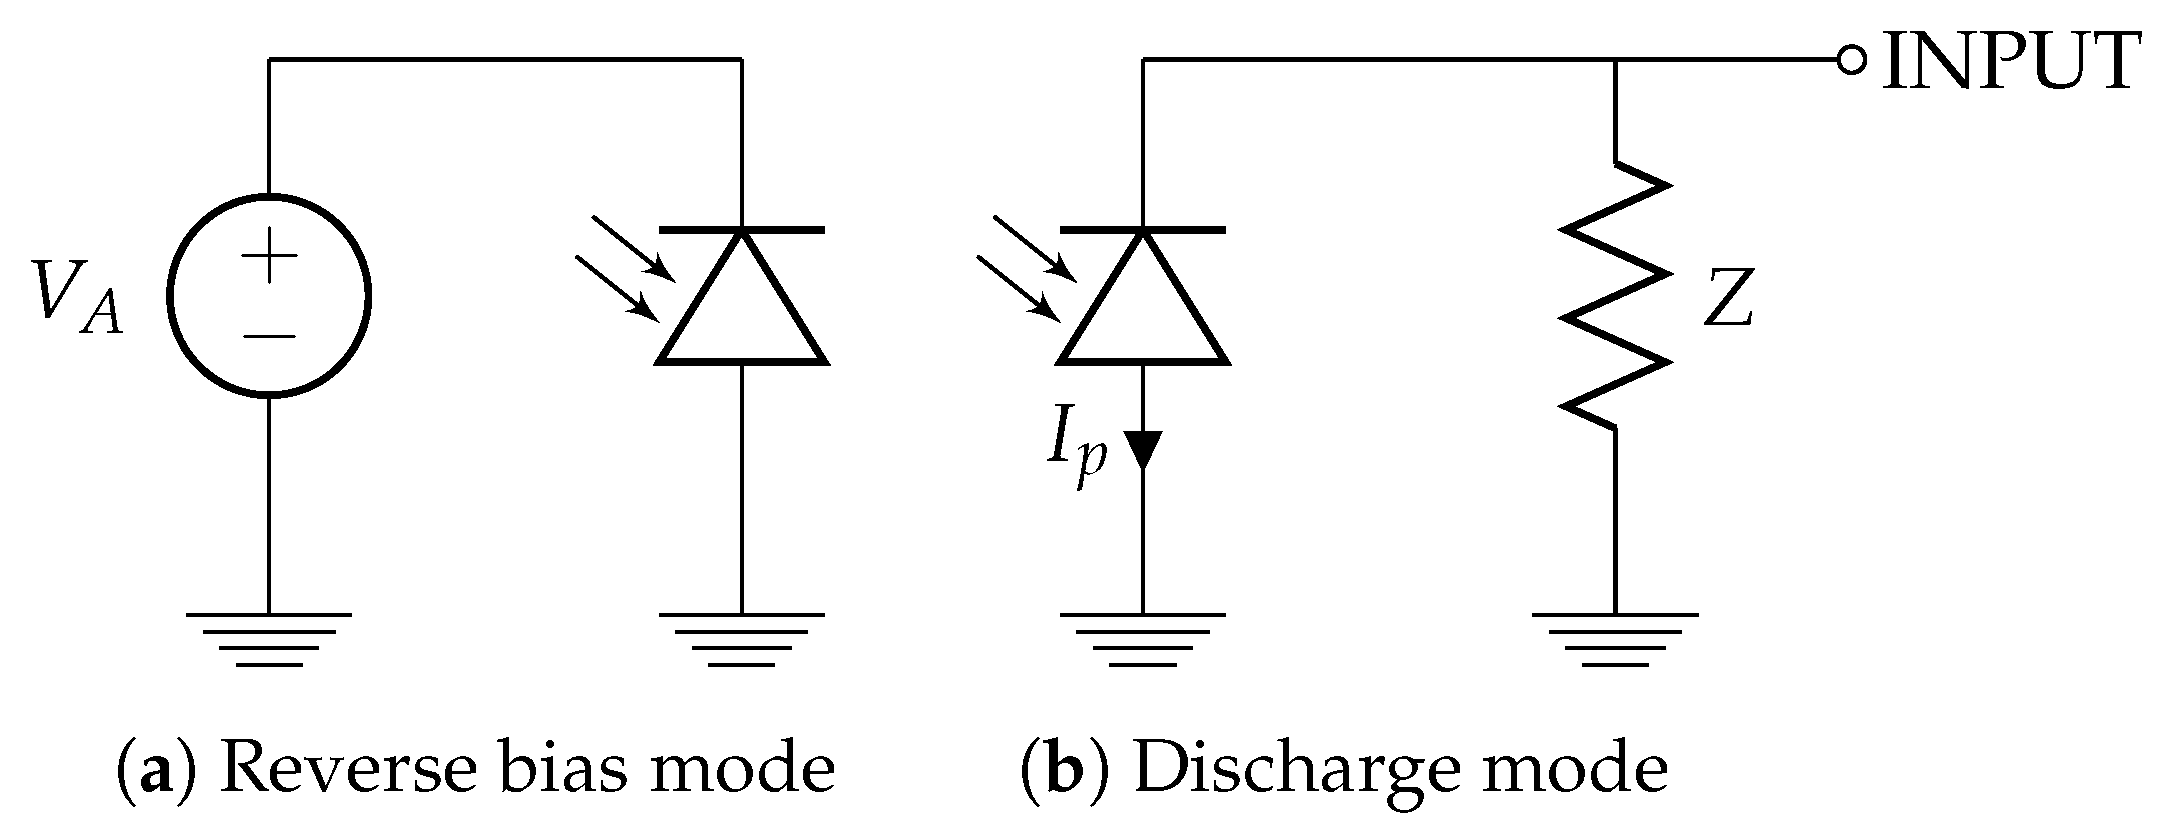
The LED, as any other device based on semiconductor technology, reacts to applied external electromagnetic fields; in particular, the incidence of a photon on the semiconductor causes the generation of an electron-hole pair (photoelectric effect), thus an electric current. The incident optical power on the semiconductor (pn junction) is usually measured by using a current-voltage conversion circuit (Transimpedance Amplifier (TIA) [13]), where the photo-current is given by , with R the responsivity of the semiconductor device. Substituting the pn junction with an LED diode, the TIA circuit allows one, in the same way, to measure the voltage proportional to the incident optical power on the device. However, in [14] is presented an alternative method to measure the photo-current, i.e., the time required to discharge the capacitance of the LED in reverse biased mode (photo-conductive mode), as depicted in Figure 4. This figure represents the two phases necessary to make the brightness measurement with the LEDs used, starting with the device under reverse bias mode (Figure 4a), which charges the junction capacitance, then switching to discharge mode (Figure 4b) by setting the micro-controller pin connected to the LED to INPUT mode. It is possible to record the time required to discharge the capacitance of the diode; this time is thus correlated with the photo-current () on the LED or rather with the incident optical power. The different discharge time values of the LED capacitance are then compared with this method, where a microcontroller is used to sample the discharging voltage, which is related to the photo-current value. This method allows one to distinguish the ambient light from the light of a transmitting optical source. Moreover, the discharge time can also be controlled modifying the value of the reverse voltage applied, since it regulates the capacitance dimension [6,15] and the photo-current gain [16]. An increased reverse voltage on the LED reduces the capacitance and increases the photo-current, leading to a boost of the operation speed. For VLC network applications, it is also useful to study the sensitivity of a given LED to different wavelengths (colors), that is to evaluate the relation between the incident light frequency and the respective photo-current value. This leads to the possibility of using this simple device as a transceiver in order to realize bidirectional communication for IoT applications.
1.2. Related Works
The applications of VLC technology are numerous [17], and many research works have been conducted on the subject. Disney Research has studied the possibility of using LED-to-LED communications for toys or entertainment. In fact, in [10,18,19], the physical and MAC layers, the synchronization and flicker issues are analyzed. Studies have been conducted on the use of VLC systems for lighting and sending data: an LED-to-LED system, in combination with coding and modulation techniques (Manchester, OOK) to obtain a good trade-off between lighting and data rate, is shown [13]. Conversely, the European research project Home Gigabit Access (OMEGA) aims to study domestic network infrastructures combining wired technologies, Wi-Fi and VLC. In [20], the possibility of merging VLC with Wi-Fi to reduce the load on the radio link is studied.
A system for estimating the color received from an LED in photo-voltaic mode is described in [21] where two evaluation methods are proposed, the first based on the use of thresholds on a sensitivity matrix S, while the second is based on the Discrete Wavelet Transform (DWT).
2. Light and Color Detection
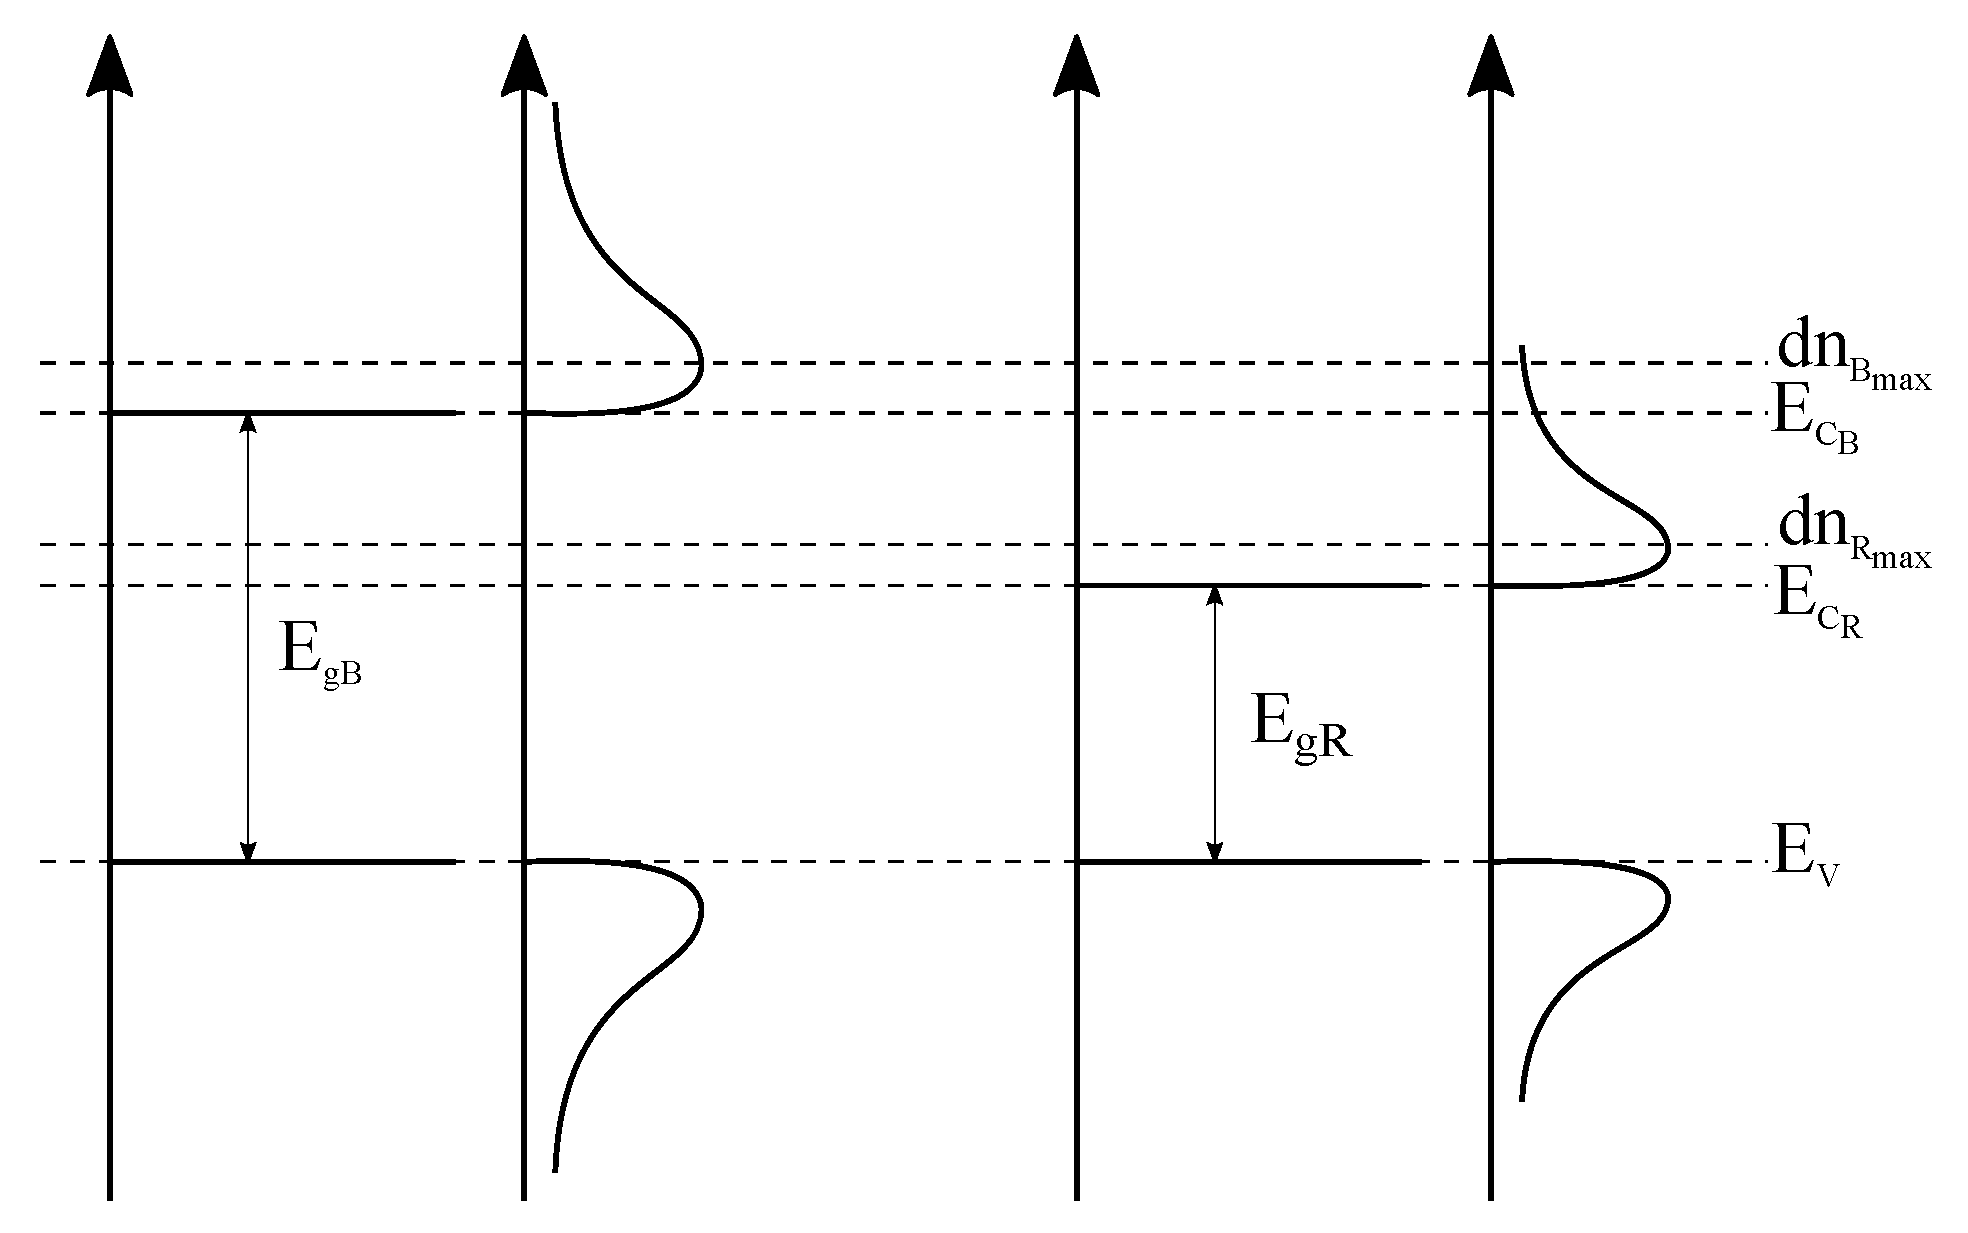
LEDs are devices designed to emit light when stimulated by an electric current. The color of the light emitted by the LED depends on the energy lost from the electron in the conduction band that recombines with a hole in the valence band. The lost energy E must be conserved; thus, it is converted into thermal energy and into a photon of energy , which corresponds to a specific color with frequency f (see Figure 5). The minimum energy of the emitted photon corresponds at least to the energy gap of the semiconductor (). The energy lost by the electron is adjusted in a manner to produce the color chosen, and this is done by the use of the proper semiconductor materials and doping profile (see Table 1 and Figure 6). The probability of having the recombination of an electron is higher when it is possible to find more electrons. Figure 6 shows an example of the electron concentration distribution for red and blue LEDs. Thus, the energy of the photon emitted is not exactly equal to the energy gap , but it corresponds to the energy level of the electrons’ peak concentration . Deviations from that energy level produce variation of the emitted wavelength () [22]. When the LED is biased with a forward current , the photons will be emitted at the frequency f corresponding to the energy () released by electrons. Using the LED as an optical sensor [10,13,14,19], the incident photons will disclose energy to the semiconductor to generate electron-hole pairs, namely the photo-current.
In order to analyze the LED behavior when a photon of energy (or frequency) different from that emitted affects it, the limit case given by the colors red and blue, which are located at the opposite side of the visible light spectrum (Figure 1 and Figure 5) at the respective frequencies of about 454 THz and 652 THz, is considered.
When the red LED is in reception mode (Figure 4a; reverse bias or photo-conductive mode) and a red light is illuminated on it, there is a photo-current proportional to the incident red optical power , , with R the responsivity of the device. Therefore, if a blue incident light is considered, , a photo-current is generated, and this is due to the lower responsivity of the red LED to blue photons. Such sensitivity is due to the probability that the incident photon can generate an electron-hole couple, and this depends on the energy of the photon itself, the material of which the semiconductor is composed and also on the junction dimension.
3. Results and Discussions
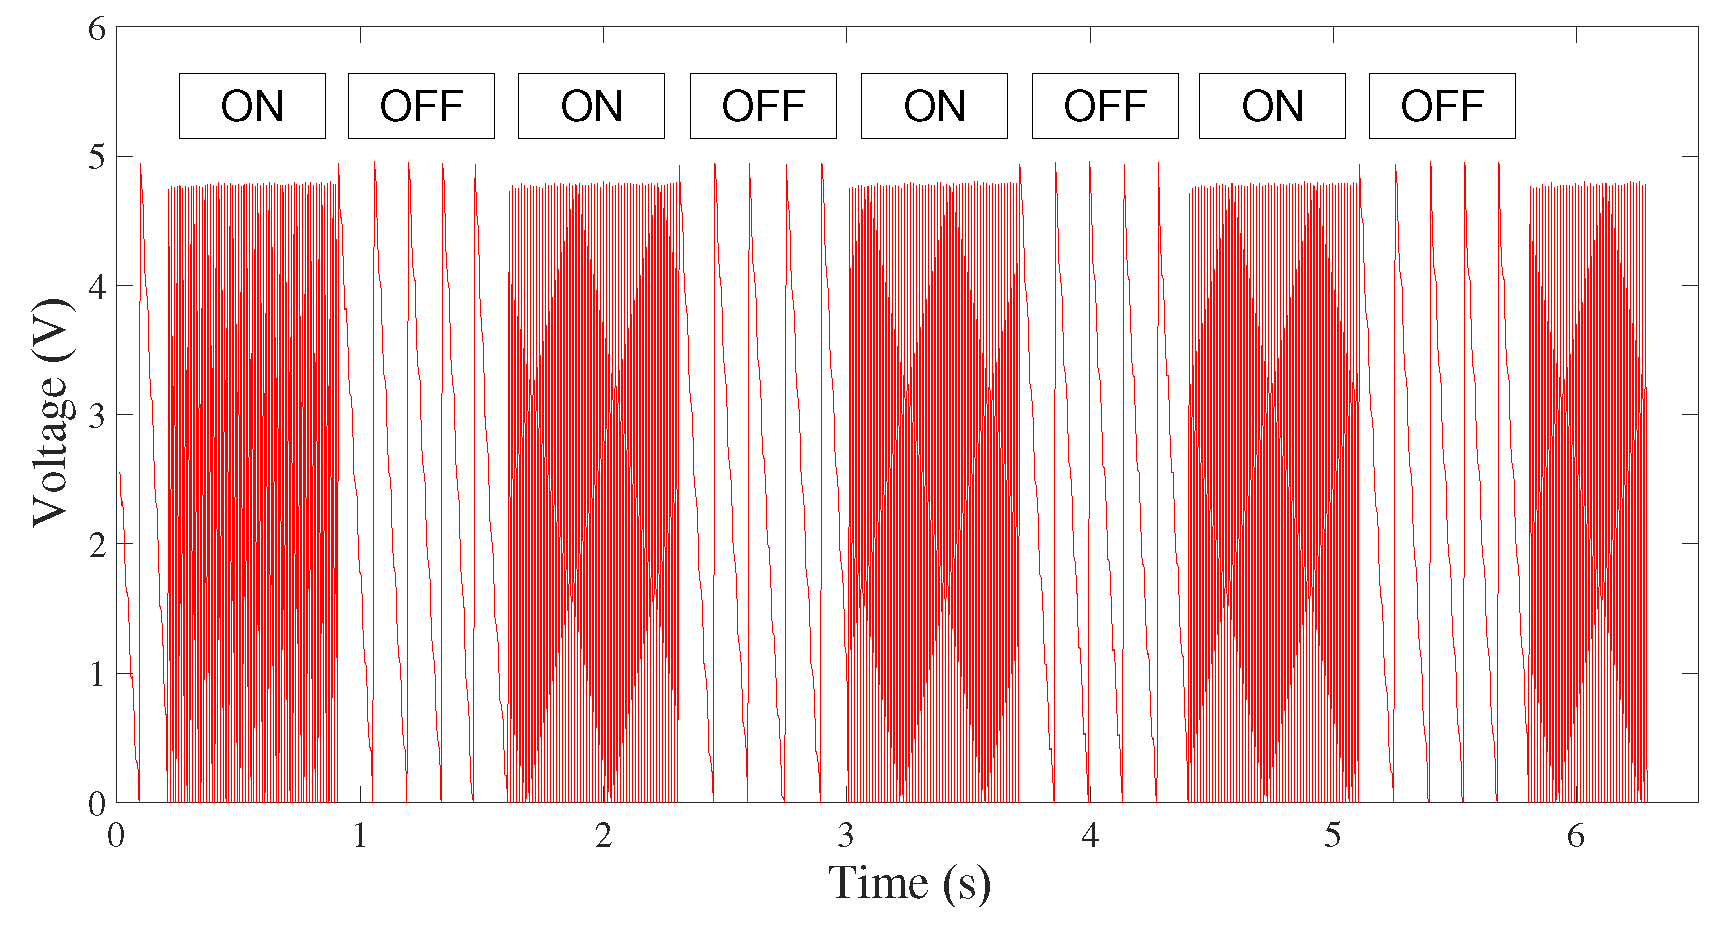
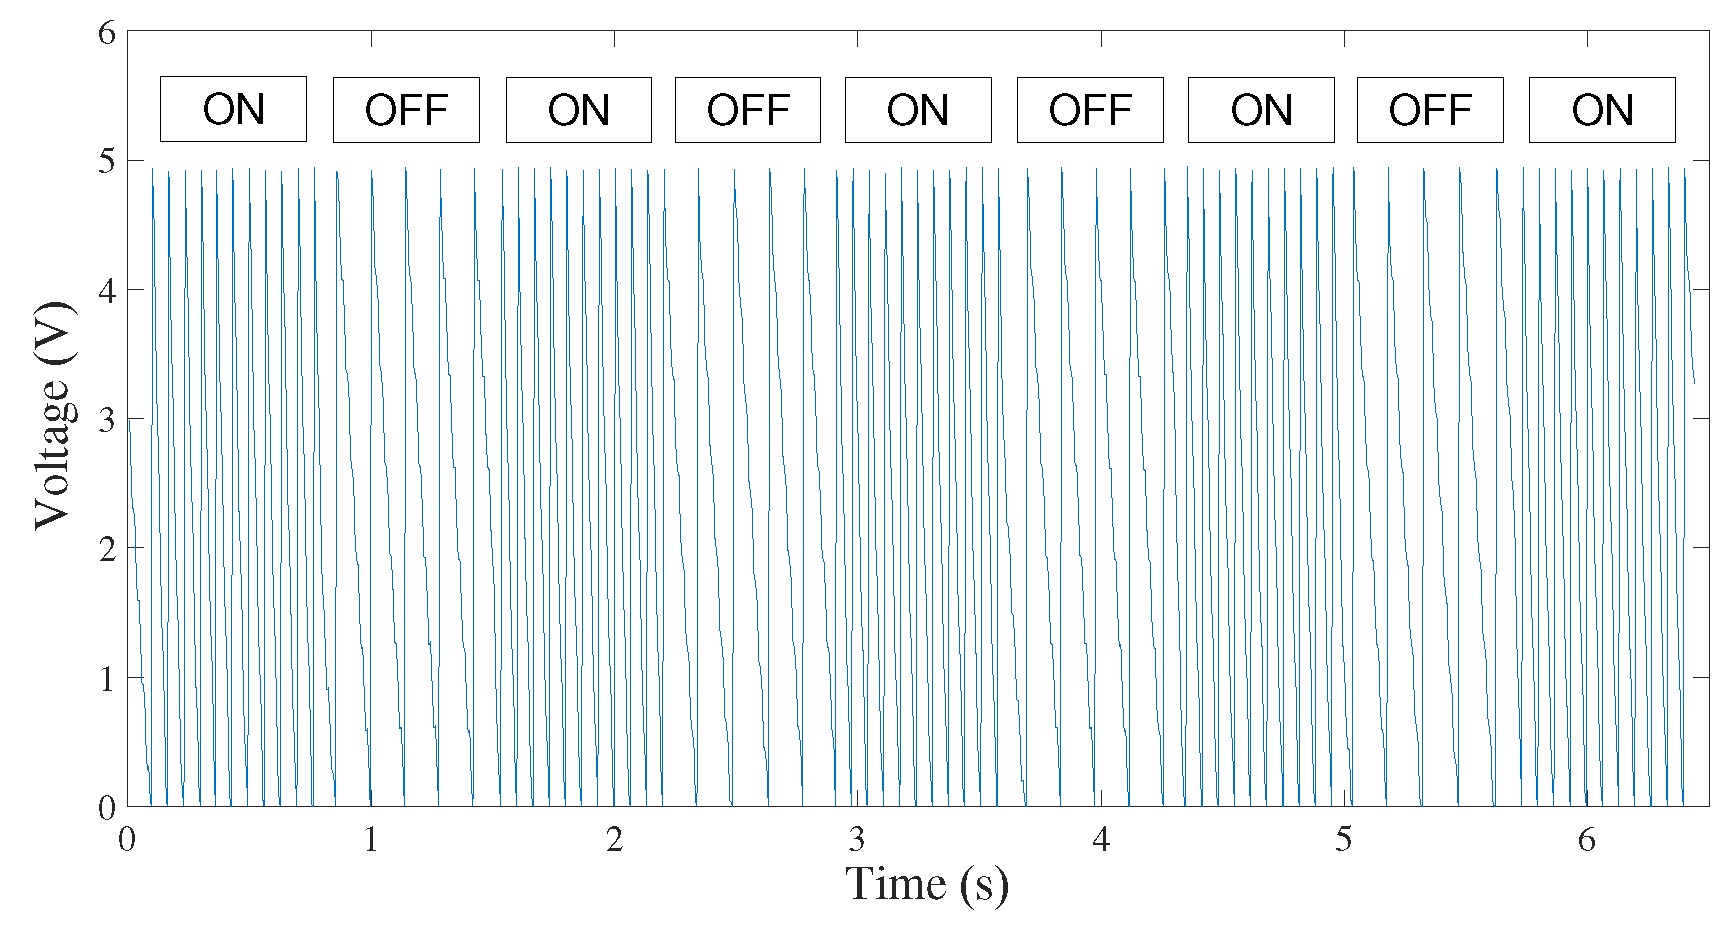
The results obtained from the measurements are depicted in Figure 7 and Figure 8, where it is possible to observe that the trends of the detected voltages differ significantly when the transmission is realized with a red- or blue-transmitting LED, since each color corresponds to different energy values. The different voltage trends during the acquisition of the ON signal in Figure 7 and Figure 8 are due to the different discharge times of the reverse polarization voltage , which is supplied to the LED during the reception phase of Figure 4a. The duration of the voltage discharge is given by the current circulating on the semiconductor and the size of the capacity that is placed on the device, due to the polarization and material characteristics. The discharge time can be measured directly from the figures, and the value obtained is ms for the red-to-red link and ms for the blue-to-red link.
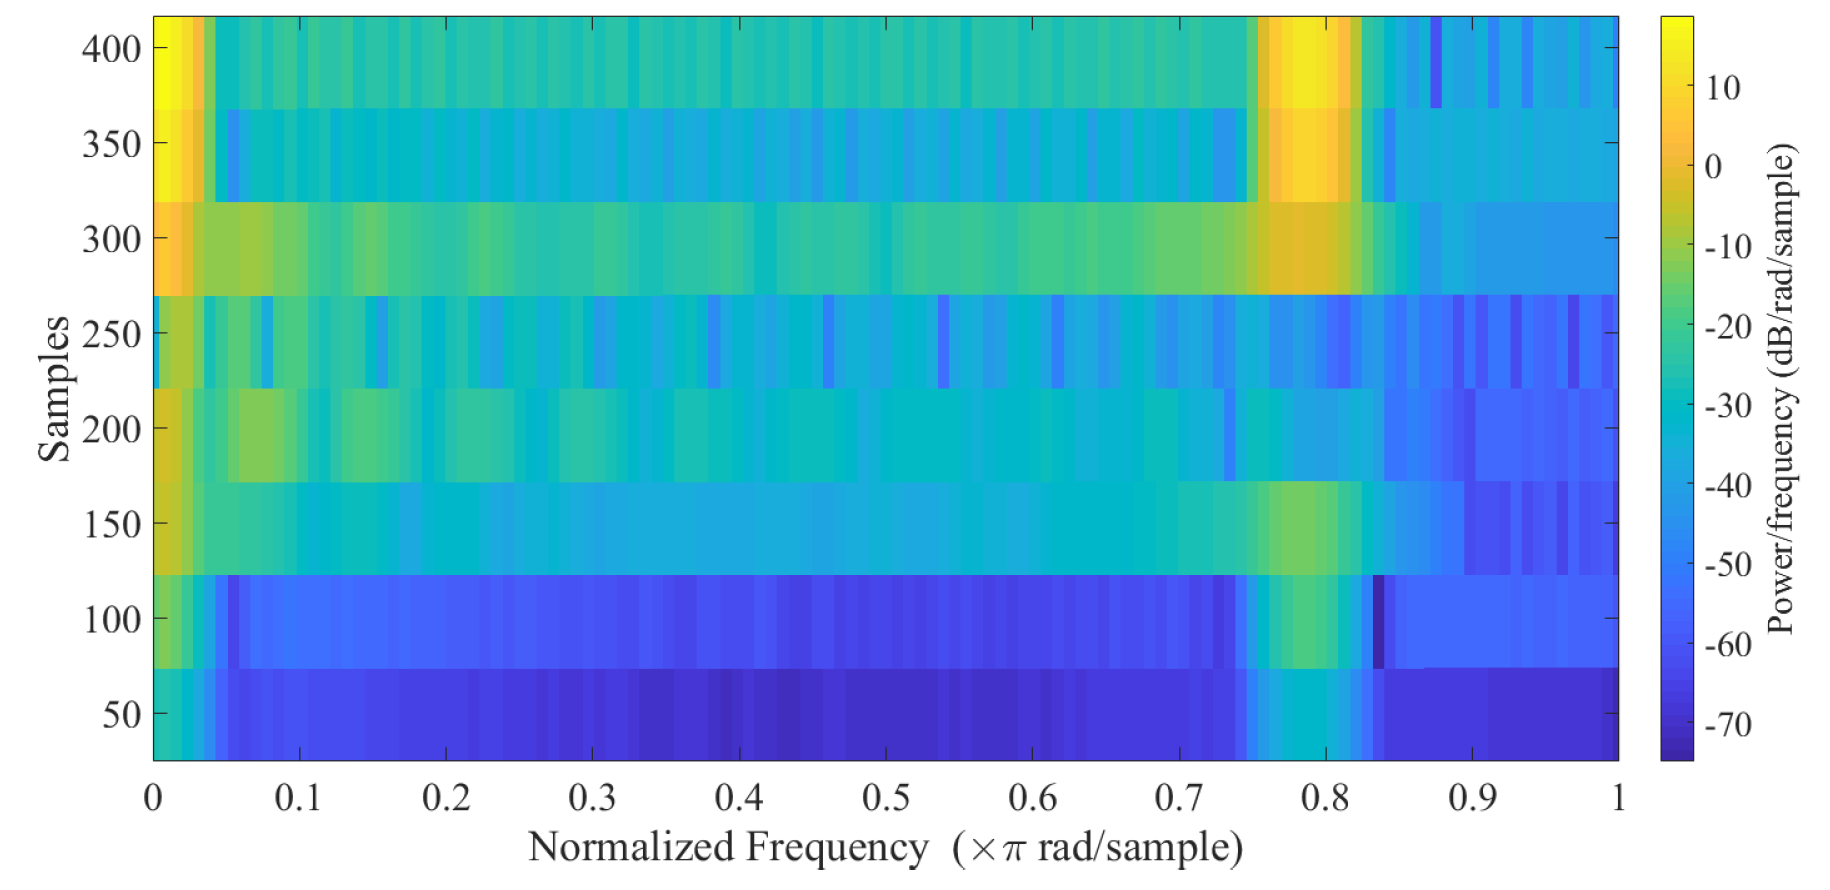
The two transmitters can be distinguished by the slope of the curves (Figure 7 and Figure 8); in fact, the red LED’s slope in the ON state is V/s, while that of the blue one is V/s; finally, the slope of the OFF state is a comparison term and is equal to V/s. To complete the analysis of the signal produced by the receiving red LED, Figure 9 represents the spectrogram of the Short-Time Fourier Transform (STFT) of the signal. In order to reduce the windowing, the flat top function is applied to the signal from the first ON sample to the last OFF sample, in order to make the endpoints of the waveform connected together. It is possible to notice the presence of the DC component, as well as the frequencies of the different discharge trends, which are = (146.6 ms)−1 = 6.8 Hz and = (12.4 ms)−1 = 80.1 Hz.
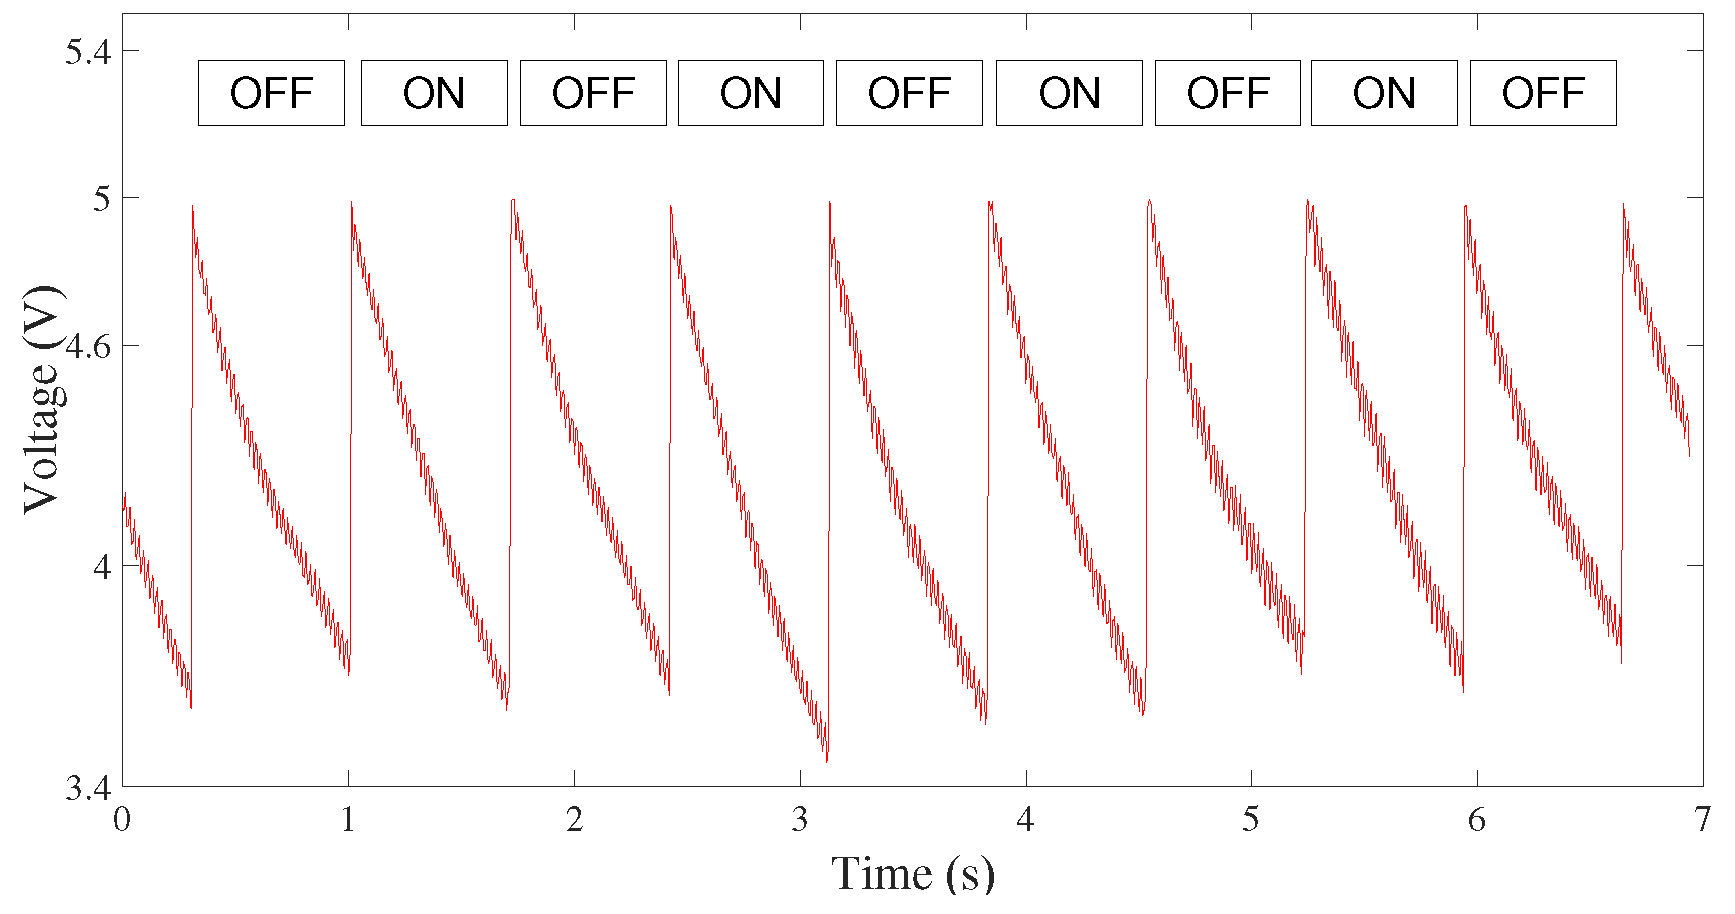
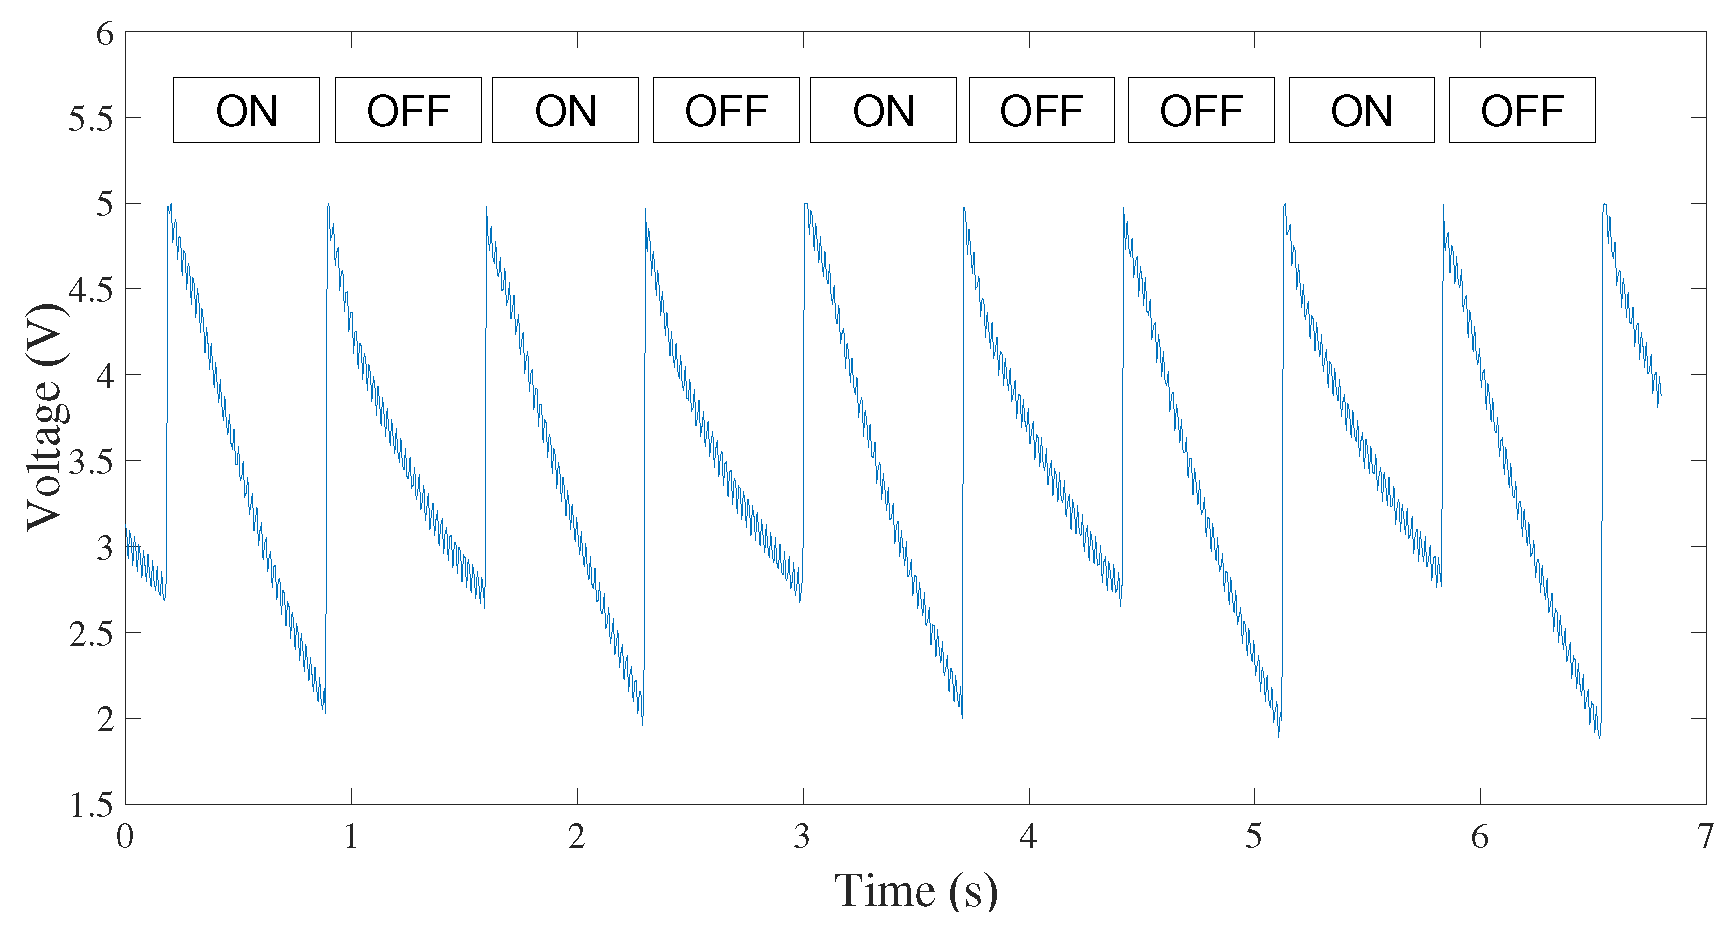
The dual test is the evaluation of the optical signal reception with the blue LED when the transmission is made by a red or blue optical source. A similar behavior of the red-to-red link is expected for blue-to-blue communication, whereas a completely different scenario is conceivable for the red-to-blue case. Figure 10 and Figure 11 show the reception of visible optical signals on a blue LED. In Figure 10, the red-to-blue link is represented, while in Figure 11, the blue-to-blue link is depicted. It is noticeable that the discharge time for the blue receiving LED is higher than that of the red LED, which is due to the different physical characteristics of the semiconductors leading to different values of the capacitance of the diode. In fact, as described in [6,12,15,23], LEDs act as wavelength-selective receivers for wavelengths shorter than they radiate with a sensitivity range not exceeding 100 nm. This means that the blue LED is less sensitive to other colors [23], since blue has the lowest wavelength emission peak in the visible spectrum (Figure 1 and Figure 5). To characterize this optical link, the discharge time of the blue LED for both transmitting colors is estimated. In the first case (Figure 10), the red-to-blue link is represented, where a perceivable difference between the ON and OFF states of the transmitting red LED is not observable. This is due to the fact that, with high probability, the energy given by the red photon to the receiving LED is not enough to generate an electron-hole pair since . To evaluate the characteristics of this red-to-blue link, the discharge time of the blue LED is not taken into account since its duration is greater than the ON/OFF symbol time ( ms); but the slope is considered, and the respective values are V/s and V/s.
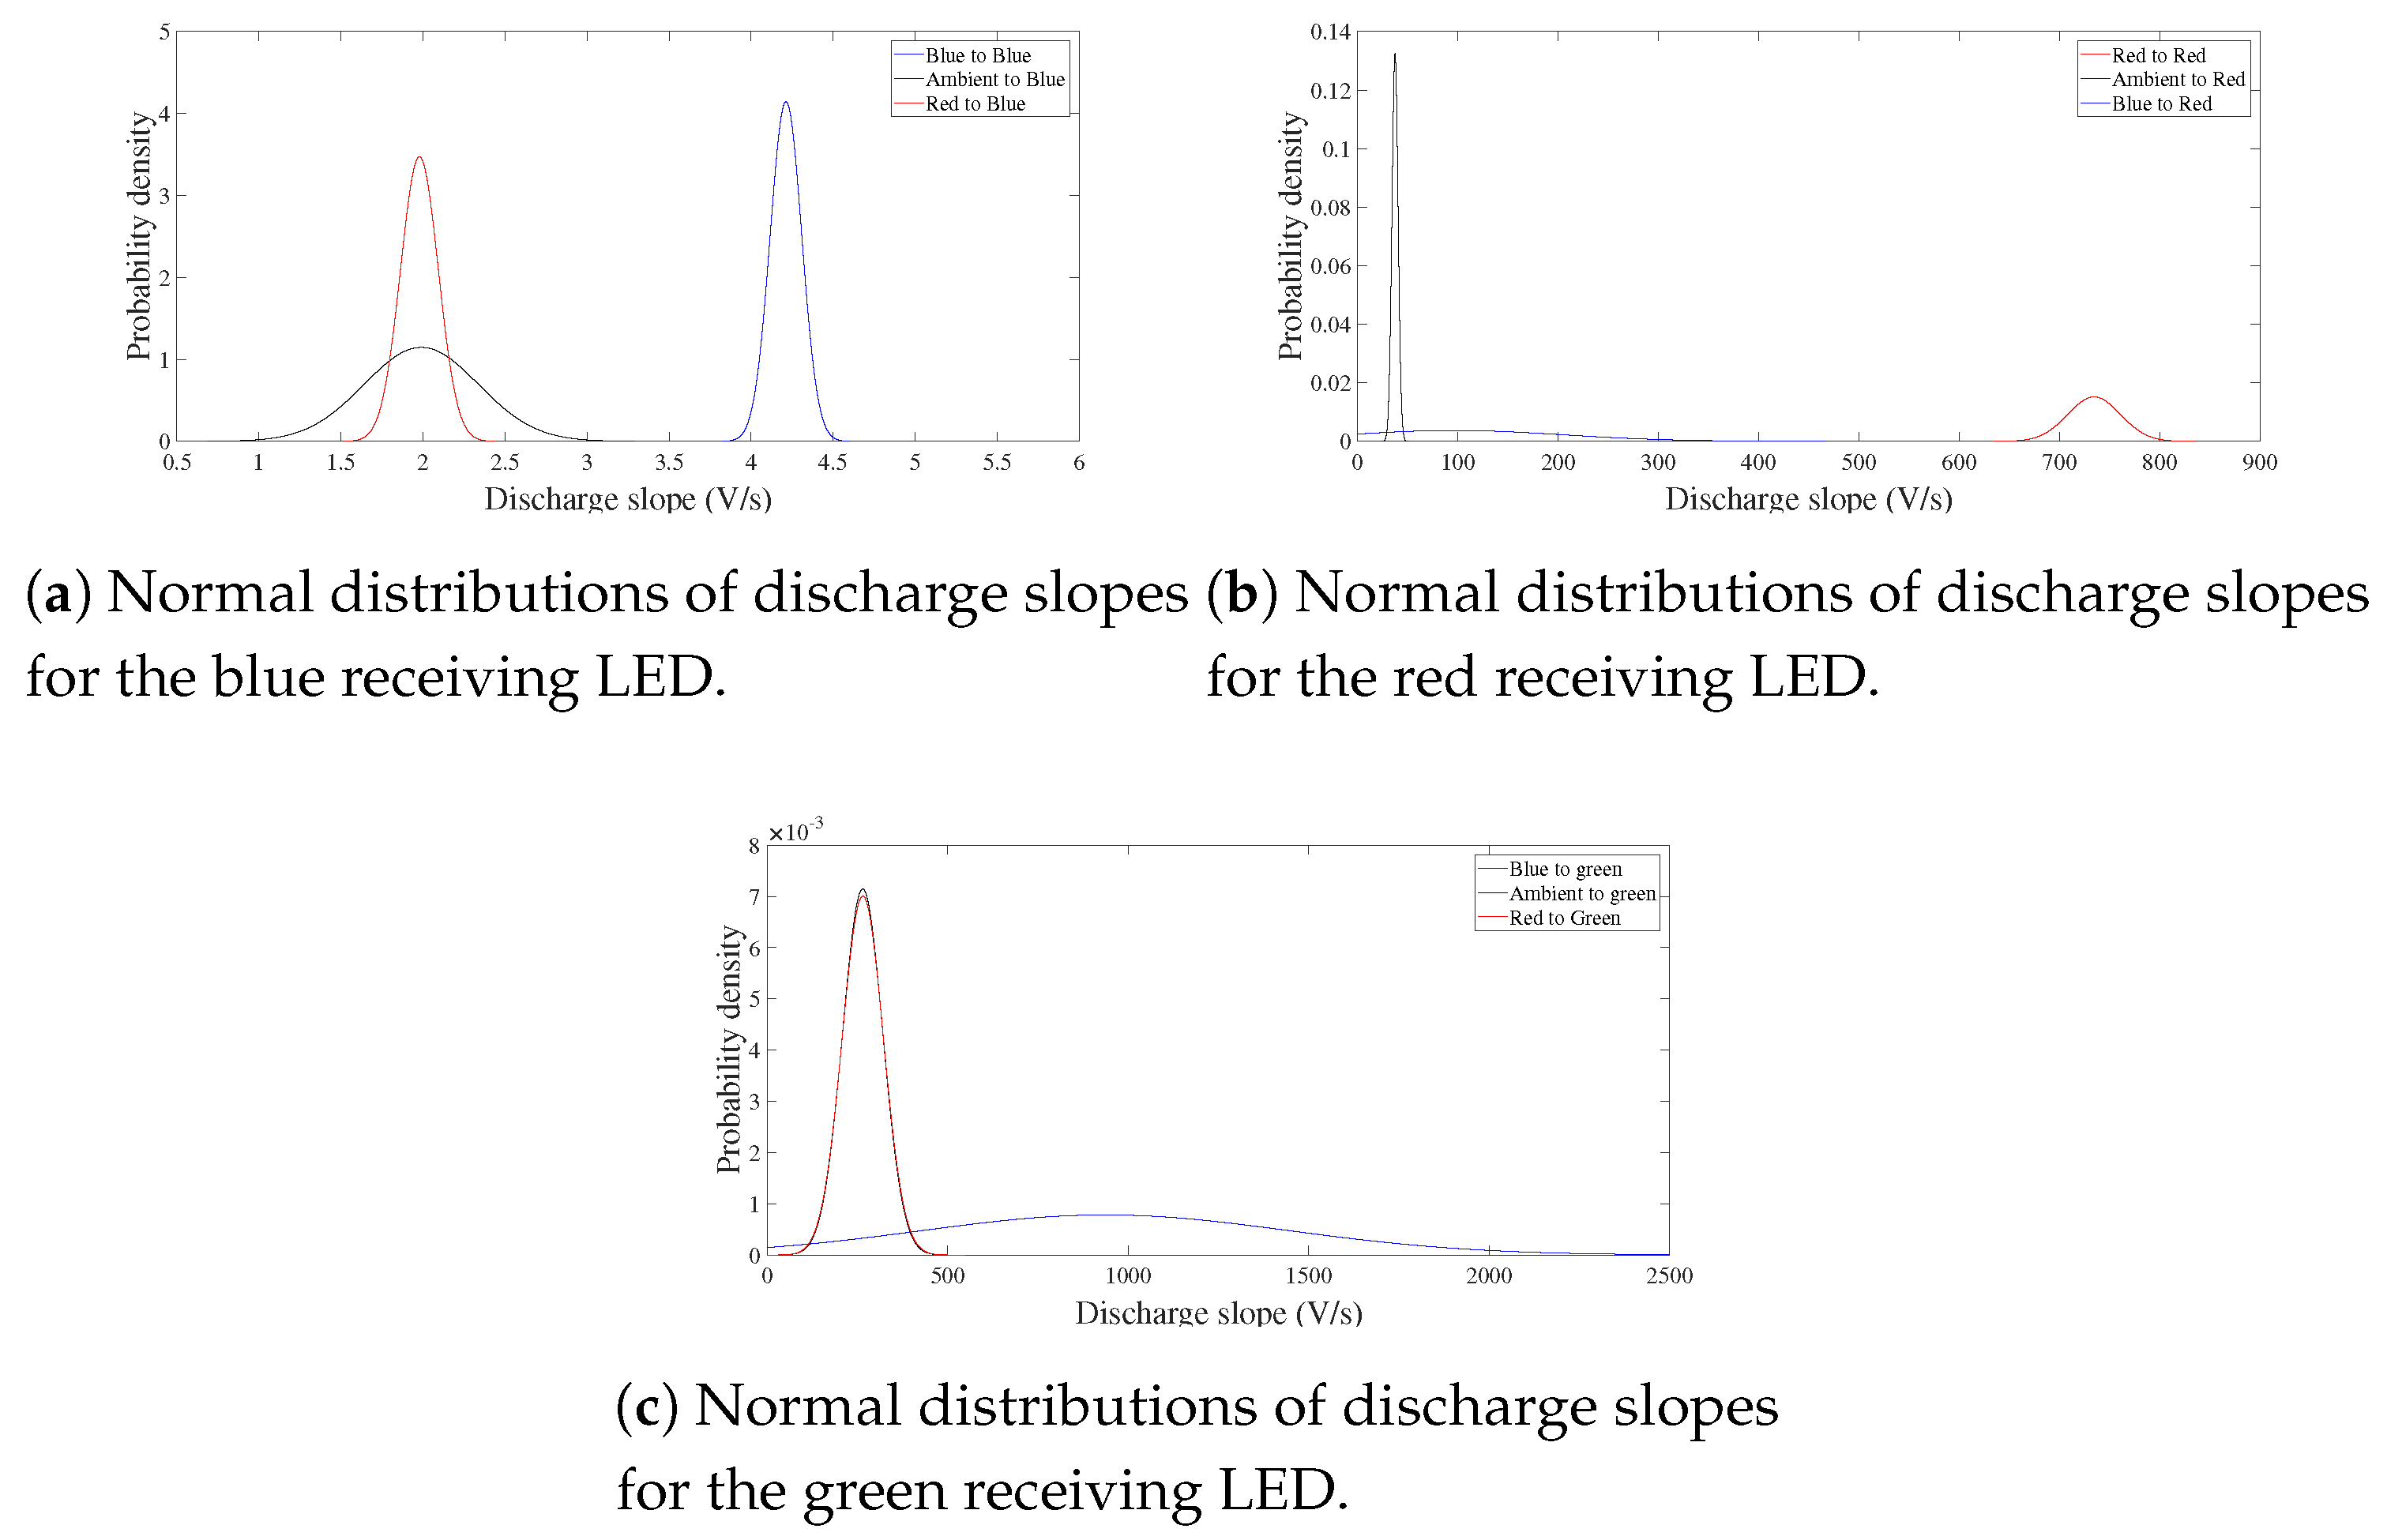
The blue-to-blue signal is depicted in Figure 11, where it is possible to distinguish between the ON and OFF states simply by observing the different slopes, since now, the energy of the blue transmitted photon has a better probability of generating an electron-hole pair in the semiconductor sensing device and thus to discharge the capacitance faster. The values obtained from the measurement of this link are V/s and V/s. A deep analysis is conducted to evaluate the statistical differences between the OFF and ON states of the blue receiving LED (Figure 10 and Figure 11). For each optical source (red, blue and ambient), 4000 discharge slopes on the receiving blue LED are sampled to calculate the mean and standard deviation of the curves. These results are shown in Figure 12a as three normal distributions, each one representing the statistical pattern of a specific link. The overlap of the red-to-blue and ambient-to-blue curves indicates that there is not a statistically-significant difference between these discharge trends. In fact, the blue LED is less sensitive to red sources, since red’s wavelength is greater than blue [6,15,16]. For completeness, the normal distributions for red (Figure 12b) and green (Figure 12c) receiving LEDs are also shown.
3.1. Light Detection with RGB LED
In the previous section, the results presented show that a monochromatic LED can also function as a light sensor and how it works when affected by different colors. It is thus interesting to analyze the behavior of an RGB LED (Figure 13) when stimulated by one or more incident colors, so evaluating the possibility of using this type of device for transmitting and receiving VLC modulations, like CSK [2,4,5].
In fact, CSK modulation is used to map the information into red, green and blue color intensities and to make the appearance of the light source as white light by a proper dimming schema; thus, an RGB LED is the right light source for this modulation technique. To use the RGB LED as an emitter and receiver, the evaluation of its behavior as an optical sensor is necessary. Two visible optical links with a transmitting red LED (Figure 14a) and a blue LED (Figure 15a) are realized for investigating the RGB LED sensor response to the two opposite wavelengths of the visible spectrum, as done for the monochromatic LED.
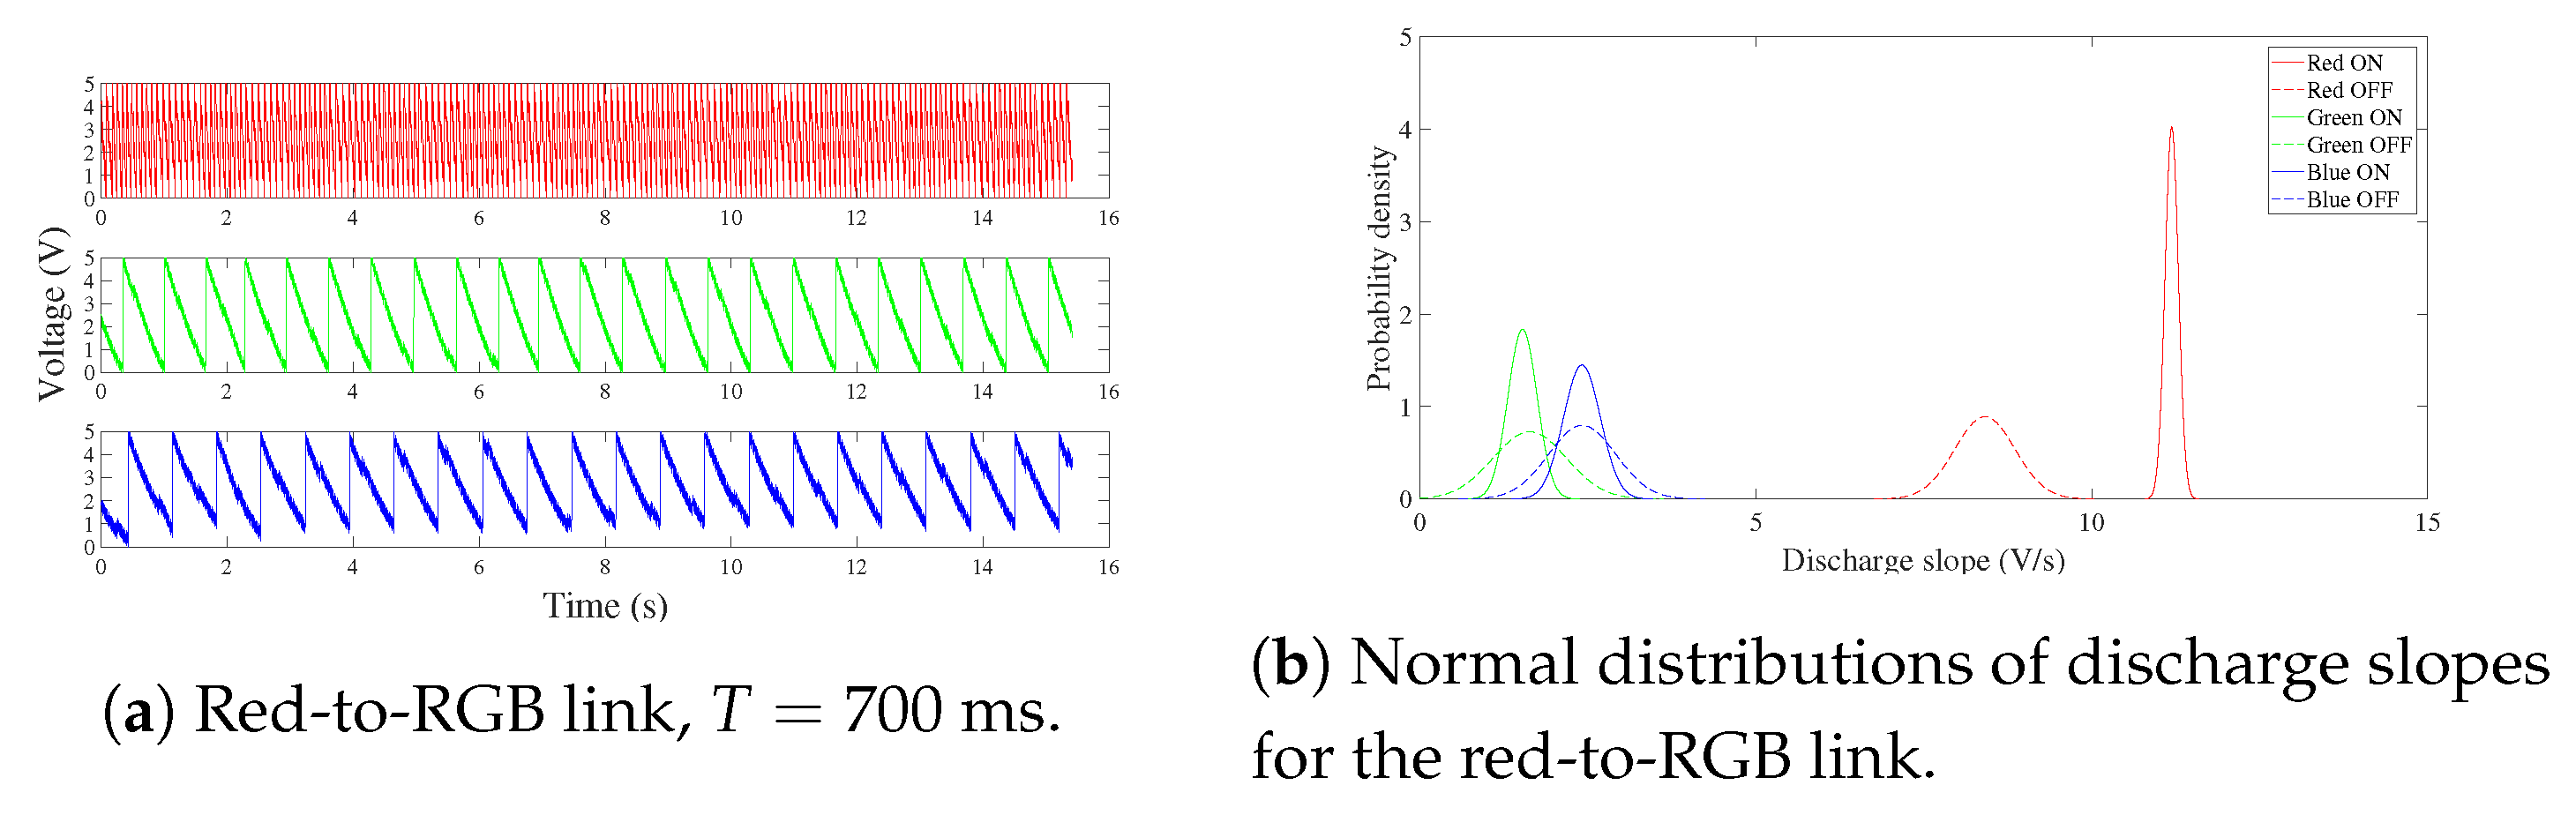
The red-to-RGB link is depicted in Figure 14a, where the measurements are realized following the schema represented in Figure 4. The RGB response shows the ON/OFF pattern received that is transmitted by the red LED. For the red channel, it is possible to distinguish between the ON and OFF states of the transmitting source, whilst the green and blue channels are not able to correctly discriminate ON and OFF. In fact, Figure 14b shows the statistical analysis of the red-to-RGB link, where the green and blue states overlap, while the ON and OFF distributions of the red channel are separated by six-times the standard deviation of the red OFF state. Nevertheless, by processing the signals sampled, it is possible to notice that the red diode has a better response to the red incident light as discussed for Figure 7. Referring to Figure 14a, the slope values are V/s, 1.52 V/s and V/s.
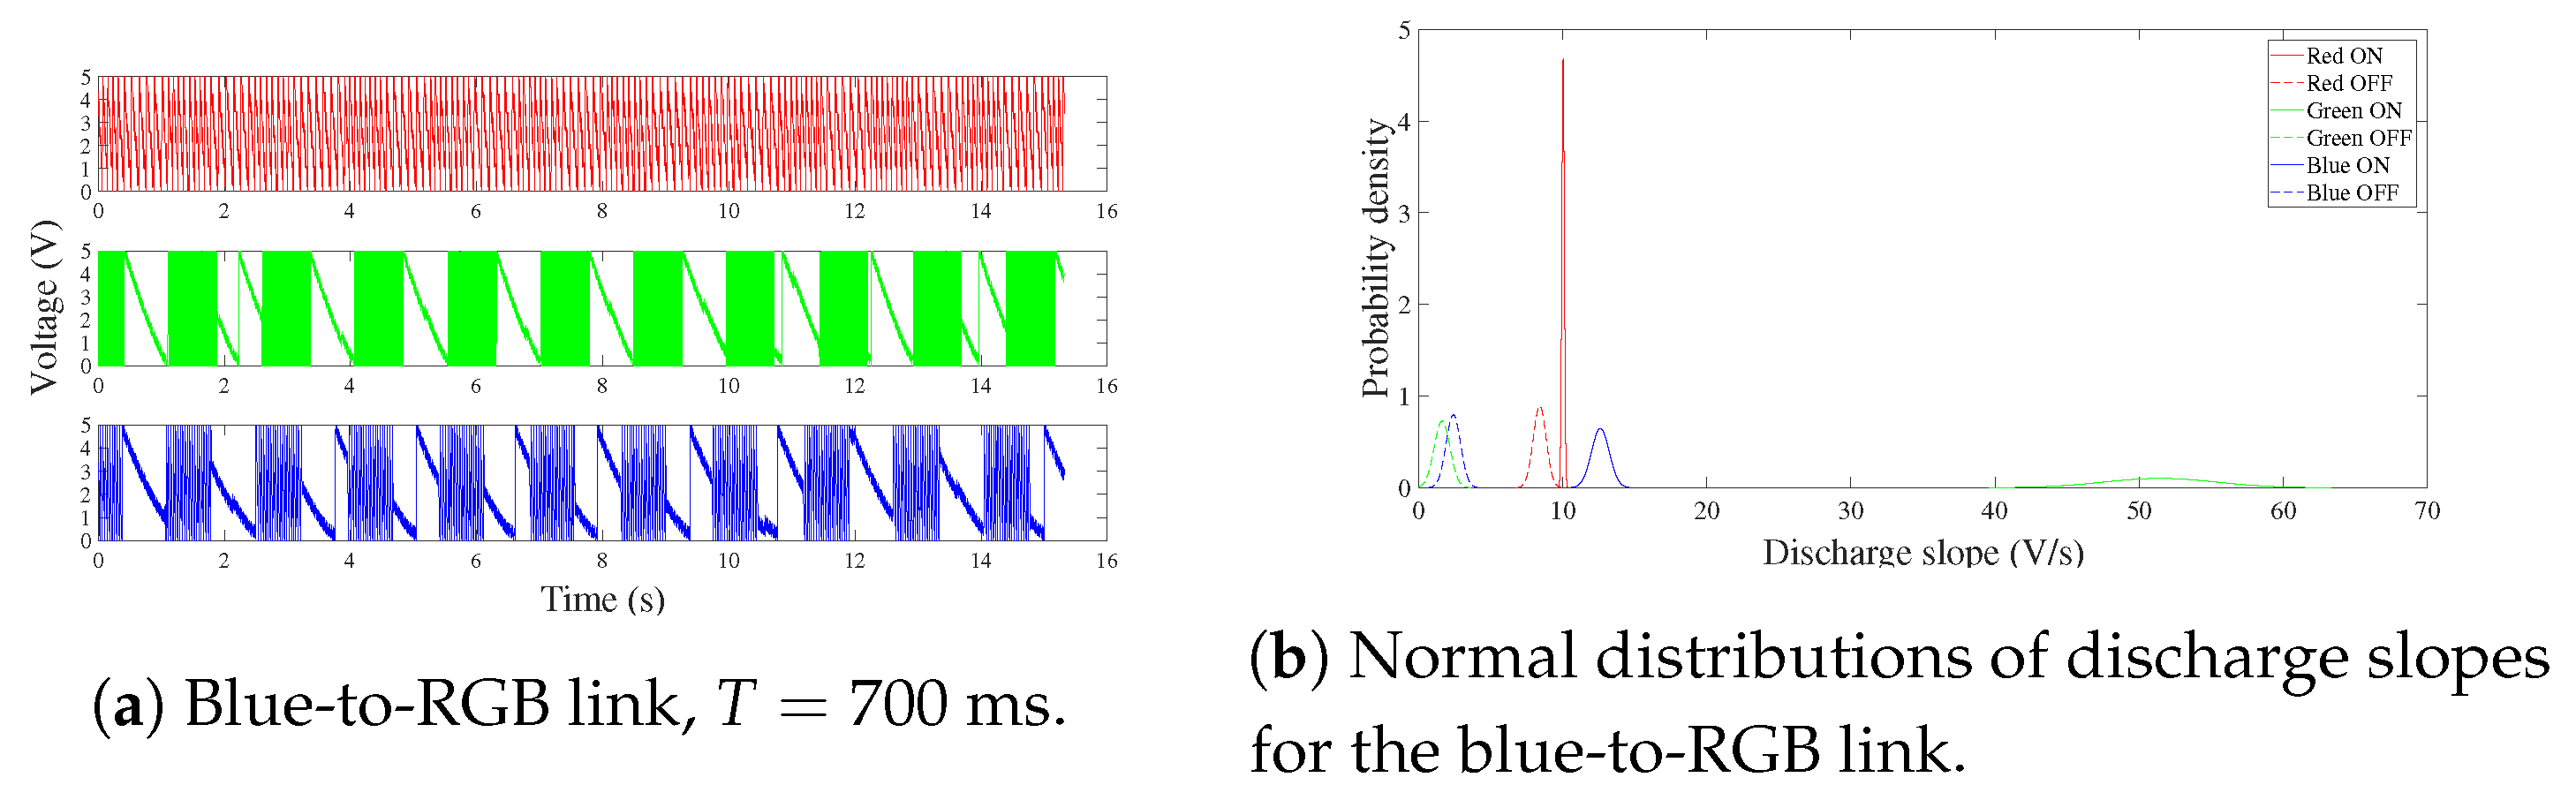
Since LEDs are able to detect wavelengths shorter than they emit in a range not exceeding 100 nm [6,12,15,23], the green and blue channels are able to correctly detect the transmitting blue LED for the blue-to-RGB link better than the red channel as shown in Figure 15a. This behavior of receiving LEDs is also marked during the OFF state. In fact, since the red’s wavelength is the longest, the red LED can better detect the ambient light with respect to the green and blue, leading to a faster discharge during the OFF state. The resulting parameters are V/s, V/s and V/s.
3.2. Semiconductor Measurements
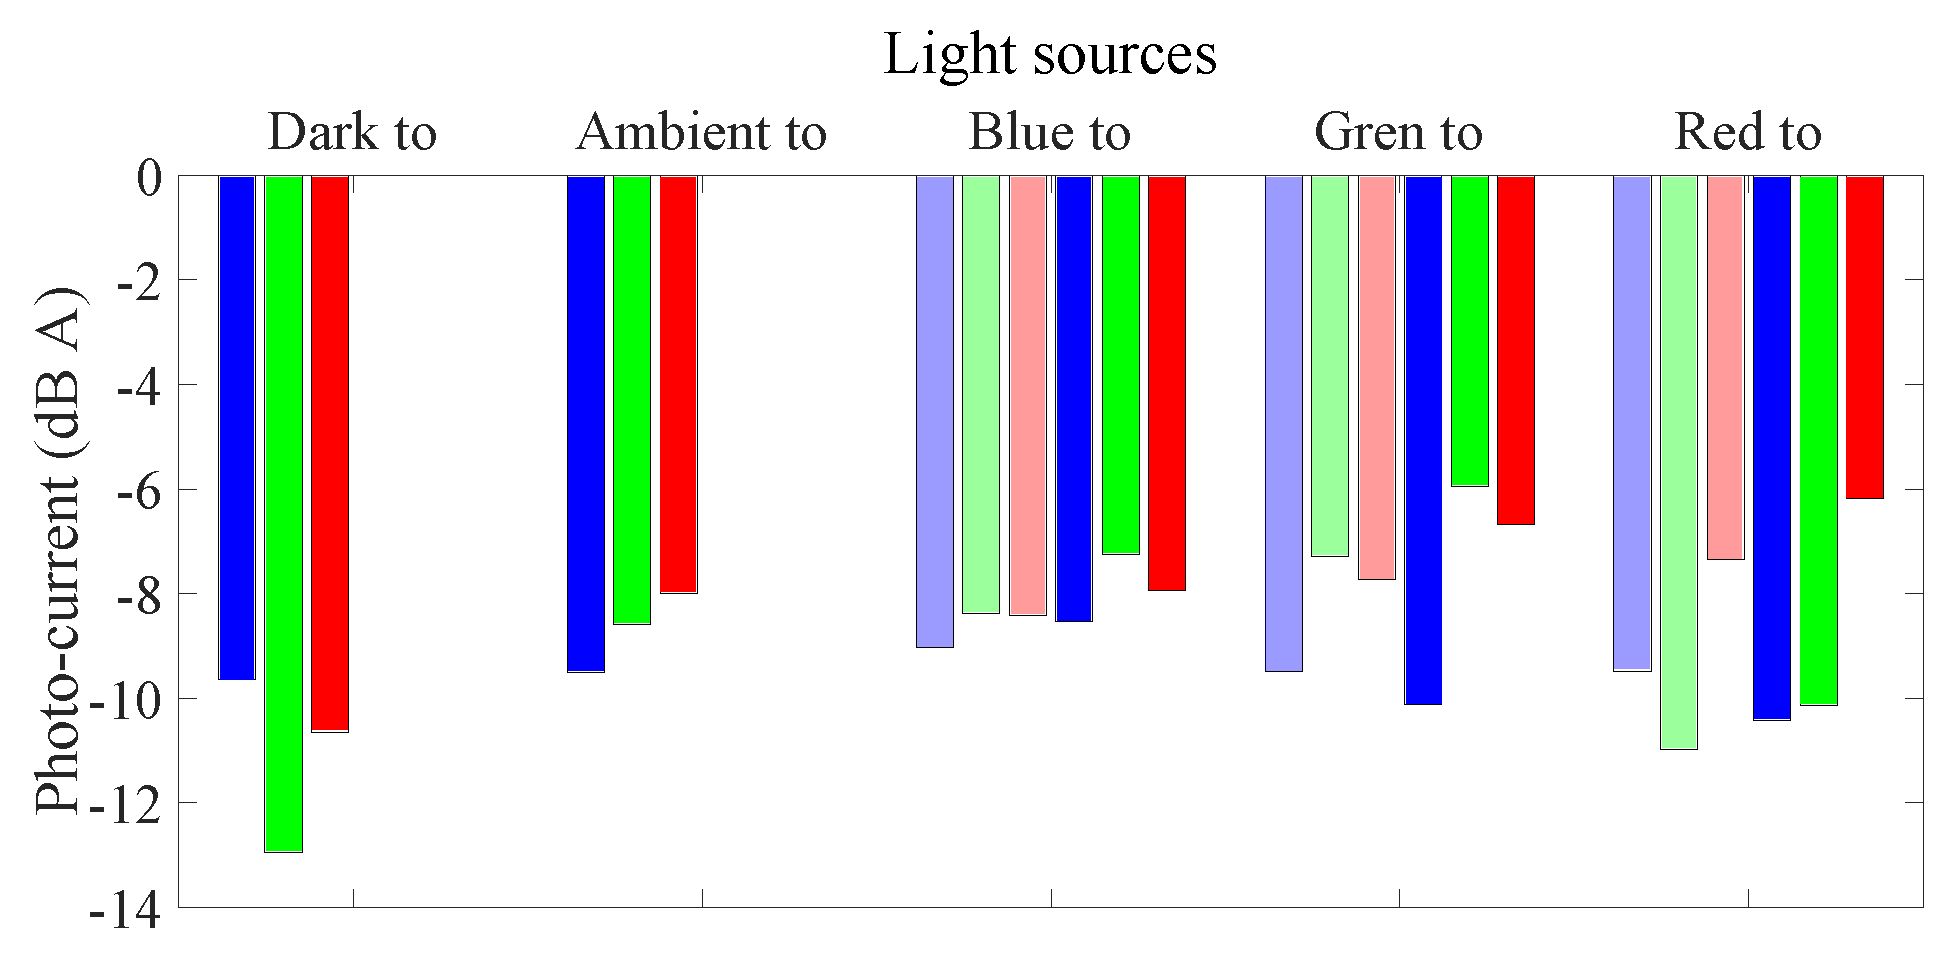
In the previous section, the capacitance discharge times of LED diodes were compared, and their correlation with the incident light wavelength (or photon energy) over the receiving LED has been shown. In order to validate the results obtained by the previous analysis (Section 1.1), this section presents photo-current measurements made with a testbed composed of a Semiconductor Parameter Analyzer 4145B and a Text Fixture Personality 16058A device. The measurements were made in a closed box (Text Fixture Personality 16058A) to avoid interfering noise from environmental lights, while the current was measured by the Semiconductor Parameter Analyzer 4145B. The first measurement is realized by biasing a transmitting LED with a forward current of 5 mA, and the photo-current values are sampled on the receiving LED (lighter bars); the second measurement is realized with a transmitting LED biased at 20 mA (full color bars) Figure 16.
As can be seen from Figure 16, a greater photo-current can be observed when the matching of the LED colors is realized, that is when the transmitter wavelength coincides with that of the receiver. This feature is most noticeable when the transmitter is powered with a higher current of 20 mA; in fact, the transmitting LED generates a greater amount of photons, and consequently, a greater photo-current is produced at the receiver. However, as shown in the figures, the current generated when the blue LED is matched is lower with respect to when the other two colors are matched, and this is due to its material, which defines a lower responsivity of the blue frequency. The photo-current values depicted in Figure 16 are summarized in Table 2.
The results shown in Table 2 describe the hypothesis formulated in Section 1.1, that is the capacity of an LED to generate a greater photo-current when illuminated by its emitting wavelength.
4. Conclusions
VLC technology promises to be a starting point for new research in the optical communication field, particularly in the visible spectrum of light. This paper aims to underline a particular feature of LED devices when used as VLC optical sources for IoT solutions, that is the ability to detect incoming light, in addition to the classic use as an emitter, making LEDs bidirectional transceivers. We have shown that the discharge of the capacitance, charged by the reverse voltage , depends on the amount of incoming light detected by the LED and, moreover, by the color of the light itself. In fact, the slope pattern of the capacitance discharge is the measure of the incoming light. The more the LED is illuminated, the faster the capacitance is discharged. The slope also depends on the color matching between the receiving LED and the transmitting source, since this is related to the energy band gap of the semiconductor. The results presented in Section 2 for the monochromatic LED and in Section 3.1 for the RGB LED describe the response of the LED devices to optical stimuli, such that LEDs can be used both as an optical source and a light sensor. The results obtained for monochromatic LEDs, especially for the red ones, and for RGB LEDs make them attractive for LED-to-LED bidirectional communication for VLC applications. The methods used are valid for defining the performance of these devices to achieve wireless optical communications, especially for VLC solutions.
Acknowledgments
No founding were disclosed for this research project. This work was accomplished thanks to the Department of Information Engineering of the Polytechnic University of Marche which has provided the necessary laboratories and tools.
Author Contributions
Lorenzo Incipini proposed the research project and wrote the paper and conducted the laboratory test with the support of Mauro Ballicchia; Lorenzo Palma elaborated the data; Alberto Belli revised the manuscript; Paola Pierleoni supervised the whole project.
Conflicts of Interest
The authors declare no conflict of interest.
Abbreviations
The following abbreviations are used in this manuscript:
| IoT | Internet of Things |
| VLC | Visible Light Communication |
| OOK | On Off Keying |
| VPPM | Variable Pulse Width Modulation |
| CSK | Color Shift Keying |
| PC | Phosphor Converted |
| RC | Resonant Cavity |
| STFT | Short-Time Fourier Transform |
| COM | Common |
References
- Rajagopal, S.; Roberts, R.D.; Lim, S.K. IEEE 802.15.7 visible light communication: modulation schemes and dimming support. IEEE Commun. Mag. 2012, 50, 72–82. [Google Scholar] [CrossRef]
- IEEE. IEEE Standard for Local and Metropolitan Area Networks–Part 15.7: Short-Range Wireless Optical Communication Using Visible Light; IEEE Standard 802.15.7; IEEE: Piscataway, NJ, USA, 2011. [Google Scholar]
- Davis, J.; Hsieh, Y.H.; Lee, H.C. Humans perceive flicker artifacts at 500 Hz. Sci. Rep. 2015, 5, 7861. [Google Scholar] [CrossRef] [PubMed]
- Monteiro, E.; Hranilovic, S. Design and implementation of color-shift keying for visible light communications. J. Lightw. Technol. 2014, 32, 2053–2060. [Google Scholar] [CrossRef]
- Luna-Rivera, J.M.; Suarez-Rodriguez, C.; Guerra, V.; Perez-Jimenez, R.; Rabadan-Borges, J.; Rufo-Torres, J. Low-complexity colour-shift keying-based visible light communications system. IET Optoelectron. 2015, 9, 191–198. [Google Scholar] [CrossRef]
- Kowalczyk, M.; Siuzdak, J. Photo-reception properties of common LEDs. Opto-Electron. Rev. 2017, 25, 222–228. [Google Scholar] [CrossRef]
- Holcomb, M.O.; Mueller-Mach, R.; Mueller, G.O.; Collins, D.; Fletcher, R.M.; Steigerwald, D.A.; Eberle, S.; Lim, Y.K.; Martin, P.S.; Krames, M. The LED lightbulb: Are we there yet? progress and challenges for solid state illumination. In Proceedings of the 2003 CLEO ’03 Conference on Lasers and Electro-Optics, Baltimore, MD, USA, 6 June 2003. [Google Scholar]
- Loiselle, R.; Butler, J.; Brady, G.; Walton, M.; Henze, N. LED Lighting for Oil and Gas Facilities. IEEE Trans. Ind. Appl. 2015, 51, 1369–1374. [Google Scholar] [CrossRef]
- Medina, C.; Zambrano, M.; Navarro, K. Led based visible light communication: Technology, applications and challenges-a survey. Int. J. Adv. Eng. Technol. 2015, 8, 482. [Google Scholar]
- Schmid, S.; Corbellini, G.; Mangold, S.; Gross, T.R. Continuous synchronization for LED-to-LED visible light communication networks. In Proceedings of the 2014 3rd International Workshop in Optical Wireless Communications (IWOW), Funchal, Portugal, 17 September 2014; pp. 45–49. [Google Scholar]
- Li, S.; Huang, B.; Xu, Z. Full Duplex MIMO VLC Using Trichromatic LEDs as Transmitters and Receivers. arXiv, 2017; arXiv:1708.07103. [Google Scholar]
- Chun, H.; Rajbhandari, S.; Faulkner, G.; Tsonev, D.; Haas, H.; O’Brien, D. Demonstration of a Bi-directional visible light communication with an overall sum-rate of 110 Mb/s using LEDs as emitter and detector. In Proceedings of the 2014 IEEE Photonics Conference (IPC), San Diego, CA, USA, 12–16 October 2014; pp. 132–133. [Google Scholar]
- Li, S.; Pandharipande, A.; Willems, F.M. Two-way visible light communication and illumination with LEDs. IEEE Trans. Commun. 2017, 65, 740–750. [Google Scholar] [CrossRef]
- Dietz, P.; Yerazunis, W.; Leigh, D. Very low-cost sensing and communication using bidirectional LEDs. In Proceedings of the International Conference on Ubiquitous Computing, Innsbruck, Austria, 16–19 September 2003; pp. 175–191. [Google Scholar]
- Kowalczyk, M.; Siuzdak, J. Influence of reverse bias on the LEDs properties used as photo-detectors in VLC systems. In Photonics Applications in Astronomy, Communications, Industry, and High-Energy Physics Experiments 2015; International Society for Optics and Photonics: Bellingham, WA, USA, 2015; Volume 9662, p. 966205. [Google Scholar]
- De Santis, F.; Ferrara, M.; Neitzert, H.C. Optical in situ characterization of isotactic polypropylene crystallization using an LED array in avalanche-photoreceiver mode. IEEE Trans. Instrum. Meas. 2006, 55, 123–127. [Google Scholar] [CrossRef]
- Khan, L.U. Visible light communication: Applications, architecture, standardization and research challenges. Digit. Commun. Netw. 2016, 3, 78–88. [Google Scholar] [CrossRef]
- Giustiniano, D.; Tippenhauer, N.O.; Mangold, S. Low-complexity Visible Light Networking with LED-to-LED communication. In Proceedings of the 2012 IFIP Wireless Days, Dublin, Ireland, 21–23 November 2012; pp. 1–8. [Google Scholar]
- Schmid, S.; Corbellini, G.; Mangold, S.; Gross, T.R. LED-to-LED visible light communication networks. In Proceedings of the fourteenth ACM international symposium on Mobile ad hoc networking and computing, Bangalore, India, 29 July–1 August 2013; pp. 1–10. [Google Scholar]
- Ayyash, M.; Elgala, H.; Khreishah, A.; Jungnickel, V.; Little, T.; Shao, S.; Rahaim, M.; Schulz, D.; Hilt, J.; Freund, R. Coexistence of WiFi and LiFi toward 5G: Concepts, opportunities, and challenges. IEEE Commun. Mag. 2016, 54, 64–71. [Google Scholar] [CrossRef]
- Li, S.; Pandharipande, A. LED-based color sensing and control. IEEE Sens. J. 2015, 15, 6116–6124. [Google Scholar] [CrossRef]
- Kasap, S.O. Principles of Electronic Materials and Devices; McGraw-Hill: New York, NY, USA, 2006; Volume 784. [Google Scholar]
- Miyazaki, E.; Itami, S.; Araki, T. Using a light-emitting diode as a high-speed, wavelength selective photodetector. Rev. Sci. Inst. 1998, 69, 3751–3754. [Google Scholar] [CrossRef]
Figure 1.
Visible electromagnetic spectrum.
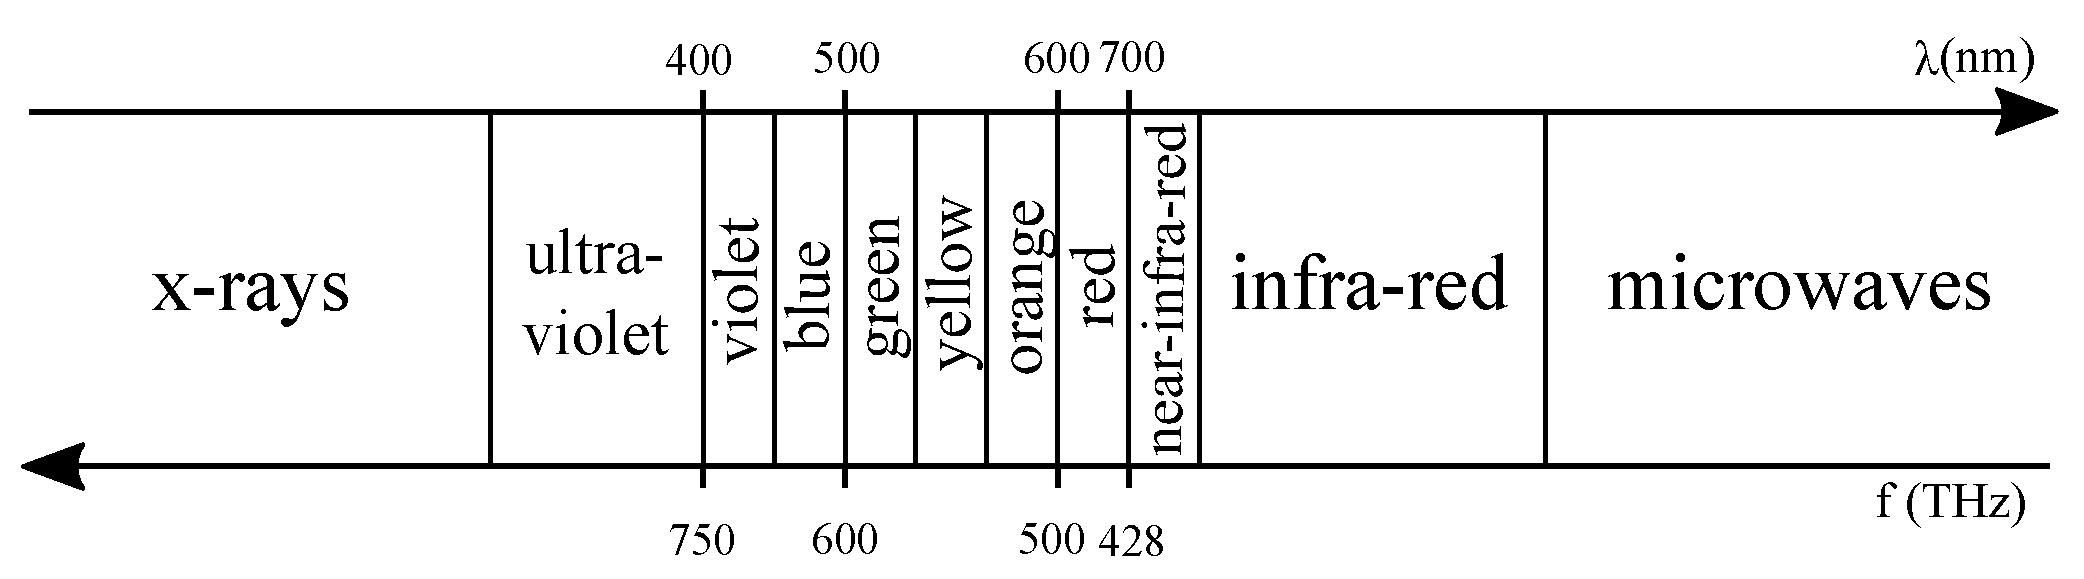
Figure 2.
IDLEsequence and data dimming compensation.
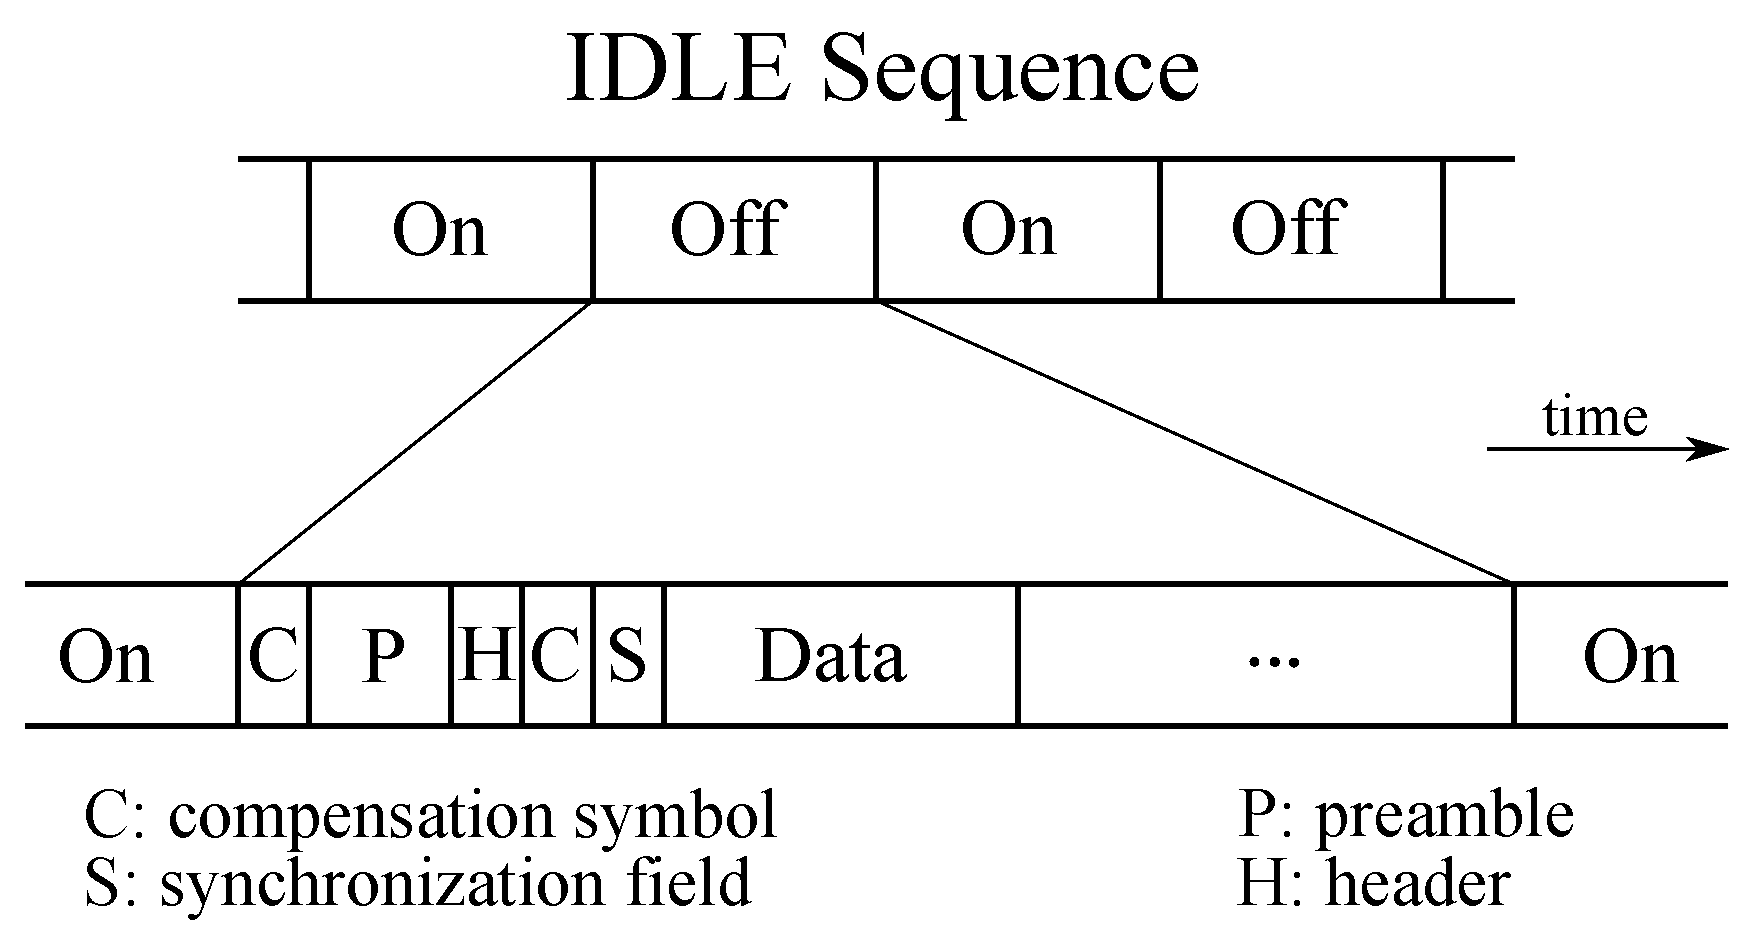
Figure 3.
Physical layer frequencies; the gray band represents the ambient light noise.

Figure 4.
LED measurement phases: (a) the receiving LED is reverse biased by ; then in (b), switching to input mode, the time required to discharge the device through is evaluated by measuring the voltage on the LED, where Z represent the high impedance state of the microcontroller.
Figure 4.
LED measurement phases: (a) the receiving LED is reverse biased by ; then in (b), switching to input mode, the time required to discharge the device through is evaluated by measuring the voltage on the LED, where Z represent the high impedance state of the microcontroller.

Figure 5.
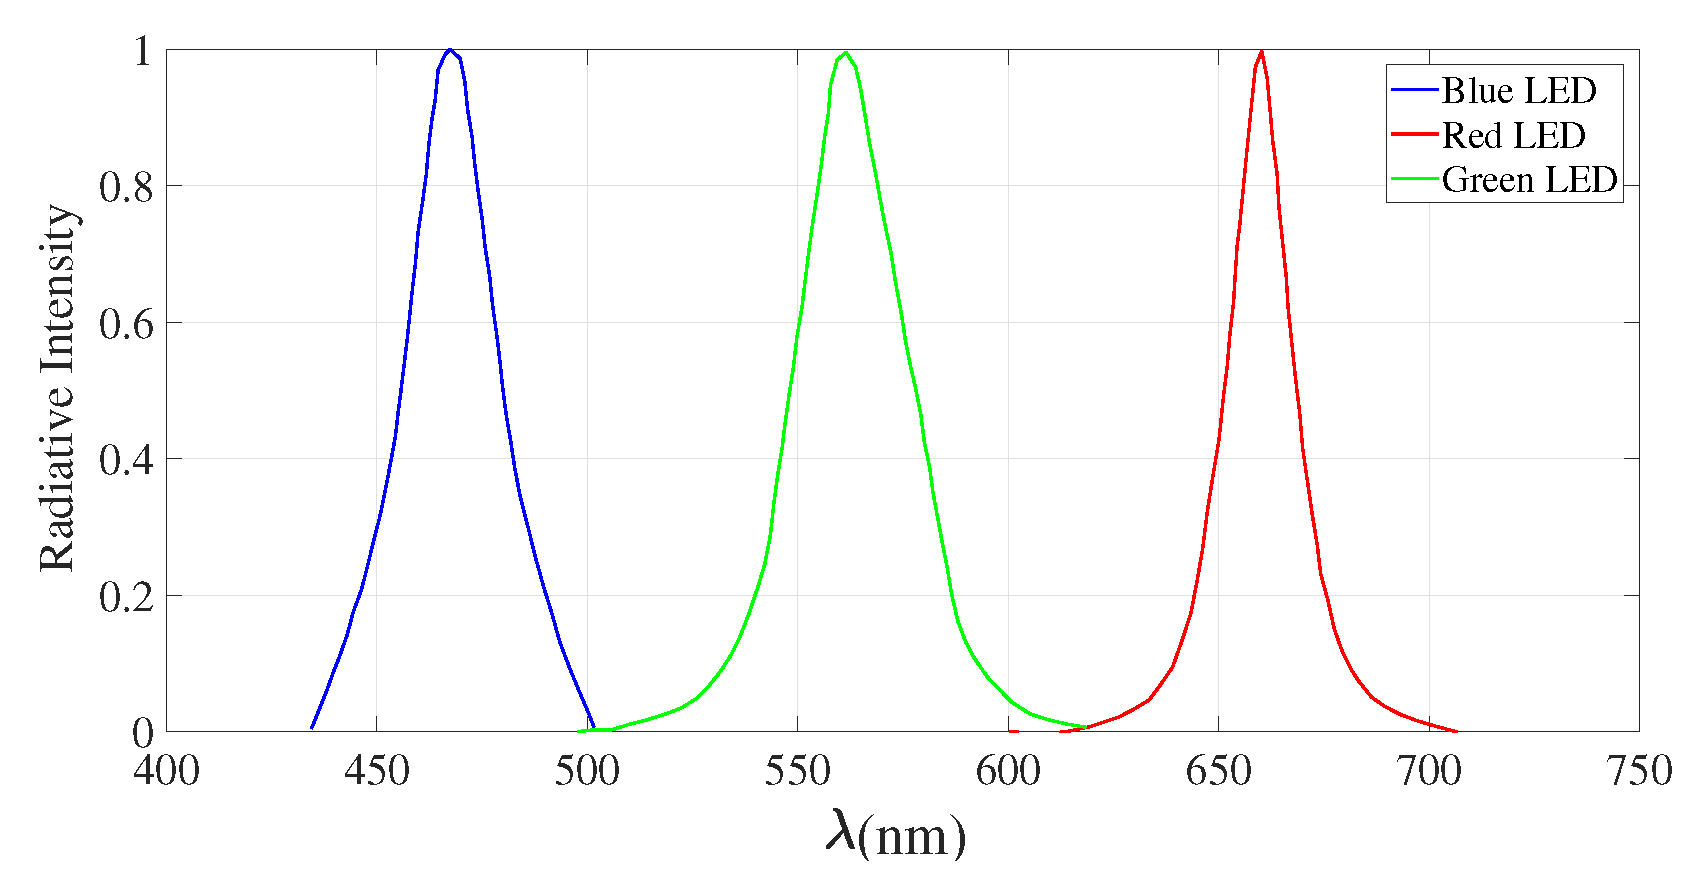
Wavelength of monochromatic LEDs used for the test, each one normalized to its wavelength radiation peak, obtained from the LEDs data-sheet.
Figure 5.
Wavelength of monochromatic LEDs used for the test, each one normalized to its wavelength radiation peak, obtained from the LEDs data-sheet.

Figure 6.
Example of energy levels and carriers for a Blue (B) LED on the left and for a Red (R) LED on the right.
Figure 6.
Example of energy levels and carriers for a Blue (B) LED on the left and for a Red (R) LED on the right.

Figure 7.
Red-to-red link, T = 700 ms.

Figure 8.
Blue-to-red link, T = 700 ms.

Figure 9.
Frequency analysis of the red-to-red link.

Figure 10.
Red-to-blue link, T = 700 ms.

Figure 11.
Blue-to-blue link, T = 700 ms.

Figure 12.
Statistical analysis of the monochromatic receiving LEDs when illuminated by red and blue sources and ambient light.
Figure 12.
Statistical analysis of the monochromatic receiving LEDs when illuminated by red and blue sources and ambient light.

Figure 13.
Through-hole RGB LED schema: a common anode pin on the left side COMand three cathode pins on the right, where each one corresponds to a specific color (red, green and blue).
Figure 13.
Through-hole RGB LED schema: a common anode pin on the left side COMand three cathode pins on the right, where each one corresponds to a specific color (red, green and blue).
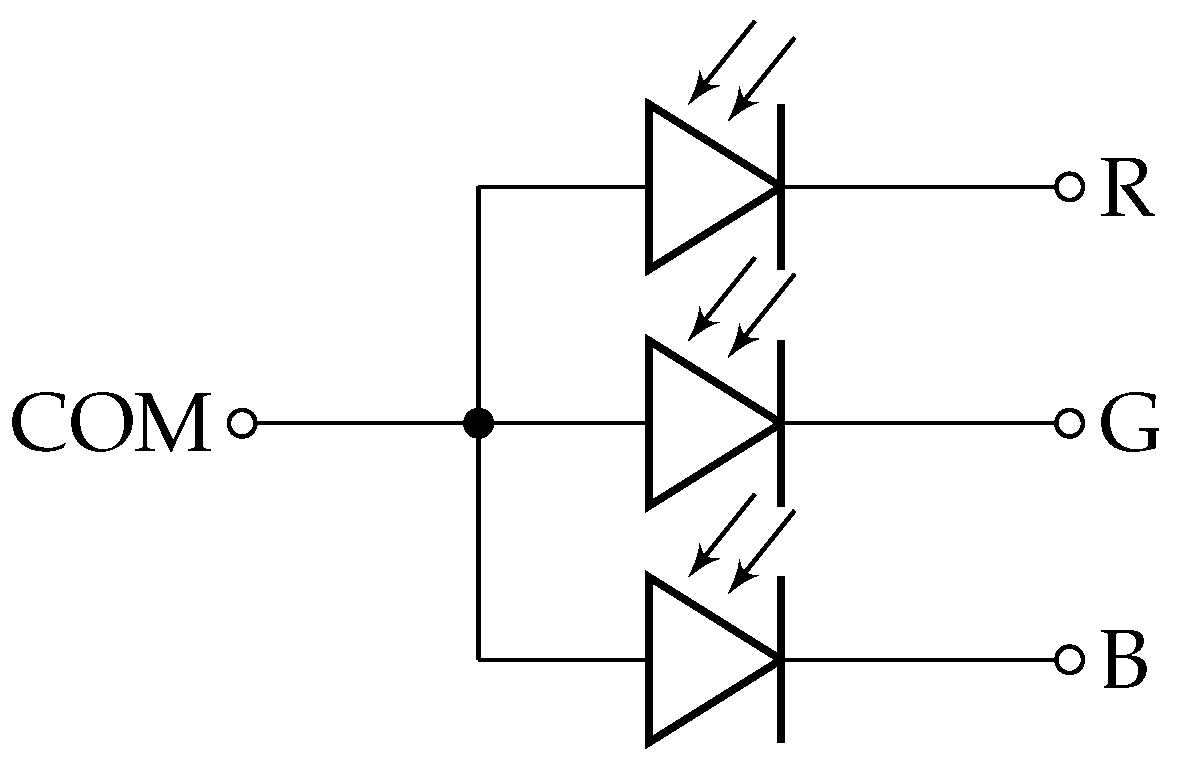
Figure 14.
Red LED to RGB LED, T = 700 ms: transmitting with a red LED and sampling the three RGB colors.
Figure 14.
Red LED to RGB LED, T = 700 ms: transmitting with a red LED and sampling the three RGB colors.

Figure 15.
Blue LED to RGB LED, T = 700 ms: transmitting with a blue LED and sampling the three RGB colors.
Figure 15.
Blue LED to RGB LED, T = 700 ms: transmitting with a blue LED and sampling the three RGB colors.

Figure 16.
Photo-current measured on receiving monochromatic LED (blue, green and red) when illuminated by a light source biased with a forward current of 5 mA (lighter bars) and when illuminated by a light source biased at 20 mA (full color bars).
Figure 16.
Photo-current measured on receiving monochromatic LED (blue, green and red) when illuminated by a light source biased with a forward current of 5 mA (lighter bars) and when illuminated by a light source biased at 20 mA (full color bars).

Table 1.
Characteristics of the monochromatic LEDs used for the tests.
| Model | Manufacturer | Color | C | Material | |||
|---|---|---|---|---|---|---|---|
| L-7104RSC-E | Kingbright | Red | 660 nm | 45 pF | 10 µA | 30 mA | GaAlAs |
| WP710A10SGC | Kingbright | Green | 557 nm | 45 pF | 10 µA | 25 mA | GaP |
| WP710A10VBC/D | Kingbright | Blue | 460 nm | 100 pF | 10 µA | 30 mA | InGaN |
Table 2.
Photo-current values expressed in nA, generated by different LEDs used as optical sensors. The highest photo-current values are highlighted.
Table 2.
Photo-current values expressed in nA, generated by different LEDs used as optical sensors. The highest photo-current values are highlighted.
| Optical Receiver | Red | Green | Blue | |
|---|---|---|---|---|
| Light Source | ||||
| Dark | 0.02 | 0.00 | 0.22 | |
| Ambient | 10.00 | 2.56 | 0.31 | |
| 5 mA | Red | 44.55 | 0.01 | 0.33 |
| Green | 18.56 | 52 | 0.33 | |
| Blue | 3.87 | 4.11 | 0.91 | |
| 20 mA | Red | 652.35 | 0.07 | 0.04 |
| Green | 205.56 | 1142 | 0.07 | |
| Blue | 11.62 | 55.14 | 2.93 | |
© 2017 by the authors. Licensee MDPI, Basel, Switzerland. This article is an open access article distributed under the terms and conditions of the Creative Commons Attribution (CC BY) license (http://creativecommons.org/licenses/by/4.0/).
Share and Cite
MDPI and ACS Style
Incipini, L.; Belli, A.; Palma, L.; Ballicchia, M.; Pierleoni, P. Sensing Light with LEDs: Performance Evaluation for IoT Applications. J. Imaging 2017, 3, 50. https://doi.org/10.3390/jimaging3040050
AMA Style
Incipini L, Belli A, Palma L, Ballicchia M, Pierleoni P. Sensing Light with LEDs: Performance Evaluation for IoT Applications. Journal of Imaging. 2017; 3(4):50. https://doi.org/10.3390/jimaging3040050
Chicago/Turabian StyleIncipini, Lorenzo, Alberto Belli, Lorenzo Palma, Mauro Ballicchia, and Paola Pierleoni. 2017. "Sensing Light with LEDs: Performance Evaluation for IoT Applications" Journal of Imaging 3, no. 4: 50. https://doi.org/10.3390/jimaging3040050
Note that from the first issue of 2016, this journal uses article numbers instead of page numbers. See further details here.