Android-Based Verification System for Banknotes


1
ifast (SMC-PVT) LTD, Abbottabad 22010, Pakistan
2
Department of Computer Science, COMSATS Institute of Information Technology, Lahore 54000, Pakistan
*
Author to whom correspondence should be addressed.
J. Imaging 2017, 3(4), 54; https://doi.org/10.3390/jimaging3040054
Submission received: 10 October 2017
/
Revised: 17 November 2017
/
Accepted: 20 November 2017
/
Published: 24 November 2017
Abstract
:With the advancement in imaging technologies for scanning and printing, production of counterfeit banknotes has become cheaper, easier, and more common. The proliferation of counterfeit banknotes causes loss to banks, traders, and individuals involved in financial transactions. Hence, it is inevitably needed that efficient and reliable techniques for detection of counterfeit banknotes should be developed. With the availability of powerful smartphones, it has become possible to perform complex computations and image processing related tasks on these phones. In addition to this, smartphone users have increased greatly and numbers continue to increase. This is a great motivating factor for researchers and developers to propose innovative mobile-based solutions. In this study, a novel technique for verification of Pakistani banknotes is developed, targeting smartphones with android platform. The proposed technique is based on statistical features, and surface roughness of a banknote, representing different properties of the banknote, such as paper material, printing ink, paper quality, and surface roughness. The selection of these features is motivated by the X-ray Diffraction (XRD) and Scanning Electron Microscopy (SEM) analysis of genuine and counterfeit banknotes. In this regard, two important areas of the banknote, i.e., serial number and flag portions were considered since these portions showed the maximum difference between genuine and counterfeit banknote. The analysis confirmed that genuine and counterfeit banknotes are very different in terms of the printing process, the ingredients used in preparation of banknotes, and the quality of the paper. After extracting the discriminative set of features, support vector machine is used for classification. The experimental results confirm the high accuracy of the proposed technique.
1. Introduction
Banknote verification systems are used for differentiating genuine banknotes from the counterfeits. These systems have a wide range of applications such as, Automated Teller Machines (ATMs), auto-seller machines, money exchange agencies, hotels, banks and shops. The proliferation of counterfeit banknotes has increased overtimes [1]. The advancements in imaging technologies for scanning and printing have made the production of counterfeit banknotes much easier and hard to detect [2]. Different systems have been developed for financial organizations to combat this problem. However, due to cost, size, and the need for power supply, these systems are not feasible for individuals such as shopkeepers dealing with currency in their daily routine. Hence, they are likely to become the victims of counterfeiters. Moreover, due to the sophisticated techniques employed by counterfeiters in preparation of counterfeit banknotes, it is a challenging task to differentiate between genuine and counterfeit banknotes manually.
Keeping in mind the increased availability of smartphones to shopkeepers and other individuals, a mobile-based banknote verification system is proposed to facilitate these individuals.
With the task at hand, it is essential to identify the difference in preparation process of both genuine and counterfeit banknotes. As stated by the issuing authorities of currency, specialized materials and method are used for printing of genuine banknotes, which are difficult and expensive to replicate. Hence, the surface roughness, quality of paper and printing process of genuine and counterfeit banknotes are completely different. In order to verify stated fact, XRD and SEM imaging analysis of both genuine and counterfeit banknotes were conducted.
The XRD is a non-destructive analysis technique, employed by the industry to acquire information about the chemical composition of materials at microscopic level [3]. On the other hand, SEM technique uses focused high-energy electron beam on the surface of the object, generating variety of signals against the sample under consideration [4]. These signals reveal information about texture and chemical composition of materials composing the object. In both cases, very small areas ranging from approximately 5 micrometers to 1 centimeter are taken for analysis from different parts of the banknote which reflect the actual difference. In this regard, two important areas of the banknote, i.e., serial number and flag portions were considered since these portions showed the maximum difference between genuine and counterfeit banknotes. Interestingly, the analysis results confirm both genuine and counterfeit banknotes are much different in material, ink, paper, printing technique and texture. These analytical results helped us in selection of appropriate set of features for classification of banknotes.
In this study, a banknote verification system has been proposed for Android-based smartphones, considering Pakistani banknotes as a case study. To the best of authors’ knowledge, there is no such system available for Pakistani banknotes, known as Pakistani Rupee. For the rest of the study, rupee would be referred as Rs. There are seven denominations of Pakistani banknotes. Rs.10, Rs.20, Rs.50, Rs.100, Rs.500, Rs.1000, and Rs.5000. Our technique has been tested on three denominations of banknotes, Rs.500, Rs.1000 and Rs.5000. Smaller denominations have not been tested, since they have low rate of counterfeiting. The proposed system captures banknote images using built-in device camera. After capturing the image, discriminative set of features are extracted. Then, Support Vector Machine (SVM) is employed as a classifier for verification of genuine and counterfeit banknotes based on these features. The rest of this study has been organized as follows. Related work has been discussed in Section 2. Proposed methodology has been presented in Section 3. Experimentation results have been discussed in Section 4. Conclusions are given in Section 5.
2. Related Work
A currency recognition method was proposed by Chang et al. [2] using Support Vector Machine (SVM). In this study, watermark, hidden fluorescent fibers and color-changing ink were used as features of the banknote. These features were captured using separate hardware i.e., digital camera and sensors; and were used in collection of required information. The watermark was captured using digital camera; while fluorescent fiber features were extracted by applying spectral analysis on reflected signal of low-cost ultraviolet sensors. Then, color-changing ink was captured using an optoelectronic device. After capturing these features, Support Vector Machine (SVM) was used for classification.
Yoshida et al. [5] proposed a currency detection technique using CMOS based scanner called Grid Scanner, which uses an infrared filter and captures image in infrared band. Then, micro-text printed area was captured as a gray scale image for reading the micro text printed on the currency image. The captured image was passed to the microcontroller for processing.
Fentahun Zeggeye et al. [6] proposed a hardware and software based solutions for Ethiopian currency. The solution has the ability to distinguish a currency into its denomination and verifies if the currency is genuine or fake. The system can acquire an image from a scanner and camera. Then, four level classifier is used to classify the banknotes based on local features.
Xie et al. [7] have proposed a method for currency recognition by identifying the texture of the currency. For this purpose, the concept of surface roughness of manufacturing engineering was adopted. The gray-scale image of currency was viewed as a 3 dimensional hood face. The variation of the gray level of the image along each row or column was regarded as an approximately sine wave. Texture features of genuine and counterfeit banknotes were extracted. Then, counterfeit currency was identified based on different texture features.
Spagnolo et al. [8] proposed a method for currency verification based on security features of the banknote. These features include fiber structure and position of metallic color fiber which can only be observed under ultraviolet light. In this regard, banknotes were passed through the ultraviolet light to show the position of metallic color fiber and microscope was used to detect the metallic color fiber and digitized the captured images. The Central bank database was accessed for templates of the currency with a secure connection, then template from the bank and the one obtained with this process were matched with exclusive-OR, and results were generated.
Spagnolo et al. [9] introduced another method for currency verification in addition to the method in [8]. In this technique they have used 2D barcode which can only be read using infrared light; this code was verified from the bank database.
Vila et al. [10] proposed a currency verification procedure based on the analysis of middle infrared spectrum of several areas of euro currency using microscope in attenuated total reflection mode (ATR-infrared spectroscopy). Different areas of the currency were selected for analysis, which was conducted by pressing Zinc Selenide crystals to these selected areas, and a microscope operating at visible wavelength was used to capture the analysis data. The results were processed with GRAMS 32 (Galactic) Software. All spectra were scaled according to the mean and the standard deviation obtained from the original set of banknotes.
Kang et al. [11] discussed a counterfeit banknote detection system for ATMs using multispectral images. Infrared and visual spectrum images were used for the recognition process, dividing a banknote image into a number of blocks. Using block selection algorithm, features from blocks were extracted and linear classifier was applied in order to verify the authenticity of the banknote.
Mudassir et al. [12] implemented a fake currency recognition method using image processing techniques in Matlab, extracted security features from currency and categorized using a Neural Networks.
Rashmi et al. [13] developed an algorithm for an existing automated teller machine (ATM) which applies recognition on Indian Rupee (INR), capturing the currency number and saving it to the database for future reference and recovery in case of counterfeit currency.
All studies discussed above are dependent on some hardware, such as ultraviolet sensors, infrared microscope and lights, and special cameras, which are not affordable for the common user of banknotes. Moreover, their dependency on such specialized hardware limits the portability of such systems and usually results in more manual interaction, therefore require more time to produce results. To eliminate the need of specialized hardware and automate the verification process, a smartphone based verification method is proposed, and explained in next section.
3. Materials and Methods
Issuing authorities of currency take necessary steps to ensure the unique nature of each state’s currency and embed features that are hard to replicate, which can be helpful in verifying the authenticity of banknotes. These features include: watermarks, metallic ink, micro-printing latent image, image with variable ink, protective fibers, ultraviolet, and infrared features. Unfortunately, most of these features have already been counterfeited [1]. Hence, we cannot rely on these features for banknote verification. Although ultraviolet and infrared features are rarely counterfeited, these features can only be checked with specialized hardware, which is not feasible in terms of cost and portability. According to an analysis report by the central bank of Russia [1], the percentage of times every feature has been counterfeited is shown in Table 1.
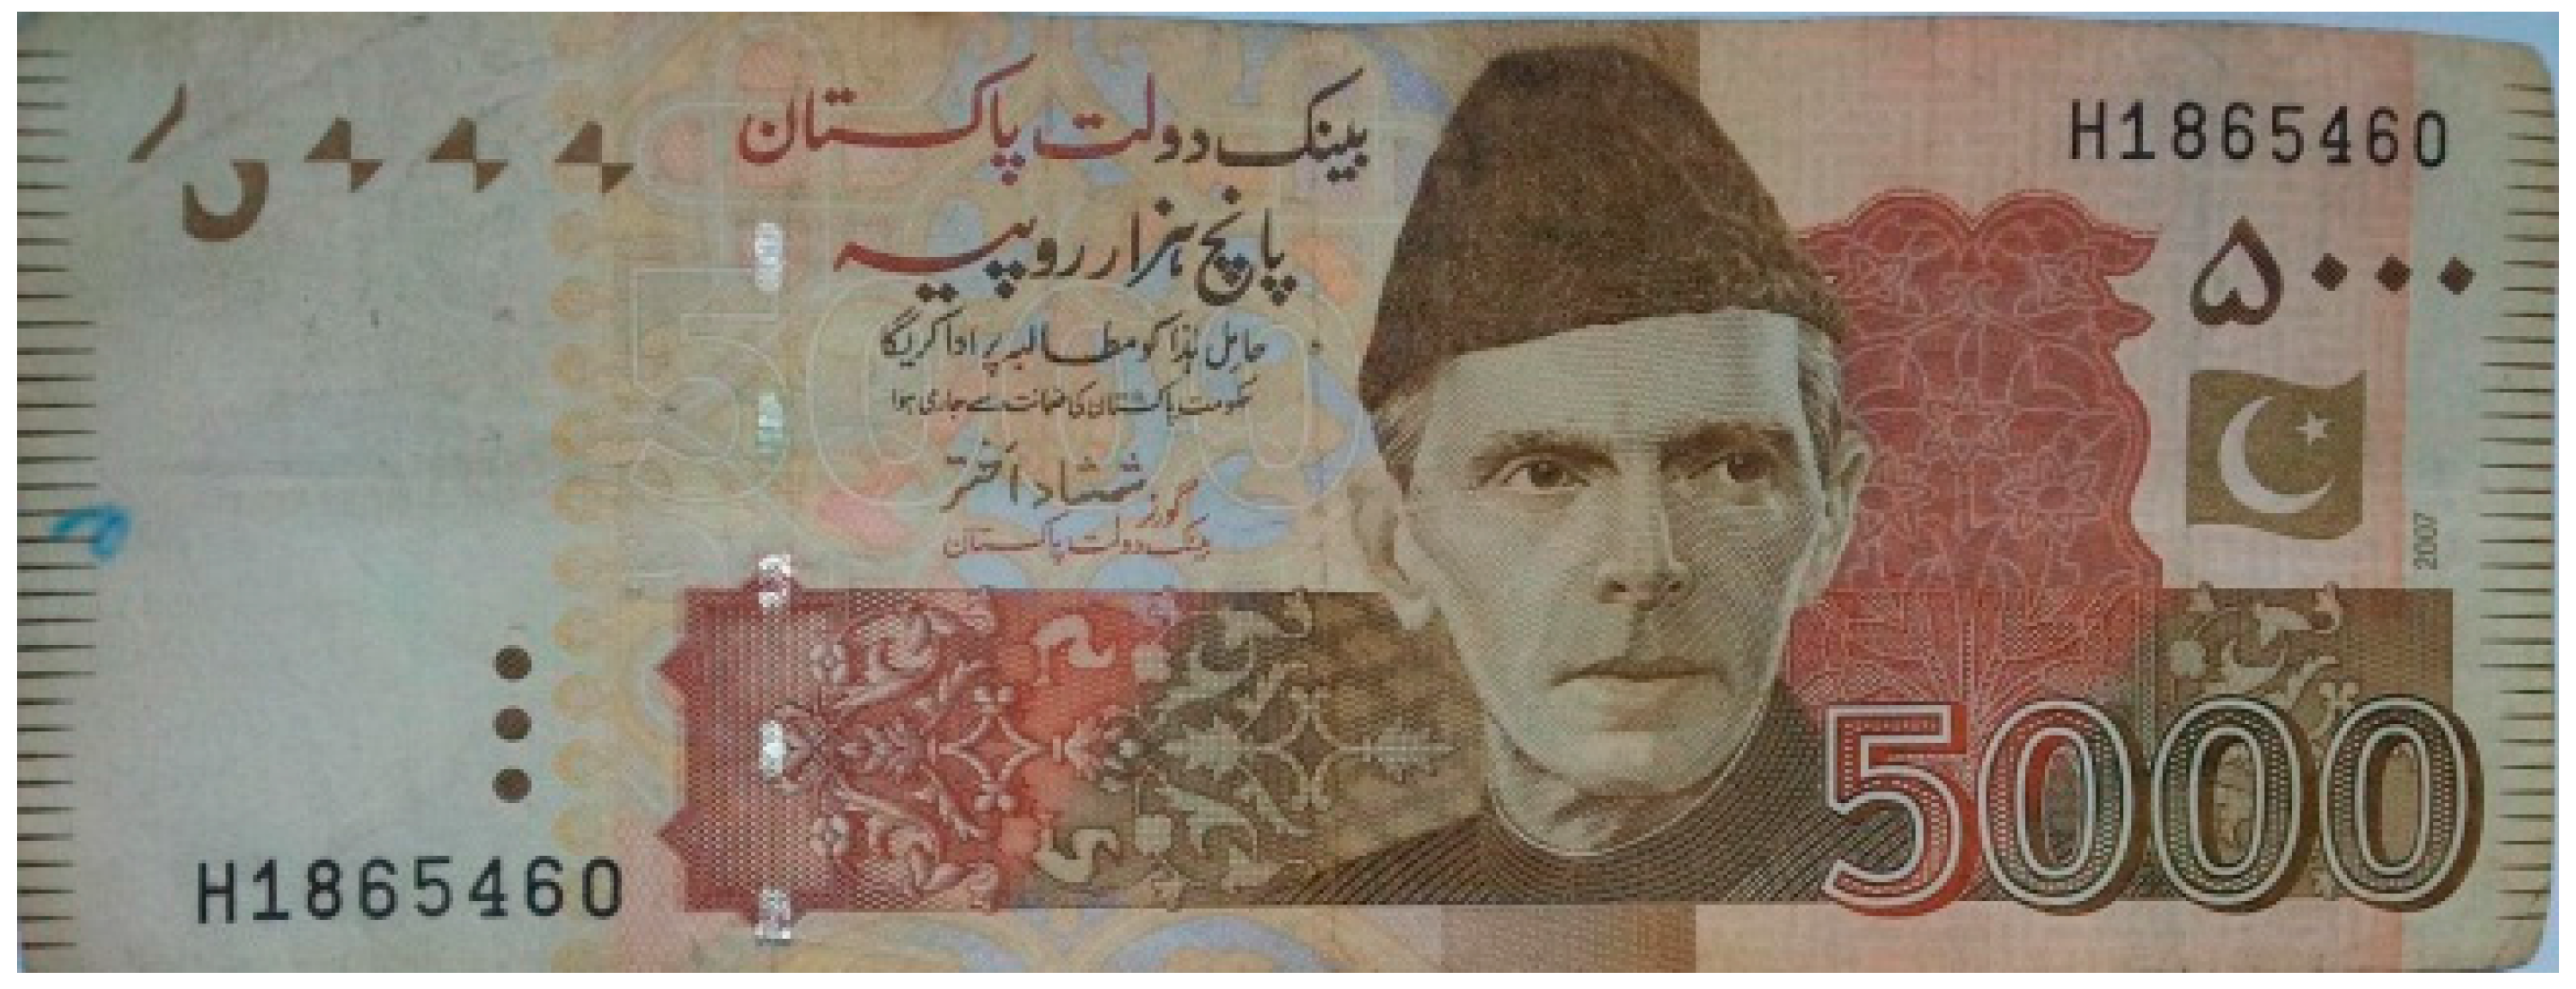
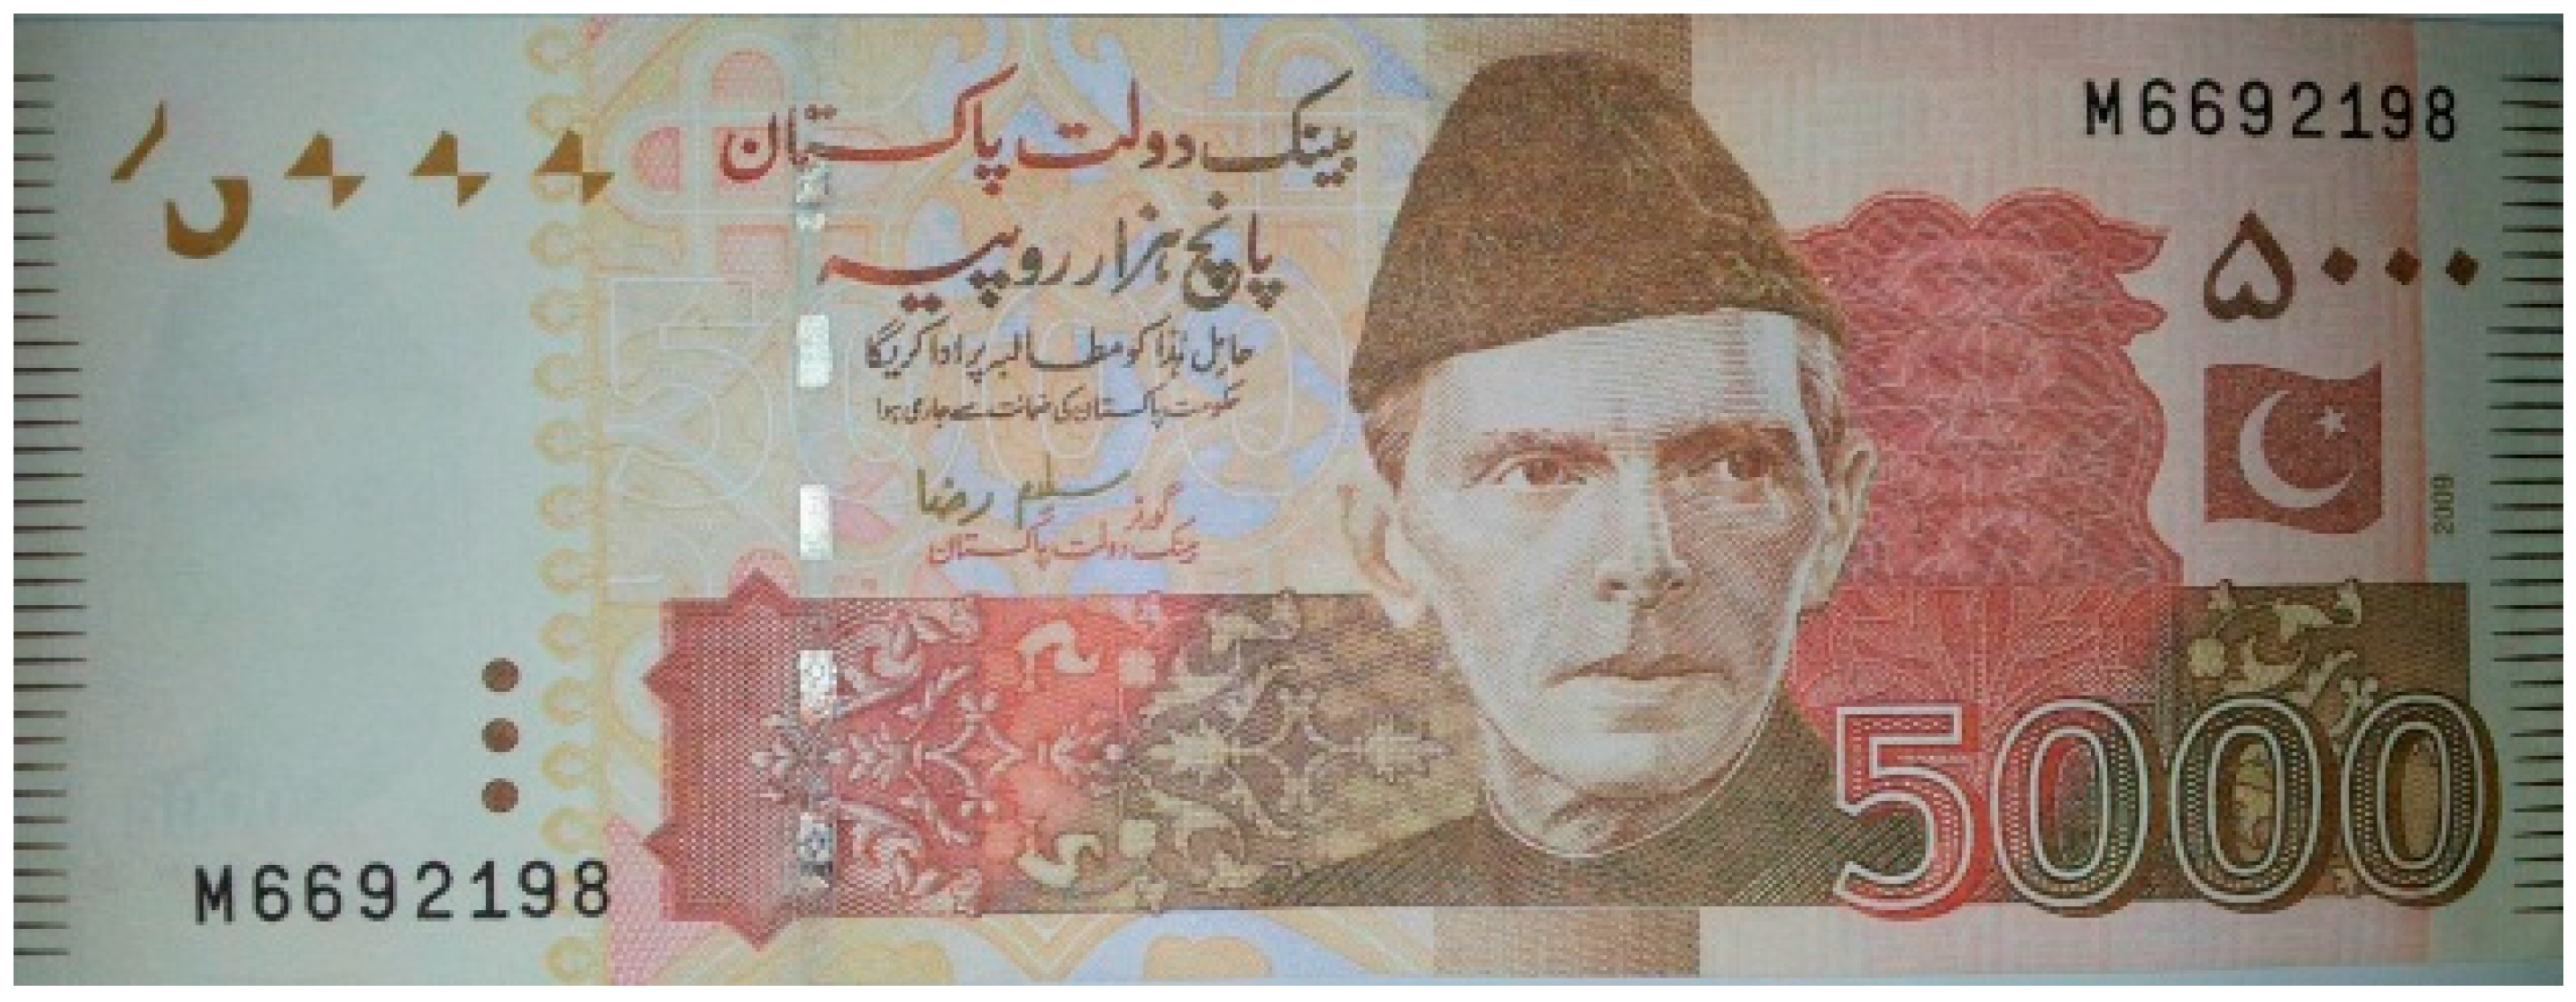
Figure 1 shows a genuine Rs.5000 banknote and Figure 2 shows a Rs.5000 counterfeit banknote. All the above mentioned security features are available in the counterfeit banknote, which makes it very challenging to differentiate two banknotes, based on these visible security features. Therefore, it is essential to select certain textual and statistical features which can differentiate the genuine and counterfeit banknotes. These statistical features, and surface roughness features depend on the banknote material such as ink, printing process and chemical composition of the paper, can be the right choice for distinguishing the two. It has been observed that genuine banknotes are printed with special ingredients which cannot be counterfeited until and unless the same material and composition formula is used. In order to verify this, we performed SEM and XRD analysis of the banknotes. The detailed analytical results are presented in the subsequent sections.
3.1. SEM Imaging and XRD Analysis of Genuine and Counterfeit Banknotes
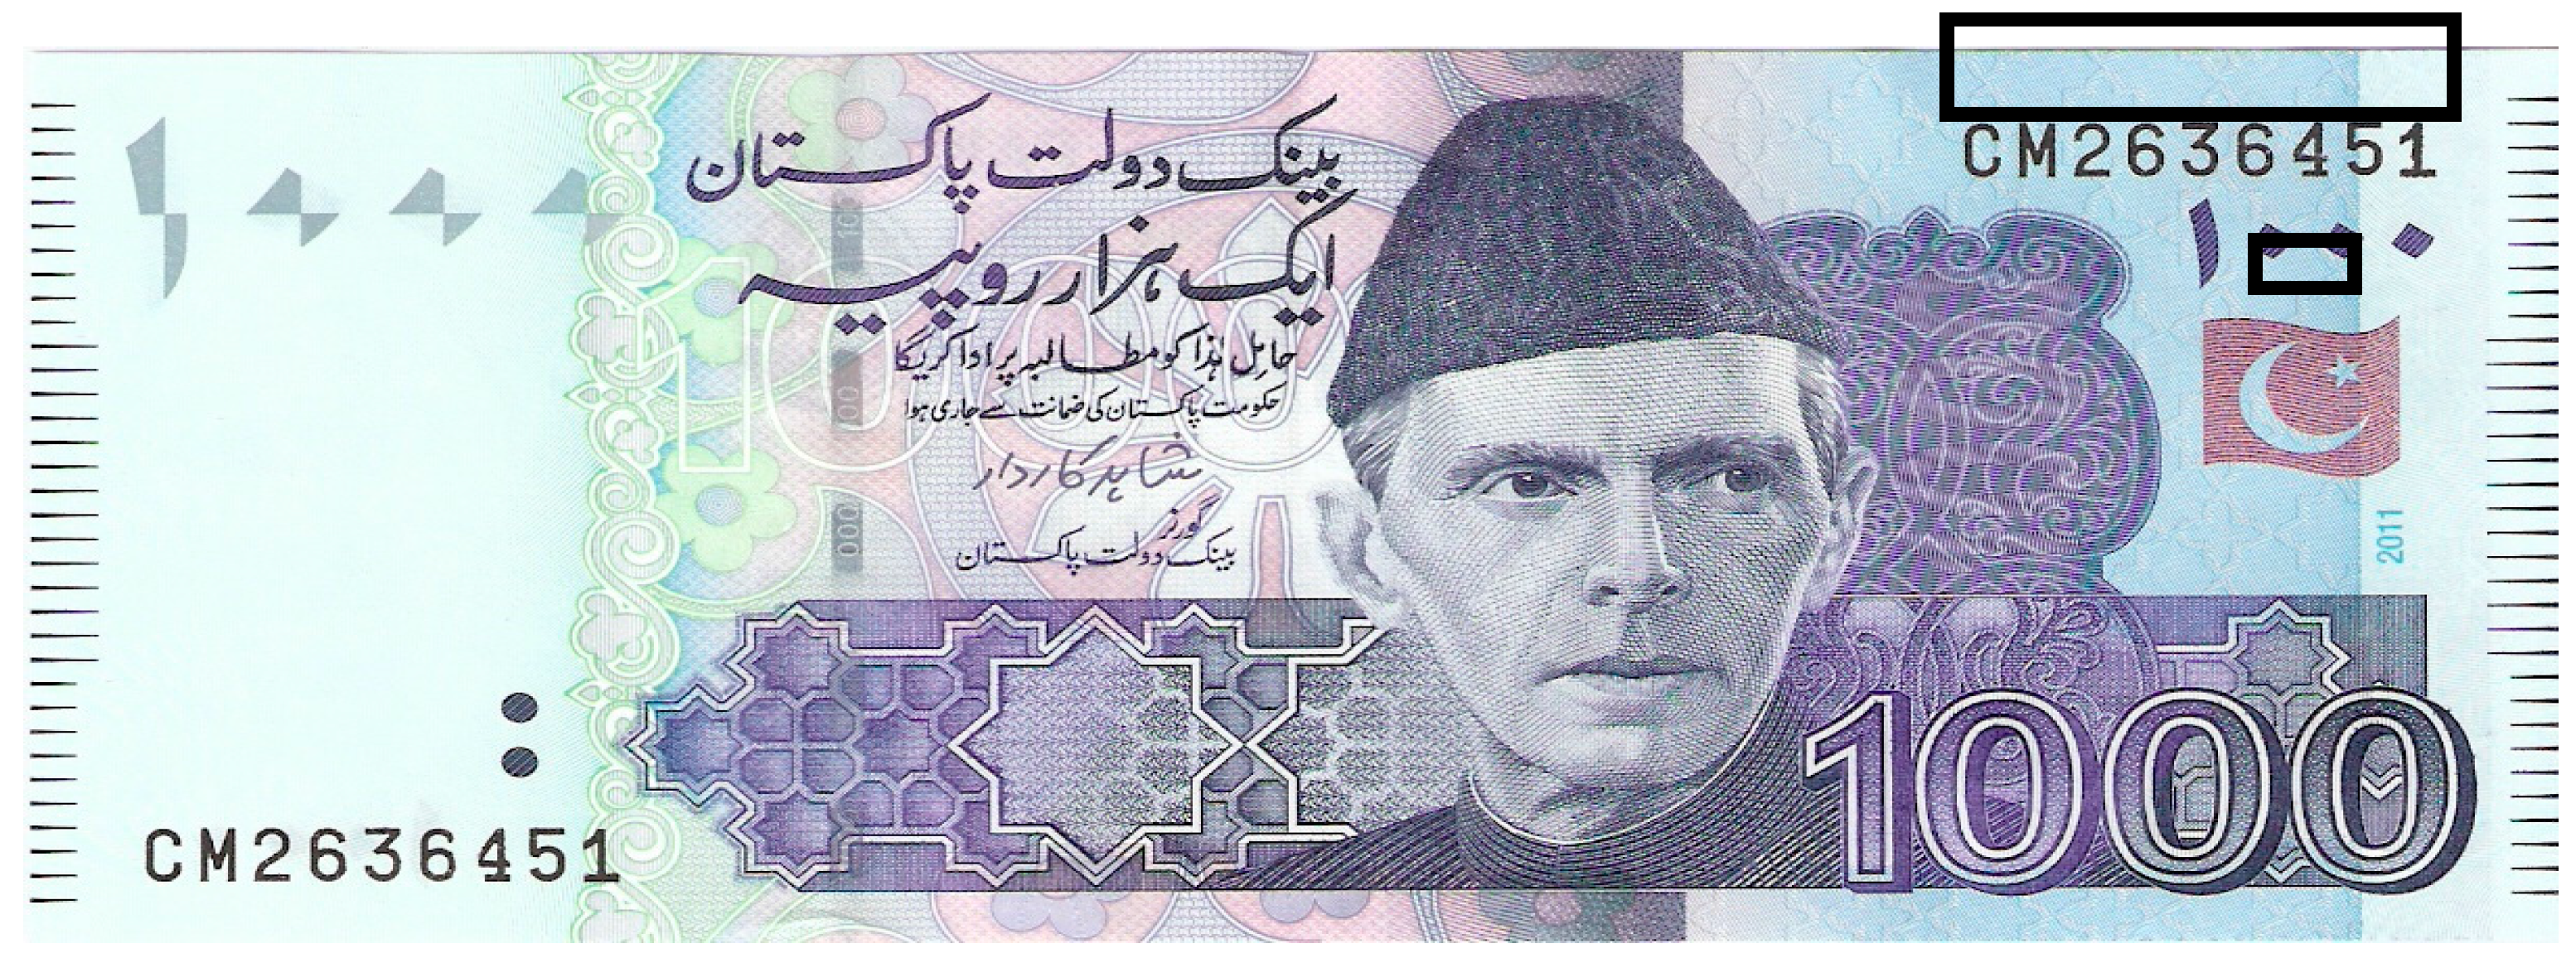
The SEM and XRD analysis of two different parts of currency were performed using JEOL JSM5910 microscope at 30× magnification. The selected parts are the serial number and Pakistani flag of the banknotes, as indicated by black boxes in Figure 3. As an example, the SEM images of the flag portion of the genuine and counterfeit banknotes are shown in Figure 4. Observing the flag image shown in Figure 4, there is a visible difference between both images. The genuine flag has different shapes, while the counterfeit flag image has same shape over the whole image. In order to further clarify the difference at pixel level, the histograms of genuine and counterfeit banknotes are shown in Figure 5. The histogram of the genuine banknote has been presented in blue, while the histogram of counterfeit banknote is in green color. The histogram of genuine part is clearly different than the counterfeit since the genuine material composition has a combination of different elements, while the counterfeit has single or similar elements over the whole area. The genuine banknote has different level of intensities at different points that reflect the presence of some embedded elements, but the counterfeit banknote has intensities that lie in small range of levels, resulting in a narrow peak in histogram, indicating the presence of similar elements.
Moreover, XRD analysis was performed to check the chemical composition of the genuine and counterfeit banknotes. The analysis of the flag portion of genuine and counterfeit banknotes is shown in Table 2 and Table 3 respectively. Results indicate that, genuine banknote has Carbon (C), Oxygen (O), Sodium (Na), Magnesium (Mg), Fluorine (F), and Silicon (Si) elements while counterfeit banknote has only Carbon, and Oxygen elements, which confirms that there is a significant difference in chemical composition of genuine and counterfeit banknotes. Based on observations, and critical analysis of genuine and counterfeit banknotes, the conclusion derived is that genuine banknotes are prepared according to some specific formula of material, ingredients, and printing techniques and this formula is kept secret. Therefore, the quality of paper material from which the banknotes are prepared, and printing technology is different for genuine and counterfeit banknotes.
However, it is quite challenging task to represent materials and surface roughness differences of the banknotes from image processing point-of-view. A study presented in [14] describes a contactless method for representing the actual surface roughness into texture features of the surface image. Based on this study, we came up with the set of statistical and texture features to represent these properties in image processing. Details of these features are described in subsequent sections. The complete flow chart of the proposed methodology is shown in Figure 6.
3.2. Banknote Collection and Image Capturing
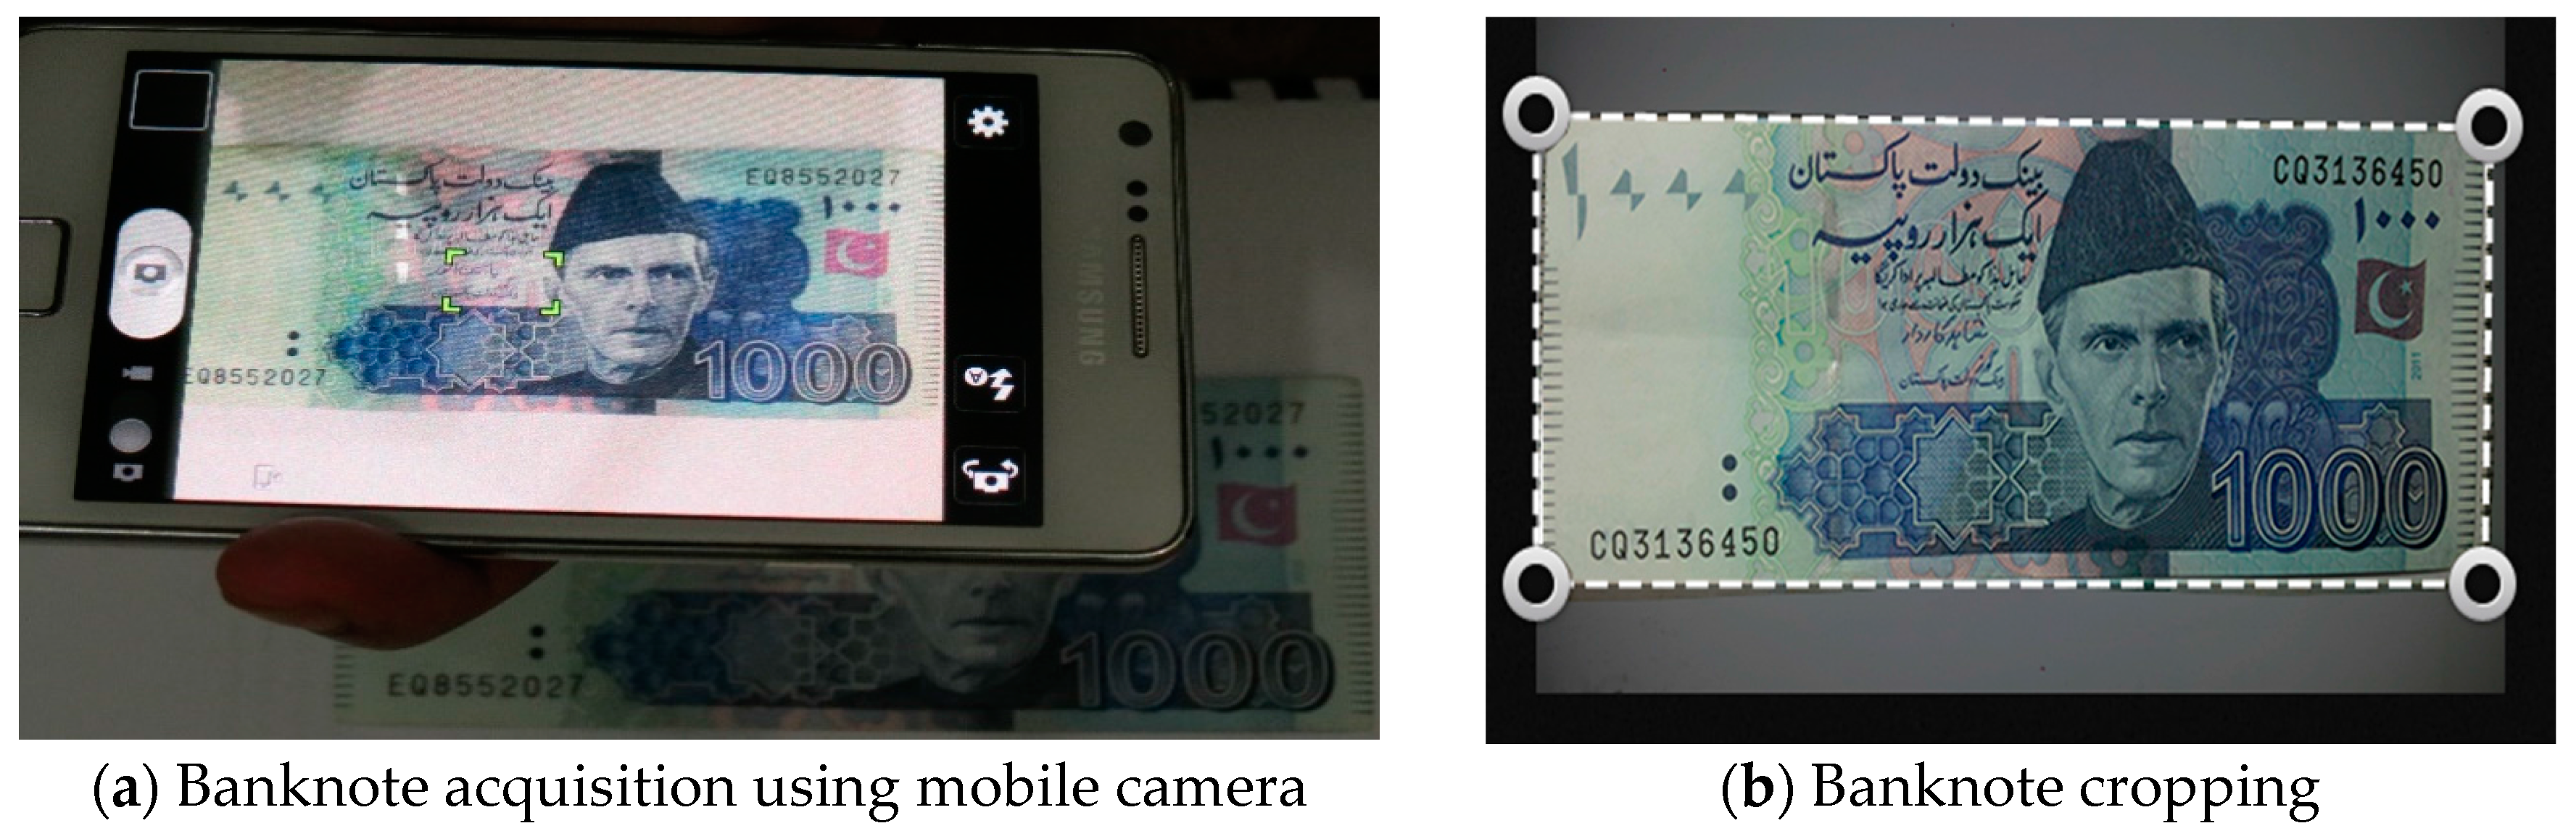
Unlike other verification systems reported in the literature, there is no standard dataset available for training and assessing the performance of a verification system for Pakistani banknotes [15]. Therefore, a dataset of 263 Pakistani banknote images including 50 images of counterfeit banknotes has been prepared representing each selected denomination. Images are captured using built-in camera of android-based smartphone with flash light turned on to capture maximum possible details in an image. Banknotes of three denominations, Rs.500, Rs.1000, and Rs.5000 are used for training and assessing the performance of the proposed technique. The image is captured and cropped automatically. Figure 7 shows the capturing and auto cropping of the banknote image. Figure 8 shows the auto cropped image.
3.3. Preprocessing
In order to improve the recognition accuracy of the proposed system, it is essential to reduce noise present in a banknote image due to worn, torn and dirt included in it during circulation process of the banknote [16,17]. The preprocessing step improves the quality of the image and results in better recognition accuracy. During circulation, the banknotes get dirty which acts as a noise and reduces the accuracy of the banknote verification system. In order to minimize the effect of such noise and improve the quality of image, a median filter is applied on an RGB image. Moreover, all captured images were resized to an equal size, once the image has been resized and validated; further processing is carried out for feature extraction, explained in the next section. From XRD analysis we have selected a set of features which are related to material such as ink, printing process and the chemical composition of the banknote. These features include statistical and texture roughness features as discussed in the subsequent sections.
3.3.1. Statistical Features
When the incident light hits the rough surface of a banknote, some amount of light is reflected back, and some is refracted (light passes through the surface with change in angle) or absorbed by the banknote. The refraction process is represented by Equation (1), where I0 is the incident intensity and I represent the intensity of refracted light. The coefficient α represents the absorption of the media (banknote), η is the reflection coefficient, and d is medium thickness [18].
From Equation (1), it is concluded that, value of each pixel of an image is related to basic characteristics of banknote image, including reflection, refraction, and absorption coefficients. The statistical features actually reflect different physical properties such as reflection, refraction and absorption of light by banknote materials [6]. Some parts of a banknote with embedded features have more potential to differentiate the banknotes. Therefore, the banknote is divided into four equal blocks with respect to its aspect ratio, and each block image is converted into its derivative image by calculating the first derivative of each block using Equation (2). Where and are the derivatives of a banknote image in row and column direction respectively. The motivation behind calculating the derivative of each block is to highlight the embedded features of the banknote. As shown in Figure 9a the embedded features such as flag and lettering (value of the banknote) are visible in genuine derivate banknote image, while these features disappeared from counterfeit banknote during derivation process. In this paper, we have selected a set of following statistical features which have strong ability to prove the authenticity of the banknote based on material characteristics.
Mean: Mean of each block is calculated using Equation (3). This feature represents the embedded colors and thickness of the banknote.
Min: Minimum value is obtained by averaging the minimum value in each row and column of the block of derivative image using Equation (4). This feature focuses on printing-ink and printing technology used for the banknote.
Max: Maximum value is obtained by averaging the maximum value in each row and column of the block of derivative image using Equation (5). This feature reflects the thickness and texture of the banknote.
Variance: The Variance is obtained by taking arithmetic average of the squared differences between the values and the mean of each block of derivative image. This is calculated using Equation (6), indicating the level of surface roughness. The greater value of variance means more rough surface and vice versa.
Covariance: Covariance matrix, where each row is an observation, and each column is a variable, cov(x) is the covariance matrix of an image. This is calculated as shown in the Equation (7). It reflects the degree of change in two images.
3.3.2. Texture Roughness Features
Texture is an important characteristic of an image. There is no standard definition for texture of an image, but generally it is defined as, image composed of set of pixels that have particular size and shape. These pixels describe the structure of an image surface. Texture roughness plays a vital role in analysis of texture [18]. Different researchers have proposed different texture roughness analysis algorithms, such as [2] presented texture roughness algorithm based on optimum size, Another study [19] presented texture roughness algorithm based on [16,17]. The basic idea was to compute gray scale changes from horizontal and vertical direction, and then calculate their average values. This algorithm has good results for images that are totally different in surfaces but does not give good results with images that have similar texture [20]. We have adopted the concept of roughness presented in [15]. This concept is based on measuring the quality of surface of mechanical components. According to this, the microcosmic geometry made up of tinny peaks, valleys and space between these points can describe the surface roughness of an object. The derivative images of genuine and counterfeit blocks of the banknote are shown in Figure 9, which show the clear difference in roughness of the genuine and counterfeit banknotes.
Based on this concept of describing the roughness presented in [6], if the intensity changes of an image are considered approximately as a sine wave, then there would be many peaks and valleys. This means that the roughness of the banknote can be described as a set of peak points, valley points, partial peak points, partial valley points, ramp up, and ramp down points. In derivative image, we get three pixel groups, pixels with values greater than zero, pixels with values less than zero, and pixels with values of zero. Because of these three groups, a maximum of eight different transitions of current pixel can be made with respect to previous pixel along x (row) and y (column) directions. These transitions are shown in Table 4. The numbers of pixels in each transition are calculated by taking the value of current pixel and two previous pixels in row and column order.
Once the sum and count of pixels in each group is obtained, mean of each group of pixel in a block is calculated. The texture roughness of the banknote is calculated using Algorithm 1.
| Algorithm 1. /* Pass original block of banknote, its first derivative, and second derivative images as argument*/ |
| 1: procedure calcRoughness(block(x, y), fd(x, y), sd(x, y)) 2: m[8]←0 // mean vector 3: c[8]←0 // pixel counter 4: btp←block.total() 5: btc←block.channels() 6: fBlock[btp * btc]←block.getBuffer() 7: bfd[btp *btc]←fd.getBuffer() 8: bsd[btp *btc]←sd.getBuffer() // Buffer Second Derivative 9: blockCols←block.cols() 10: for i←blockCols + 2 to f Block.length-2 do 11: pP ixel←blockCols 12: if bf d[i] ≥ 0 AND bfd[pPixel] < 0 then 13: c[0]←c[0] + 1 14: m[0]←m[0]+fBlock[i] 15: end if 16: if bfd[i] < 0 AND bfd[pPixel] < 0 then 17: c[1]←c[1] + 1 18: m[1]←m[1]+fBlock[i] 19: end if 20: if bfd[i] < 0 AND bfd[pP ixel] ≥ 0 then 21: c[2]←c[2]+1 22: m[2]←m[2]+fBlock[i] 23: end if 24: if bfd[i] > 0 AND bfd[pPixel] > 0 then 25: c[3]←c[3]+1 26: m[3]←m[3]+fBlock[i] 27: end if 28: if bsd[i] ≥ 0 AND bsd[pPixel] < 0 then 29: c[4]←c[4]+1 30: m[4]←m[4]+fBlock[i] 31: end if 32: if bsd[i] < 0 AND bsd[pPixel] < 0 then 33: c[5]←c[5] + 1 34: m[5]←m[5]+fBlock[i] 35: end if 36: if bsd[i] < 0 AND bsd[pP ixel] ≥ 0 then 37: c[6]←c[6] + 1 38: m[6]←m[6]+fBlock[i] 39: end if 40: if bsd[i] > 0 AND bsd[pPixel] > 0 then 41: c[7]←c[7] + 1 42: m[7]←m[7]+fBlock[i] 43: end if 44: end for 45: for i←0 to 7 do 46: m[i]←m[i]/c[i] 47: end for 48: return m // Feature Vector of roughness 49: end procedure |
4. Paper Currency Verification
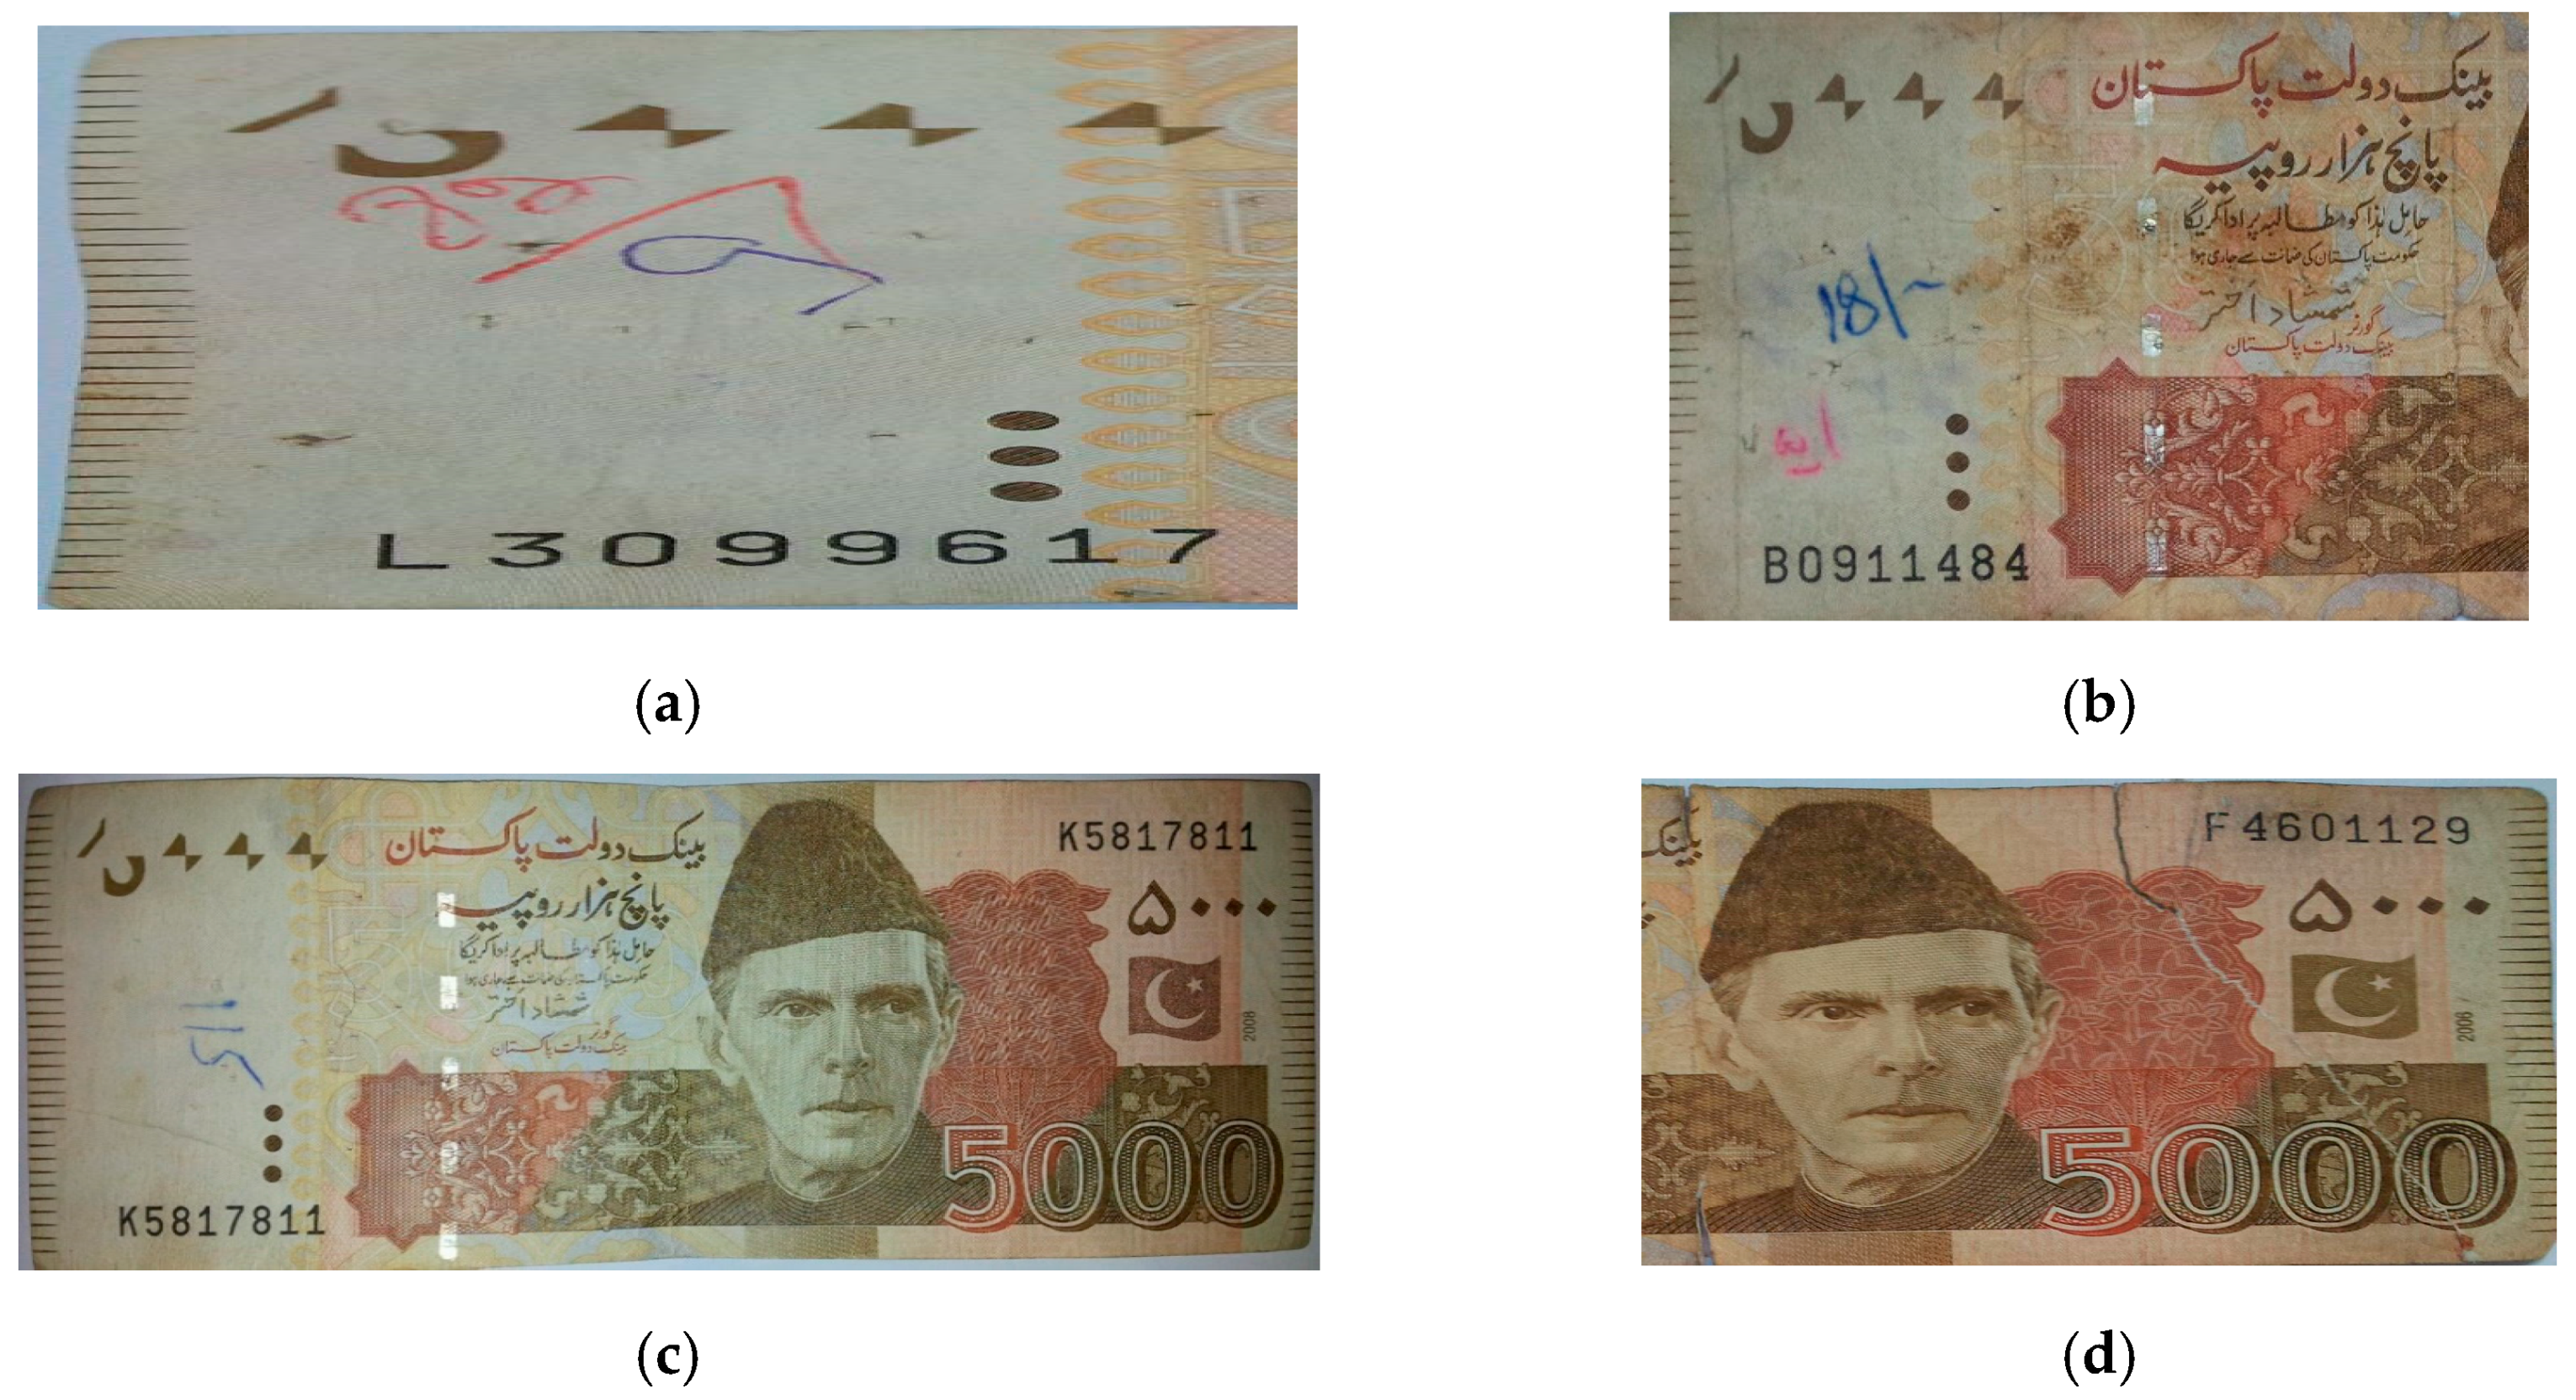
After extracting the prominent features, for paper currency verification, feature vectors of 3 denominations (Rs.500, Rs.1000, and Rs.5000) are used to train the system. The dataset consists of 263 banknotes of three different denominations, including 213 genuine and 50 counterfeit banknotes. This dataset include, 25% banknotes were worn, torn, washed, and with handwriting on different parts of the banknotes. Some of these banknotes are shown in Figure 10. The dataset was divided into training and test parts, 213 images are used for training including 180 genuine and 33 counterfeit banknotes as shown in Table 5 and rest of the 50 images were used for testing performance of the system. The dataset was developed using android device having dual core processor, 1 GB RAM and 5-megapixel built-in camera under different illumination condition in indoor and outdoor environment. For classification purpose, Support Vector Machines (SVMs) were employed for distinguishing between genuine and counterfeit banknotes. The major motivation for selecting SVM as a classifier is its suitability for binary classification problems, as in our case, we need to classify a banknote as genuine or counterfeit. Unlike other techniques such as [21,22], the proposed method does not require any special hardware and works simply with the android-based smartphone.
To assess the performance of the proposed system, a test dataset of 50 images including 33 genuine and 17 counterfeit banknotes of 3 different denominations was used. The test dataset included 25% worn, torn, and with handwriting on different parts of the banknotes. The proposed system achieved 92% accuracy in verification of the paper currency as shown in Table 6. The most misclassified cases were extremely worn and torn banknotes. The accuracy of the system is calculated using Equation (8).
5. Conclusions
This paper proposed a novel method for distinguishing genuine banknotes from counterfeits using android phone. This method employed statistical and texture roughness features for representation of security features of the banknote in image processing. These features were selected based on the critical analysis of the banknote using XRD and SEM techniques. In this regard, two important areas of the banknote, i.e., serial number and flag of the banknote were considered since these portions showed the maximum difference between genuine and counterfeit banknotes. The analysis results confirmed that genuine banknotes are much different than the counterfeit banknotes in terms of paper material such as quality of paper, printing ink, printing process and chemical composition. This helped the authors in selecting the appropriate statistical and texture roughness features from the image of the banknote. After extracting sets of features, SVM was employed as a classifier for recognition of genuine and counterfeit banknotes. The effectiveness of the proposed method was evaluated on our self-constructed dataset of Pakistani banknotes for each denomination. The dataset includes banknotes of three denominations i.e., Rs.500, Rs.1000, and Rs.5000. The results indicate that proposed method achieved 92% accuracy on this dataset, which is quite satisfactory. In the future, the authors would like to extend this method for other currencies of the world like dollars, pounds, yen and yuan.
Acknowledgments
This study is supported by the research grant of COMSATS Institute of Information Technology, Pakistan.
Author Contributions
Ubaid Ur Rahman, Allah Bux Sargano, and Usama Ijaz Bajwa conceived and designed the experiments; Ubaid Ur Rahman performed the experiments; Allah Bux Sargano and Usama Ijaz Bajwa analyzed the data; Ubaid Ur Rahman and Allah Bux Sargano contributed reagents/materials/analysis tools; Ubaid Ur Rahman and Allah Bux Sargano wrote the paper.
Conflicts of Interest
The authors declare no conflict of interest.
References
- The central bank of the Russian Federation. The Central Bank of the Russian Federation Bulletin of Banking Statistics Annual Report; Order No. 1467; Business News Agency PRIME: Moscow, Russia, 2011; pp. 100–101. [Google Scholar]
- Chang, C.C.; Yu, T.X.; Yen, H.Y. Paper currency verification with support vector machines. In Proceedings of the 3rd Signal-Image Technologies and Internet-Based System (SITIS 2007), Shanghai, China, 16–18 December 2007; pp. 860–865. [Google Scholar]
- Stanjek, H.; Häusler, W. Basics of X-ray Diffraction. Hyperfine Interact. 2004, 154, 107–119. [Google Scholar] [CrossRef]
- Dutrow, B.L.; Clark, C.M. Geochemical Instrumentation and Analysis: X-ray Powder Diffraction; Geochemsheets Carleton University: Ottawa, ON, Canada, 2008. [Google Scholar]
- Yoshida, K.; Kamruzzaman, M.; Jewel, F.A.; Sajal, R.F. Design and implementation of a machine vision based but low cost stand alone system for real time counterfeit Bangladeshi bank notes detection. In Proceedings of the 10th Computer and Information Technology (ICCIT 2007), Dhaka, Bangladesh, 27–29 December 2007; pp. 3–7. [Google Scholar]
- Zeggeye, J.F.; Assabie, Y. Automatic recognition and counterfeit detection of ethiopian paper currency. Int. J. Image Graph. Signal Process. 2016, 8, 28–36. [Google Scholar] [CrossRef]
- Xie, J.; Qin, C.; Liu, T.; He, Y.; Xu, M. A new method to identify the authenticity of banknotes based on the texture roughness. In Proceedings of the Robotics and Biomimetics (ROBIO 2009), Guilin, China, 19–23 December 2009; pp. 1268–1271. [Google Scholar]
- Spagnolo, G.S.; Cozzella, L.; Simonetti, C. Banknote security using a biometric-like technique: A hylemetric approach. Meas. Sci. Technol. 2010, 21, 55501. [Google Scholar] [CrossRef]
- Spagnolo, G.S.; Cozzella, L.; Simonetti, C. Currency verification by a 2D infrared barcode. Meas. Sci. Technol. 2010, 21, 107002. [Google Scholar] [CrossRef]
- Vila, A.; Ferrer, N.; Mantecón, J.; Bretón, D.; García, J.F. Development of a fast and non-destructive procedure for characterizing and distinguishing original and fake euro notes. Anal. Chim. Acta 2006, 559, 257–263. [Google Scholar] [CrossRef]
- Kang, K.; Lee, C. Fake banknote detection using multispectral images. In Proceedings of the 7th Information, Intelligence, Systems & Applications (IISA 2016), Chalkidiki, Greece, 13–15 July 2016; pp. 1–3. [Google Scholar]
- Mudassir, M.; Ismail, M.; Makone, A.B. Survey of an automated recognition of fake or destroyed Indian currency notes. Int. J. Comput. Sci. Manag. Stud. 2014, 2, 17–21. [Google Scholar]
- Rashmi, C.; Kumar, H. Image Processing Approach for INR Currency Note Number Recognition System for Automated Teller Machines. Int. J. Comput. Appl. Technol. Res. 2016, 5, 539–542. [Google Scholar]
- Akbari, A.A.; Fard, A.M.; Chegini, A.G. An effective image based surface roughness estimation approach using neural network. In Proceedings of the World Automation Congress (WAC 2006), Budapest, Hungary, 24–26 July 2006; pp. 1–6. [Google Scholar]
- Bux, A.; Sarfraz, M.; Haq, N. An intelligent system for paper currency recognition with robust features. J. Intell. Fuzzy Syst. 2014, 27, 1905–1913. [Google Scholar]
- Hassanpour, H.; Farahabadi, P.M. Using Hidden Markov Models for paper currency recognition. Expert Syst. Appl. 2009, 36, 10105–10111. [Google Scholar] [CrossRef]
- Sargano, A.B.; Sarfraz, M.; Haq, N. Robust features and paper currency recognition system. In Proceedings of the 6th International Conference on Information Technology (ICIT 2013), Amman, Jordan, 8–10 May 2013. [Google Scholar]
- Sun, B.; Li, J. Recognition for the banknotes grade based on CPN. In Proceedings of the Computer Science and Software Engineering (CSSE 2008), Hubei, China, 12–14 December 2008; pp. 90–93. [Google Scholar]
- Tan, C.L.; Jantan, A. Digit recognition using neural networks. Malaysian J. Comput. Sci. 2004, 17, 40–54. [Google Scholar]
- Sajal, R.F.; Kamruzzaman, M.; Jewel, F.A. A machine vision based automatic system for real time recognition and sorting of Bangladeshi bank notes. In Proceedings of the 11th Computer and Information Technology (ICCIT 2008), Khulna, Bangladesh, 24–27 December 2008; pp. 533–535. [Google Scholar]
- Takeda, F.; Nishikage, T. Multiple kinds of paper currency recognition using neural network and application for Euro currency. In Proceedings of the Neural Networks, Como, Italy, 27–27 July 2000; pp. 143–147. [Google Scholar]
- Eldefrawy, M.H.; Khan, M.K. Banknote validation through an embedded RFID chip and an NFC-enabled smartphone. Math. Probl. Eng. 2015, 2015, 264514. [Google Scholar] [CrossRef]
Figure 1.
Genuine Banknote.

Figure 2.
Counterfeit banknote.

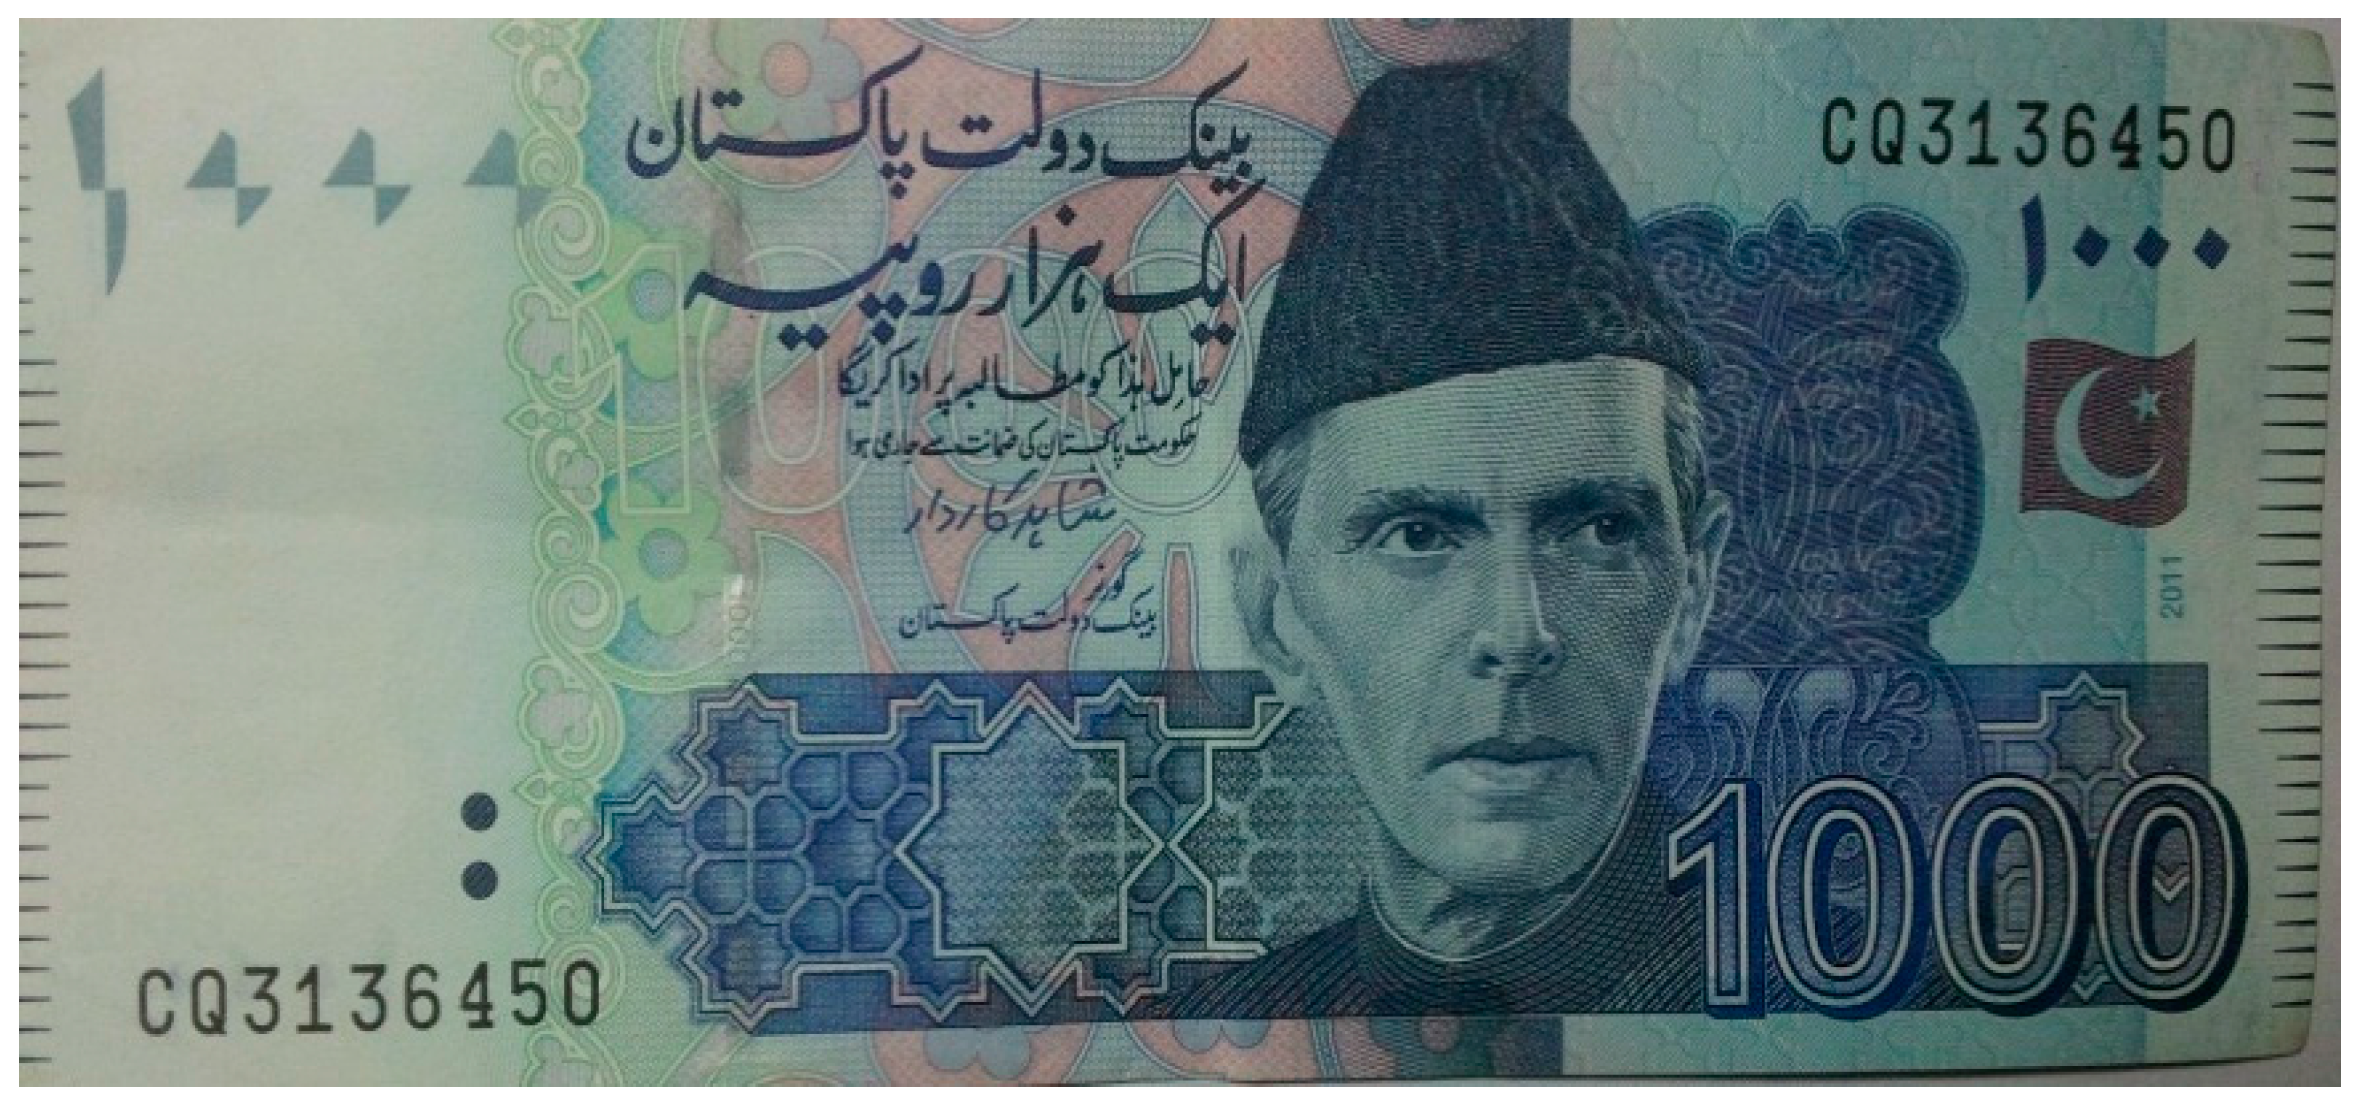
Figure 3.
Selected portions in Rs.1000 used for XRD analysis.

Figure 4.
(a) SEM image of the flag portion of the genuine banknote. (b) SEM image of the flag portion of counterfeit banknote.
Figure 4.
(a) SEM image of the flag portion of the genuine banknote. (b) SEM image of the flag portion of counterfeit banknote.

Figure 5.
Histogram of SEM images of genuine and counterfeit banknotes.
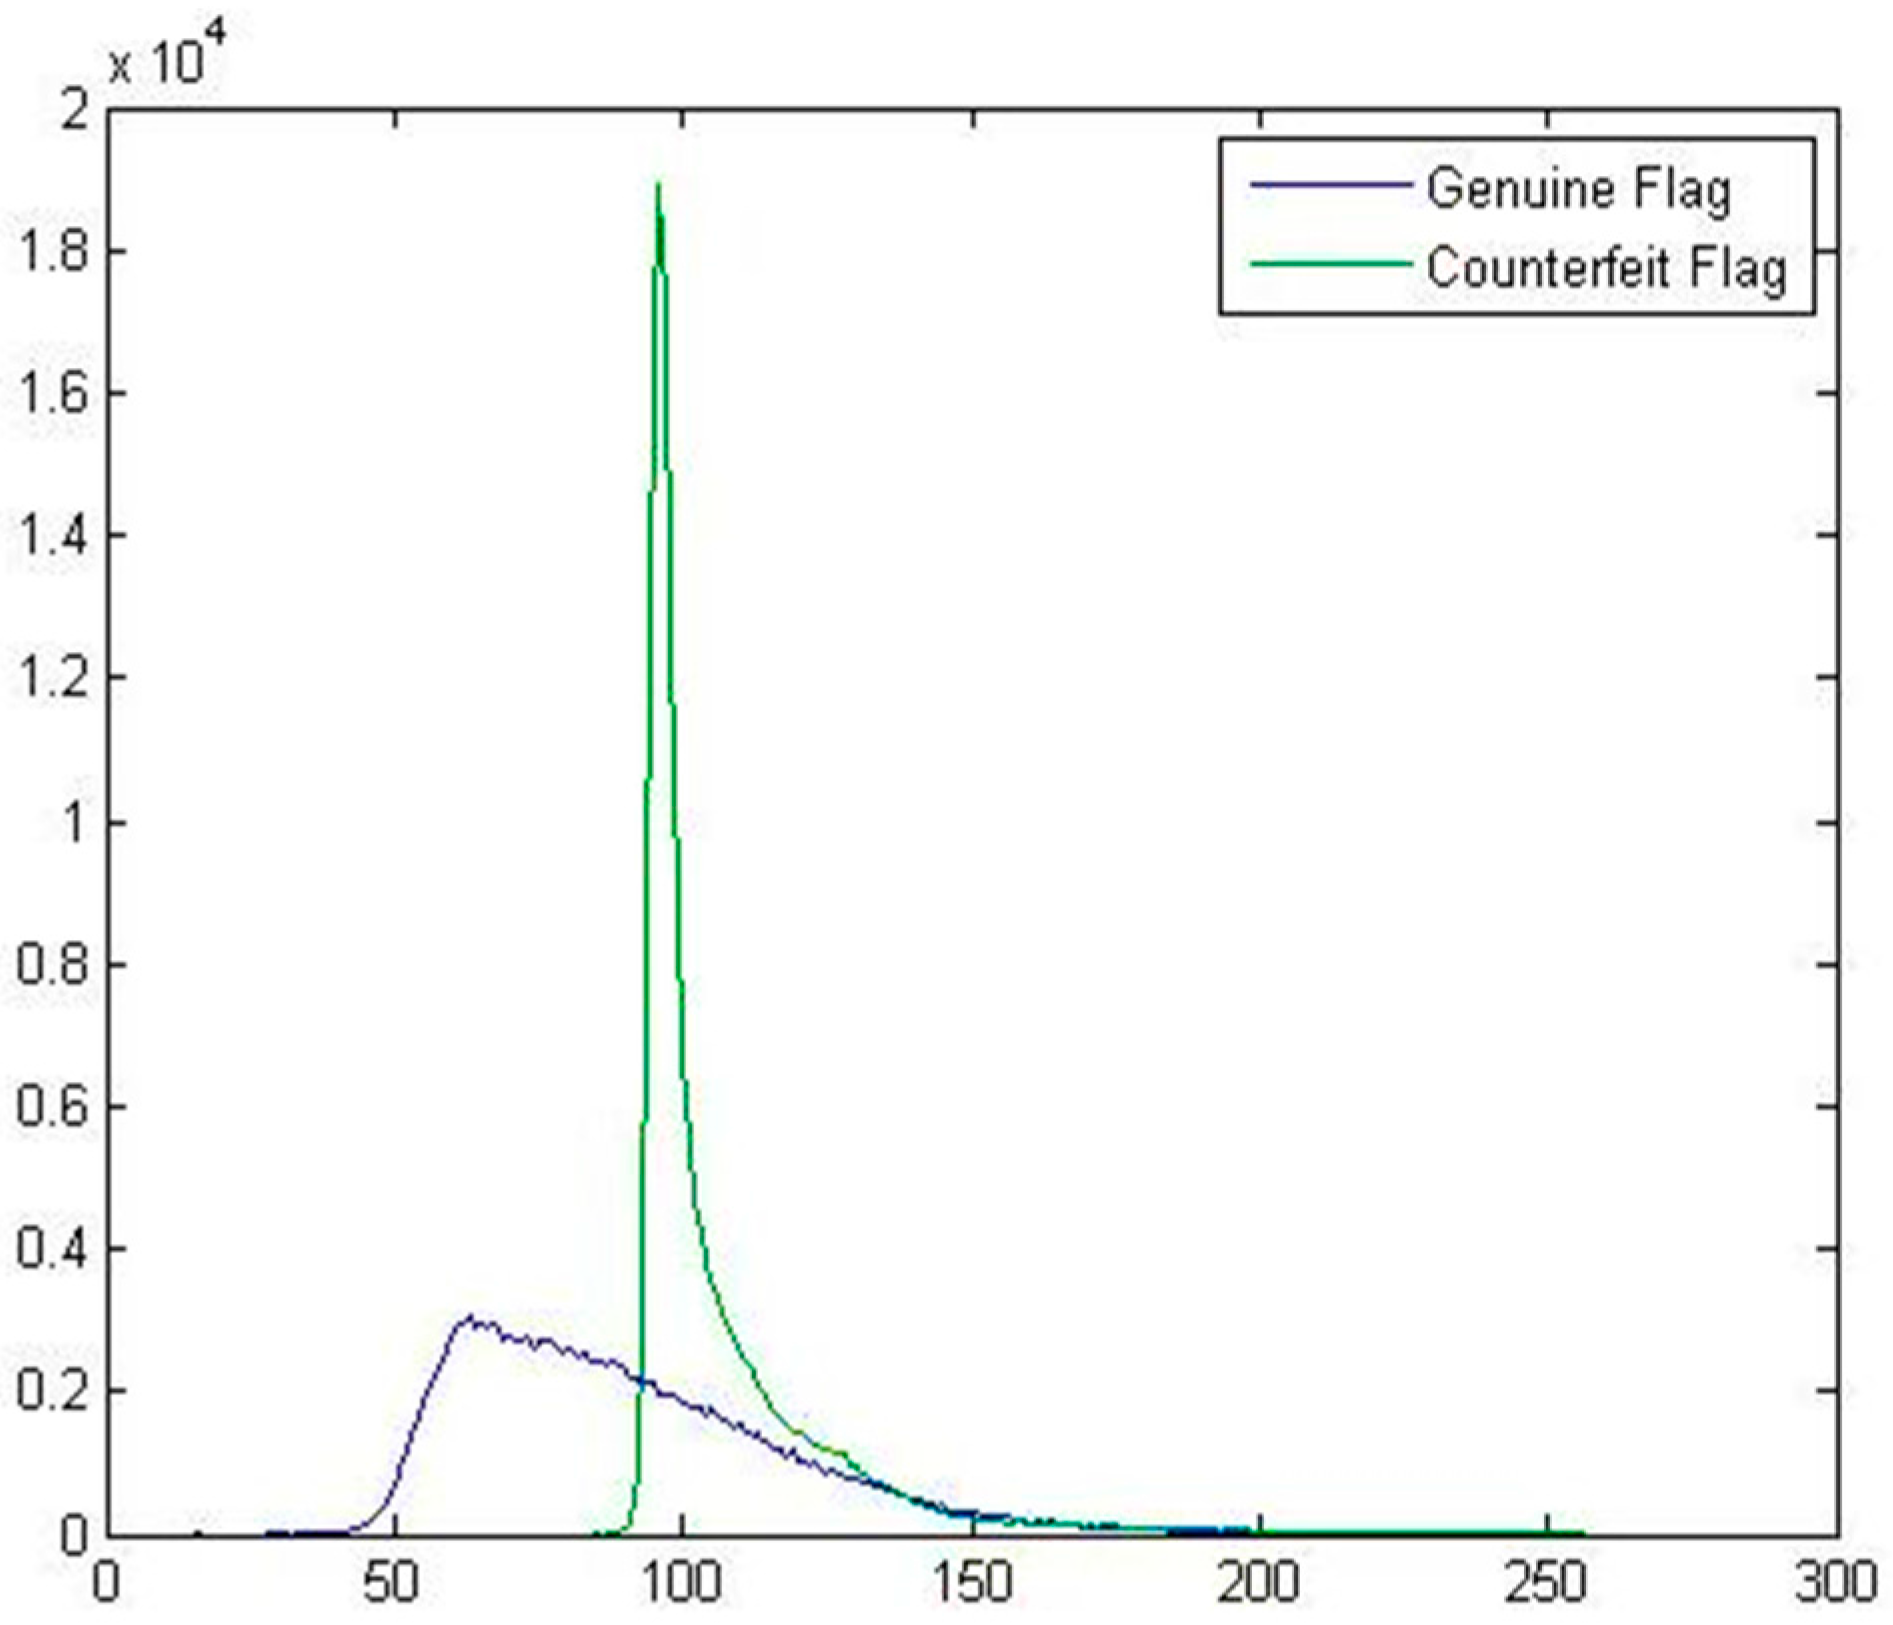
Figure 6.
Flow chart of the proposed method.
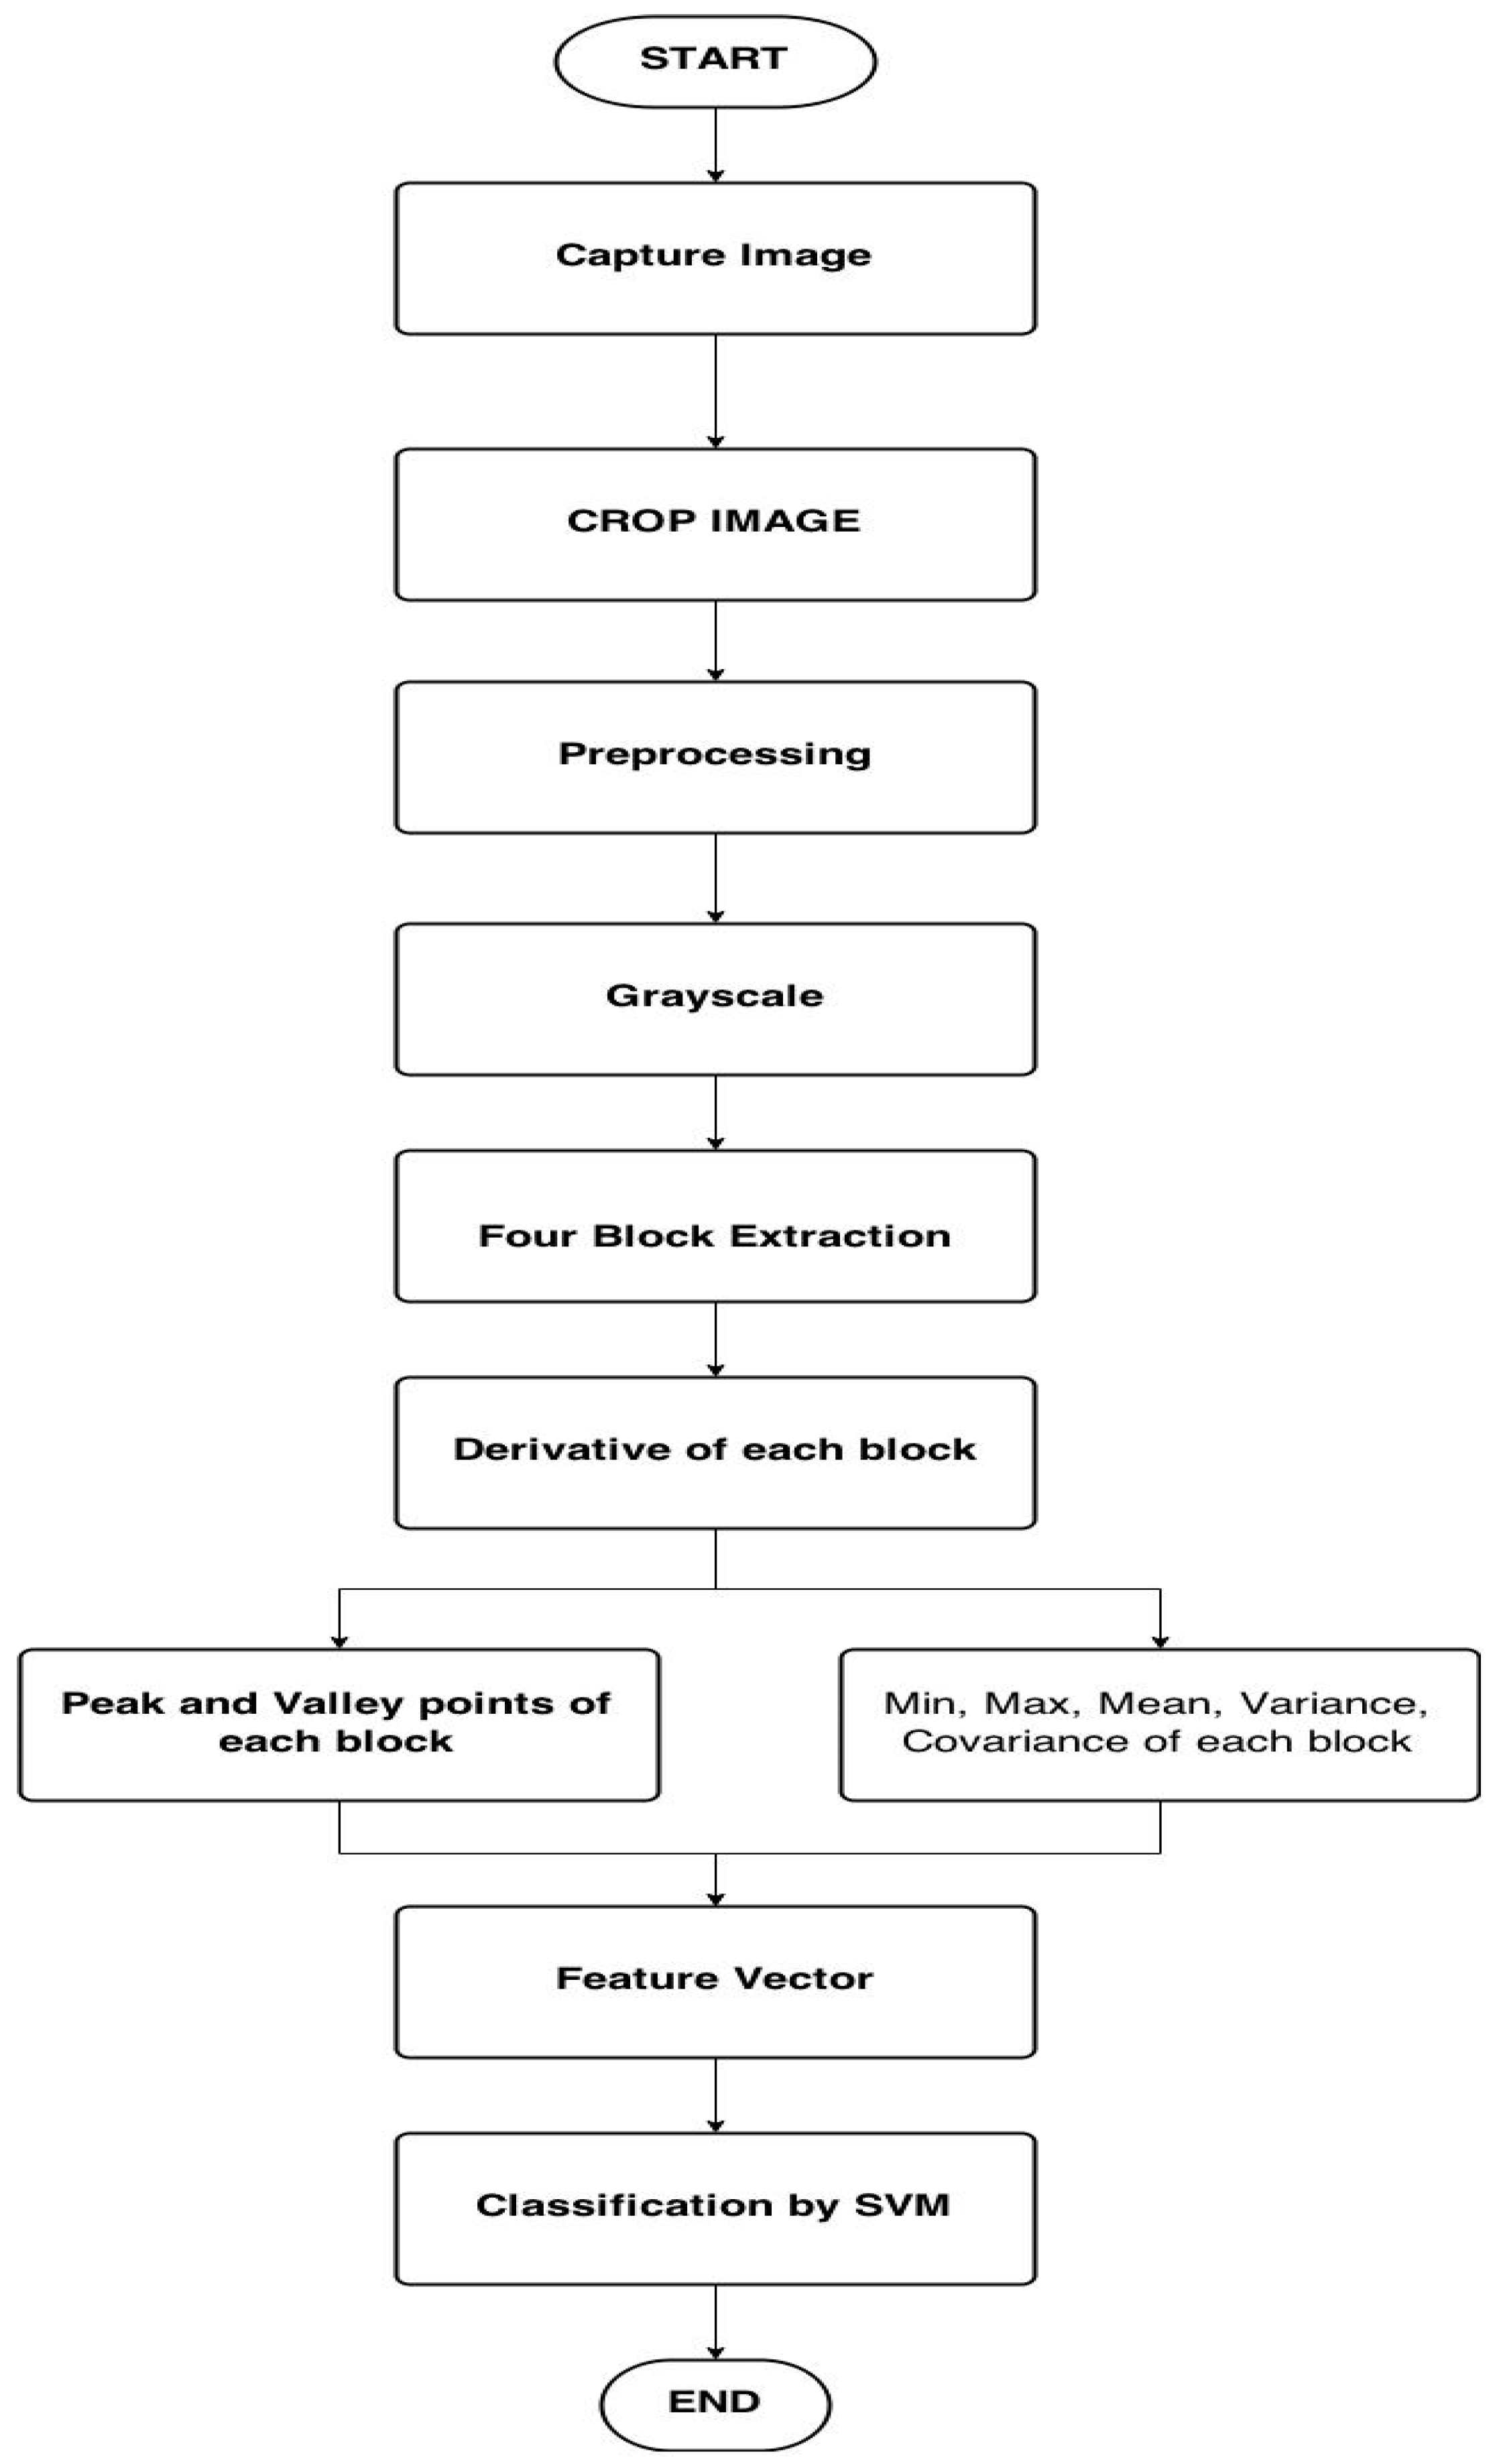
Figure 7.
Banknote acquisition and cropping.

Figure 8.
Cropped image of banknote.

Figure 9.
Derivative image of genuine and counterfeit banknotes.
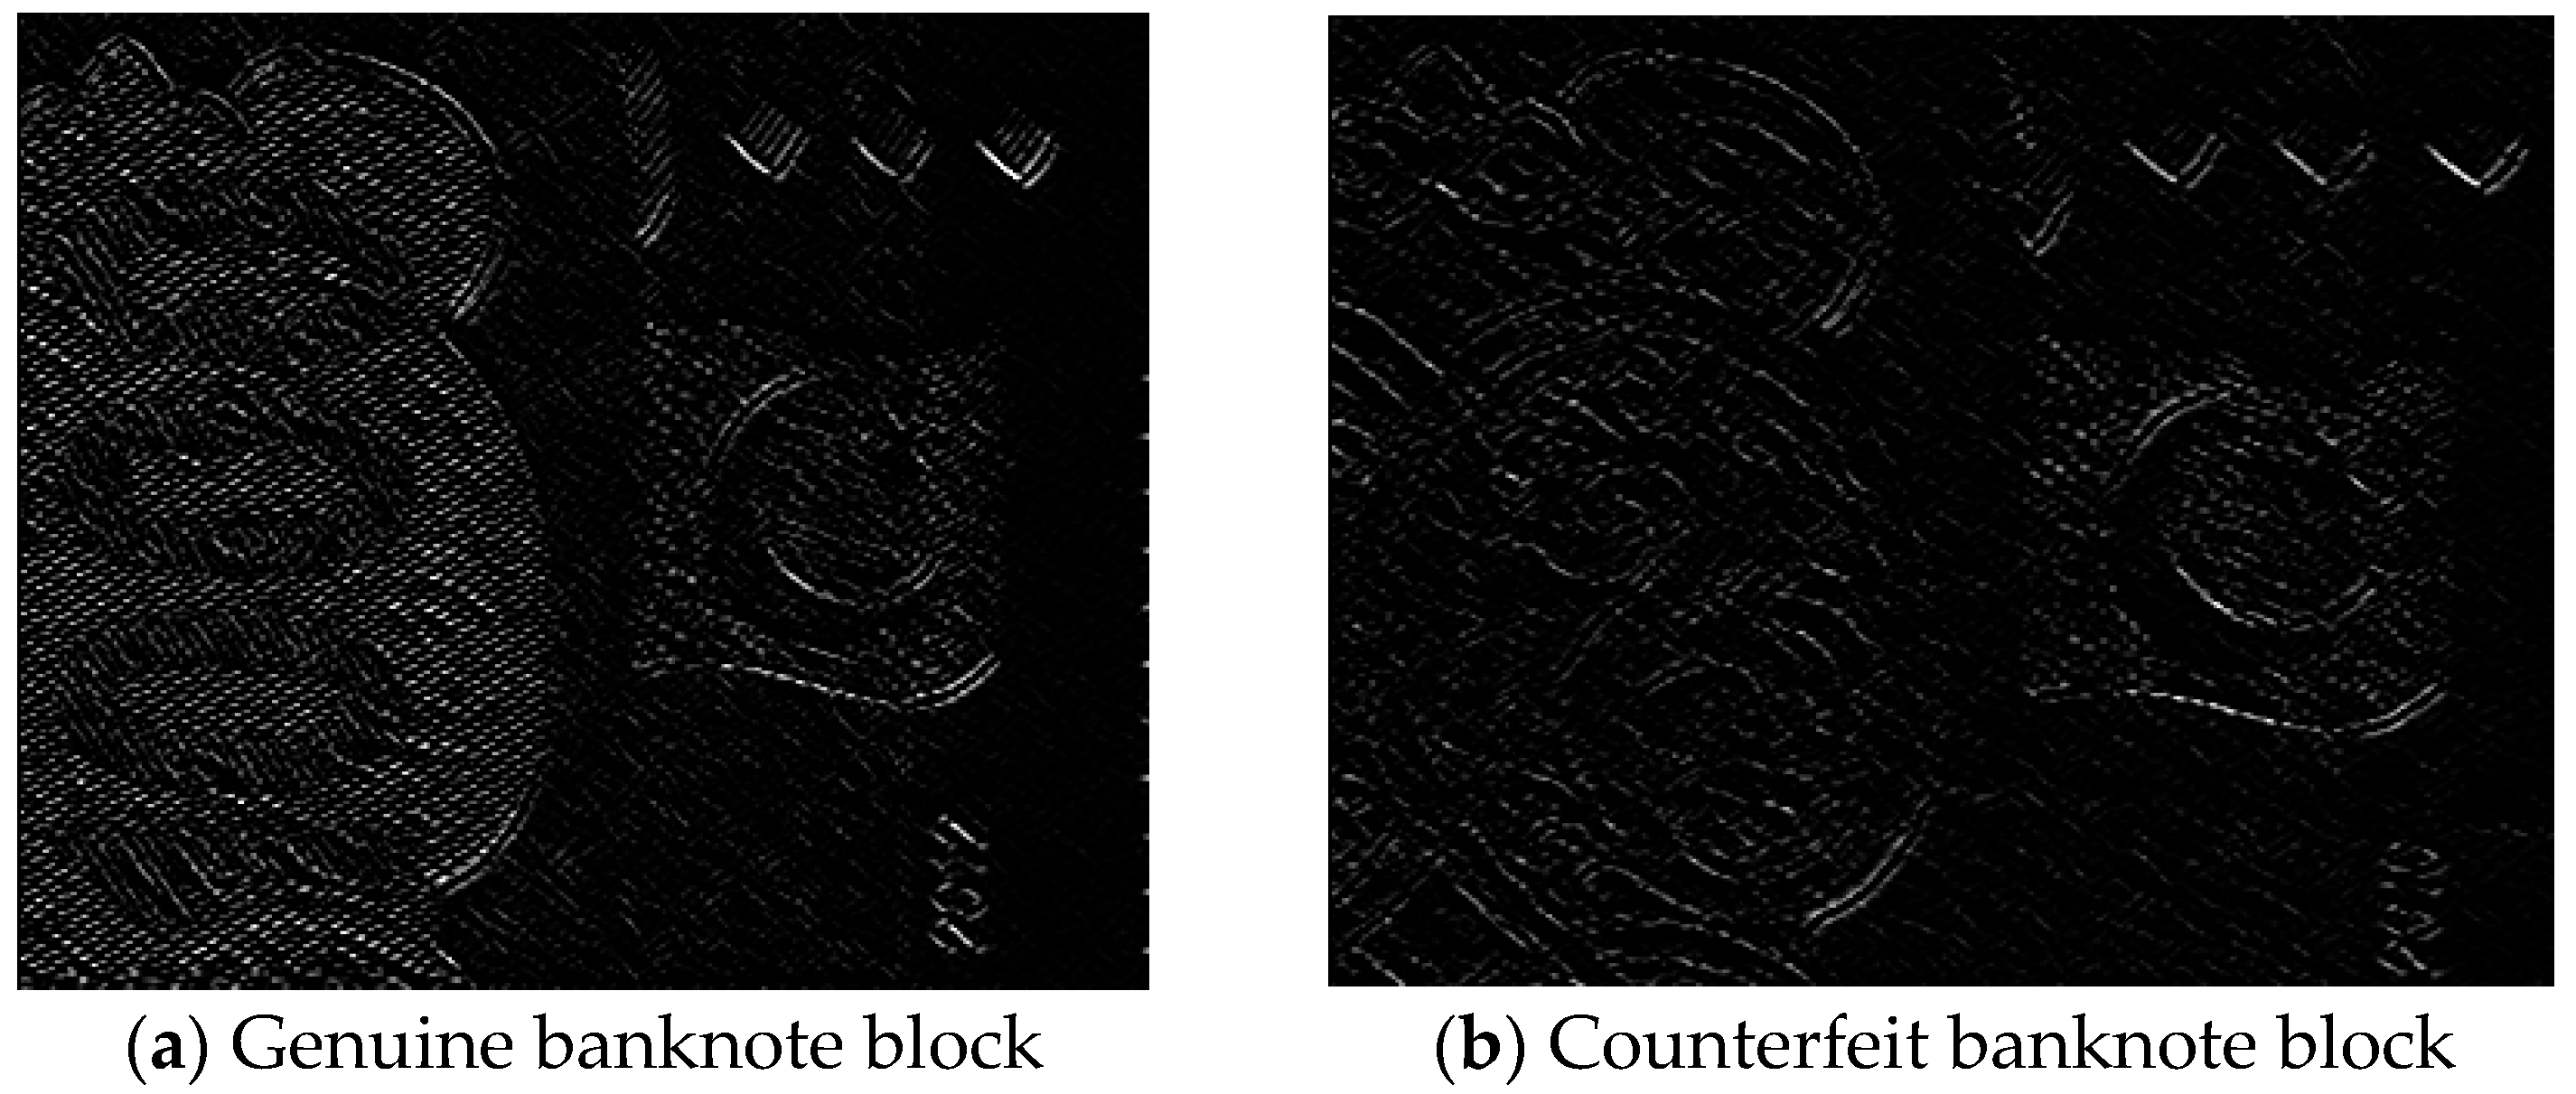
Figure 10.
(a) Banknote with handwriting near the see through umber (b) Banknote with handwriting on left side (c) Washed banknote (d) Torn and then fixed banknote.
Figure 10.
(a) Banknote with handwriting near the see through umber (b) Banknote with handwriting on left side (c) Washed banknote (d) Torn and then fixed banknote.

Table 1.
Analysis report by central bank of Russia on counterfeited features.
| Security Feature | % Counterfeited Cases |
|---|---|
| Water mark | 95 |
| Protective fiber | 95 |
| Security Thread | 75 |
| Text on security thread | 87 |
| Micro-printing | 70 |
Table 2.
Flag XRD of genuine banknote.
| Element | Weight % | Atomic % |
|---|---|---|
| C K | 47.17 | 63.88 |
| O K | 27.72 | 28.18 |
| Na K | 0.11 | 0.08 |
| Mg K | 0.45 | 0.30 |
| Si K | 1.40 | 0.81 |
| F L | 23.16 | 6.75 |
| Total | 100 | 100 |
Table 3.
Flag XRD of counterfeit banknote.
| Element | Weight % | Atomic % |
|---|---|---|
| C K | 68.45 | 74.51 |
| O K | 30.65 | 25.05 |
| Al K | 0.90 | 0.44 |
| Total | 100.0 | 100.0 |
Table 4.
Peak points, valley points, and other points.
| Current Pixel I(r,c) | Previous − x I(r,c−1) | Previous − y I(r−1,c) | Group Name |
|---|---|---|---|
| +ve | −ve | −ve | Peak |
| +ve | −ve | +ve | Partial Peak −yx |
| +ve | +ve | −ve | Partial Peak −xy |
| +ve | +ve | +ve | Ramp down |
| −ve | −ve | −ve | Ramp up |
| −ve | −ve | +ve | Partial Valley −yx |
| −ve | +ve | −ve | Partial Valley −xy |
| −ve | +ve | +ve | Valley |
Table 5.
Support Vector Machines (SVMs) learning parameters.
| Number of Banknotes | 213 |
| Banknote Types | 3 (Rs.500, Rs.1000, Rs.5000) |
| Number of Genuine Banknotes | 180 |
| Number of Counterfeit Banknotes | 33 |
| Number of Inputs | 72 |
| Number of Outputs | 1 (0/1) |
Table 6.
Verification Results.
| Serial Number | Banknote Type | Genuine/Counterfeit | Number of Notes Checked | Number of Correctly Verified |
|---|---|---|---|---|
| 1 | 500 | Genuine | 9 | 9 |
| 2 | 500 | Counterfeit | 6 | 5 |
| 3 | 1000 | Genuine | 15 | 14 |
| 4 | 1000 | Counterfeit | 6 | 6 |
| 5 | 5000 | Genuine | 9 | 8 |
| 6 | 5000 | Counterfeit | 5 | 4 |
| Total | 50 | 46 | ||
© 2017 by the authors. Licensee MDPI, Basel, Switzerland. This article is an open access article distributed under the terms and conditions of the Creative Commons Attribution (CC BY) license (http://creativecommons.org/licenses/by/4.0/).
Share and Cite
MDPI and ACS Style
Rahman, U.U.; Sargano, A.B.; Bajwa, U.I. Android-Based Verification System for Banknotes. J. Imaging 2017, 3, 54. https://doi.org/10.3390/jimaging3040054
AMA Style
Rahman UU, Sargano AB, Bajwa UI. Android-Based Verification System for Banknotes. Journal of Imaging. 2017; 3(4):54. https://doi.org/10.3390/jimaging3040054
Chicago/Turabian StyleRahman, Ubaid Ur, Allah Bux Sargano, and Usama Ijaz Bajwa. 2017. "Android-Based Verification System for Banknotes" Journal of Imaging 3, no. 4: 54. https://doi.org/10.3390/jimaging3040054
Note that from the first issue of 2016, this journal uses article numbers instead of page numbers. See further details here.