1. Introduction
A 2015 review of metal additive manufacturing notes the rapid growth in applications as well as two significant problems, lack of crystal growth control and excess gas porosity within the metal object [
1]. Porosity characterization strategies have been explored for cobalt-chrome objects produced with direct metal laser sintering [
2]. The methods evaluated included simple mass/volume, Archimedes, and direct observation of pores with X-ray tomography, all leading to an observed correlation between speed of sound and porosity [
2]. X-ray tomography has also been used to evaluate pore structure shape and size distributions in titanium alloy (Ti6Al4V) objects produced with electron beam melting [
3,
4], detecting pores down to 5.2
m diameter. The as yet untouched domain, and the subject of this work, is imaging the spatial variation of sub-micron pores within metal additive manufacturing objects. Small-angle neutron scattering (SANS) is a well established method for particle analysis, including porosity within objects [
5]. The spatially resolved version of this experiment has heretofore relied on inefficient beam defining optics.
Grating-based neutron interferometry used in the Talbot-Lau geometry [
6] has provided a route to spatially resolved SANS-type data through an imaging modality labeled “dark-field” imaging. A quantitative assessment shows neutron dark-field imaging can assess particle sizes near 1
m in size [
7]. For comparison, direct attenuation neutron imaging, while highly useful for imaging additive manufacturing structures [
8], is largely limited to a spatial resolution near 15
m [
9]. Neutron attenuation imaging can be enhanced with wavelength-selective instrumentation and by making use of Bragg diffraction from crystalline domains [
10]. Dehoff et al. showed that Bragg-edge neutron imaging can detect planned crystallographic grain orientation in electron beam melting additive manufacturing [
10]. Nevertheless, attenuation imaging is limited to effective pixel sizes well above 15
m due to limited neutron flux and detector pixel size.
In a remarkable discovery, a Talbot-Lau interferometer was easily transformed into a new operational mode, named far-field interferometry [
11]. An essential feature of both Talbot-Lau and far-field interferometers is the capability for micron-sized fabrications spaced at millimeter distances to interact with sub-nm wavelengths of neutrons or X-rays. This yields Moiré patterns at dimensions accessible with available position sensitive detectors, i.e., ≈50
m. A far-field interferometer can operate with a phase incoherent, broad wavelength, diffuse radiation source. Phase coherence is induced with narrow slits and an evolution distance. Then, two closely-spaced phase gratings create an intensity pattern similar to the Moiré pattern that can be created by two absorption gratings; in both cases, the gratings have linear features to affect a phase shift or absorption. The Moiré pattern is characterized by its evolution with a transverse motion of one of the gratings [
11].
A far-field interferometer yields three image modalities: traditional neutron attenuation, differential phase shift, and dark-field (scattering). We note the grating interferometry literature uses both “dark-field” and “scattering” to describe one of the three imaging modalities available with interferometry. The scattering image shows the reduction of the Moiré pattern beyond that due to attenuation of beam intensity in the sample. The scattering image is a spatially resolved SANS experiment at a single q-vector. As the phase grating spacing is increased, increasingly longer q-vectors are sampled. Thus, a series of dark-field images constitutes a complete, spatially-resolved SANS experiment.
The thermal stresses typically experienced by objects undergoing laser melting processes vary drastically based on part geometry, and in extreme cases can lead to part failure before the manufacturing process is complete. The internal porosity and oriented micro-structures generated in additively manufactured (AM) parts has been shown to produce differences in the overall ductility, though not a significant difference in the overall strength of the parts [
12]. Void growth plays a key part in the ductile response of metals, and has been investigated by X-ray computed tomography [
13]. Because the average size of voids in steel in low strain situations is less than 5
m [
14], approximately the lower limit of typical X-ray computed tomography resolution, scattering imaging is the only method available to observe these voids. In this study we focus on the attenuation and “dark-field” imaging to observe print quality and potential voids in AM samples.
2. Materials and Methods
The following section describes the AM printing process, sample design, neutron far-field imaging, and data analysis.
2.1. Additive Manufacturing
Laser melting was used to make stainless steel cubes (1 cm)
and quadratics (
Section 2.2) for neutron interferometry analysis. This process uses a laser to selectively melt a bed of spherical metallic powder approximately 20
m thick. Each layer corresponds to a cross section of the desired parts. A Concept Laser Mlab cusing R machine was used for part manufacturing (NIST disclaimer: “Certain trade names and company products are mentioned in the text or identified in an illustration in order to adequately specify the experimental procedure and equipment used. In no case does such identification imply recommendation or endorsement by the National Institute of Standards and Technology, nor does it imply that the products are necessarily the best available for the purpose”). The material used was Concept Laser CL 20ES, an austenitic stainless steel powder following formulations for grade 316 L (CL20-ES,
www.concept-laser.de), and the machine’s built-in processing parameter set was used. For all objects, no post-processing was done past the removal of support structures; therefore, the outer surface had visible roughness. All objects were manufactured in the same build.
2.2. Quadratic Shapes
The design flexibility enabled by additive manufacturing was exploited to make an object designed for sensitivity testing of the differential phase contrast image. As such, the object was required to show a quadratic profile to the neutron beam, yielding a differential phase contrast image as a linear function of horizontal position: d
d
[
6]. A smoothly evolving quadratic profile, Equation (
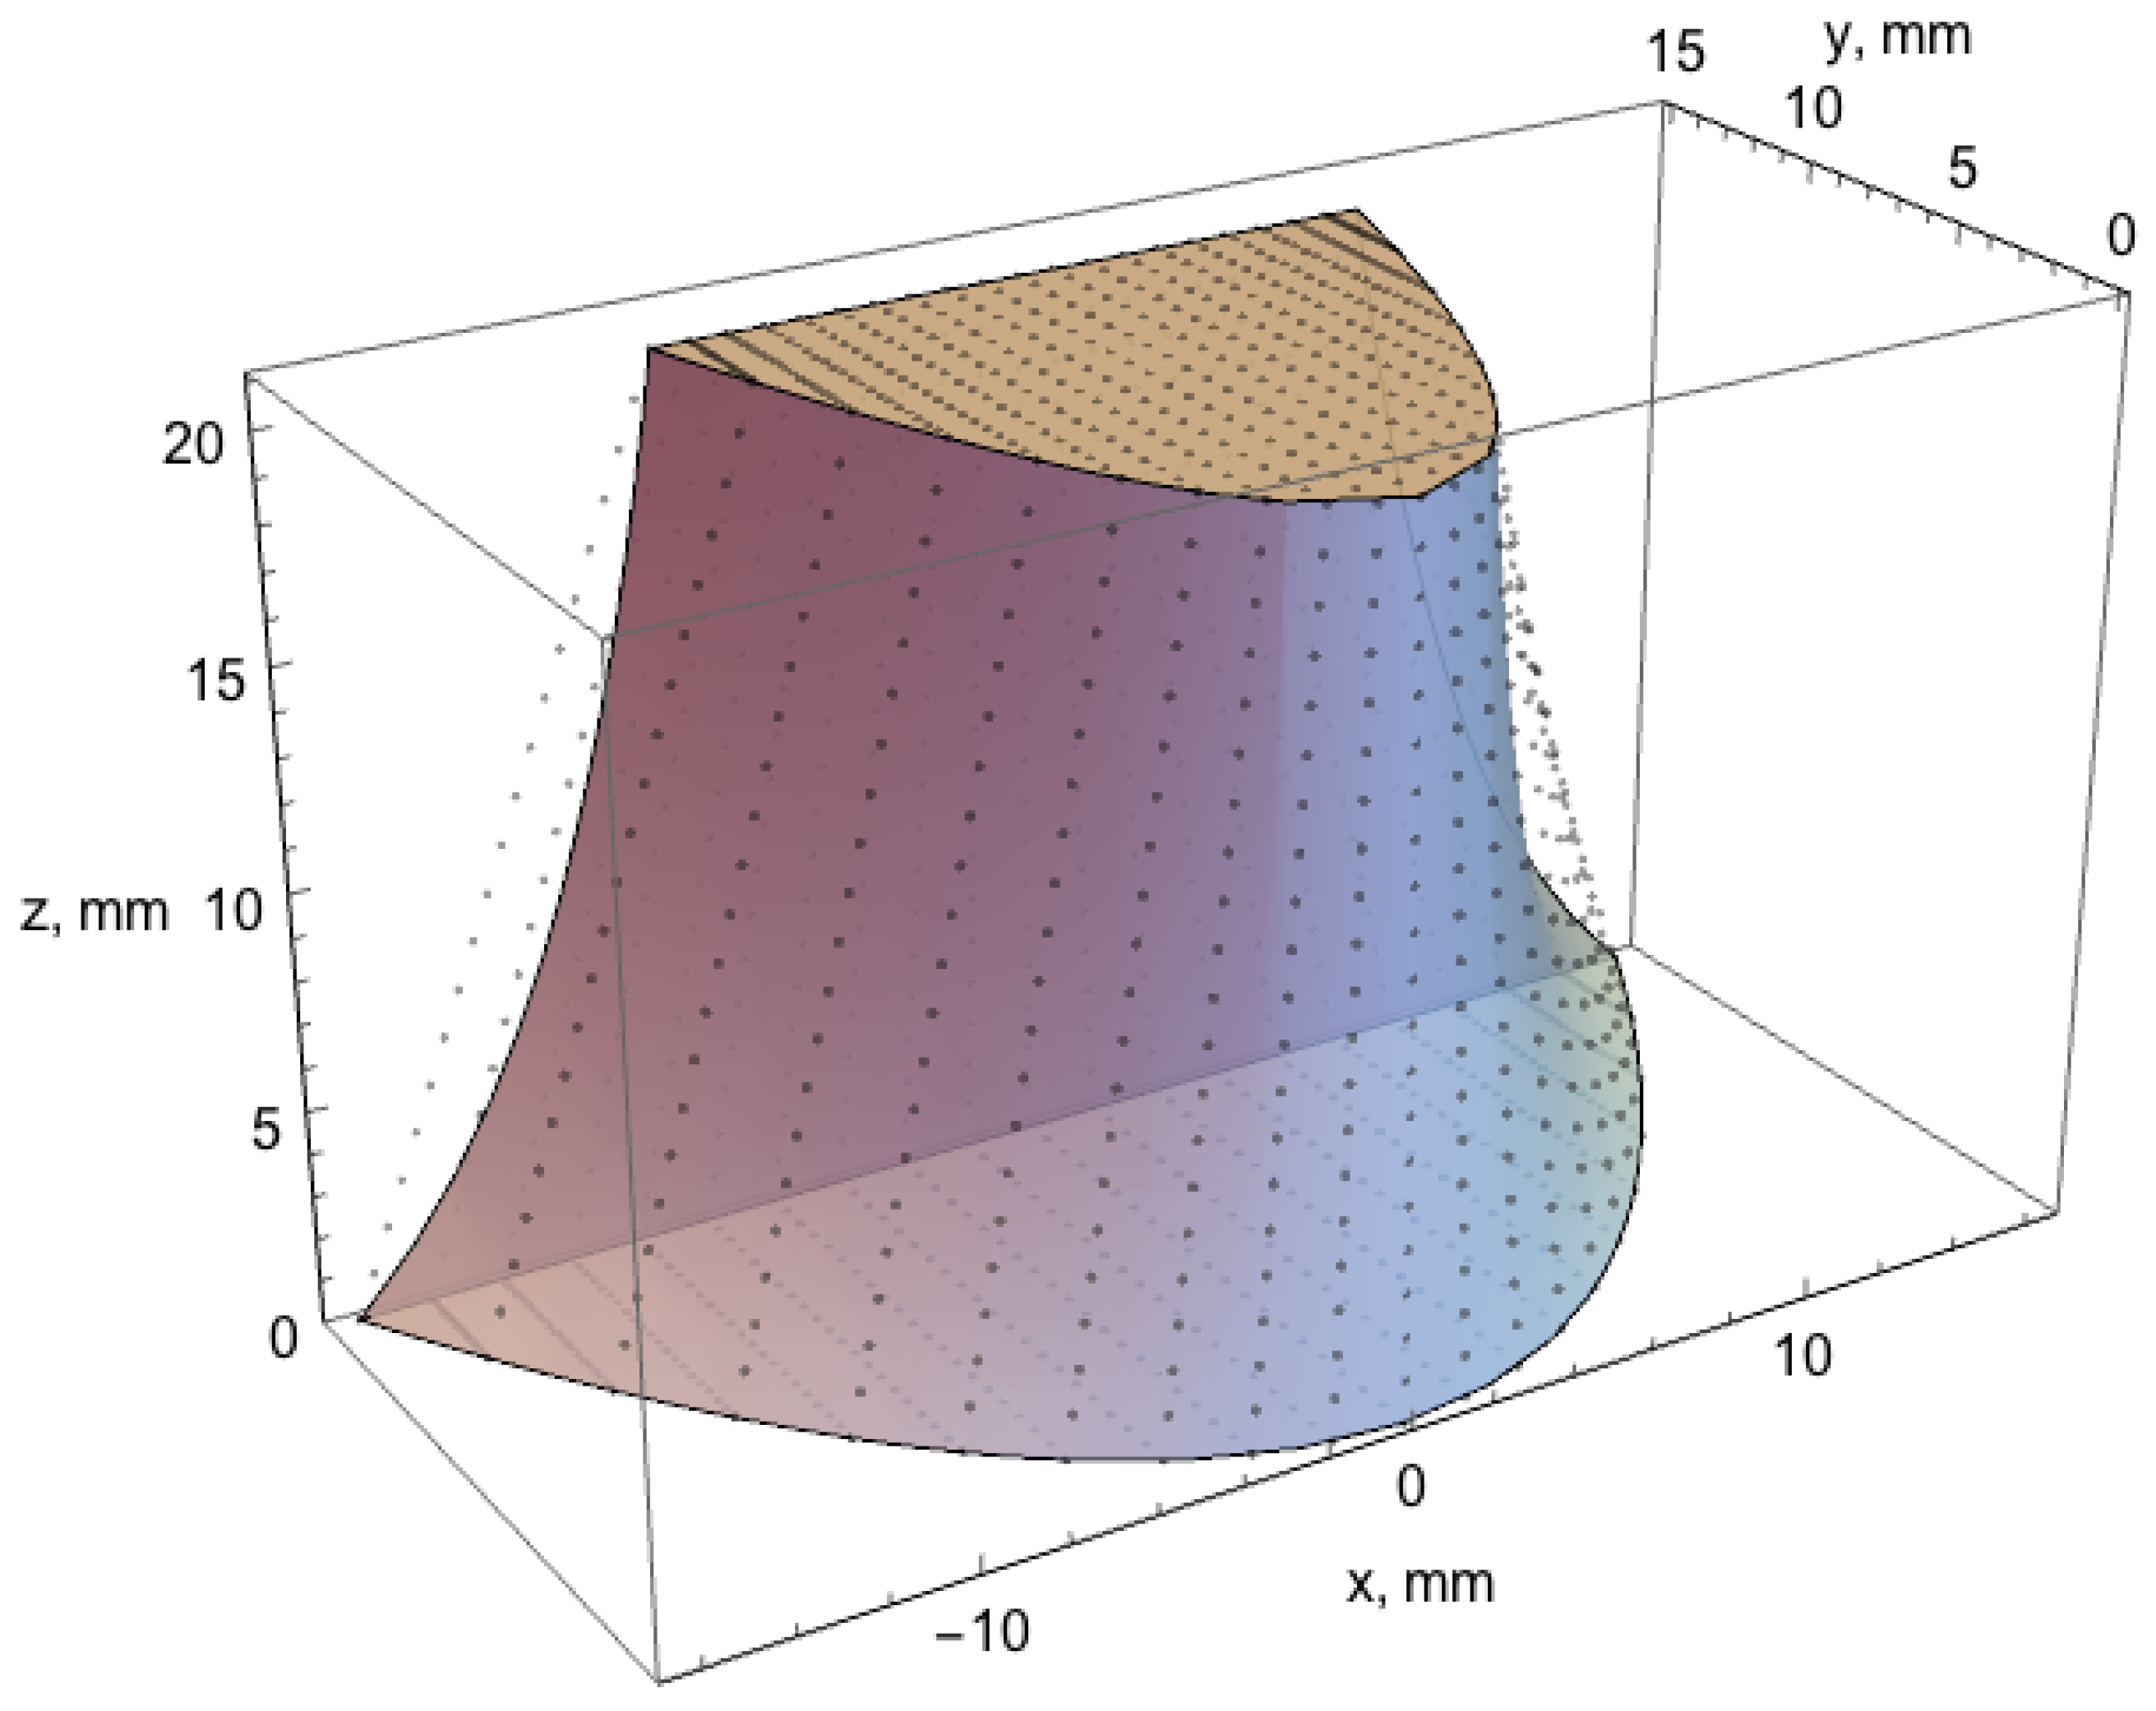
1), is given by the region
shown in blue in
Figure 1. The blue object has a height along
z of
h = 20.2 mm and
= 15.0 mm. The quadratic for the bottom plane is defined by
= 0.0568047 mm
and for the top plane,
= 0.207612 mm
. A computer aided design (CAD) model was prepared with the end planes as shown in
Figure 1, then linearly interpolated along
z to give the points shown in gray. The CAD drawing program, OnShape, was used to create a STereoLithography (STL) file corresponding to the gray points. The interpolated quadratic was printed to give an object 20.2 mm high, 15.0 mm maximum thickness, and a width smoothly varying from 32.5 mm at the bottom to 17.0 mm at the top.
The volume of the quadratic object is given by
and the volume of the interpolated quadratic is
The calculated volumes are 4509.3 mm and 4999.5 mm for the quadratic and interpolated quadratic, respectively. The sample mass for the interpolated quadratic is 37.181 g giving a calculated density of 7.437 g/cm.
2.3. Neutron Interferometry and Tomography
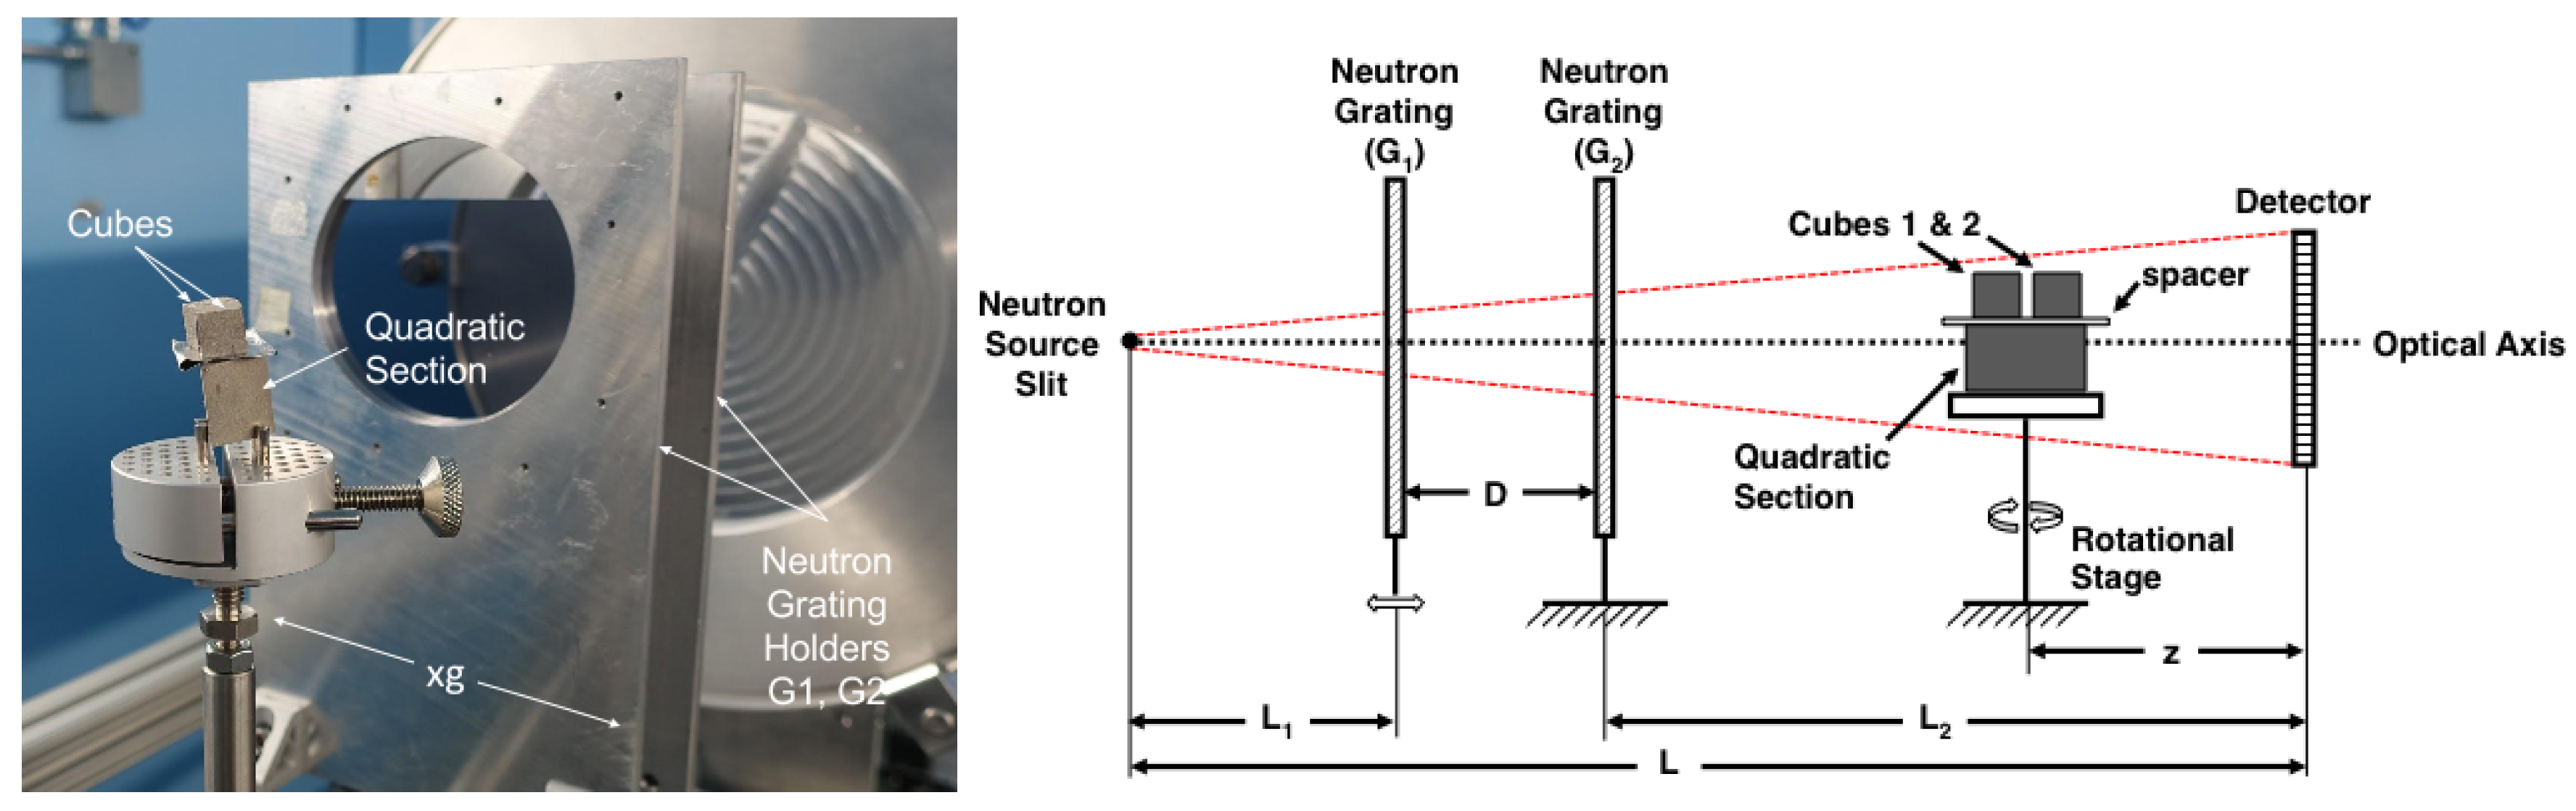
Imaging was done at the NCNR NG6 Cold Neutron imaging beamline [
15]. The beamline is described in [
16] and a portion—sample holder, G1, and G2 phase gratings—is shown in
Figure 2. The neutron flux at the sample is estimated at 5.0 ×
cm
s
with a wavelength of 0.54 nm. The beam defining slits were adjusted to an uncalibrated opening of 0.5 mm horizontal and 5 cm vertical; the images are blurred along the vertical direction. The interferometer was operated in a symmetrical geometry, where the slit-to-detector distance (
L) was 8.71 m, the detector-to-G2 distance (
) was 4.355 m, and the slit-to-G2 distance (
) was 4.355 m. The gratings were fabricated at the NIST Center for Nanoscale Science and Technology on 10 cm diameter Si wafers, 0.5 mm thick.
The sample was mounted on a rotation stage and positioned 5 cm downstream of G2. This position yields an optical magnification of . A 150 m thick LiF/ZnS scintillator was used with an Andor NEO sCMOS detector optically coupled with a Nikor f/1.2 50 mm lens. The scintillator, front surface mirror, lens, and detector were mounted in a light-tight box and bellows. The detector had 2560 × 2160 square 6.5 m pixels; the lens gives an effective pixel size of 51.35 m. The geometric magnification of 2 then gives an effective pixel size of 25.7 m pixels. Exposure times were 10 s and 20 s, with raw sample images corrected with dark count images.
The interferometer was operated in two modes: D-scan and tomography/D-scan. In D-scan mode, a fixed sample rotation was used and the distance between the G1 and G2 gratings () was scanned in 1 mm increments. The scans went from 3 mm to 35 mm, corresponding to a range of autocorrelation scattering lengths 338 nm to 4.5 m. In tomography/D-scan mode, the gratings were set at a specific distance and the sample was rotated in 1 increments from 0 to 180. In both modes, interferometer stability was such that reference scans were obtained within 1 h to 2 h of sample scans.
For both radiography and tomography, the interferometer used the stepped-grating mode, typically with 9 step positions evenly spaced over 3
m, slightly more than the 2.4
m phase grating period. The reduction of the interferograms to projections of attenuation, differential phase contrast, and dark-field (small angle scattering) images was done with a vectorized least square algorithm [
17]. The tomography projections were reconstructed with the Advanced Photon Source “TomoPy” package, including the simultaneous iterative reconstruction technique (SIRT) (ASTRA toolbox) [
18].
2.4. Image Analysis
The first inspection of attenuation, dark-field, and visibility of D-scan data for the quadratic and two cubes (D-scan range from 3 mm to 35 mm, = 338 nm to = 4.5 m) was done in Image J. Briefly, the attenuation is constant as a function of D(G1-G2). It visibility diminishes, and the dark-field is initially positive.
The dark-field signal is a measurement of the visibility of the system,
V (see Equation (9) in [
16])
When a sample is added to the beam path, intensity changes of the sine wave can determine sample visibility,
, and reference visibility,
. The DF signal is the ratio of
and
as calculated in Equation (
5) (see Equation (11) in [
17]):
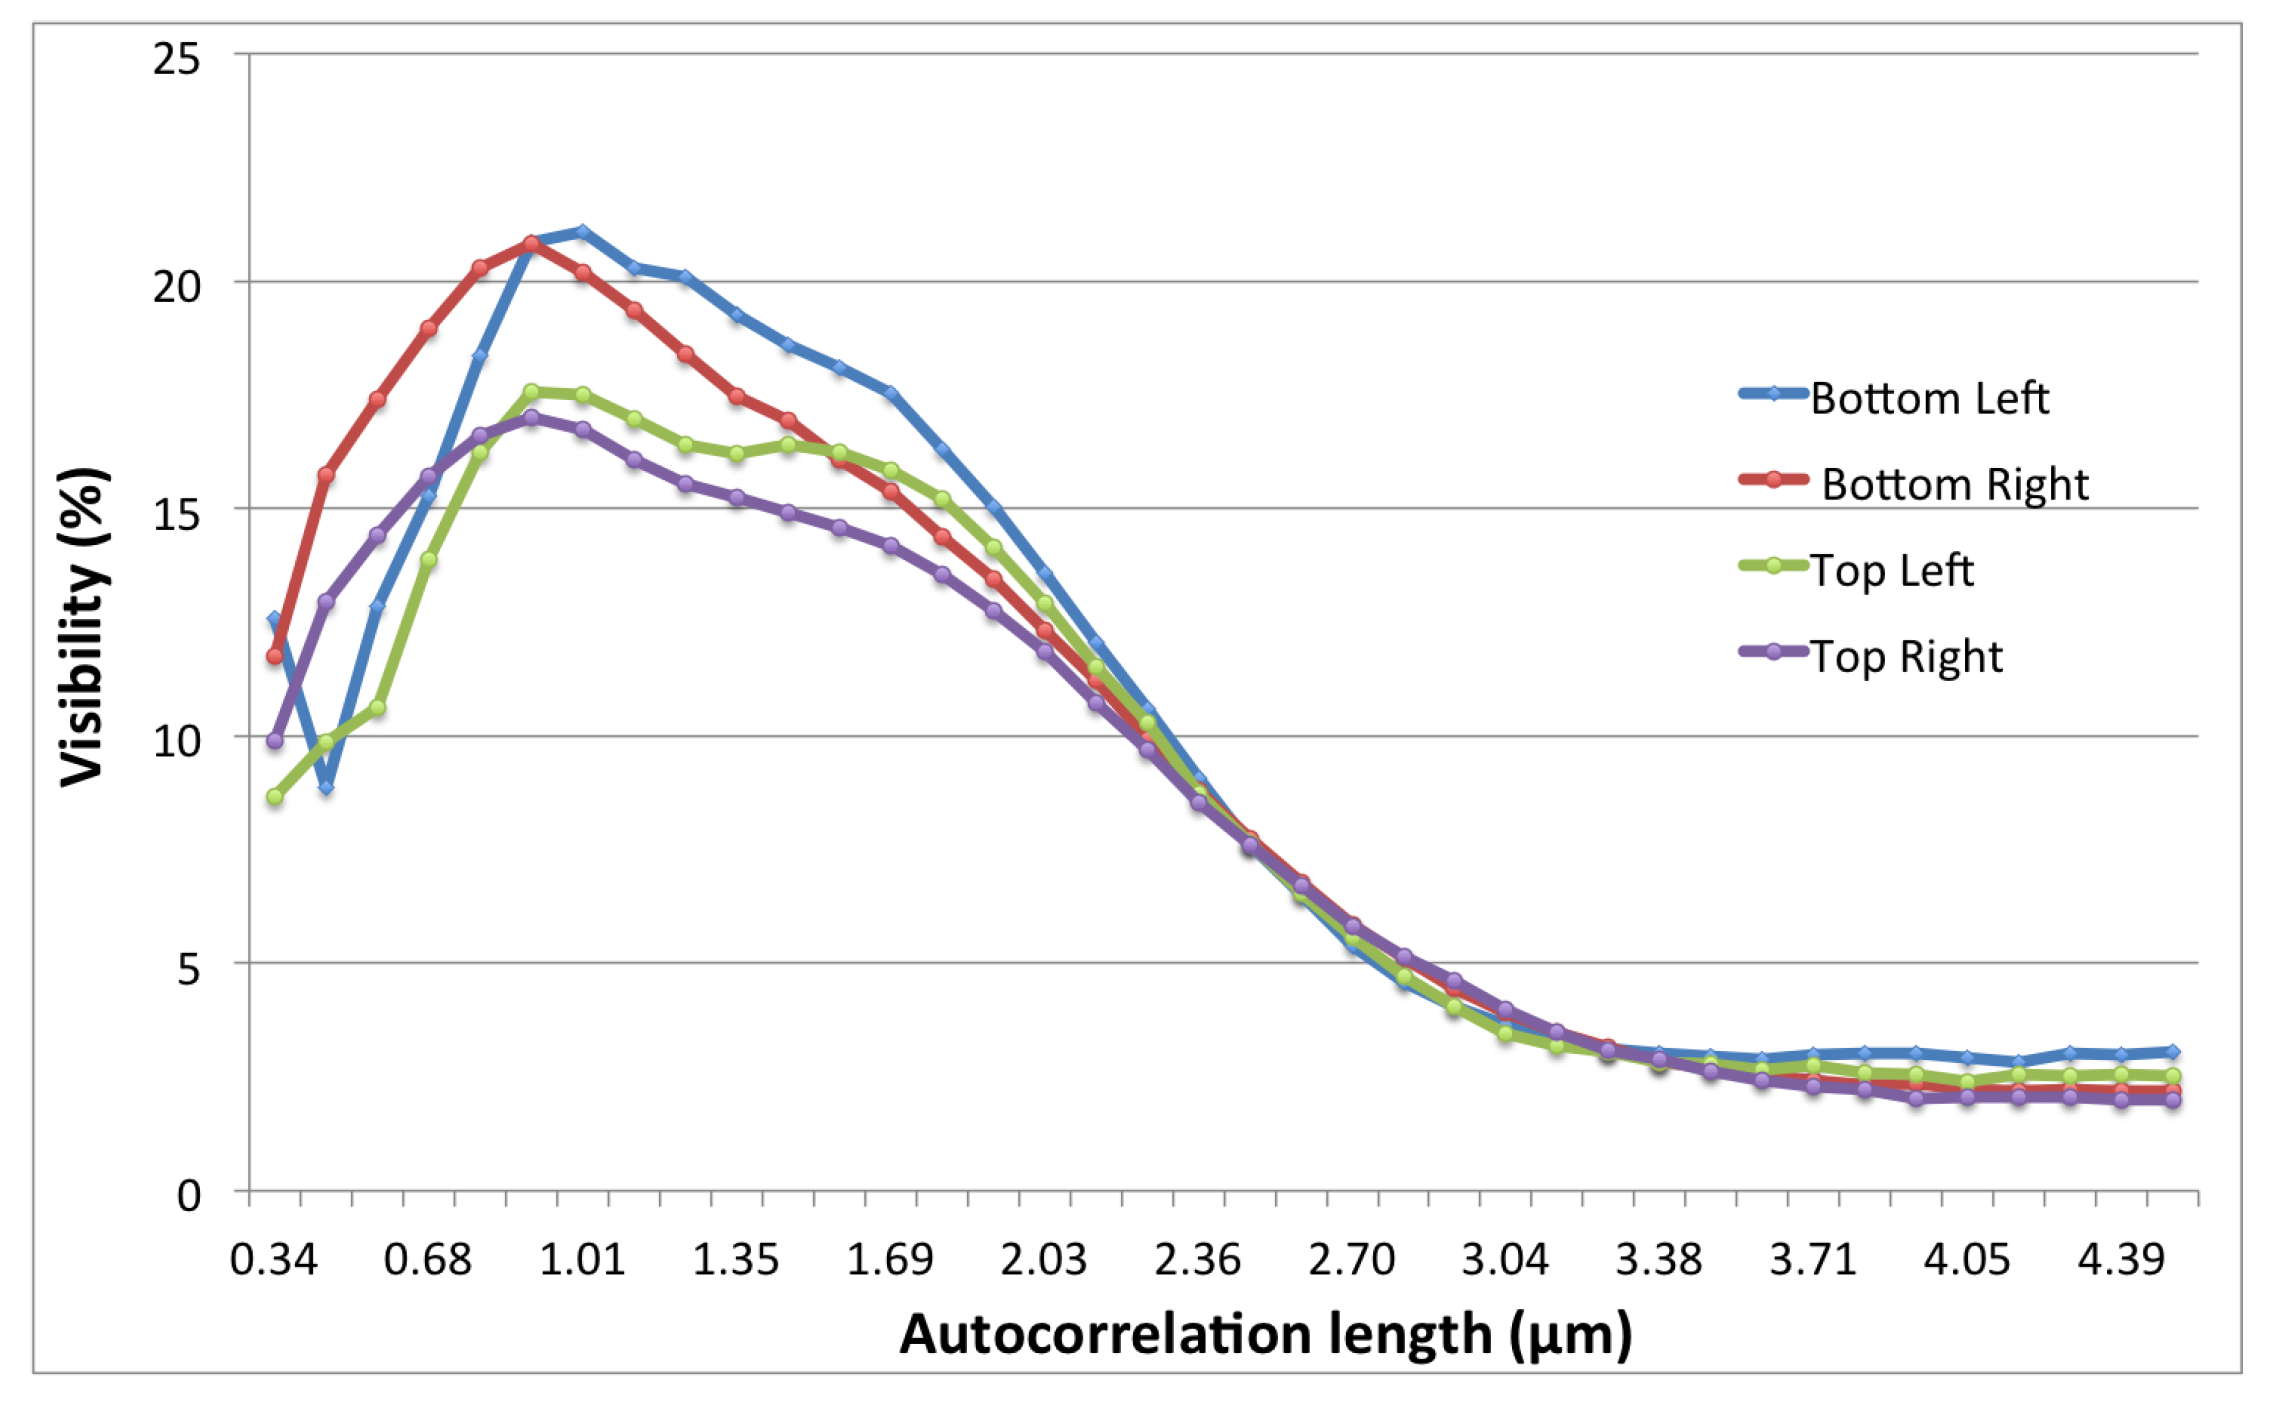
Figure 3 shows the visibility as a function of autocorrelation length,
, as measured at the four corners of a raw image. Most of the sample maintains a visibility above 5% until an autocorrelation length around 2.85
m where performance diminishes; the interferometer dependence on the slit width has been noted in Equation (3) in [
16]. The difference in instrument performance at the four corners may be due to a number of effects: beam structure from the neutron guides, irregularities in the fabrication of the phase gratings, or grating misalignment.
This report is one of the first applications of far-field interferometry [
11] in either X-ray or neutron imaging, thus a careful assessment of the data is required. Here, the neutron interferometry data is analyzed on the basis of three factors: (1) an examination of the fit at a center point in the reference and sample interferometry images; (2) the percent visibility of the reference and samples interferometry images; and (3) the
of the reference and samples interferometry images. The sample data comes from a D-scan experiment with
= 1.013
m; the corresponding reference data was collected immediately afterwards. This sample-reference data pair should be immune from interferometry drift effects. The images were processed with the vectorized least squares algorithm [
17]. Alternative methods for interferogram data processing include a fast Fourier transform (FFT) [
19] and standard non-linear least squares analysis. The raw image is cropped and binned (
). The 1 cm SS316 cubes are side-by-side and the quadratic SS316 at the bottom in the volume renderings, similar to
Figure 2. The cubes and quadratic are strongly attenuating.
The interferogram consists of nine images acquired as a function of grating translation,
. The equation for fitting the interferometry data with a non-linear least squares model is
where
is the period of the translating grating. The fit to this pixel in the sample interferogram has a reduced chi-square of 2.68, indicative of a good fit. The least squares fitting method is used to verify the fast, vectorized linear algebra method used for the analysis of the tomography data. A comparison of the three parameters of Equation (
6) show that the two fitting methods yield identical results. On the basis of speed, about 1000-fold faster, the vectorized linear algebra method [
17] was used in this work.
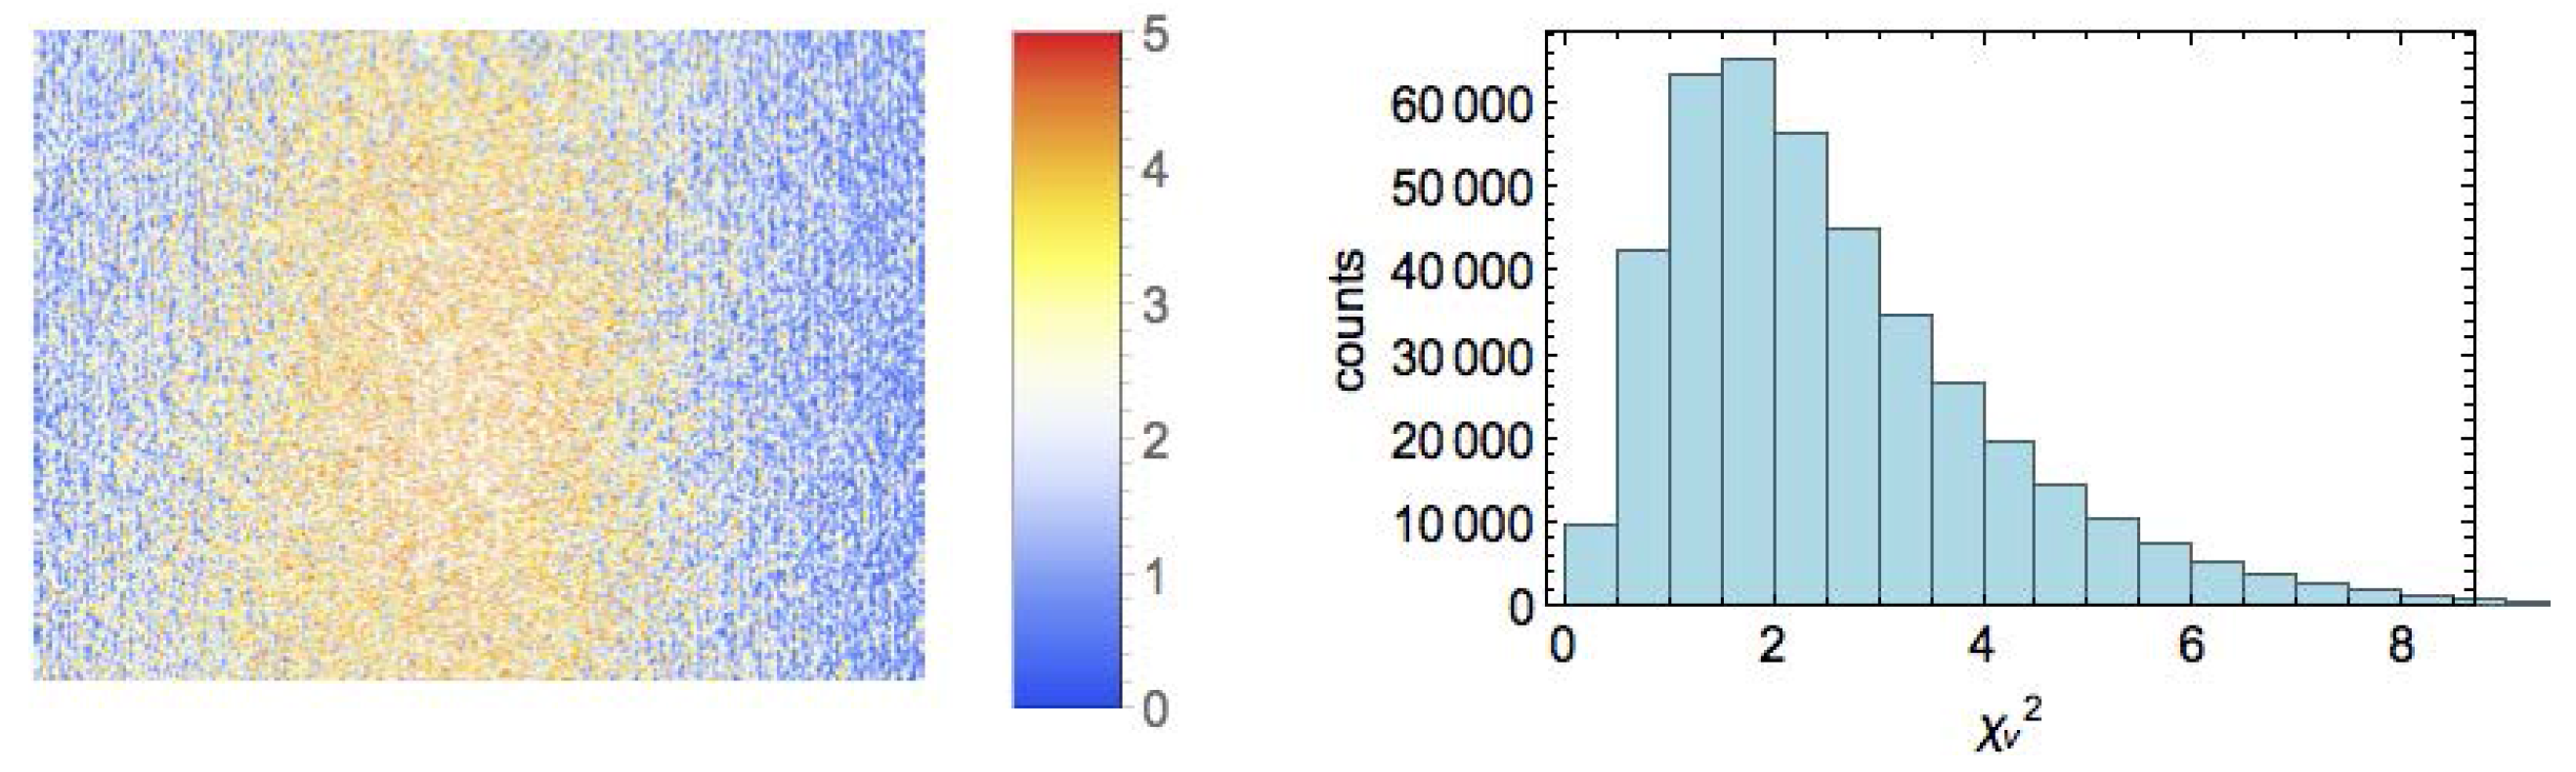
The reduced chi-square is a measure of the quality of fit for a model, and is described in detail in statistical analysis literature [
20]. A good fit yields
near 1, with acceptable deviation being defined as a function of the degrees of freedom of the fit. As the measurements will be closest to the expected result in a blank reference image (i.e., no sample in the imaging area), analysis of the deviation from 1.0 shows a possible error in the instrument’s measurements. Shown in
Figure 4 is the
for a reference image. The calculated
values show that the fit used has performed within reasonable bounds and that the setup is acceptable.
2.5. Dark-Field Image
Noise-free dark-field data would have range of [0, 1], with 1 the expected value for air regions and 0 for maximum scattering (saturation). A main feature of this manuscript is the evolution of the dark-field image as a function of grating setup in the far-field interferometer. The dark-field signal has been connected to scattering theory using
where
t is sample thickness,
is a pair-correlation function describing scattering, and
describes scatterer features such as volume fraction, density contrast, and radius for a two-phase system [
7,
21,
22,
23,
24].
The autocorrelation length,
, represents a particular feature size that can be probed. To calculate
, Equation (
8) is used
where
is the wavelength of the system, z is the sample to detector distance, and
P is the period of Moiré fringes at the detector. While there are many possible correlation functions [
5], a dilute non-interacting spheres model was chosen due to an estimated small porosity size in the SLM cubes and quadratic (0.1%). The pair-correlation function for this system can be approximated as:
P can be determined by the period of the phase gratings,
P, the total length of the system, L, and the inter-grating G1-G2 distance,
.
In the case of these experiments, ranged from 338 nm to 4.5 m based on = 2.4 m, z/L = 1/2, = 3 mm to 40 mm, and = 0.54 nm.
3. Results and Discussion
Neutron far-field interferometry revealed several interesting results in the quadratic samples and small cubes. Since the scattering lengths probed were from 338 nm to 4.5
m, the volume renderings showed the consistency of the printer at multiple scattering lengths in the attenuation images. Of interest first are the volume renderings of the quadratic and cubes.
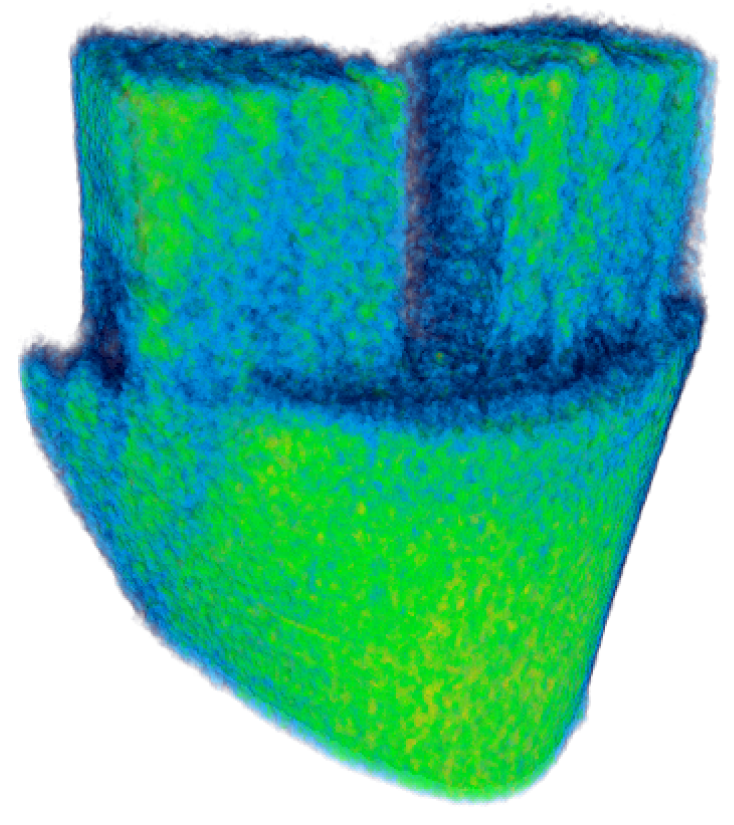
Figure 5 shows an attenuation volume of the sample at a scattering length of 338 nm. The SS316 cubes are 10 mm in length. In this image, the interpolated quadratic is 20.2 mm high, has 15.0 mm maximum thickness, and a width smoothly varying from 32.5 mm at the top to 17.0 mm at the bottom. The image is blurred along the vertical direction due to the beam defining slit.
In the attenuation volume at
= 338 nm, we observe that the samples appear uniform with no defects. The vertical, green lines in the cubes are artifacts from reconstruction, not porosity features in the material. While other attenuation volumes were generated for
= 675 nm, 1.013
m, and 1.350
m, there are only minor changes in attenuation values between each volume. Attenuation is defined as −log[a
sample/a
reference] where the variables are defined in Equation (
5). We do not apply the knowledge of the pixel pitch to convert the attenuation or dark-field value to a total macroscopic scattering length. The standard deviation of the air region around the sample was 3.36 × 10
while the mean and standard deviation for the sample was 5.21 × 10
4.03 × 10
. This implies that the variation observed in the volumes was driven by neutron counting statistics and is indicative of a well-made sample.
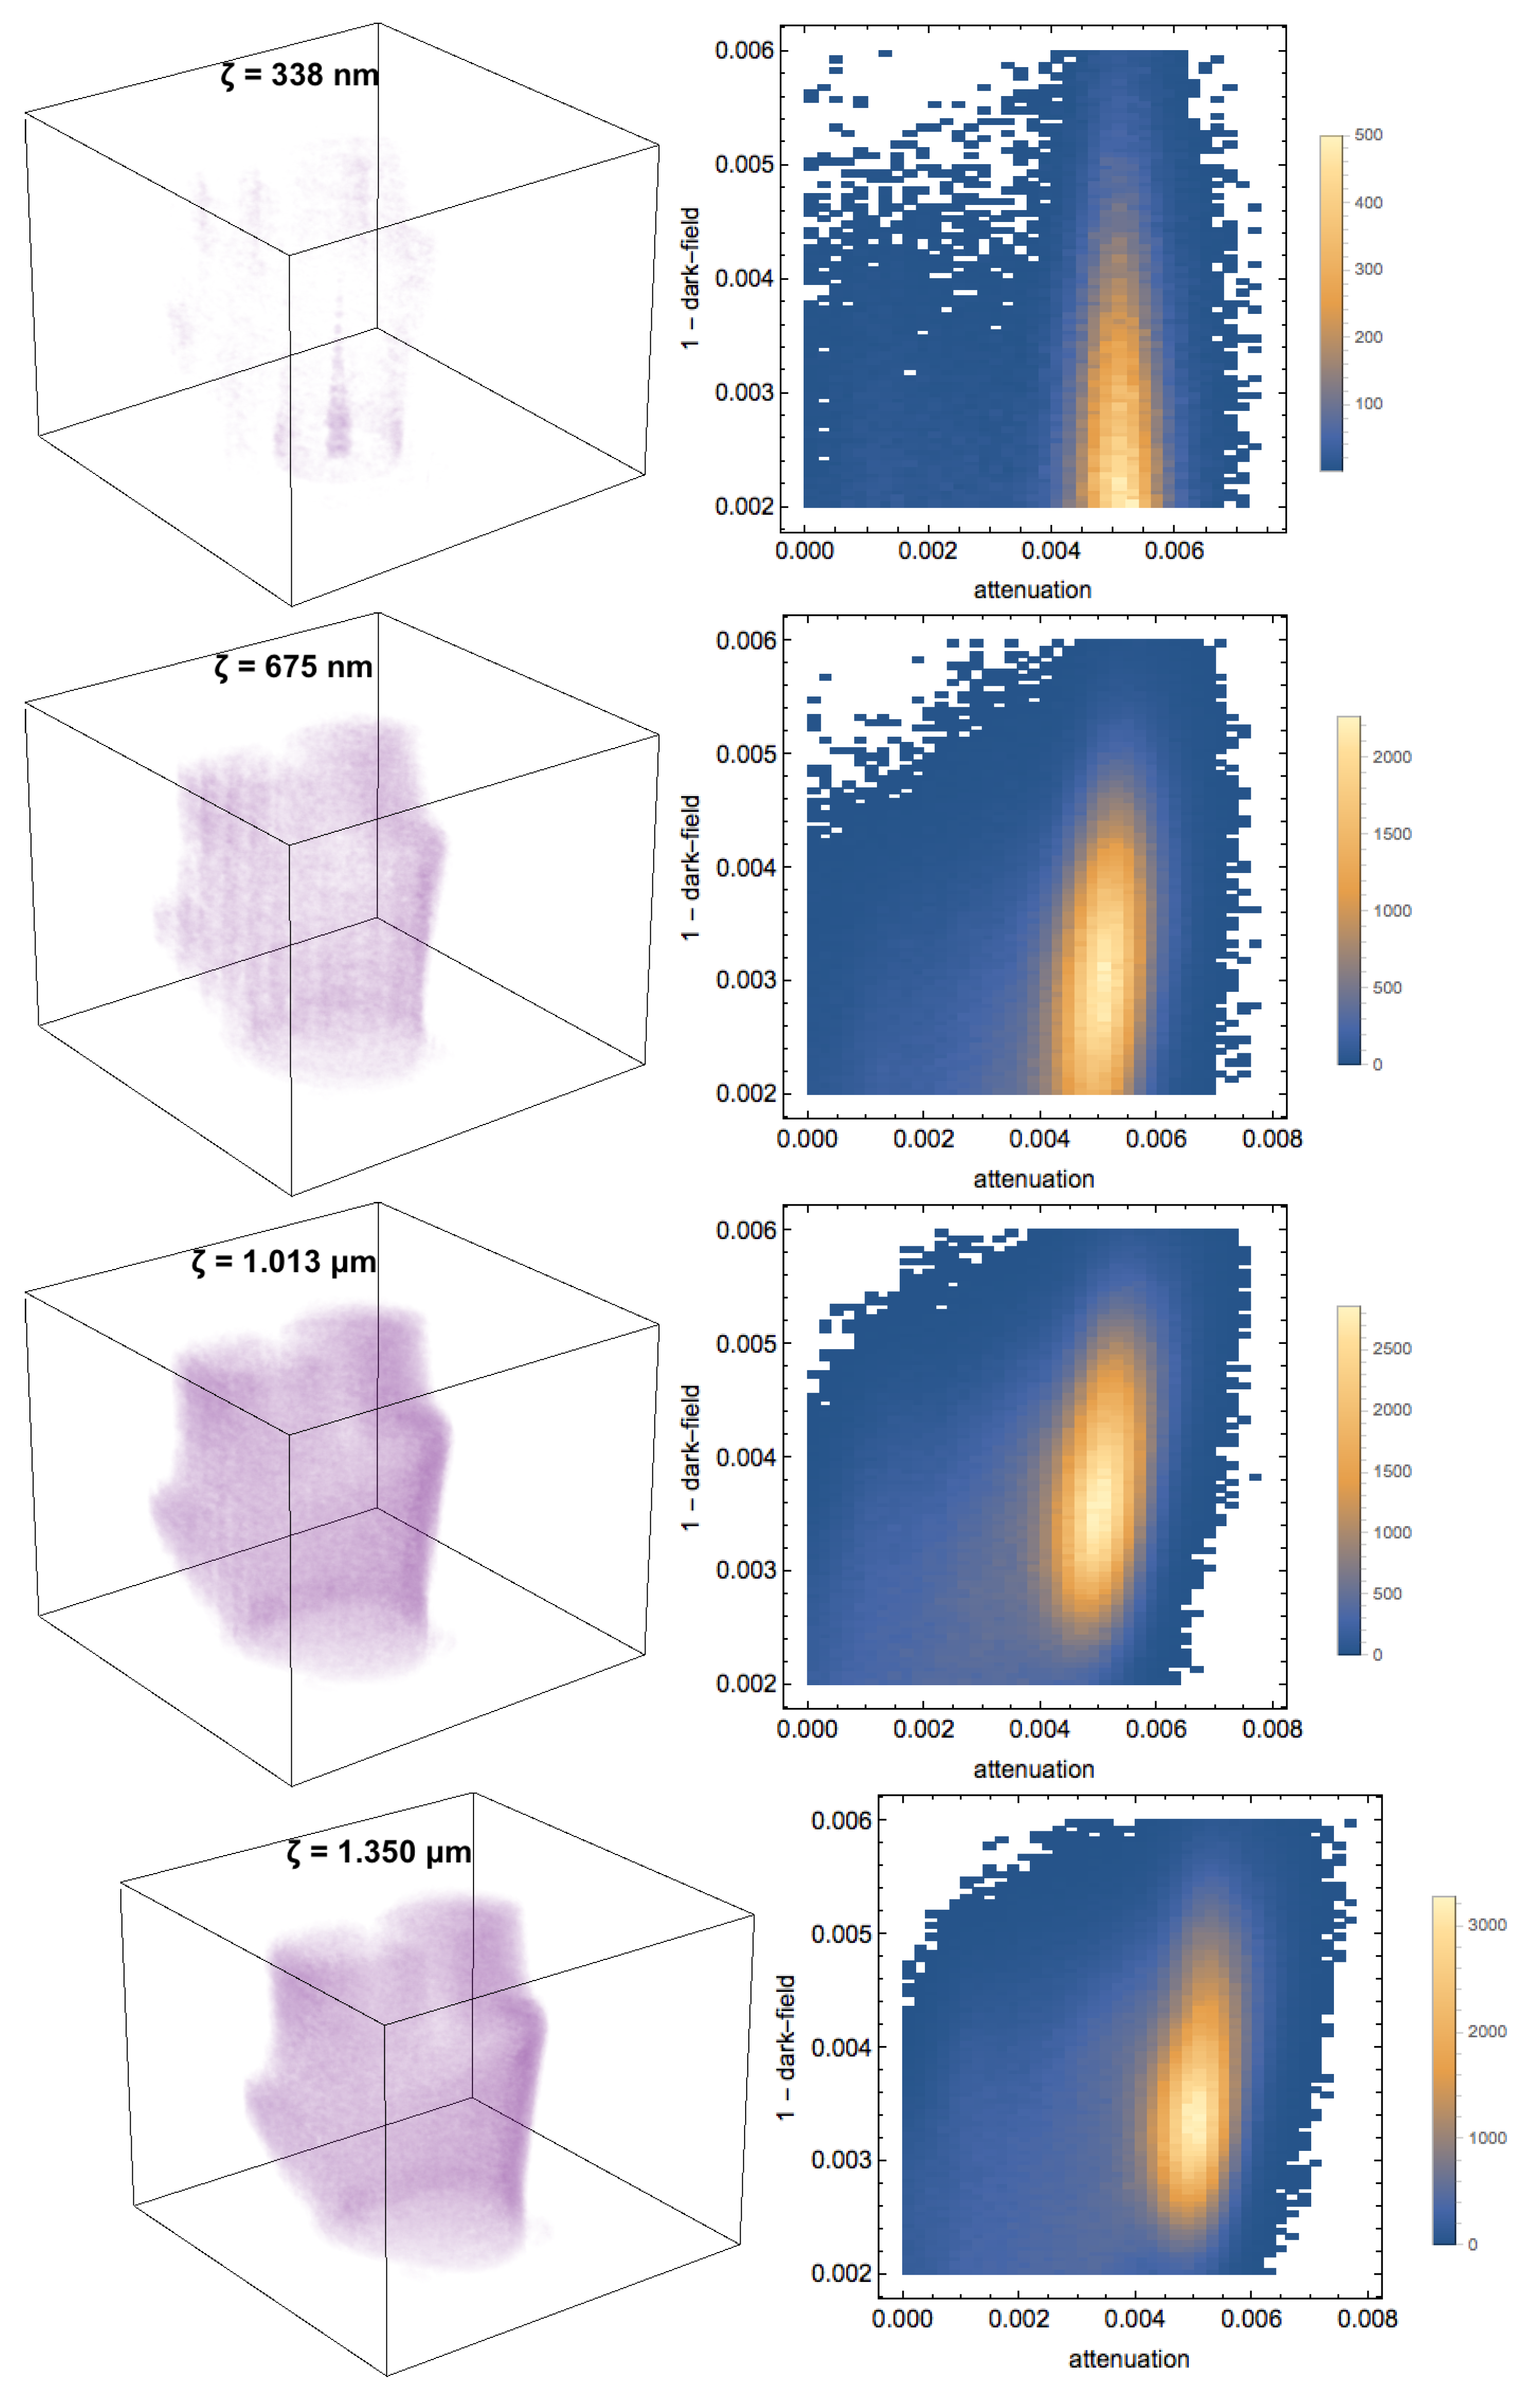
When looking at the dark-field volumes, we can observe a large difference in the scattering signal of the cubes and quadratic.
Figure 6 shows the dark-field volumes when
changes from 338 nm up to 1.350
m. For visualization, a binary mask generated from the attenuation volume is applied to remove artifacts around the samples in the noisy, dark-field volumes. The dark-field values presented are unit-less as they are a measurement of the signal as defined by visibility in Equation (
5).
When observing all attenuation and dark-field volumes in
Figure 6, we can track how the attenuation values remain mostly between 0.004 to 0.006 for all
values. Meanwhile, the dark-field signal range increases from 0.001 to 0.004 at
= 338 nm to 0.0025 to 0.005 at
= 1.350
m. The fact that the dark-field signal changes while the attenuation values remain constant shows the value of the far-field interferometer compared to traditional neutron attenuation imaging.
The far-field interferometer is a multi-scale imaging experiment. In spite of the blurring of the attenuation images due to the preliminary setup of the beam defining slit, the dark-field imaging modality can show scattering features at the sub-micron scale. Far-field interferometry, like Talbot-Lau interferometry, can access a range of scattering lengths. However, the fixed sample position as used in this implementation of far-field interferometry is convenient. The imaging of scattering features, presumably porosity created during the printing process, with dark-field neutron imaging can help assess print defects in real-world applications. These results show the convenience of far-field interferometry for spatial mapping of scattering throughout a three-dimensional (3D) printed object. Future applications of far-field interferometry should be geared towards large samples (millimeter to centimeter sized) where small scattering features, on the order of nanometers to micrometers, are of interest.

 ,
, 