Article

Improved Reconstruction Technique for Moiré Imaging Using an X-Ray Phase-Contrast Talbot–Lau Interferometer

ECAP-Novel Detectors/Medical Physics, Friedrich-Alexander-University Erlangen-Nuremberg, Erwin-Rommel-Strasse 1, 91058 Erlangen, Germany
*
Author to whom correspondence should be addressed.
J. Imaging 2018, 4(5), 62; https://doi.org/10.3390/jimaging4050062
Submission received: 21 February 2018 / Revised: 22 April 2018 / Accepted: 26 April 2018 / Published: 1 May 2018
(This article belongs to the Special Issue Phase-Contrast and Dark-Field Imaging)

Abstract

:
X-ray phase-contrast imaging is a promising method for medical imaging and non-destructive testing. Information about the attenuation, small-angle scattering and phase-shifting properties of an object can be gained simultaneously in three image modalities using a Talbot–Lau interferometer. This is a highly sensitive approach for retrieving this information. Nevertheless, until now, Talbot–Lau interferometry has been a time-consuming process due to image acquisition by phase-stepping procedures. Thus, methods to accelerate the image acquisition process in Talbot–Lau interferometry would be desirable. This is especially important for medical applications to avoid motion artifacts. In this work, the Talbot–Lau interferometry is combined with the moiré imaging approach. Firstly, the reconstruction algorithm of moiré imaging is improved compared to the standard reconstruction methods in moiré imaging that have been published until now. Thus, blurring artifacts resulting from the reconstruction in the frequency domain can be reduced. Secondly, the improved reconstruction algorithm allows for reducing artifacts in the reconstructed images resulting from inhomogeneities of the moiré pattern in large fields of view. Hence, the feasibility of differential phase-contrast imaging with regard to the integration into workflows in medical imaging and non-destructive testing is improved considerably. New fields of applications can be gained due to the accelerated imaging process—for example, live imaging in medical applications.

1. Introduction

In conventional X-ray imaging, the attenuation image of an object is acquired. Thus, for example, in medical imaging, a good bone-tissue contrast can be achieved. Nevertheless, in recent years, many approaches have been made to get further information about the object by analyzing the behavior of the wave passing the object. These techniques can be divided into five main categories [1]: the interferometric methods using crystals [2,3], the propagation-based methods [4,5], the analyzer-based methods [6,7,8], the grating interferometric methods [9,10,11,12] and the grating non-interferometric methods [13,14,15,16]. In this work, the moiré imaging method [17,18,19] in combination with a Talbot–Lau imaging system is applied.
Using a Talbot–Lau interferometer [12,20,21,22,23,24,25,26], information about the phase-shift and the scattering properties of an object can be obtained simultaneously [12,27]. Therefore, this technique is very promising for applications in medical imaging [12,27,28,29,30] and non-destructive testing [12]. It is, for example, possible to depict micro calcifications in mammography for earlier diagnosis of breast tumors [28,29] or lung tissue to diagnose diseases like emphysema [30].
However, with regard to clinical applications, it is desirable to keep the imaging process as short as possible. In conventional Talbot–Lau imaging, a phase-stepping has to be performed [11] to resolve the subpixel information. This is a time-consuming process as the acquisition time is increased by taking several acquisitions at different grating positions. Hence, this imaging process is prone to mechanical instabilities and motion artifacts.
In recent years, some attempts have been made to overcome this problem. Miao et al. [31] performed an electromagnetic phase-stepping method to overcome the mechanical requirements of stepping the grating precisely. In this publication, we apply the moiré imaging method. Thus, no mechanical requirements for the phase-stepping are necessary and it is a single-shot approach. Hence, motion artifacts and image artifacts due to vibrations of the setup can be reduced. For applying the moiré imaging method, a conventional Talbot–Lau interferometer can be used. The interferometer has to be slightly detuned to be able to observe a high frequency moiré pattern that can still be resolved by the detector. Then, only a single-shot exposure is necessary to retrieve information about the attenuation, differential phase-contrast and dark-field property of the object simultaneously. The information can be extracted from the Fourier transformation of the moiré pattern that is deformed by the object [17,18,19,32,33]. Compared to the phase-stepping approach, in moiré imaging, the spatial resolution is slightly reduced [33,34].
Nevertheless, this technique is easy to implement and shows great advantages due to short exposure times. Additionally, this method is robust concerning vibrations of the setup as it is a single-shot method. Only the reproducibility between reference and object measurement has to be given.
In this publication, an advanced reconstruction method for moiré imaging is presented to improve image quality and to overcome the problem of an inhomogeneous moiré pattern over a large field of view (FoV).

2. Materials and Methods

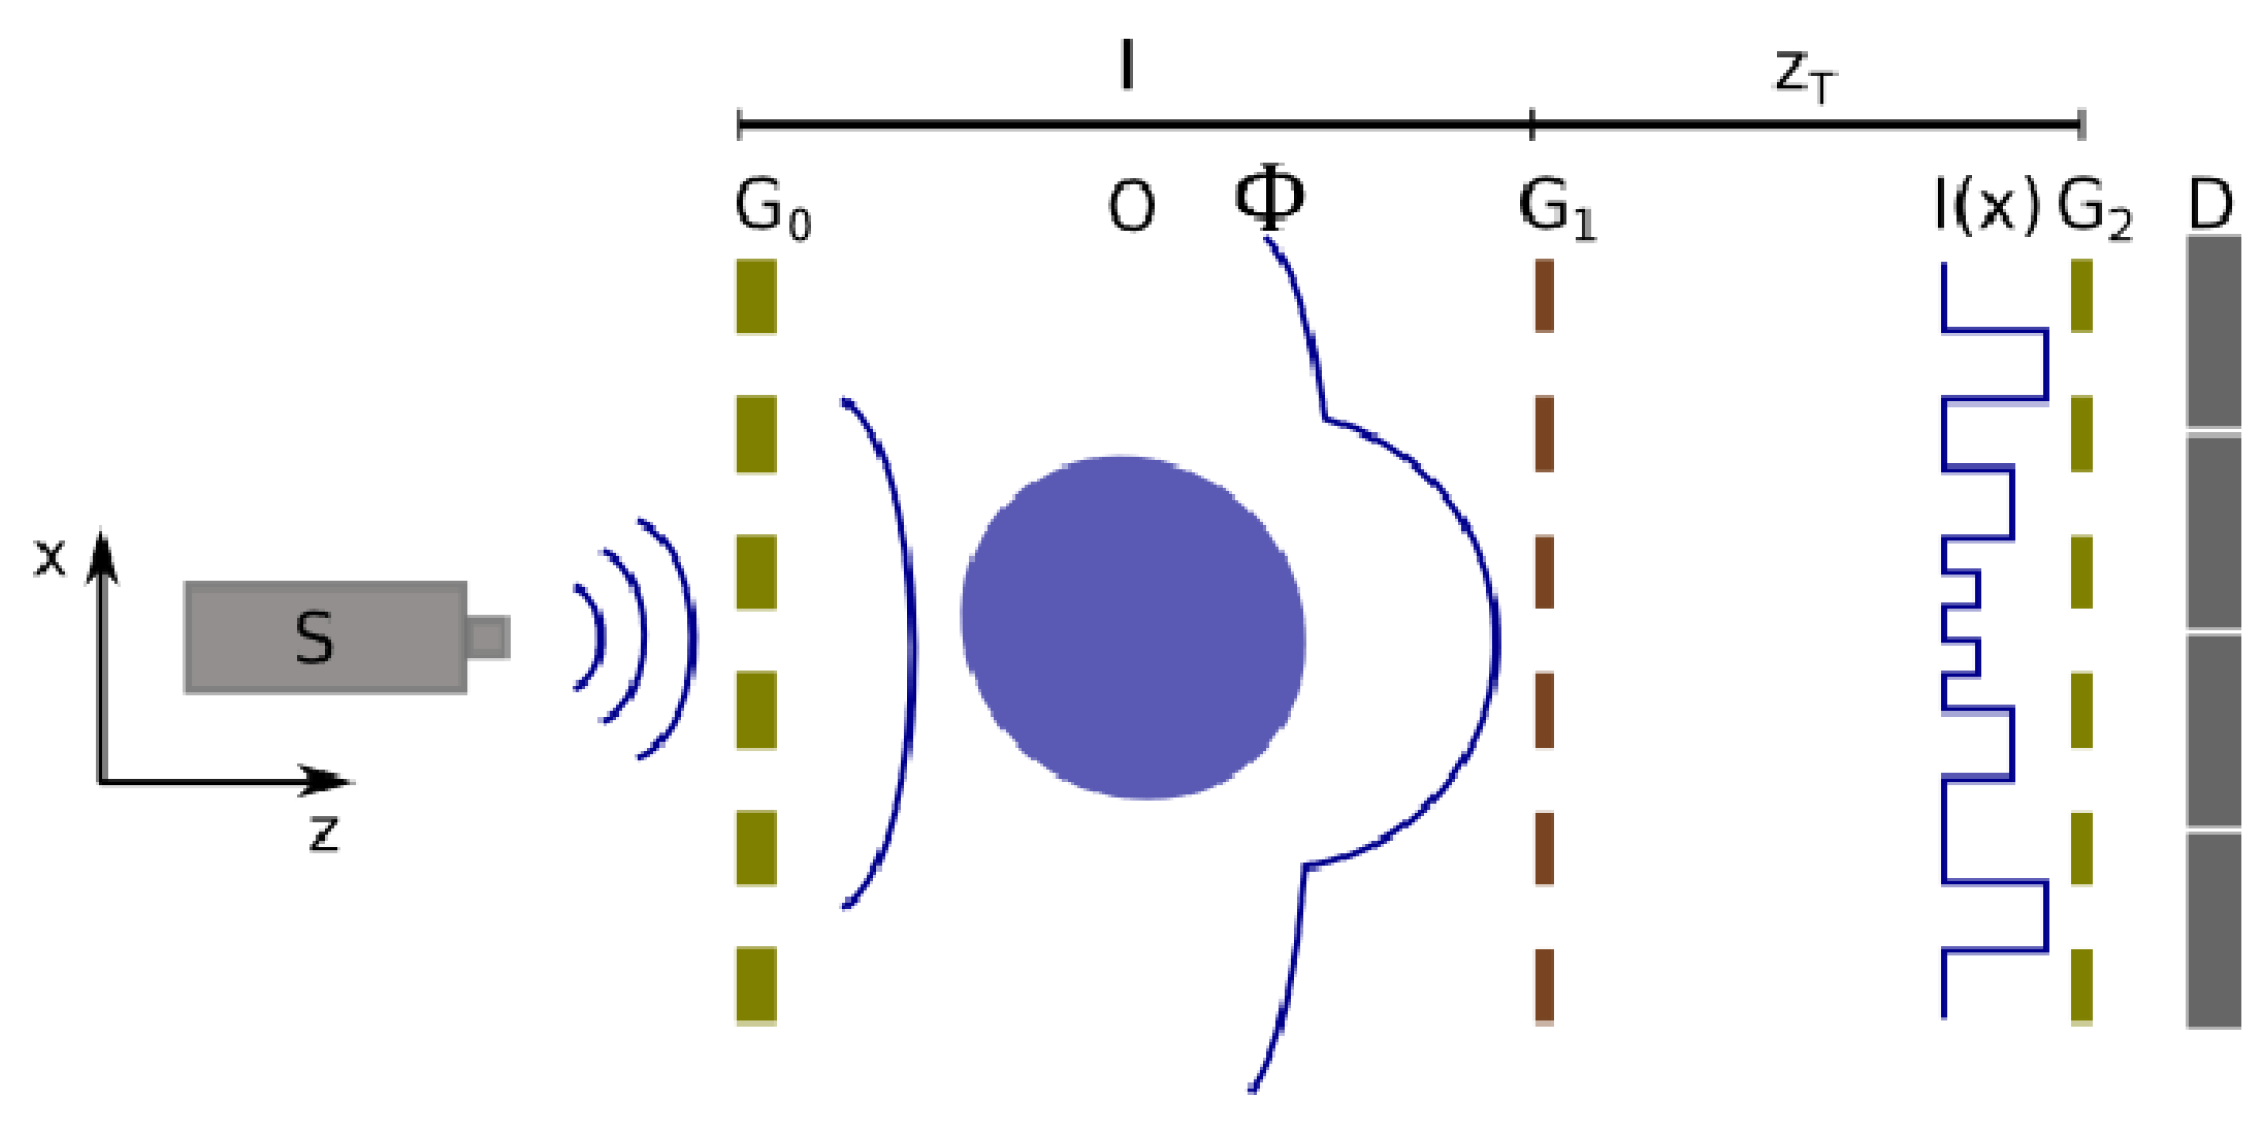
2.1. Moiré Imaging Using a Talbot–Lau Setup

In order to measure the effect of objects on the phase, the amplitude and the offset of the spatially coherent wavefront, a Talbot–Lau interferometer can be used [35,36] (Figure 1). In the following, the general functionality of a Talbot–Lau interferometer is explained as it is also used to perform moiré imaging in this publication.
To separate the influence of the object on the incident wave from the influence of external impacts as, for example, imperfections of the gratings, an image without an object in the beam path is acquired. Subsequently, this image is called reference or free-field image. The reference information is marked by a sub-index “ref”.
Illuminating a phase grating G 1 with a wavefront that has a sufficient degree of spatial coherence, self-images of the grating can be observed in so-called Talbot distances. This is called Talbot effect. An object between the source and the grating G 1 can refract the incident wavefront [20,26]. Passing though the object, the wavefront is speeded up. This leads to a phase-shift resulting in the observed refraction. The speedup depends on the material and is described by the complex index of refraction n = 1 δ + i β , where β describes the attenuation of X-rays and δ the phase-shift property within the material [37]. The refraction leads to a local shift of the Talbot intensity pattern downstream of G 1 perpendicular to the direction of propagation and to the grating bars. The small angle scattering, called dark-field information, can be observed in a reduced contrast of the Talbot intensity pattern.
The detector pixels are usually much larger than the period of the intensity pattern. Thus, the deformation of the self-image of G 1 can not be measured directly by the detector. Therefore, an analyzer grating G 2 has to be placed in a Talbot distance behind G 1 . In the presented moiré imaging procedure, G 2 has to be slightly rotated around the beam axis compared to the self-image of G 1 . For the ideal case, G 2 shows the same periodicity as the self-image of G 1 in the Talbot-distance. Thus, the superposition of both periodic structures that are rotated towards each other leads to a periodic pattern of lower frequency, called moiré pattern [38]. As the period of this moiré pattern is larger than the pixel size, it can be directly observed by the detector. Deformations of the self-image of G 1 caused by an object result in deformations of the moiré pattern.
As described, for example, by Takeda et al. [17] for the optical energy regime and Bennett et al. and Bevins et al. [18,19] for the X-ray regime, the information about attenuation, differential phase-contrast and dark-field can be extracted from the Fourier Transform (FT) of the measured moiré pattern image. According to Bennett et al. [18] and Bevins et al. [19], the mean intensity in each pixel can be reconstructed by taking the absolute value of the inverse FT of an area around the zero order harmonic I = | F 0 1 | . The visibility can be calculated by taking the ratio of the absolute values of the inverse FT of the area around the first order harmonic and of the area around the zero order harmonic V = | F 1 1 | | F 0 1 | . The phase information is reconstructed by taking the argument of the complex FT of the area around the first order harmonic ϕ = arg ( F 1 ) .
In this context, F x is a pseudo code describing the area around the x th order harmonic of the Fourier transformation of the measured intensity image, and F x 1 is the inverse Fourier transformation of this area. A more detailed explanation of how to determine the extent of these areas is given in Section 2.4.1. Furthermore, | · | means the absolute value of the complex Fourier transformation, and arg ( · ) means the angle or the complex part of the complex Fourier transformation.
The three imaging observables can be calculated for each pixel with I, V and ϕ as follows:
attenuation image : T = ln I 0 , obj I 0 , ref ,
differential phase contrast image : d ϕ = ϕ obj ϕ ref mod 2 π ,
dark field image : D = ln V obj V ref .
Using a polychromatic X-ray source with a large focus, a third grating G 0 that is placed right behind the focus is required. It creates mutually independent slit sources whereof each of them behaves like a single coherent source [12,39,40].
The procedure to define “an area around the zero order harmonic” respectively “an area around the first order harmonic” is not unique. As an example, a sharp cut around the zero order harmonic of the moiré pattern eliminates high spatial frequencies and thus leads to blurred edges. Furthermore, by applying sharp cuts in the frequency domain of objects with sharp edges, ringing artifacts can be observed in the reconstructed images. In the following, an improved reconstruction technique will be introduced. Additionally, due to grating and setup imperfections, the moiré pattern is not regular over the whole FoV for a large setup. By reconstructing the whole matrix at once, the irregularities of the moiré pattern lead to artifacts in the reconstructed image. To avoid these artifacts, a piecewise reconstruction algorithm is presented in the following. This approach is subsequently called sliding window reconstruction. It is important to remark that this method addresses a different problem than the sliding window phase stepping presented by Zanette at al. [41].

2.2. Setup

The image data used in this publication are acquired with a Talbot–Lau interferometer. The setup is described in the following. A Siemens MEGALIX Cat Plus 125/40/90-125GW (Siemens, Munich, Germany) is used as an X-ray source. The detector is a Teledyne Dalsa Shad-o-Box (Teledyne DALSA, Waterloo, ON, Canada) with 50 μ m pixelpitch. Table 1 and Table 2 show further parameters of the setup.
All measurements are performed using a 40 kVp spectrum.

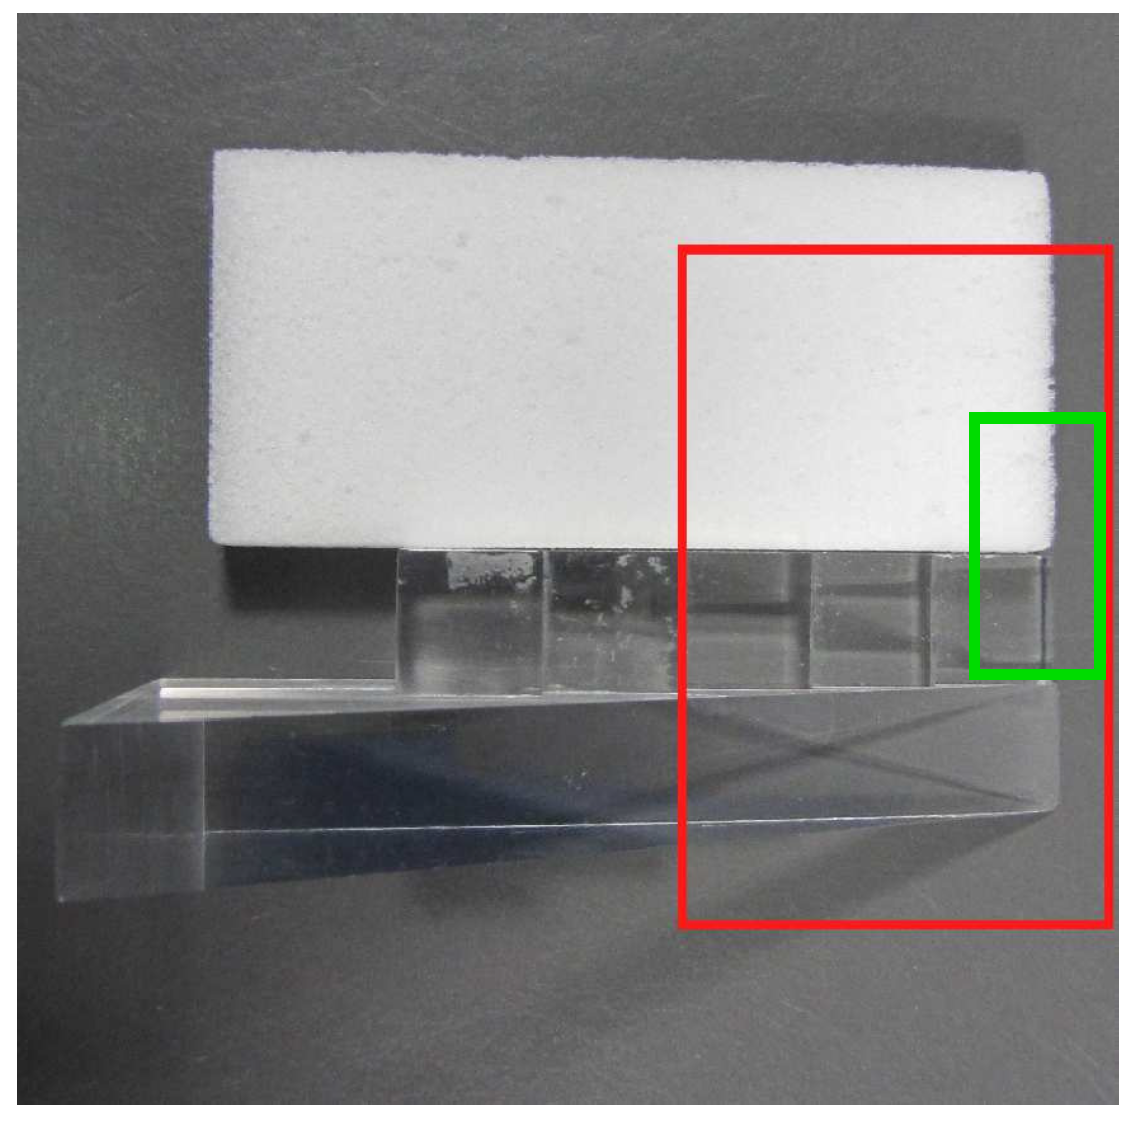
2.3. Measurement Samples

The phantom consists of three components (see Figure 2). The components are chosen in order to receive a constant signal in each image modality. The component on top of the image is a synthetic sponge of constant thickness causing a constant dark-field signal. In the middle, a step wedge made from Polymethyl methacrylate (PMMA). is used to examine the behavior of the attenuation image. The component on the bottom is a PMMA wedge of constant slope. This should result in a constant differential phase signal. Figures 3, 4, 6 and 7 show an image section comprising the edge of the sponge and of the step wedge marked by the green rectangle. Thus, the reconstruction details are more visible. Due to the high magnification of the images of the green box, these images seem to be pixilated. In these figures, the contrast is enhanced to visualize the artifacts and to emphasize the reconstruction details. Thus, the object information is saturated and there seem to be overexposed and underexposed areas in the images. To better detect the object information, a more appropriate choice of contrast is shown in Figure 9, which shows the images of the whole phantom. This area is marked by the red rectangle in Figure 2 and the corresponding images are shown in Figure 9.
The image of a human finger (ex-vivo) is shown in Figure 10. The specimen is provided by the Anatomical Institute II of Friedrich-Alexander University Erlangen-Nuremberg.

2.4. Reconstruction Algorithm

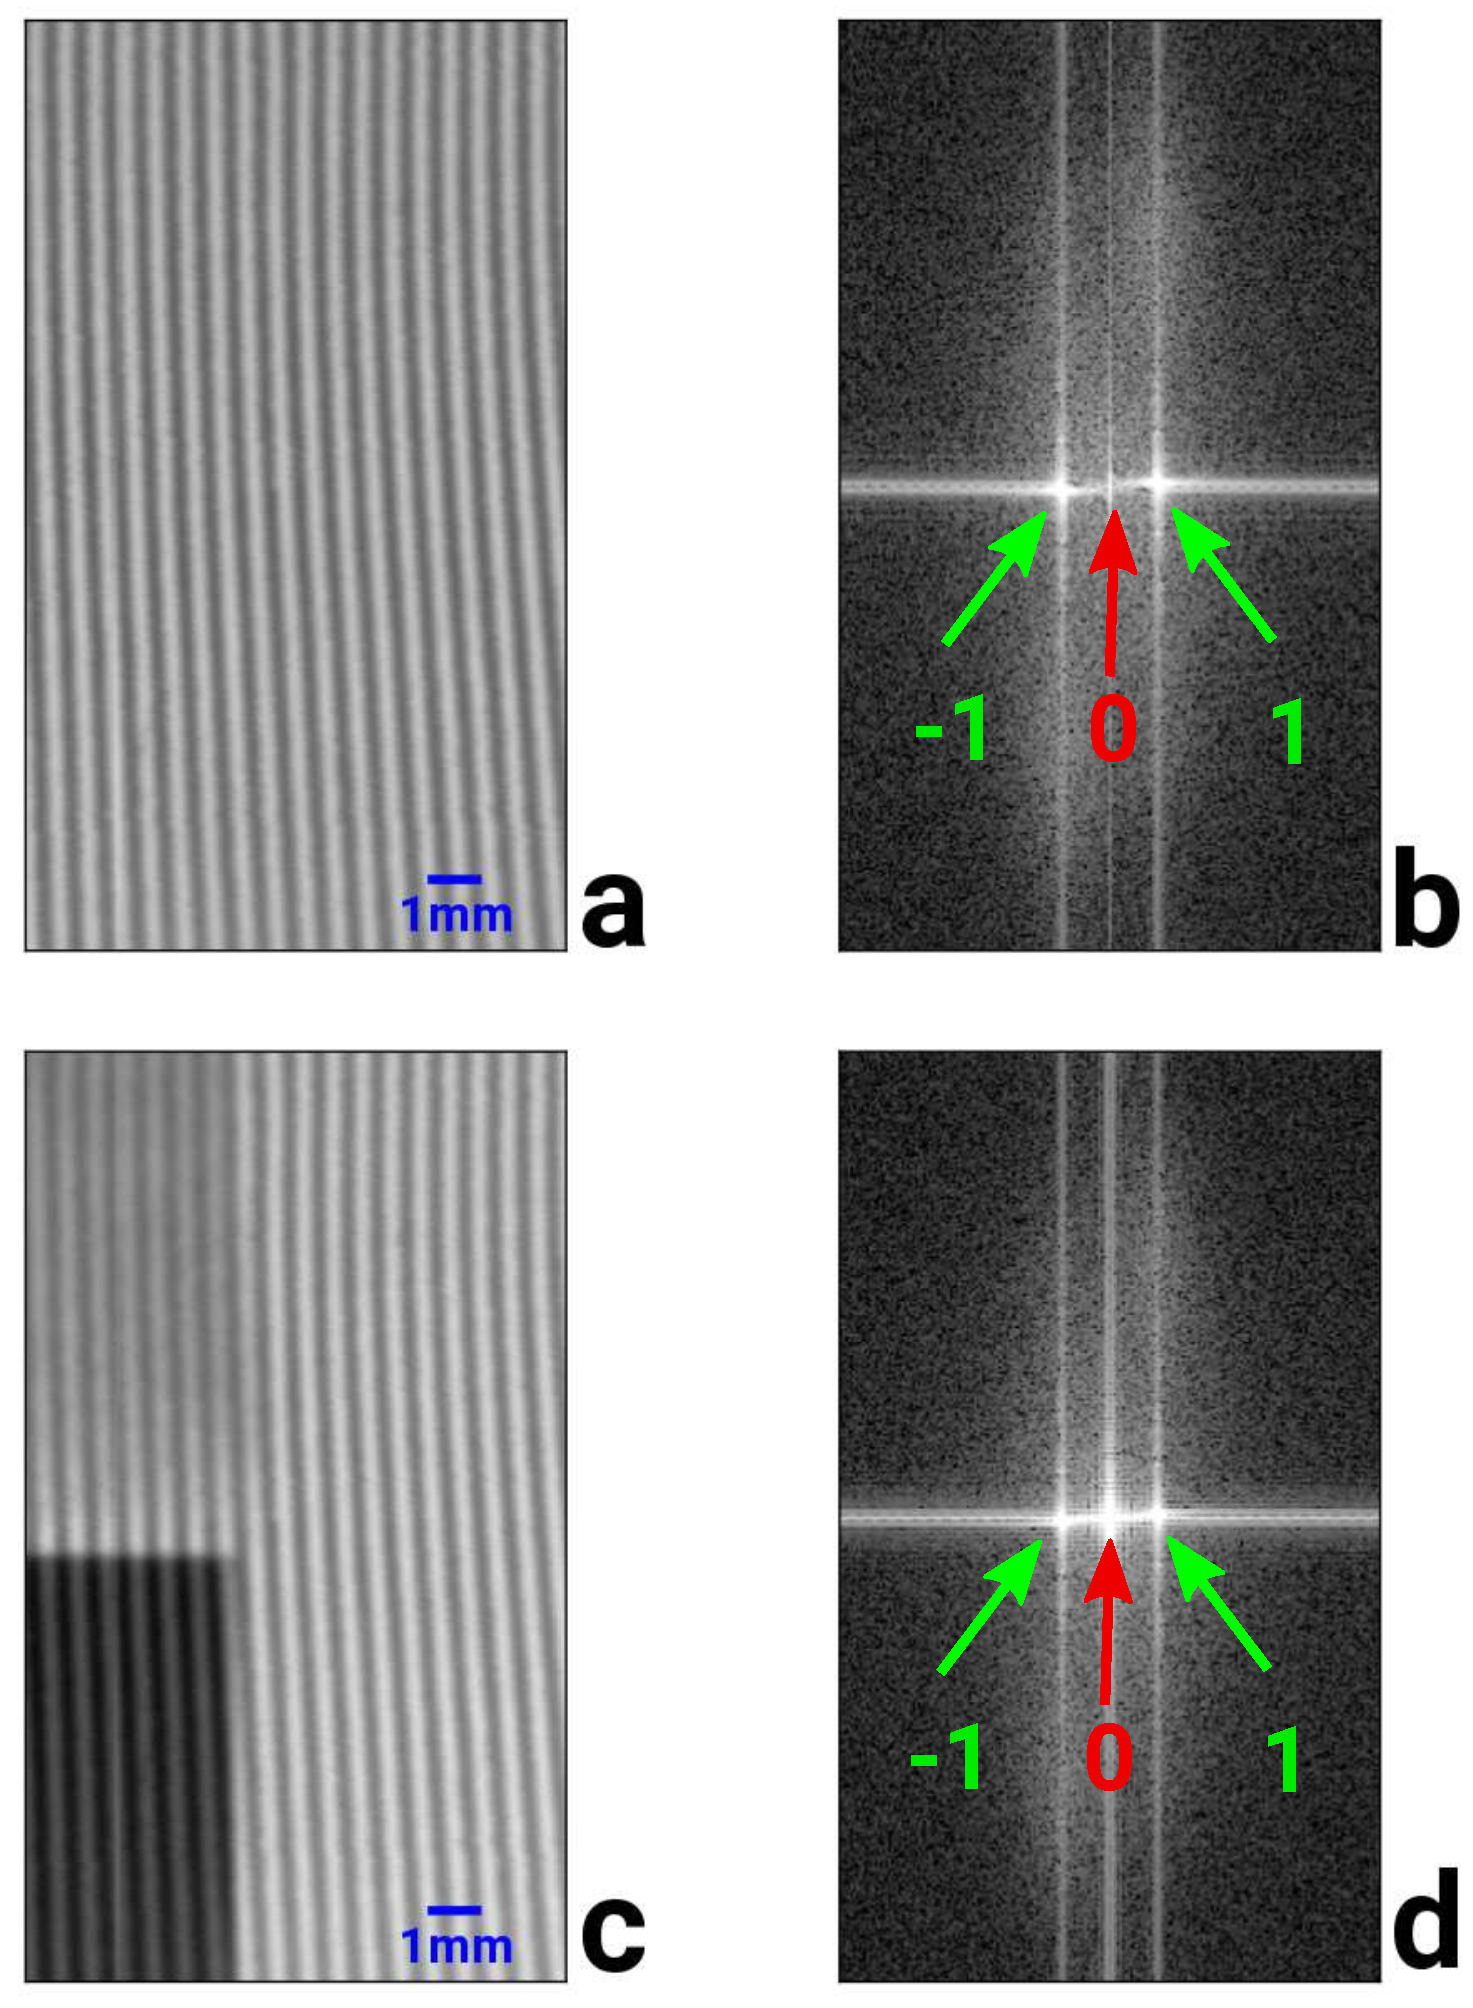
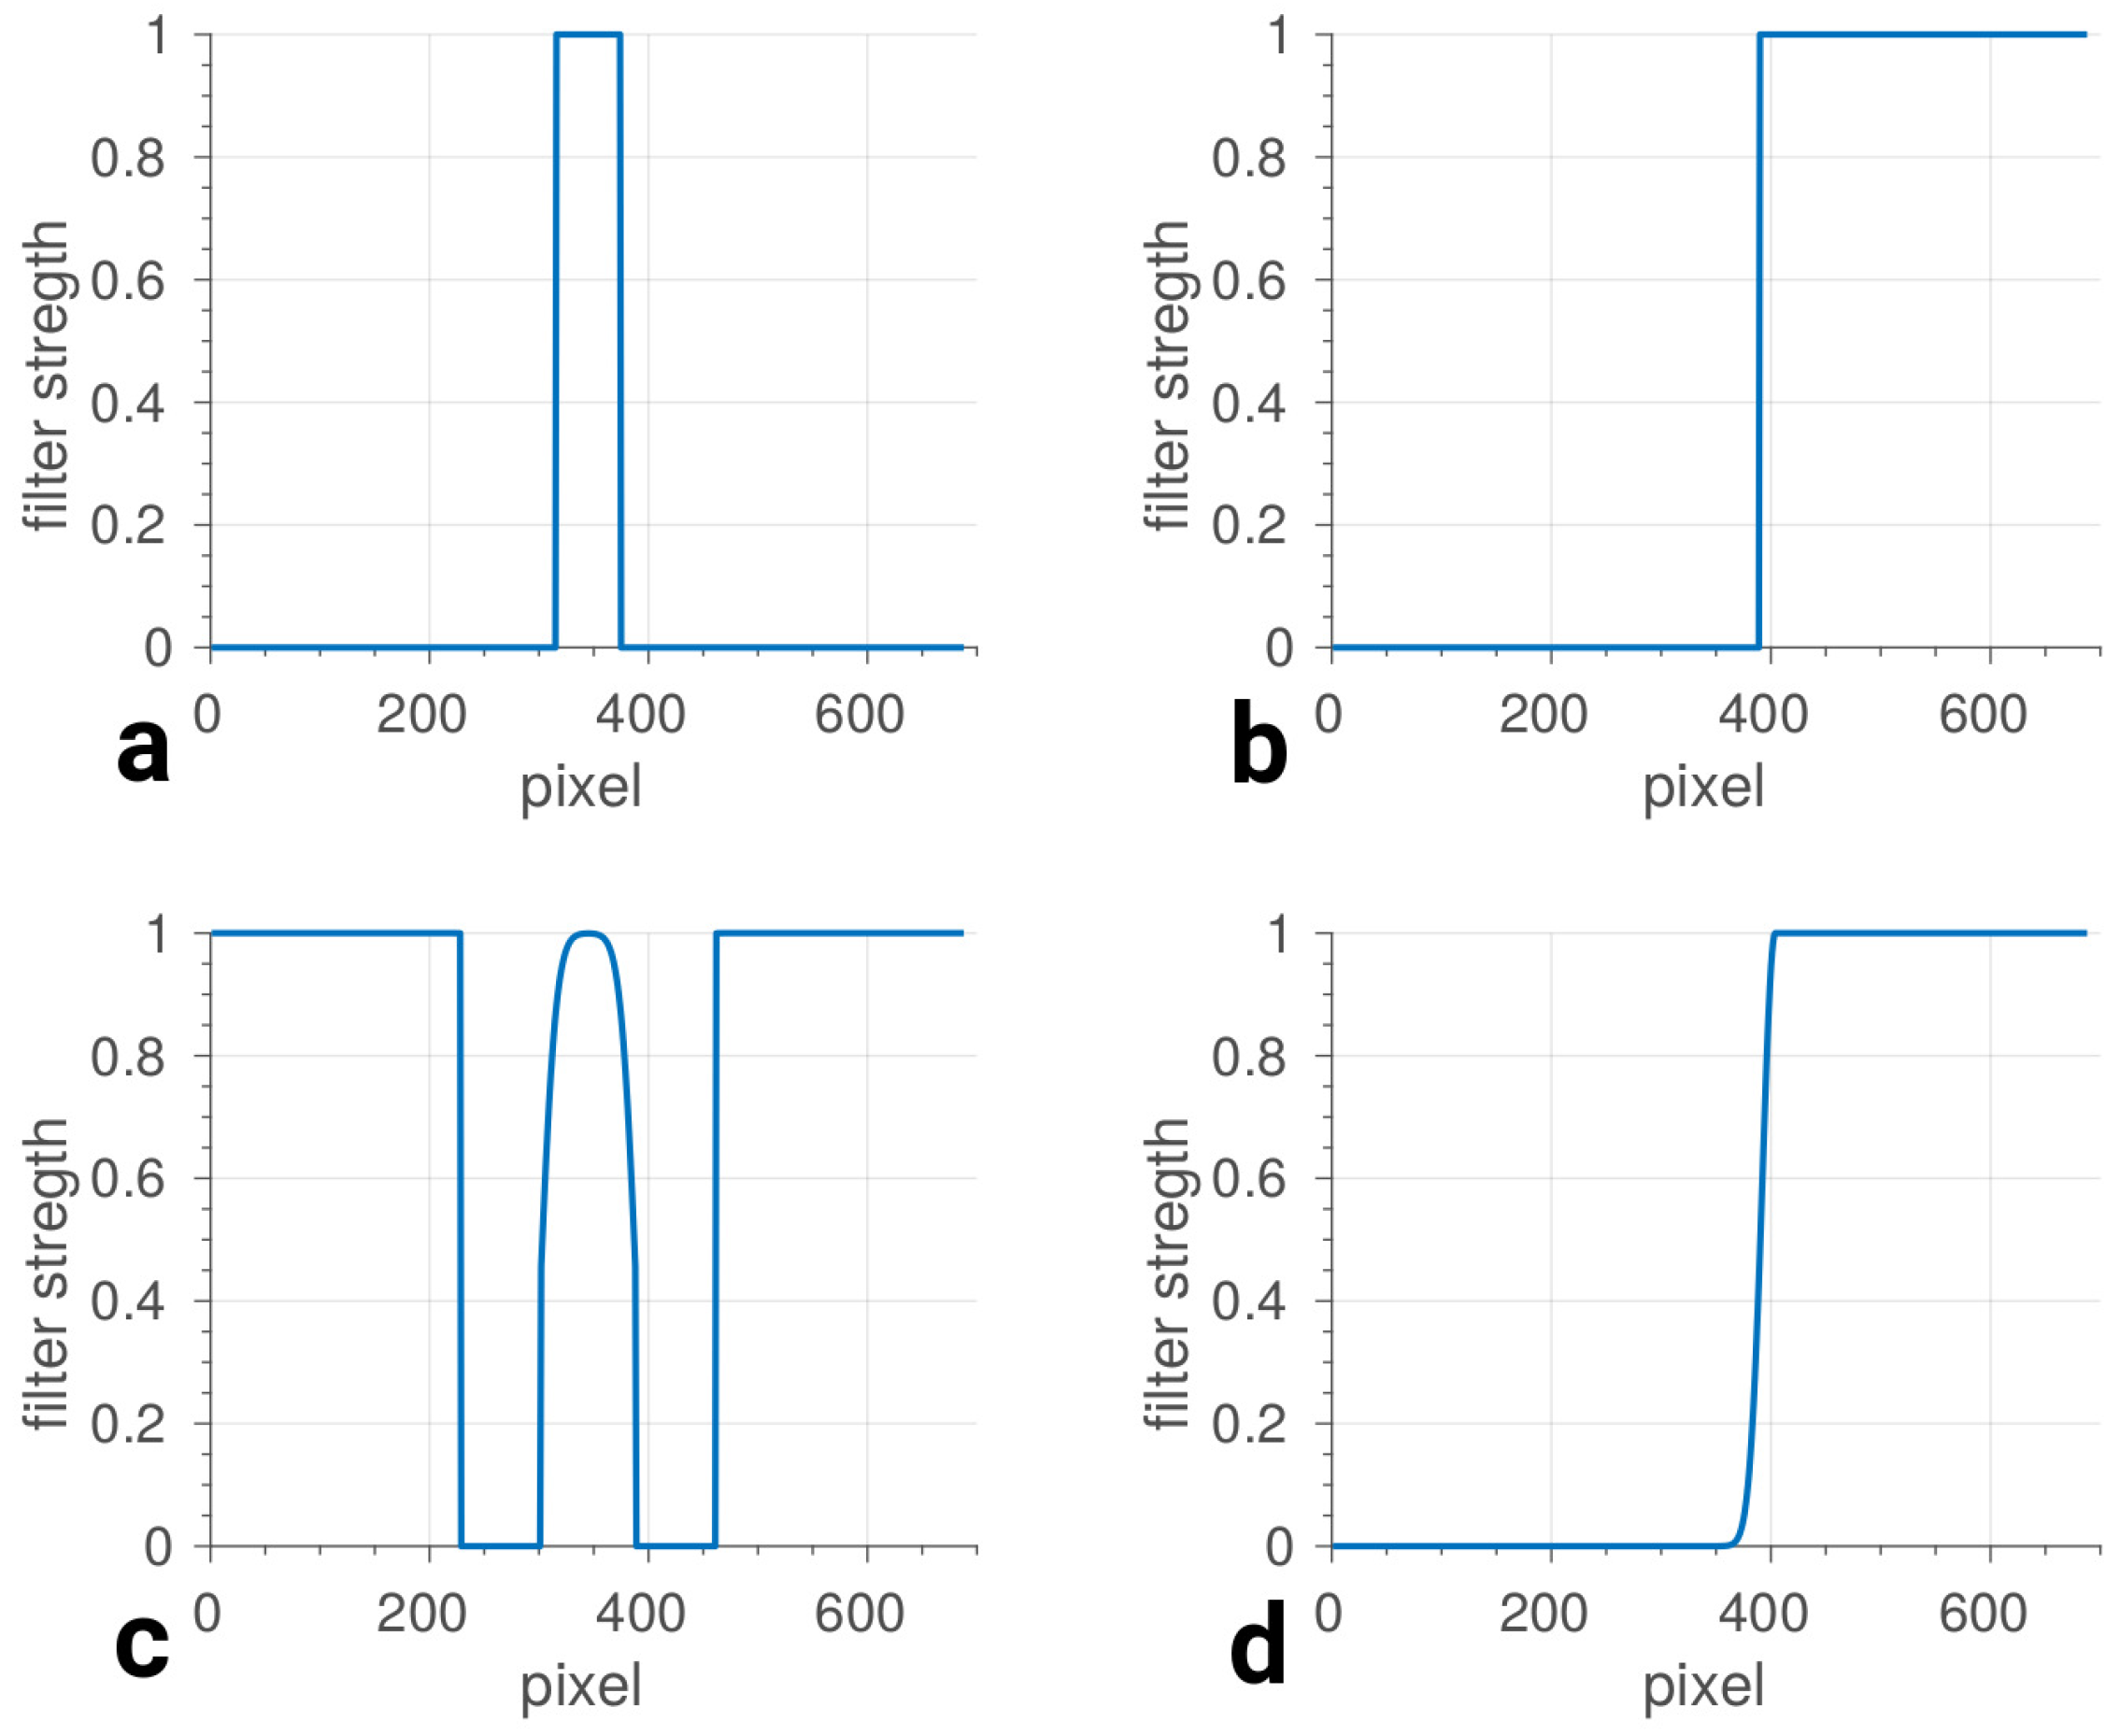
2.4.1. Frequency Filters

Figure 3c shows the Talbot-moiré image obtained for the green marked area of the phantom shown in Figure 2. Figure 3a shows the corresponding reference image without phantom in the beam path. The moiré pattern generated by the superposition of the self-image of G 1 and the slightly rotated G 2 is clearly visible. Three peaks related to this pattern can be observed in the Fourier transformed image in Figure 3b of the reference image and in Figure 3d of the object image.
The central peak in Figure 3b,d, called the 0th harmonic (red arrow in Figure 3b,d, is located around the zero frequency position, which is in the center of the frequency space. This peak is not as dominant in the image of the FT of the reference image (Figure 3b) as in the image of the FT of the object image (Figure 3d). The reference image is dominated by the moiré pattern and no object information is contributing to the low-frequency signal like in the image of the object. The two remaining peaks, called the 1st and −1st harmonics (green arrows in Figure 3b,d, are located around the frequency of the moiré pattern ± f moir é . The scattering and the phase-shift properties of the object are coded in a reduced contrast and a shift of the moiré pattern, respectively. Thus, the visibility and phase-shift information is represented in the 1st and −1st harmonics and their surroundings, whereas the attenuation information is coded in the area around the 0th harmonic. Consequently, as mentioned above and described for example by Bennett et al. [18] and Bevins et al. [19], the information of the harmonics has to be reconstructed separately. As the Fourier space is symmetric to the zero frequency, only positive frequencies are used to reconstruct the images.
If the different harmonics in the Fourier space are separated by a sharp cut, ringing artifacts and blurring will be observed in the reconstructed images (Figure 4). Ringing artifacts occur at sharp edges in the reconstructed images due to the fact that sharp edges are represented by a superposition of nearly all frequencies in Fourier space. By setting all high frequencies to zero, the edge is not represented correctly anymore. Ringing-like artifacts occur in the reconstructed images like shadows of the edge. These artifacts can be reduced if the different harmonics in Fourier space are not separated by a sharp cut. It is more appropriate to separate the harmonics by applying a Gaussian-shaped frequency filter centered at the maximum of the harmonic, which should be separated. It has to be considered that the Gaussian cut acts as a low pass filter. Thus, it has to be as sharp as possible to minimize the blurring effect. By contrast, it has to be as wide as possible to reduce the ringing artifacts. Hence, the width of the Gaussian is limited by half of the distance between the harmonics in Fourier space. The most feasible Gaussian has been found empirically. In addition, a region around the 1st harmonic is set to zero when cutting the 0th harmonic. Thus, no moiré artifacts are observed in the attenuation image.
Bennett et al. [18] and Bevins et al. [19] only consider a small area around the harmonics for reconstructing the different image domains. Neglecting the high frequencies causes blurring in the reconstructed images. For reconstructing the different image domains, it is necessary to suppress the harmonics that do not contribute to the image information. Nevertheless, it is not necessary to suppress high frequencies that are not correlated with the moiré pattern.
Thus, in this publication, improved cutting filters in Fourier space are presented in order to enhance image quality and avoid blurring artifacts.
The optimized filters are shown in Figure 5c,d in comparison to the sharp, conventionally used filters a,b. All cuts are performed by a Gaussian distribution whose standard deviation is as small as possible to avoid blurring artifacts without receiving ringing artifacts. In addition, in Figure 5c, the cut of the 0th harmonic towards the frequencies larger than the 1st harmonic is a very narrow Gaussian distribution. Furthermore, some values around the minimum of the Gaussian are set to zero as the smoothing effect of the low gradient of the Gaussian towards its extremum has to be reduced. Thus, it is difficult to recognize the Gaussian-like shape in the depiction.
Using these filters, it is ensured that only frequencies are set to zero, which carry interfering information for the single image domain. Especially when cutting the 0th harmonic, high frequencies are not neglected. This of course leads to a higher noise level in the reconstructed images. However, sharp edges are also less blurred as the high frequencies are necessary to depict edges as sharp as possible.

2.4.2. Sliding Window Reconstruction
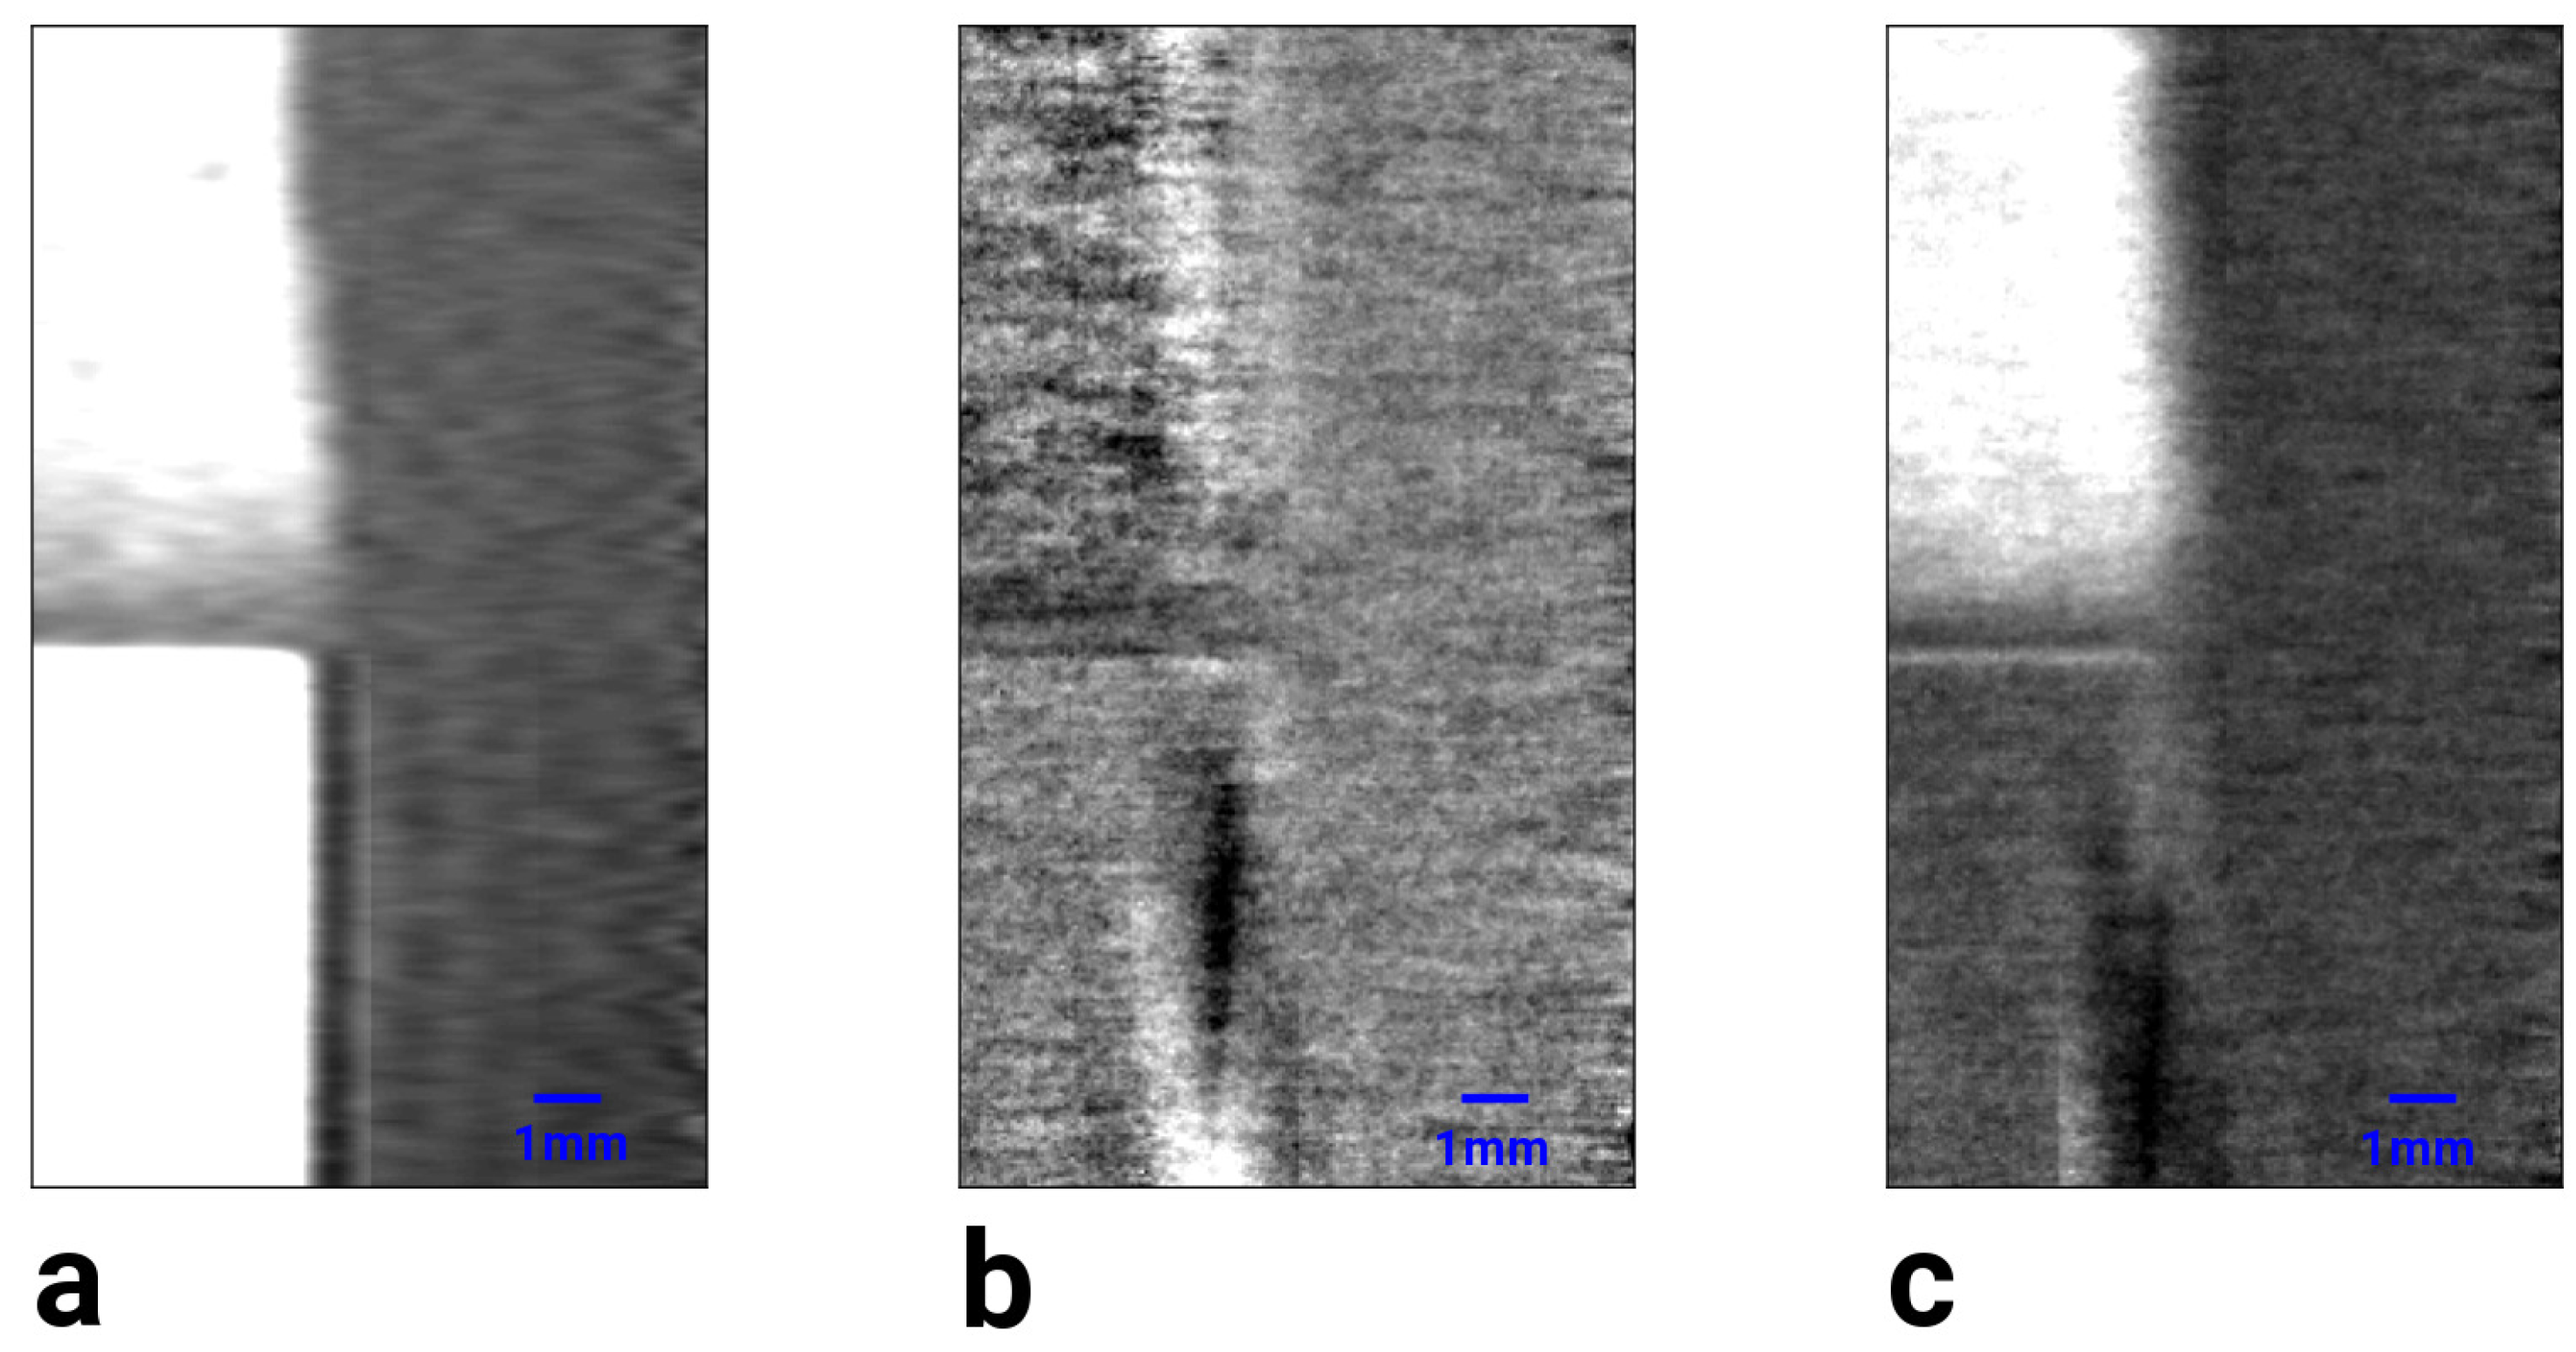
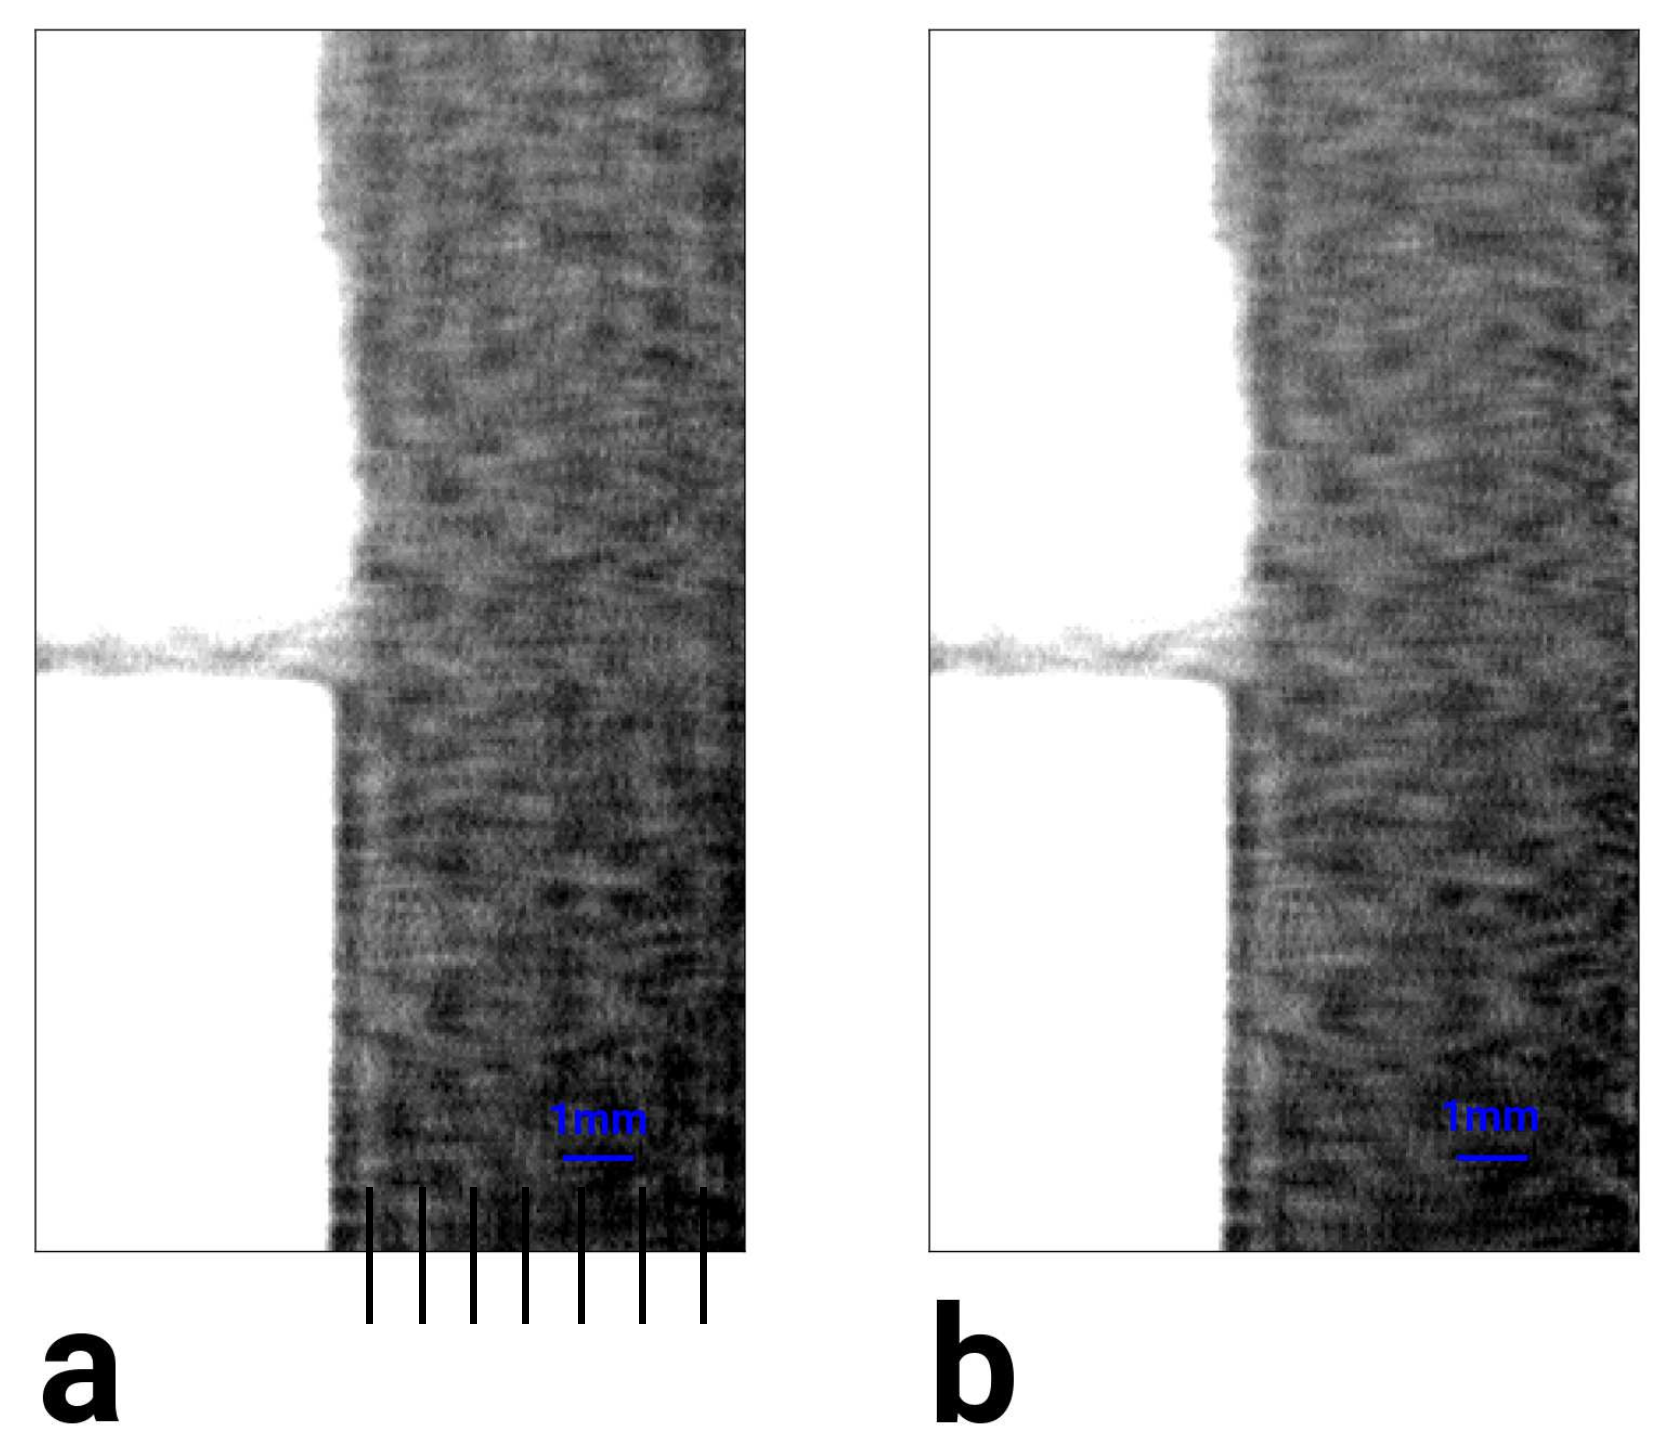
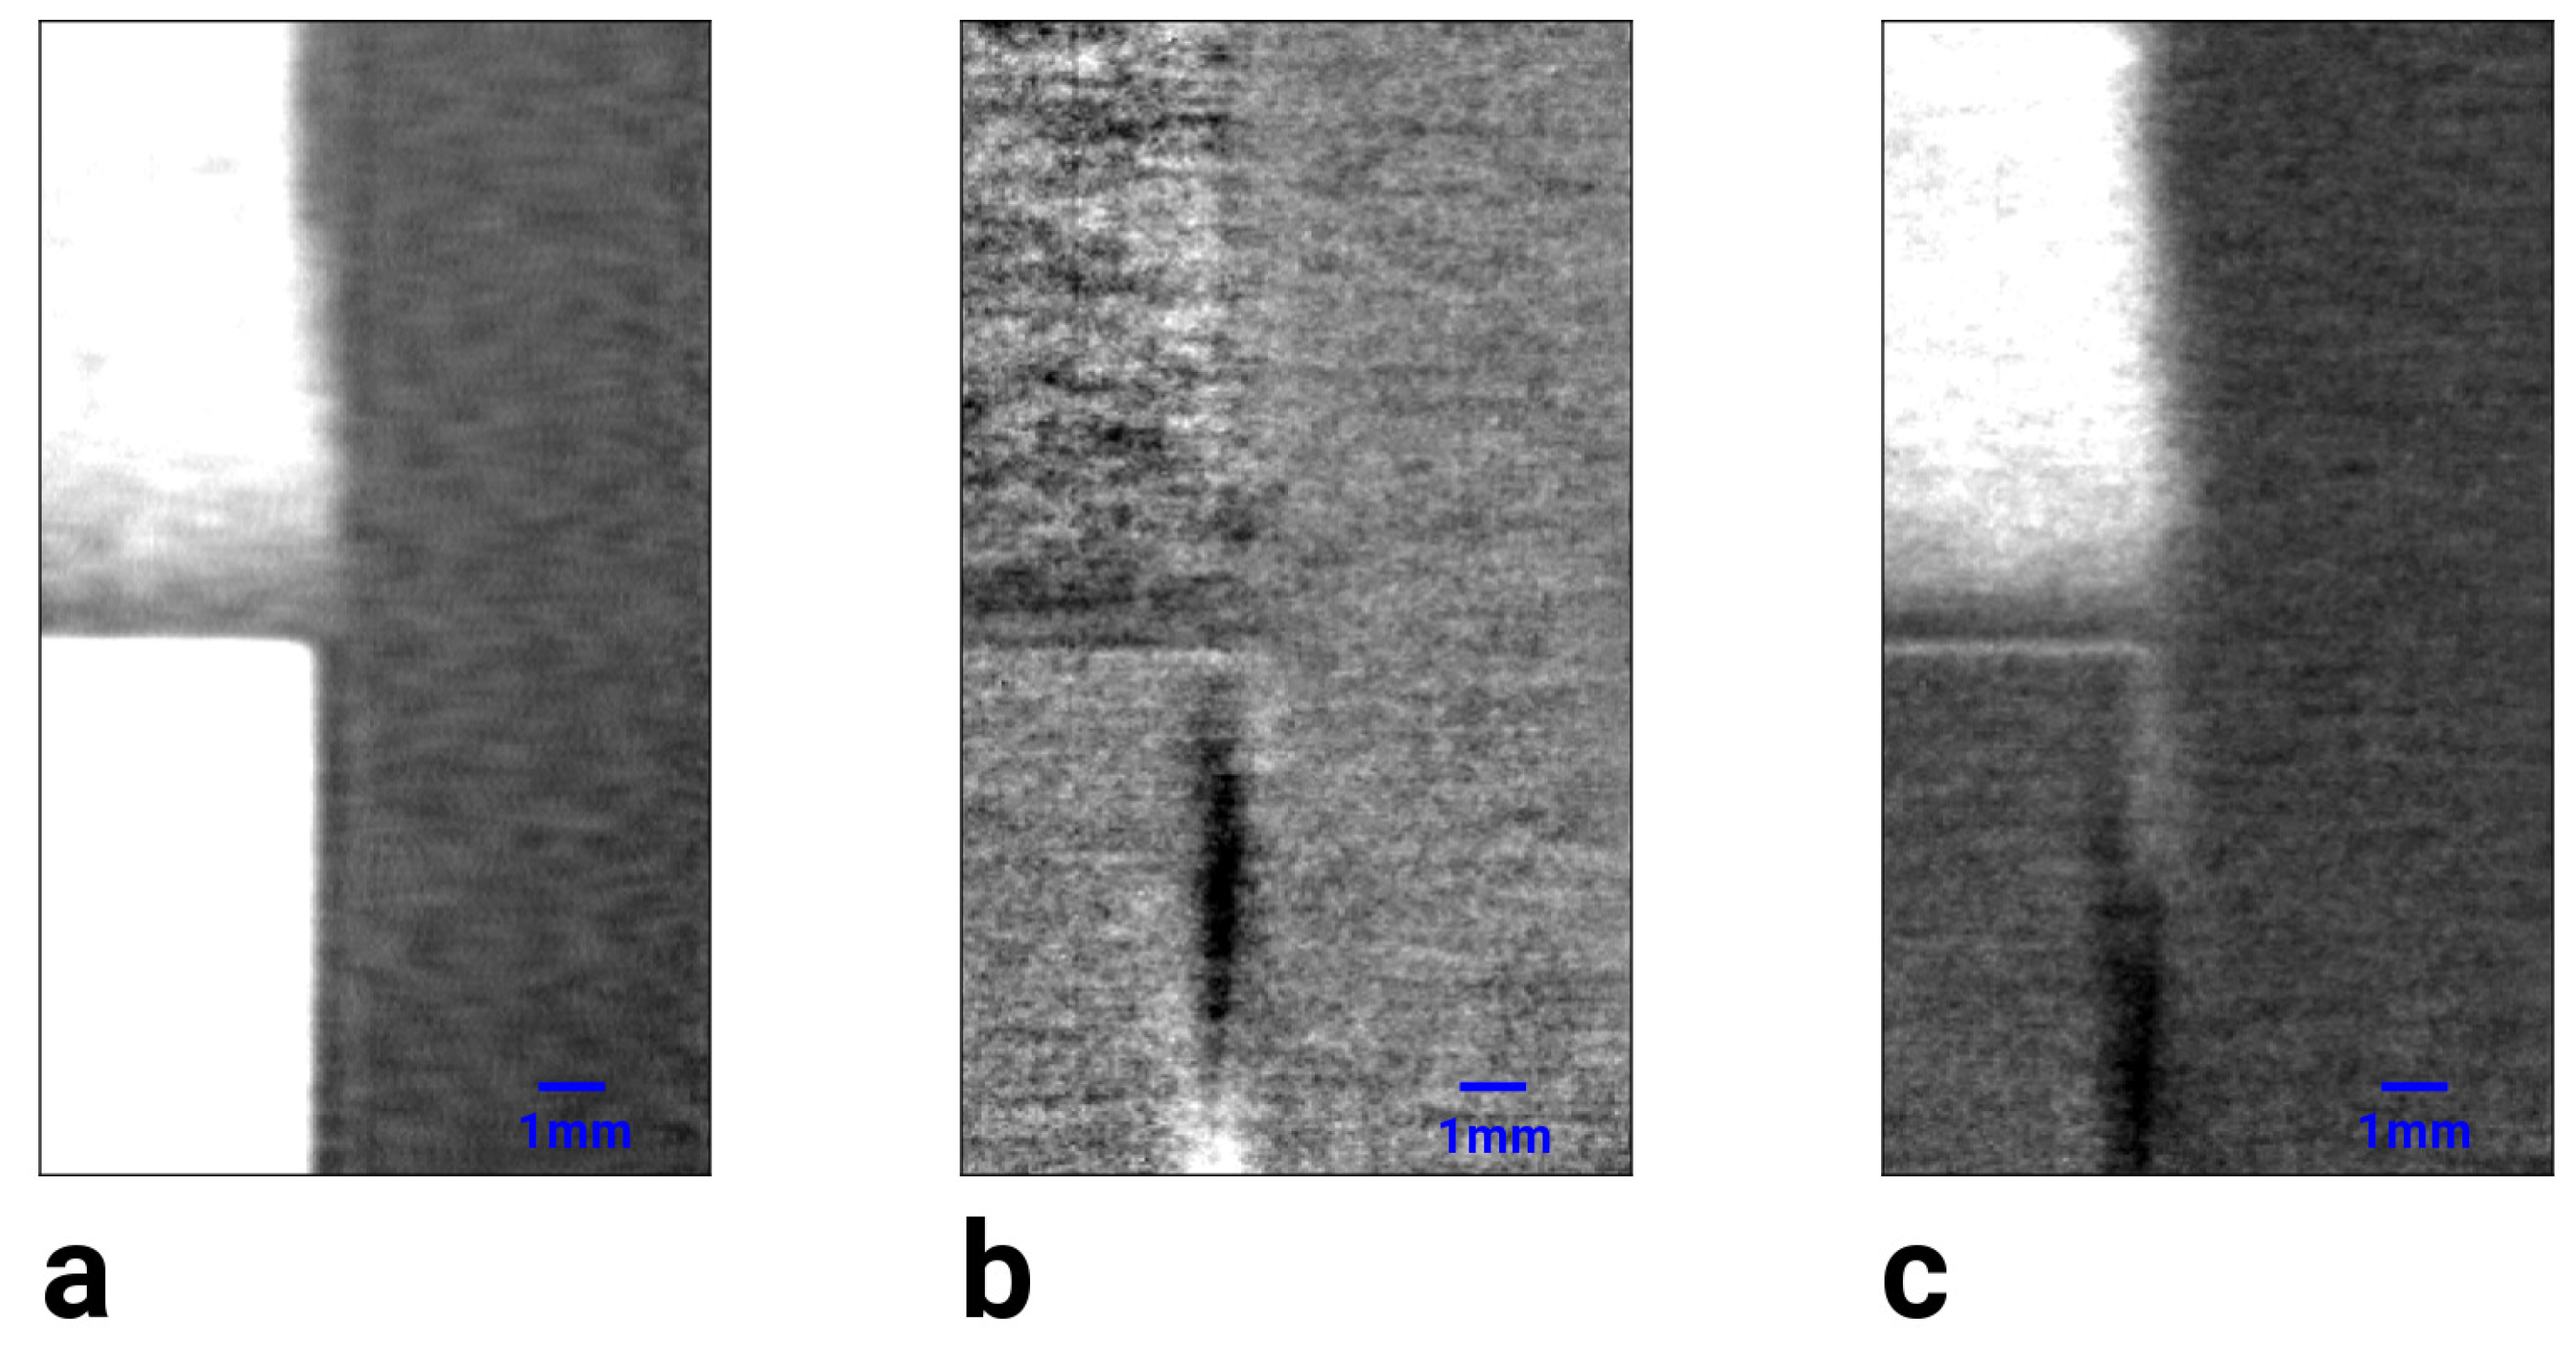
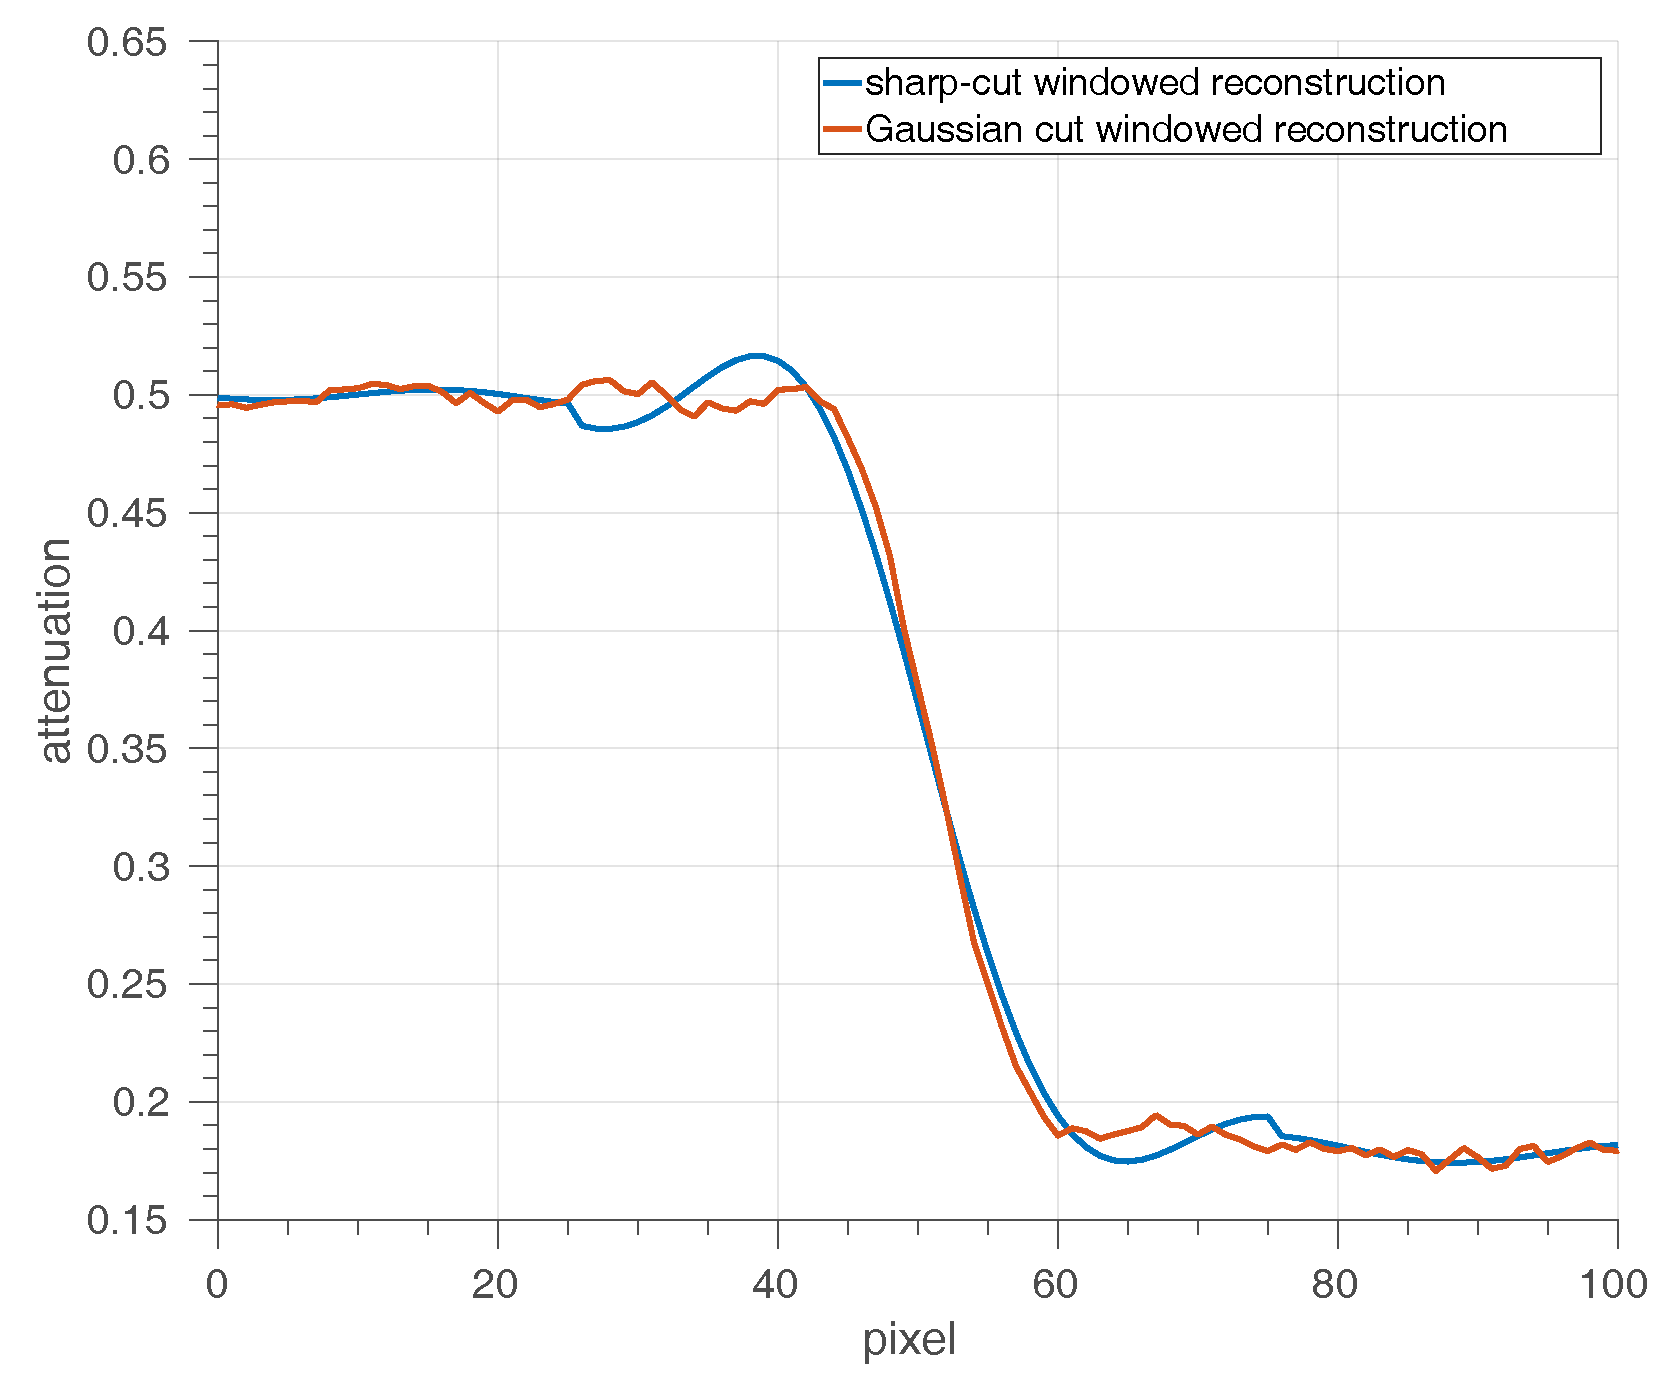
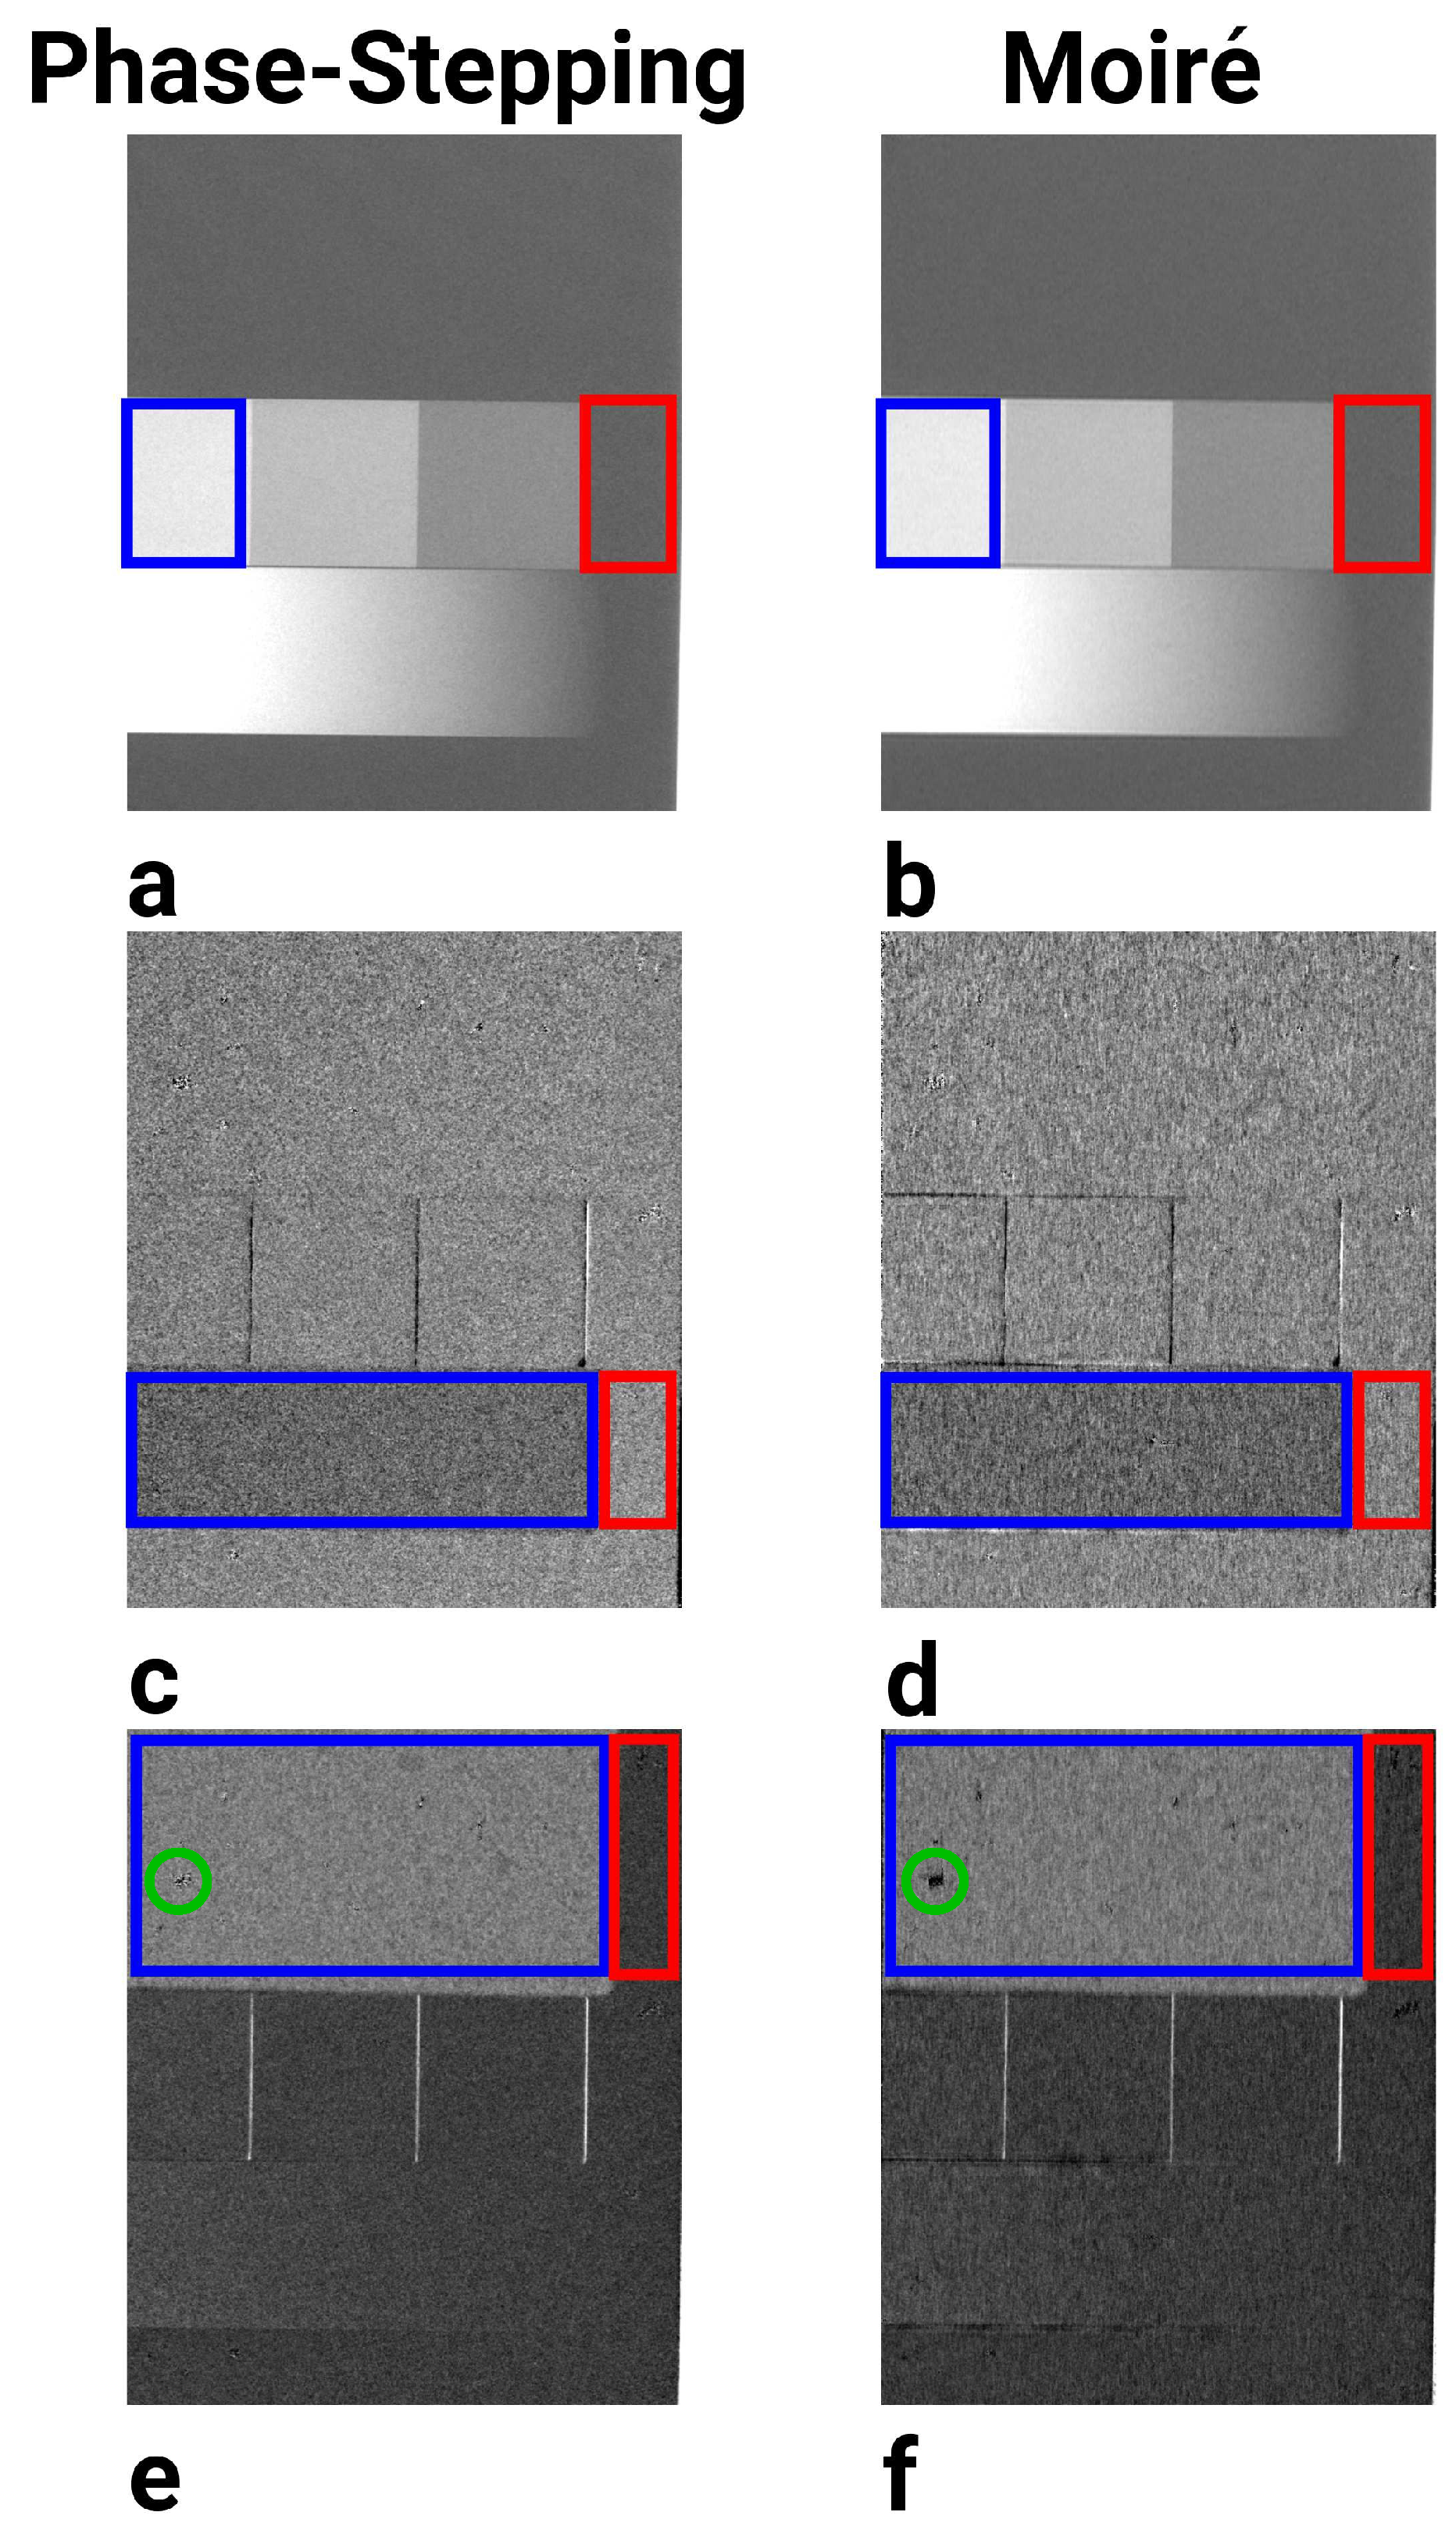
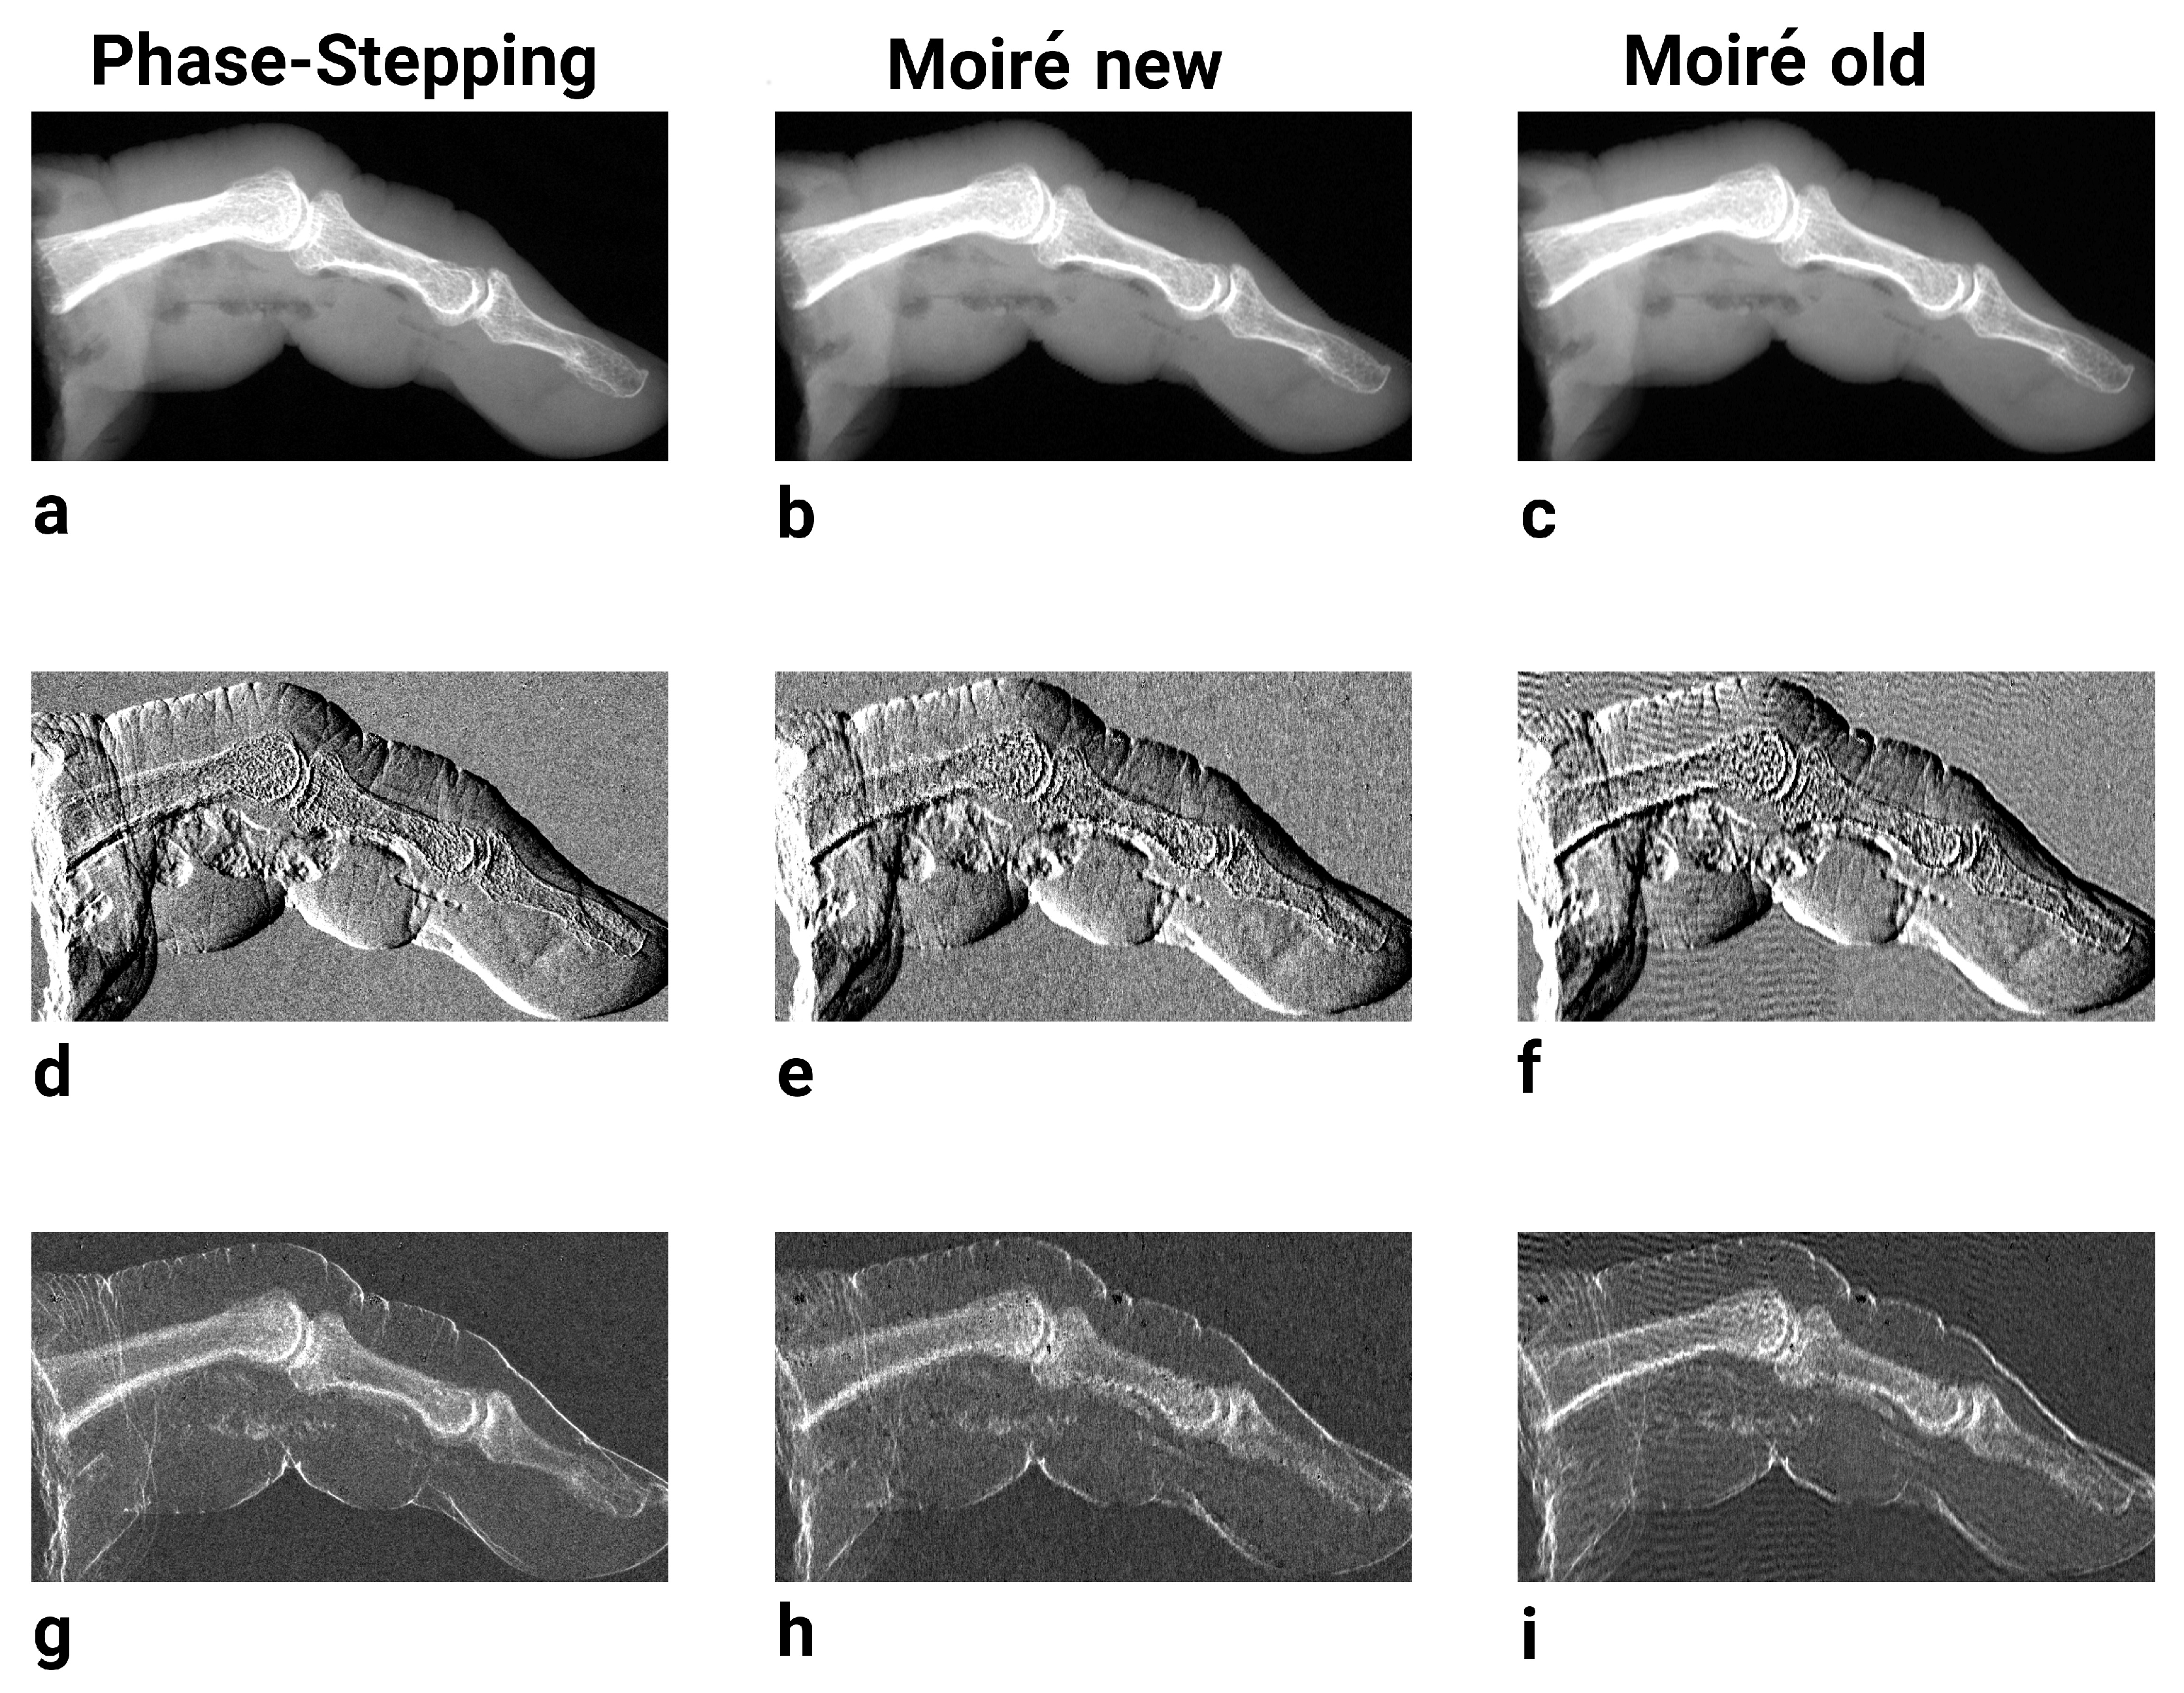
The moiré pattern is not completely regular over a large FoV. This is, for example, due to grating imperfections and misalignments of the gratings. Hence, the frequency and the orientation of the moiré pattern vary slightly over the FoV. Reconstructing the images as described above a constant frequency and orientation is required. Otherwise, artifacts occur that can especially be seen in the attenuation image, e.g., in Figure 6a.
Therefore, it is preferable to limit the reconstructed areas to windows with a constant frequency of the moiré pattern. Additionally, the window should be small enough that the orientation of the pattern does not change within it. It has been empirically found that the smallest reconstruction window leading to meaningful results comprises two moiré periods. Thus, it is ensured that artifacts of defect detector pixels within one period of the moiré pattern or severe distortion of the pattern due to the object in the beam path do not prevent the algorithm to detect the correct superposed pattern. Nevertheless, the reconstructing window size is small enough that the period of the moiré pattern can be assumed as constant. Thus, for example, an image superposed by a moiré pattern with a period of 15 detector pixels can be reconstructed using a minimal window size of 30 × 1 pixels. The window should be orientated perpendicular to the moiré fringes to be able to analyze the fringes. Each window is reconstructed separately. Before Fourier transforming the window, each single window should be weighted with a Hanning filter [17] to avoid discontinuities at the margin of the windows. At the end, the windows are stitched together. Therefore, it is important to overlap the windows to avoid margin artifacts. However, at sharp edges, it is sometimes not possible to use the minimal window size to reconstruct the images because the moiré pattern is severely distorted by an edge of the object. Thus, the different harmonics cannot be detected and separated anymore. Hence, a compromise has to be made between a small reconstruction window to avoid artifacts due to inhomogeneities and a large reconstruction window in order to detect the moiré period even at edges in the image. This piecewise reconstruction technique is subsequently called sliding window reconstruction. In Figure 6b, it can be seen that, by using the sliding window reconstruction, artifacts caused by an inhomogenious moiré pattern can be reduced significantly.
Due to spatial discontinuities at the edge of the reconstruction window, artifacts can be observed at the margin of the reconstructed windows [17]. To avoid these artifacts, only the inner third of the reconstructed window is taken to stick the image together. Thus, the reconstruction windows are overlapping each other.
Using the above described techniques, it is possible to reconstruct images mostly artifact-free (Figure 7).

3. Results

To evaluate the ability to reconstruct sharp edges by the different reconstruction methods, a lineplot of Figure 4a is compared to a lineplot of Figure 7a. The lineplot is taken from the edge of the step wedge on the bottom of the figure. It is shown in Figure 8. The blue line shows the edge reconstructed with a sharp cut in the frequency space. The red line shows the edge reconstructed with the Gaussian cut. Ringing of the blue line can be observed in front of and behind the edge. This ringing is reduced in the red line. Applying the sharp cut, high frequencies are set to zero, cutting the zero harmonic order (Figure 5a). This is not the case for the presented Gaussian cut (Figure 5c). Therefore, the blue line is smoothed compared to the red line. Furthermore, it can be observed that the red line shows a steeper gradient at the place of the edge than the blue line. Thus, the edge seems to be better reconstructed applying the Gaussian filter.
The contrast to noise ratios (CNRs) of the three image modalities have been evaluated for the moiré imaging approach in comparison to the conventional phase-stepping approach. The results of the measurement are shown in Table 3. The regions of interest (ROIs) that were used to calculate the CNRs are marked in Figure 9. It can be seen that the CNR values of the differential phase-contrast image and the dark-field image yield comparable results for both reconstruction methods. They are only slightly better for the phase-stepping approach. In the attenuation images, the moiré imaging approach leads to an even higher CNR value than the phase-stepping approach. This is due to the smoothing effect of the moiré imaging reconstruction of the attenuation image. Neglecting the frequencies around the first harmonics reduces the noise in the attenuation image. Reconstructing the dark-field image, all frequencies are taken into account as images gained with both filters are combined to calculate the dark-field image. For the differential phase-contrast image, only frequencies around the zero order harmonic are neglected. Thus, the smoothing in the dark-field and the differential phase-contrast image are not as emphasized as in the attenuation image.
For further investigations, a human finger has been imaged to show the capabilities of the improved reconstruction algorithm. The three image modalities reconstructed with the conventional technique and with the improved algorithm, in comparison with the phase-stepping method, are shown in Figure 10. Especially in the differential phase-contrast and the dark-field image that are reconstructed with the conventional algorithm (Figure 10f,i) moiré artifacts can be seen. These artifacts can be completely removed applying the presented, improved reconstruction algorithm (Figure 10e,h). It can be seen that the image qualities of the phase-stepping approach and the moiré imaging approach reconstructed with the improved algorithm are comparable.

4. Discussion

This work shows that it is possible to depict an object in attenuation, differential phase-contrast and dark-field image with the single-shot moiré X-ray imaging method. The CNR values of the images reconstructed with the moiré imaging approach are comparable to those of the phase-stepping images. Nevertheless, the spatial resolution is reduced in the images acquired by moiré imaging. This can be seen at the edges of the phantom components. The spatial resolution cannot be directly measured using a line phantom because the structures of the line phantom superpose with the structures of the moiré pattern. This leads to a further moiré pattern and thus the line phantom cannot be reconstructed correctly. In future experiments, it would be interesting to quantify the loss in spatial resolution by different approaches. This is a complex problem and needs further investigation.
It has to be mentioned that the object interested in medical imaging normally does not show periodic structures on the scale of the moiré pattern. Thus, the correct reconstruction of medical images should not be a problem. The sensitivity is the same as in the phase-stepping approach.
Furthermore, artifacts resulting from grating imperfections are more emphasized in moiré imaging. This can, for example, be seen in the dark-field image (Figure 9e,f) of the sponge (top), near the left margin of the image. An area with low signal (black dot) is visible for both image acquisition domains, but it is more emphasized in the moiré imaging. The area is marked by a green circle.
Nevertheless, with the help of the improved reconstruction technique, it is possible to reconstruct images with a good image quality as could be shown by comparing the CNR values. Thus, it seems appropriate to implement this single-shot imaging method in Talbot–Lau interferometry and improve its feasibility for workflow processes in clinical or industrial domains. Image acquisition time is mainly limited by the read-out time of the detector. As the moiré images are acquired by a single-shot approach, the detector is read out once for the moiré imaging approach. For the phase-stepping approach, the detector is read out after each phase-step. In the presented case, nine phase-steps have been performed. Additionally, in the phase-stepping approach, the time that is necessary to move the grating has to be added to the whole imaging time. To further accelerate the moiré imaging process, a high photon flux is advisable. Thus, the exposure time of the single-shot exposure can be shortened while keeping the dose constant. A higher photon flux cannot be used to accelerate the imaging process in the phase-stepping procedure. The exposure time of each phase-step is very short, so there is no need to shorten the exposure time for a single phase-step.
Hence, artifacts due to the object motion or setup instabilities can be reduced. For example, in lung imaging, the moiré imaging approach opens up new possibilities as motion artifacts due to breathing of the patient are no longer a problem. In particular, the moiré imaging approach is very promising regarding lung imaging due to its single-shot character. In this case, no high spatial resolution is necessary as especially the scattering properties of the lung tissue that are related to the air-filled aveola structure is of interest. Additionally, no high spatial resolution is necessary for depicting a lung in dark-field image. Hence, the reduced spatial resolution of moiré imaging is no problem for this application. There are many more fields of application for moiré imaging that should be evaluated in the future. For example, due to the fast image acquisition process, single-shot moiré imaging methods allow X-ray phase-contrast fluoroscopy or CT imaging. This is an important step towards the daily use of X-ray phase-contrast imaging in medical or industrial applications.

Author Contributions

Florian Horn, Veronika Ludwig, Georg Pelzer and Jens Rieger conceived and designed the experimental setup; Maria Seifert and Michael Gallersdörfer formulated research goals; Michael Gallersdörfer performed the experiments; M.S. analyzed the data; Maria Seifert and Max Schuster contributed analysis tools; Maria Seifert wrote the paper. Thilo Michel and Gisela Anton supervised the project.

Acknowledgments

We would like to acknowledge financial and technical support of this work by Siemens Healthcare GmbH. In addition, the authors would like to acknowledge the contribution of the Anatomical Institute II of the Friedrich-Alexander-University (Germany), who provided the specimen. Additionally, we would like to acknowledge the Karlsruhe Nano Micro Facility (KNMF), a Helmholtz Research Infrastructure at Karlsruhe Institute of Technology (KIT) and microworks GmbH for fabricating our gratings.

Conflicts of Interest

The authors declare no conflict of interest. The founding sponsors had no role in the design of the study; in the collection, analyses, or interpretation of data; in the writing of the manuscript, and in the decision to publish the results.

References

  1. Diemoz, P.; Bravin, A.; Coan, P. Theoretical comparison of three X-ray phase-contrast imaging techniques: Propagation-based imaging, analyzer-based imaging and grating interferometry. Opt. Express 2012, 20, 2789–2805. [Google Scholar] [CrossRef] [PubMed]
  2. Momose, A.; Takeda, T.; Itai, Y.; Hirano, K. Phase-contrast X-ray computed tomography for observing biological soft tissues. Nat. Med. 1996, 2, 473–475. [Google Scholar] [CrossRef] [PubMed]
  3. Lewis, R.A.; Hall, C.J.; Hufton, A.P.; Evans, S.; Menk, R.H.; Arfelli, F.; Rigon, L.; Tromba, G.; Dance, D.R.; Ellis, I.O.; et al. X-ray refraction effects: Application to the imaging of biological tissues. Br. J. Radiol. 2003, 76, 301–308. [Google Scholar] [CrossRef] [PubMed]
  4. Snigirev, A.; Snigireva, I.; Kohn, V.; Kuznetsov, S.; Schelokov, I. On the possibilities of X-ray phase contrast microimaging by coherent high-energy synchrotron radiation. Rev. Sci. Instrum. 1995, 66, 5486–5492. [Google Scholar] [CrossRef]
  5. Wilkins, S.; Gureyev, T.; Gao, D.; Pogany, A.; Stevenson, A. Phase-contrast imaging using polychromatic hard X-rays. Nature 1996, 384, 335–338. [Google Scholar] [CrossRef]
  6. Foerster, E.; Goetz, K.; Zaumseil, P. Double crystal diffractometry for the characterization of targets for laser fusion experiments. Krist. Tech. 1980, 15, 937–945. [Google Scholar] [CrossRef]
  7. Chapman, D.; Thomlinson, W.; Johnston, R.; Washburn, D.; Pisano, E.; Gmuer, N.; Zhong, Z.; Menk, R.; Arfelli, F.; Sayers, D. Diffraction enhanced X-ray imaging. Phys. Med. Biol. 1997, 42, 2015–2025. [Google Scholar] [CrossRef] [PubMed]
  8. Bravin, A. Exploiting the X-ray refraction contrastwith an analyser: The state of the art. J. Phys. D Appl. Phys. 2003, 36, A24–A29. [Google Scholar] [CrossRef]
  9. David, C.; Noehammer, B.; Solak, H.; Ziegler, E. Differential X-ray phase contrast imaging using a shearing interferometer. Appl. Phys. Lett. 2002, 81, 3287–3289. [Google Scholar] [CrossRef]
  10. Momose, A.; Kawamoto, S.; Koyama, I.; Hamaishi, Y.; Takai, K.; Suzuki, Y. Demonstration of X-Ray Talbot Interferometry. Jpn. J. Appl. Phys. 2003, 52, L866–L868. [Google Scholar] [CrossRef]
  11. Weitkamp, T.; Diaz, A.; David, C.; Pfeiffer, F.; Stampanoni, M.; Cloetens, P.; Ziegler, E. X-ray phase imaging with a grating interferometer. Jpn. J. Appl. Phys. 2005, 13, 6296–6304. [Google Scholar] [CrossRef]
  12. Pfeiffer, F.; Weitkamp, T.; Bunk, O.; David, C. Phase retrieval and differential phase-contrast imaging with low-brilliance X-ray sources. Nat. Phys. 2006, 2, 258–261. [Google Scholar] [CrossRef]
  13. Olivo, A.; Arfelli, F.; Cantatore, G.; Longo, R.; Menk, R.; Pani, S.; Prest, M.; Poropat, P.; Rigon, L.; Tromba, G.; et al. An innovative digital imaging set-up allowing a low-dose approach to phase contrast applications in the medical field. Med. Phys. 2001, 28, 1610–1619. [Google Scholar] [CrossRef] [PubMed]
  14. Olivo, A.; Speller, R. A coded-aperture technique allowing X-ray phase contrast imaging with conventional sources. Appl. Phys. Lett. 2007, 91, 1–3. [Google Scholar] [CrossRef]
  15. Olivo, A.; Ignatyev, K.; Munro, P.R.T.; Speller, R.D. Noninterferometric phase-contrast images obtained with incoherent X-ray sources. Appl. Opt. 2011, 50, 1765–1769. [Google Scholar] [CrossRef] [PubMed]
  16. Endrizzi, M.; Basta, D.; Olivo, A. Laboratory-based X-ray phase-contrast imaging with misaligned optical elements. Appl. Phys. Lett. 2015, 107, 124103. [Google Scholar] [CrossRef]
  17. Takeda, M.; Ina, H.; Kobayashi, S. Fourier-transform method of fringe-pattern analysis for computer-based topography and interferometry. J. Opt. Soc. Am. 1982, 72, 156–160. [Google Scholar] [CrossRef]
  18. Bennett, E.E.; Kopace, R.; Stein, A.F.; Wen, H. A grating-based single-shot X-ray phase contrast and diffraction method for in vivo imaging. Med. Phys. 2010, 37, 6047–6054. [Google Scholar] [CrossRef] [PubMed]
  19. Bevins, N.; Zambelli, J.; Li, K.; Qi, Z.; Chen, G.H. Multicontrast X-ray computedtomography imaging using Talbot–Lau interferometry without phase stepping. Med. Phys. 2012, 39, 424–428. [Google Scholar] [CrossRef] [PubMed]
  20. Talbot, H. Facts relating to optical science. Opt. Commun. 1836, 9, 401–407. [Google Scholar]
  21. Lau, E. Beugungserscheinungen an Doppelrastern. Ann. Phys. 1948, 437, 417–423. [Google Scholar] [CrossRef]
  22. Jahns, J.; Lohmann, A. The Lau effect (a diffraction experiment with incoherent illumination). Opt. Commun. 1979, 28, 263–267. [Google Scholar] [CrossRef]
  23. Patorski, K. Incoherent Superposition of Multiple Self-imaging Lau Effect and Moiré Fringe Explanation. Opt. Act Int. J. Opt. 1983, 30, 745–758. [Google Scholar] [CrossRef]
  24. Bartelt, H.; Jahns, J. Interferometry based on the Lau effect. Opt. Commun. 1979, 30, 268–274. [Google Scholar] [CrossRef]
  25. Clauser, J.; Reinsch, M. New theoretical and experimental results in fresnel optics with applications to matter-wave and X-ray interferometry. Appl. Phys. B Photophys. Laser Chem. 1992, 54, 380–395. [Google Scholar] [CrossRef]
  26. Suleski, T.J. Generation of Lohmann images from binary-phase Talbot array illuminators. Appl. Opt. 1997, 36, 4686–4691. [Google Scholar] [CrossRef] [PubMed]
  27. Li, K.; Ge, Y.; Garrett, J.; Bevins, N.; Zambelli, J.; Chen, G.H. Grating-based phase contrast tomosynthesis imaging: Proof-of-concept experimental studies. Med. Phys. 2014, 41. [Google Scholar] [CrossRef] [PubMed]
  28. Stampanoni, M.; Wang, Z.; Thüring, T.; David, C.; Roessl, E.; Trippel, M.; Kubik-Huch, R.A.; Singer, G.; Hohl, M.K.; Hauser, N. The first analysis and clinical evaluation of native breast tissue using differential phase-contrast mammography. Investig. Radiol. 2011, 46, 801–806. [Google Scholar] [CrossRef] [PubMed]
  29. Michel, T.; Rieger, J.; Anton, G.; Bayer, F.; Beckmann, M.W.; Durst, J.; Fasching, P.A.; Haas, W.; Hartmann, A.; Pelzer, G.; et al. On a dark-field signal generated by micrometer-sized calcifications in phase-contrast mammography. Phys. Med. Biol. 2013, 58, 2713–2732. [Google Scholar] [CrossRef] [PubMed]
  30. Bech, M.; Tapfer, A.; Velroyen, A.; Yaroshenko, B.; Pauwels, B.; Hostens, J.; Bruyndonckx, P.; Sasov, A.; Pfeiffer, F. In-vivo dark-field and phase-contrast X-ray imaging. Sci. Rep. 2013, 3. [Google Scholar] [CrossRef] [PubMed]
  31. Miao, H.; Chen, L.; Bennett, E.E.; Adamo, N.M.; Gomella, A.A.; DeLuca, A.M.; Patel, A.; Morgan, N.Y.; Wen, H. Motionless phase stepping in X-ray phase contrast imaging with a compact source. Proc. Natl. Acad. Sci. USA 2013, 110, 19268–19272. [Google Scholar] [CrossRef] [PubMed]
  32. Weitkamp, T.; Nöhammer, B.; Diaz, A.; David, C.; Ziegler, E. X-ray wavefront analysis and optics characterization with a grating interferometer. Appl. Phys. Lett. 2005, 86, 054101. [Google Scholar] [CrossRef]
  33. Momose, A.; Yashiro, W.; Maikusa, H.; Takeda, Y. High-speed X-ray phase imaging and X-ray phase tomography with Talbot interferometer and white synchrotron radiation. Opt. Express 2009, 17, 12540–12545. [Google Scholar] [CrossRef] [PubMed]
  34. Momose, A.; Yashiro, W.; Harasse, S.; Kuwabara, H. Four-dimensional X-ray phase tomography with Talbot interferometry and white synchrotron radiation: Dynamic observation of a living worm. Opt. Express 2011, 19, 8423–8432. [Google Scholar] [CrossRef] [PubMed]
  35. Lohmann, A.; Silva, D. An interferometer based on the Talbot effect. Philos. Mag. Ser. 3 1971, 2, 413–415. [Google Scholar] [CrossRef]
  36. Pfeiffer, F.; Weitkamp, T.; David, C. X-ray phase contrast imaging using a grating interferometer. Europhys. News 2006, 37, 13–15. [Google Scholar] [CrossRef]
  37. Fitzgerald, R. Phase-sensitive X-ray imaging. Phys. Today 2000, 53, 23–26. [Google Scholar] [CrossRef]
  38. Amidror, I. The Theory of the Moiré Phenomenon-Volume I: Periodic Layers; Springer: London, UK, 2009. [Google Scholar]
  39. David, C.; Pfeiffer, F.; Weitkamp, T. Interferometer for Quantitative Phase Contrast Imaging and Tomography with an Incoherent Polychromatic X-ray Source. European Patent Application No. EP05012121, 13 December 2006. [Google Scholar]
  40. Weitkamp, T.; David, C.; Kottler, C.; Bunk, O.; Pfeiffer, F. Tomography with grating interferometers at low-brilliance sources. In Proceedings of the Developments in X-Ray Tomography V, San Diego, CA, USA, 28 August 2016; Volume 6318. [Google Scholar] [CrossRef]
  41. Zanette, I.; Bech, M.; Rack, A.; Le Duc, G.; Tafforeau, P.; David, C.; Mohr, J.; Pfeiffer, F.; Weitkamp, T. Trimodal low-dose X-ray tomography. Proc. Natl. Acad. Sci. USA 2012, 109, 10199–10204. [Google Scholar] [CrossRef] [PubMed]
Figure 1. Setup of a Talbot–Lau interferometer. The object O deforms the X-ray wave front emitted by the source S. Because of the Lau and the Talbot effect (due to the gratings G 0 and G 1 ), a periodic intensity pattern can be observed in a Talbot distance z T downstream of G 1 . The period of the intensity pattern is small compared to the size of the detector pixel. In order to scan the pattern, a third grating G 2 has to be placed in a Talbot distance of G 1 in front of the detector. It is used either to sample the intensity pattern in conventional Talbot–Lau imaging or to generate a moiré pattern that can be resolved by the detector. The distance l can be be determined applying the intercept theorem.
Jimaging 04 00062 g001
Figure 2. Photograph of the phantom. It consists of a synthetic sponge of constant thickness (top), a step wedge made from PMMA (middle) and a PMMA wedge with a constant slope (bottom). The red rectangle shows the area of the phantom that is imaged. The green rectangle marks the region that is imaged in the more detailed pictures.
Jimaging 04 00062 g002
Figure 3. (a) reference Talbot-moiré image; (b) two-dimensional FT of (a); (c) selected area of the Talbot-moiré image of the phantom shown in Figure 2. The moiré pattern (stripes) is distorted by the sponge (top) and the PMMA step-wedge (bottom); (d) two-dimensional FT of (c). The green arrows mark the −1st and 1st harmonics that are located at the frequency of the moiré pattern. The red arrow marks the 0th harmonic that is located at the zero frequency position. The images correspond to the green area in Figure 2.
Jimaging 04 00062 g003
Figure 4. Attenuation (a), differential phase-contrast (b) and dark-field (c) image of the phantom’s sponge (top) and the PMMA step-wedge (bottom). Ringing artifacts can be observed at the edges of the wedge. The images correspond to the green area in Figure 2.
Jimaging 04 00062 g004
Figure 5. Sharp rectangular frequency filter to select the 0th harmonic (a) and 1st harmonic (b). Gaussian shaped filter to select the 0th harmonic (c) and 1st harmonic (d).
Jimaging 04 00062 g005
Figure 6. Attenuation images, reconstructed with a FT filter applied to the whole moiré image (a) and the sliding window reconstruction (b). Only the sponge (top) and the step-wedge (bottom) are shown. On the right of the one-step reconstruction, a moiré pattern is still visible (a). The fringes of the moiré pattern are marked by the black lines on the bottom of the image. These artifacts can be reduced strongly by performing the windowed reconstruction (b). The images correspond to the green area in Figure 2.
Jimaging 04 00062 g006
Figure 7. Attenuation (a), differential phase-contrast (b) and dark-field (c) image of the phantom reconstructed by using the Gaussian shaped filters and the sliding window reconstruction. The sponge (top) and the PMMA step-wedge (bottom) are shown. No artifacts are observed in the images. The images correspond to the green area in Figure 2.
Jimaging 04 00062 g007
Figure 8. Lineplots of the edge of the step wedge in Figure 4a and Figure 7a.
Jimaging 04 00062 g008
Figure 9. Images of the phantom shown in Figure 3 (red marked area). The ROIs that have been chosen to calculate the CNR values in Table 3 are shown. In the left column (a,c,e), the images are obtained using the phase-stepping approach, in the right column (b,d,f), the images are obtained using the moiré imaging approach. The attenuation images (a,b), the differential phase-contrast images (c,d) and the dark-field images (e,f) are shown. The green circle in the dark-field images (e,f) mark an artifact that is more emphasized in the moiré imaging approach.
Jimaging 04 00062 g009
Figure 10. Images of a human finger, ex-vivo. The images in the left column (a,d,g) are reconstructed using the phase-stepping approach. In the middle (b,e,h), the images of the moiré imaging approach using the improved algorithm are depicted. In the right column (c,f,i), the images of the moiré approach reconstructed with the conventional method are shown. (a,b,c) attenuation images, (d,e,f) differential phase-contrast images and (g,h, i) dark-field images. The corresponding images are obtained with the same dose of 450 mAs at 40 kVp and are plotted with the same color scale.
Jimaging 04 00062 g010
Table 1. Distances between the components.
ComponentsDistance
source grating ( G 0 ) − sample 124 cm
sample − phase grating ( G 1 ) 10 cm
phase grating ( G 1 ) − analyzer grating ( G 2 ) 13 cm
Table 2. Parameters of the gratings.
G0G1G2
materialAuAuAu
period ( μ m )24.394.372.4
height of bars ( μ m )1806.490
duty cycle0.50.750.5
Table 3. Contrast to noise ratios of the three image modalities for both imaging methods. All images are acquired with a dose of 900 mAs at a peak voltage of 40 kVp .
Phase-SteppingMoiré Imaging
attenuation 21.06 ± 0.05 25.91 ± 0.06
differential phase-contrast 1.14 ± 0.01 0.80 ± 0.01
dark-field 3.65 ± 0.01 2.84 ± 0.01

