Investigation of a Monturaqui Impactite by Means of Bi-Modal X-ray and Neutron Tomography

 ,
,
Abstract
:1. Introduction
2. Materials and Methods
2.1. Monturaqui Crater and Impactite
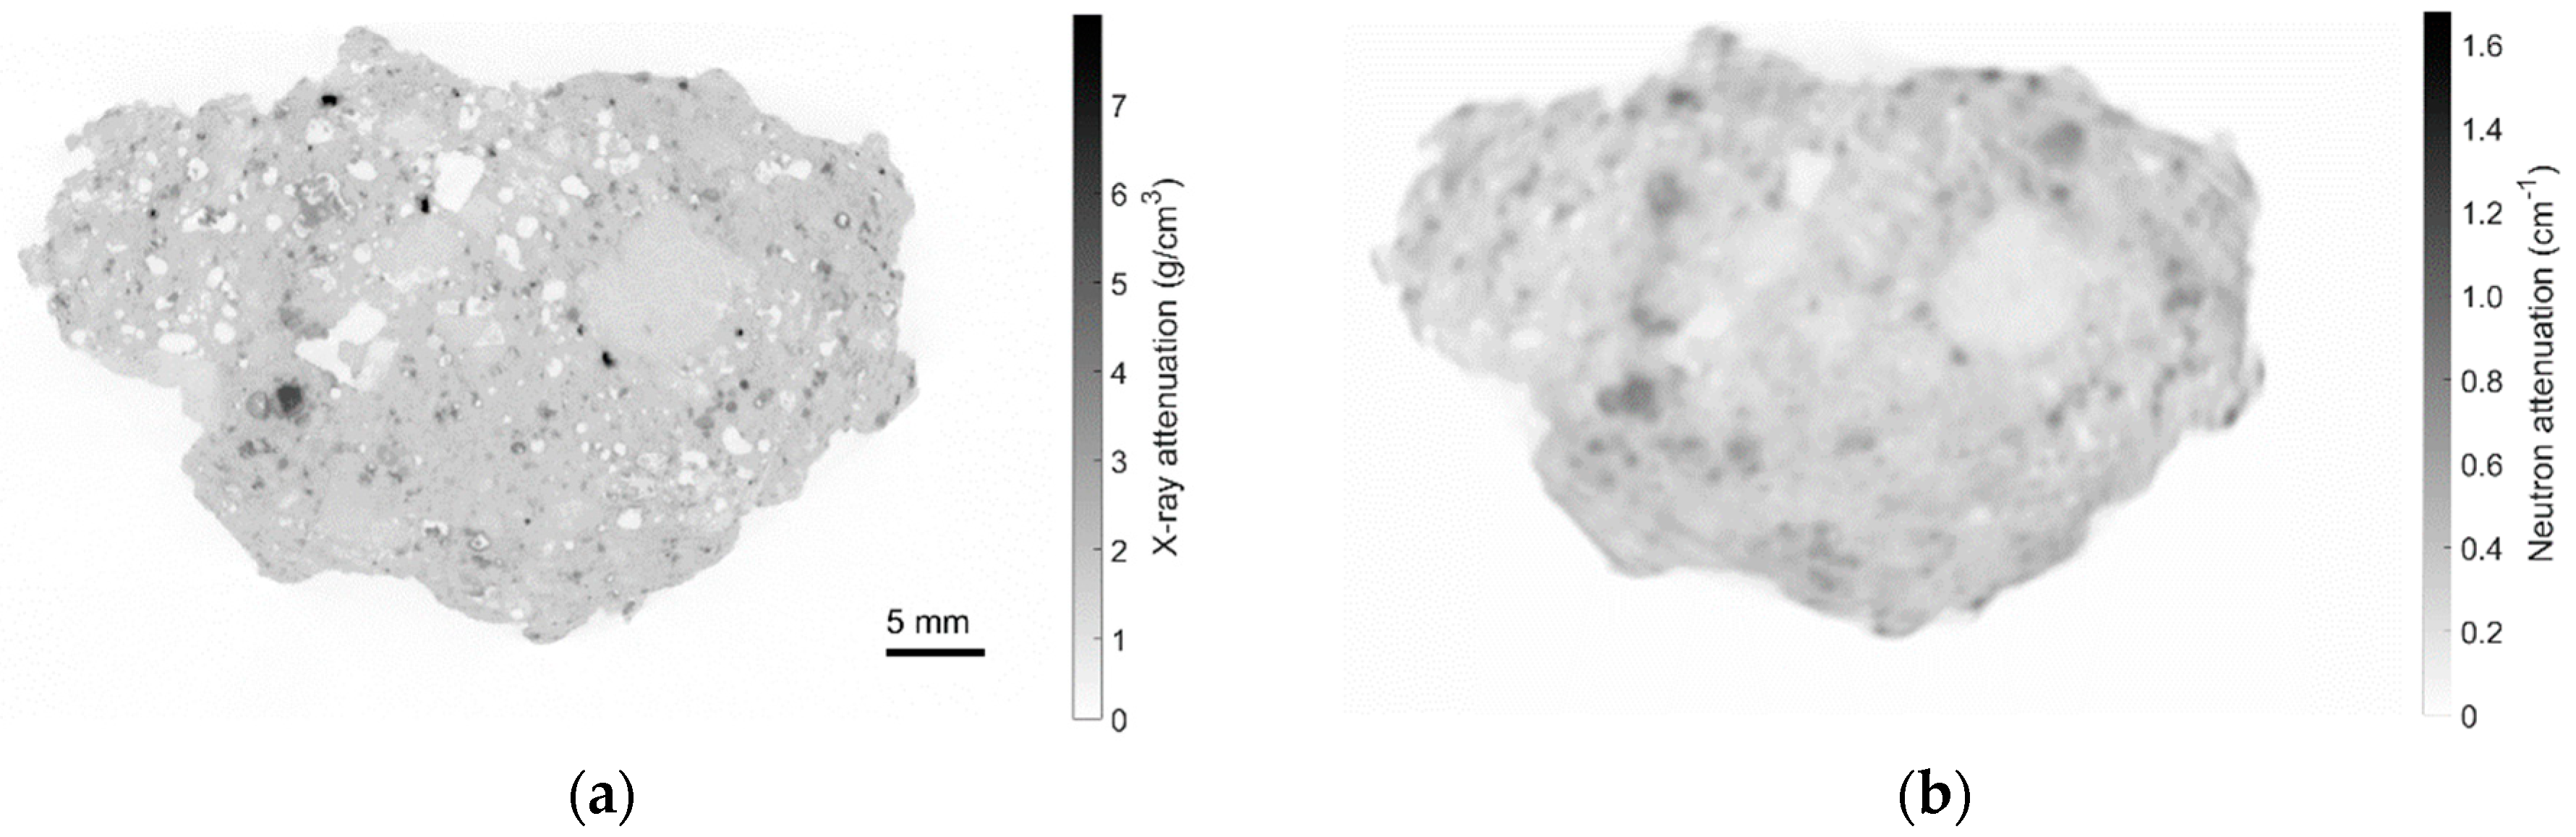
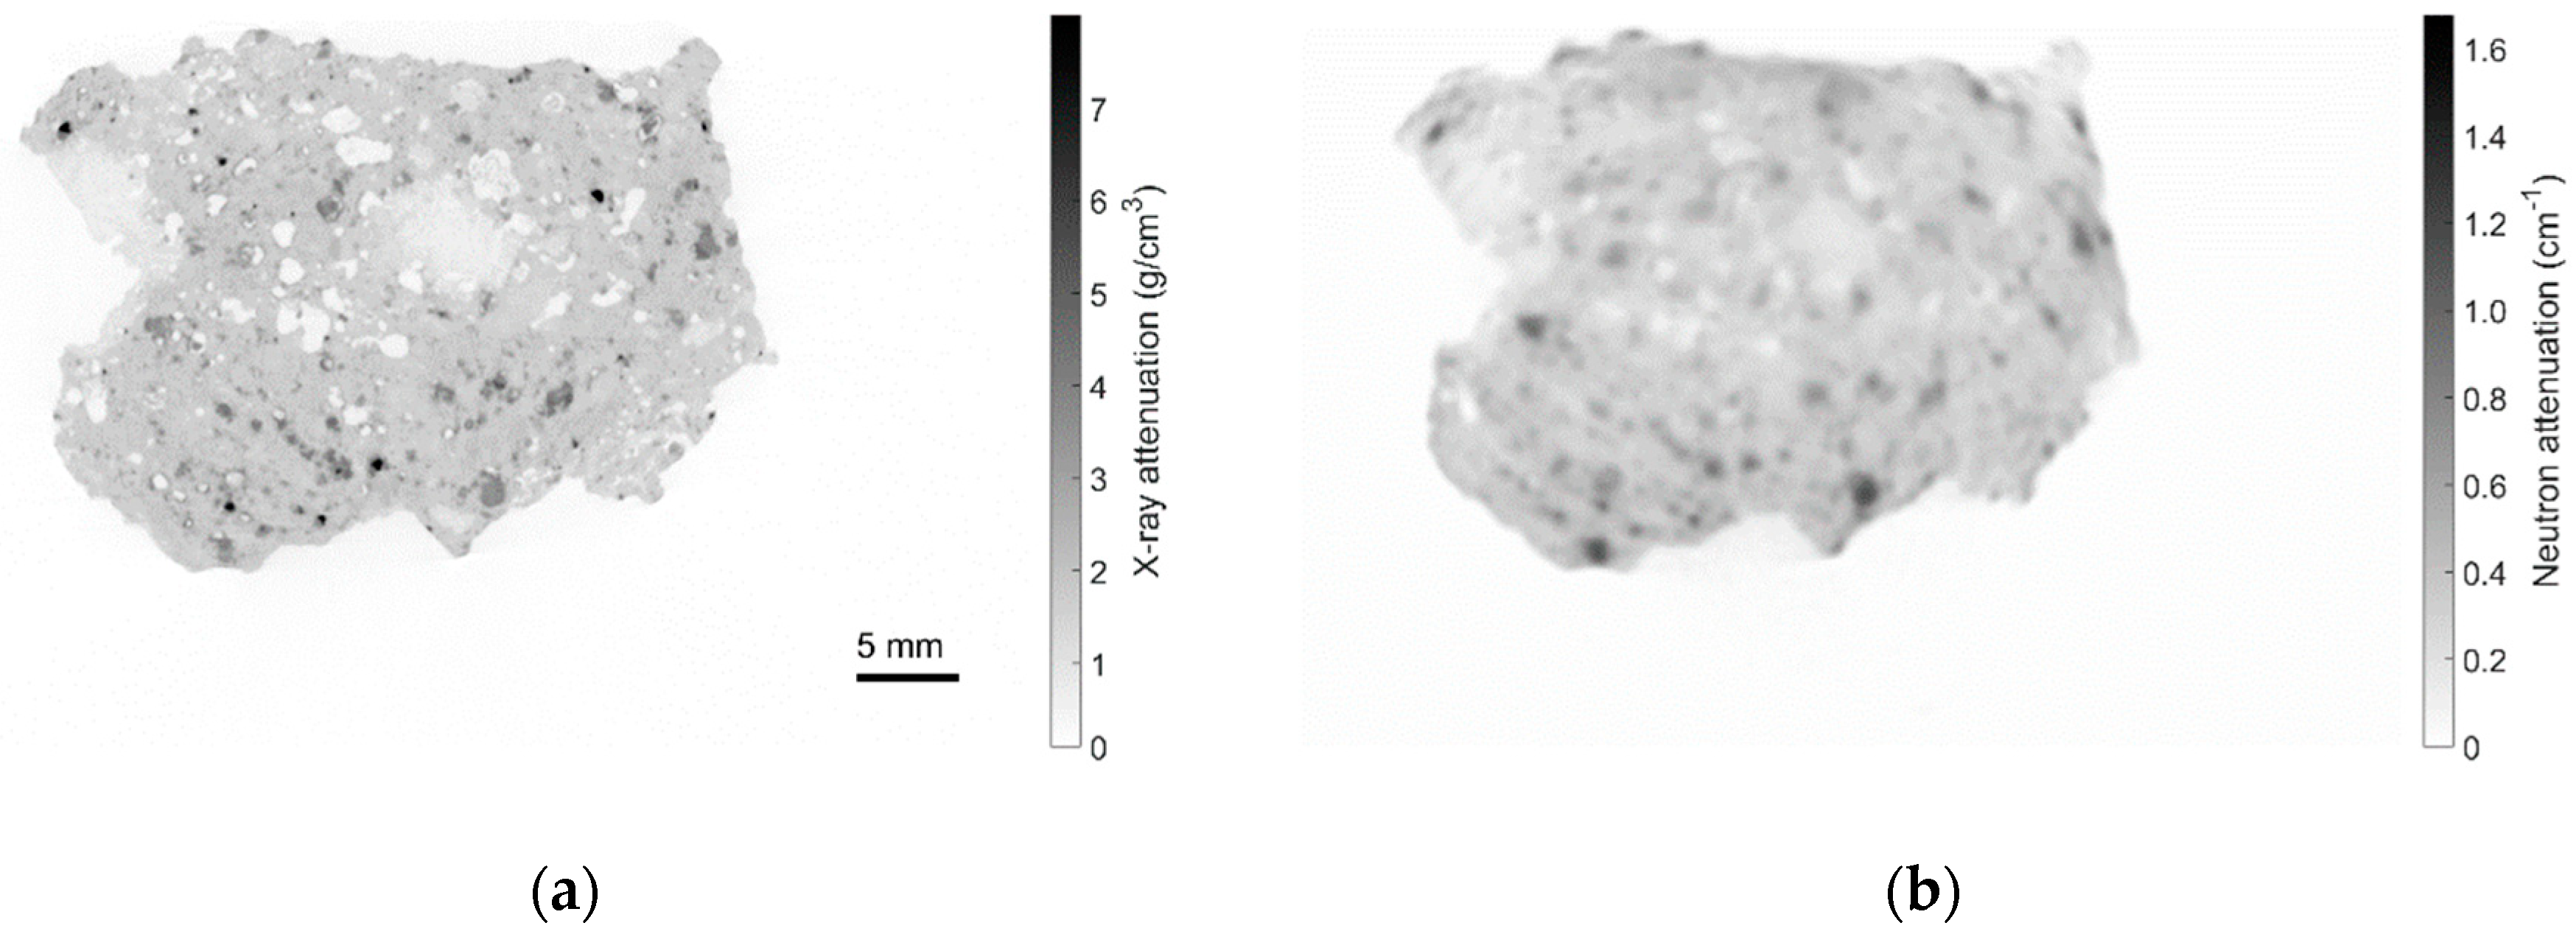
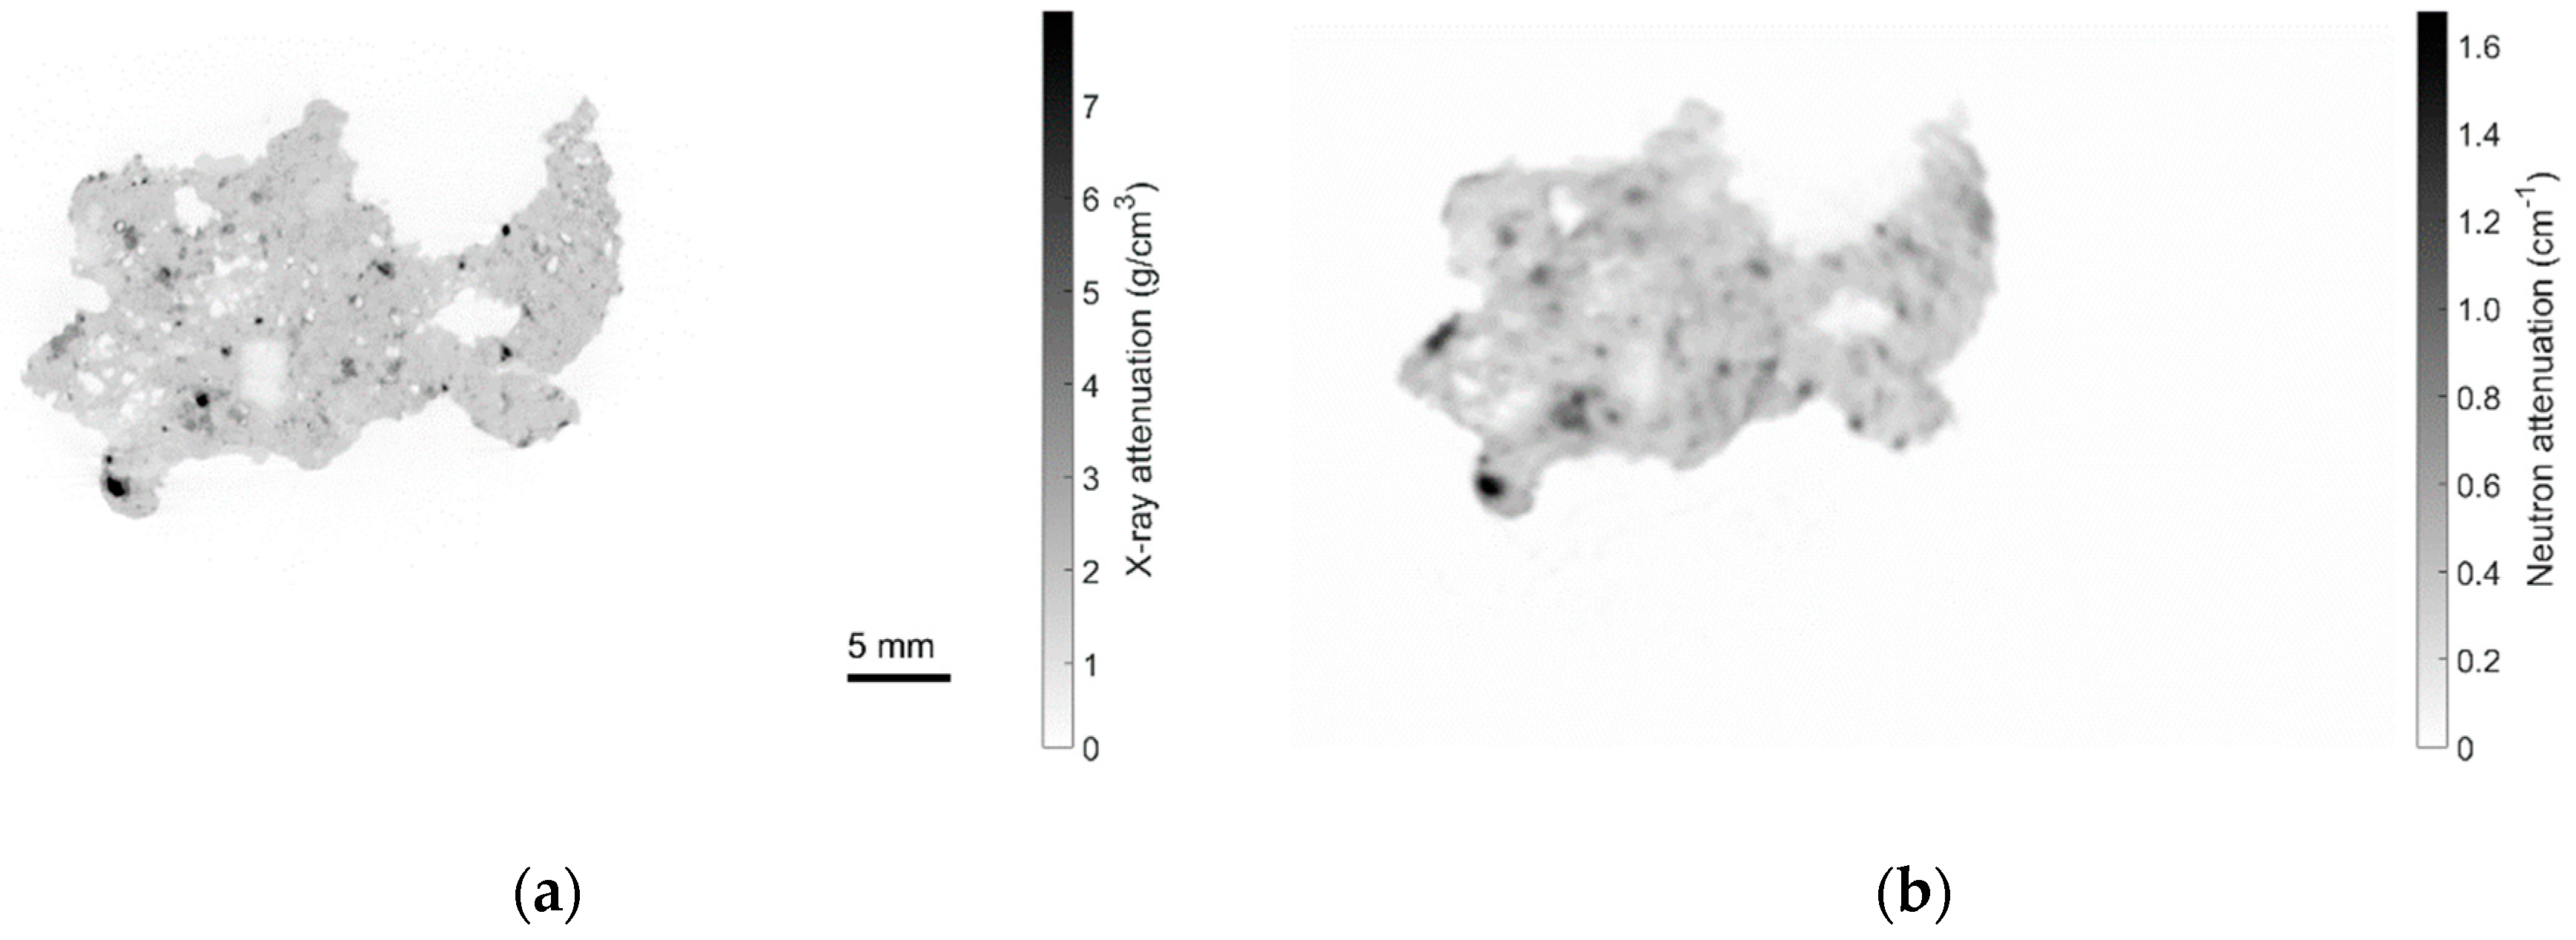
2.2. X-ray and Neutron Computed Tomography (CT)
2.3. Image Processing
2.3.1. Image Registration
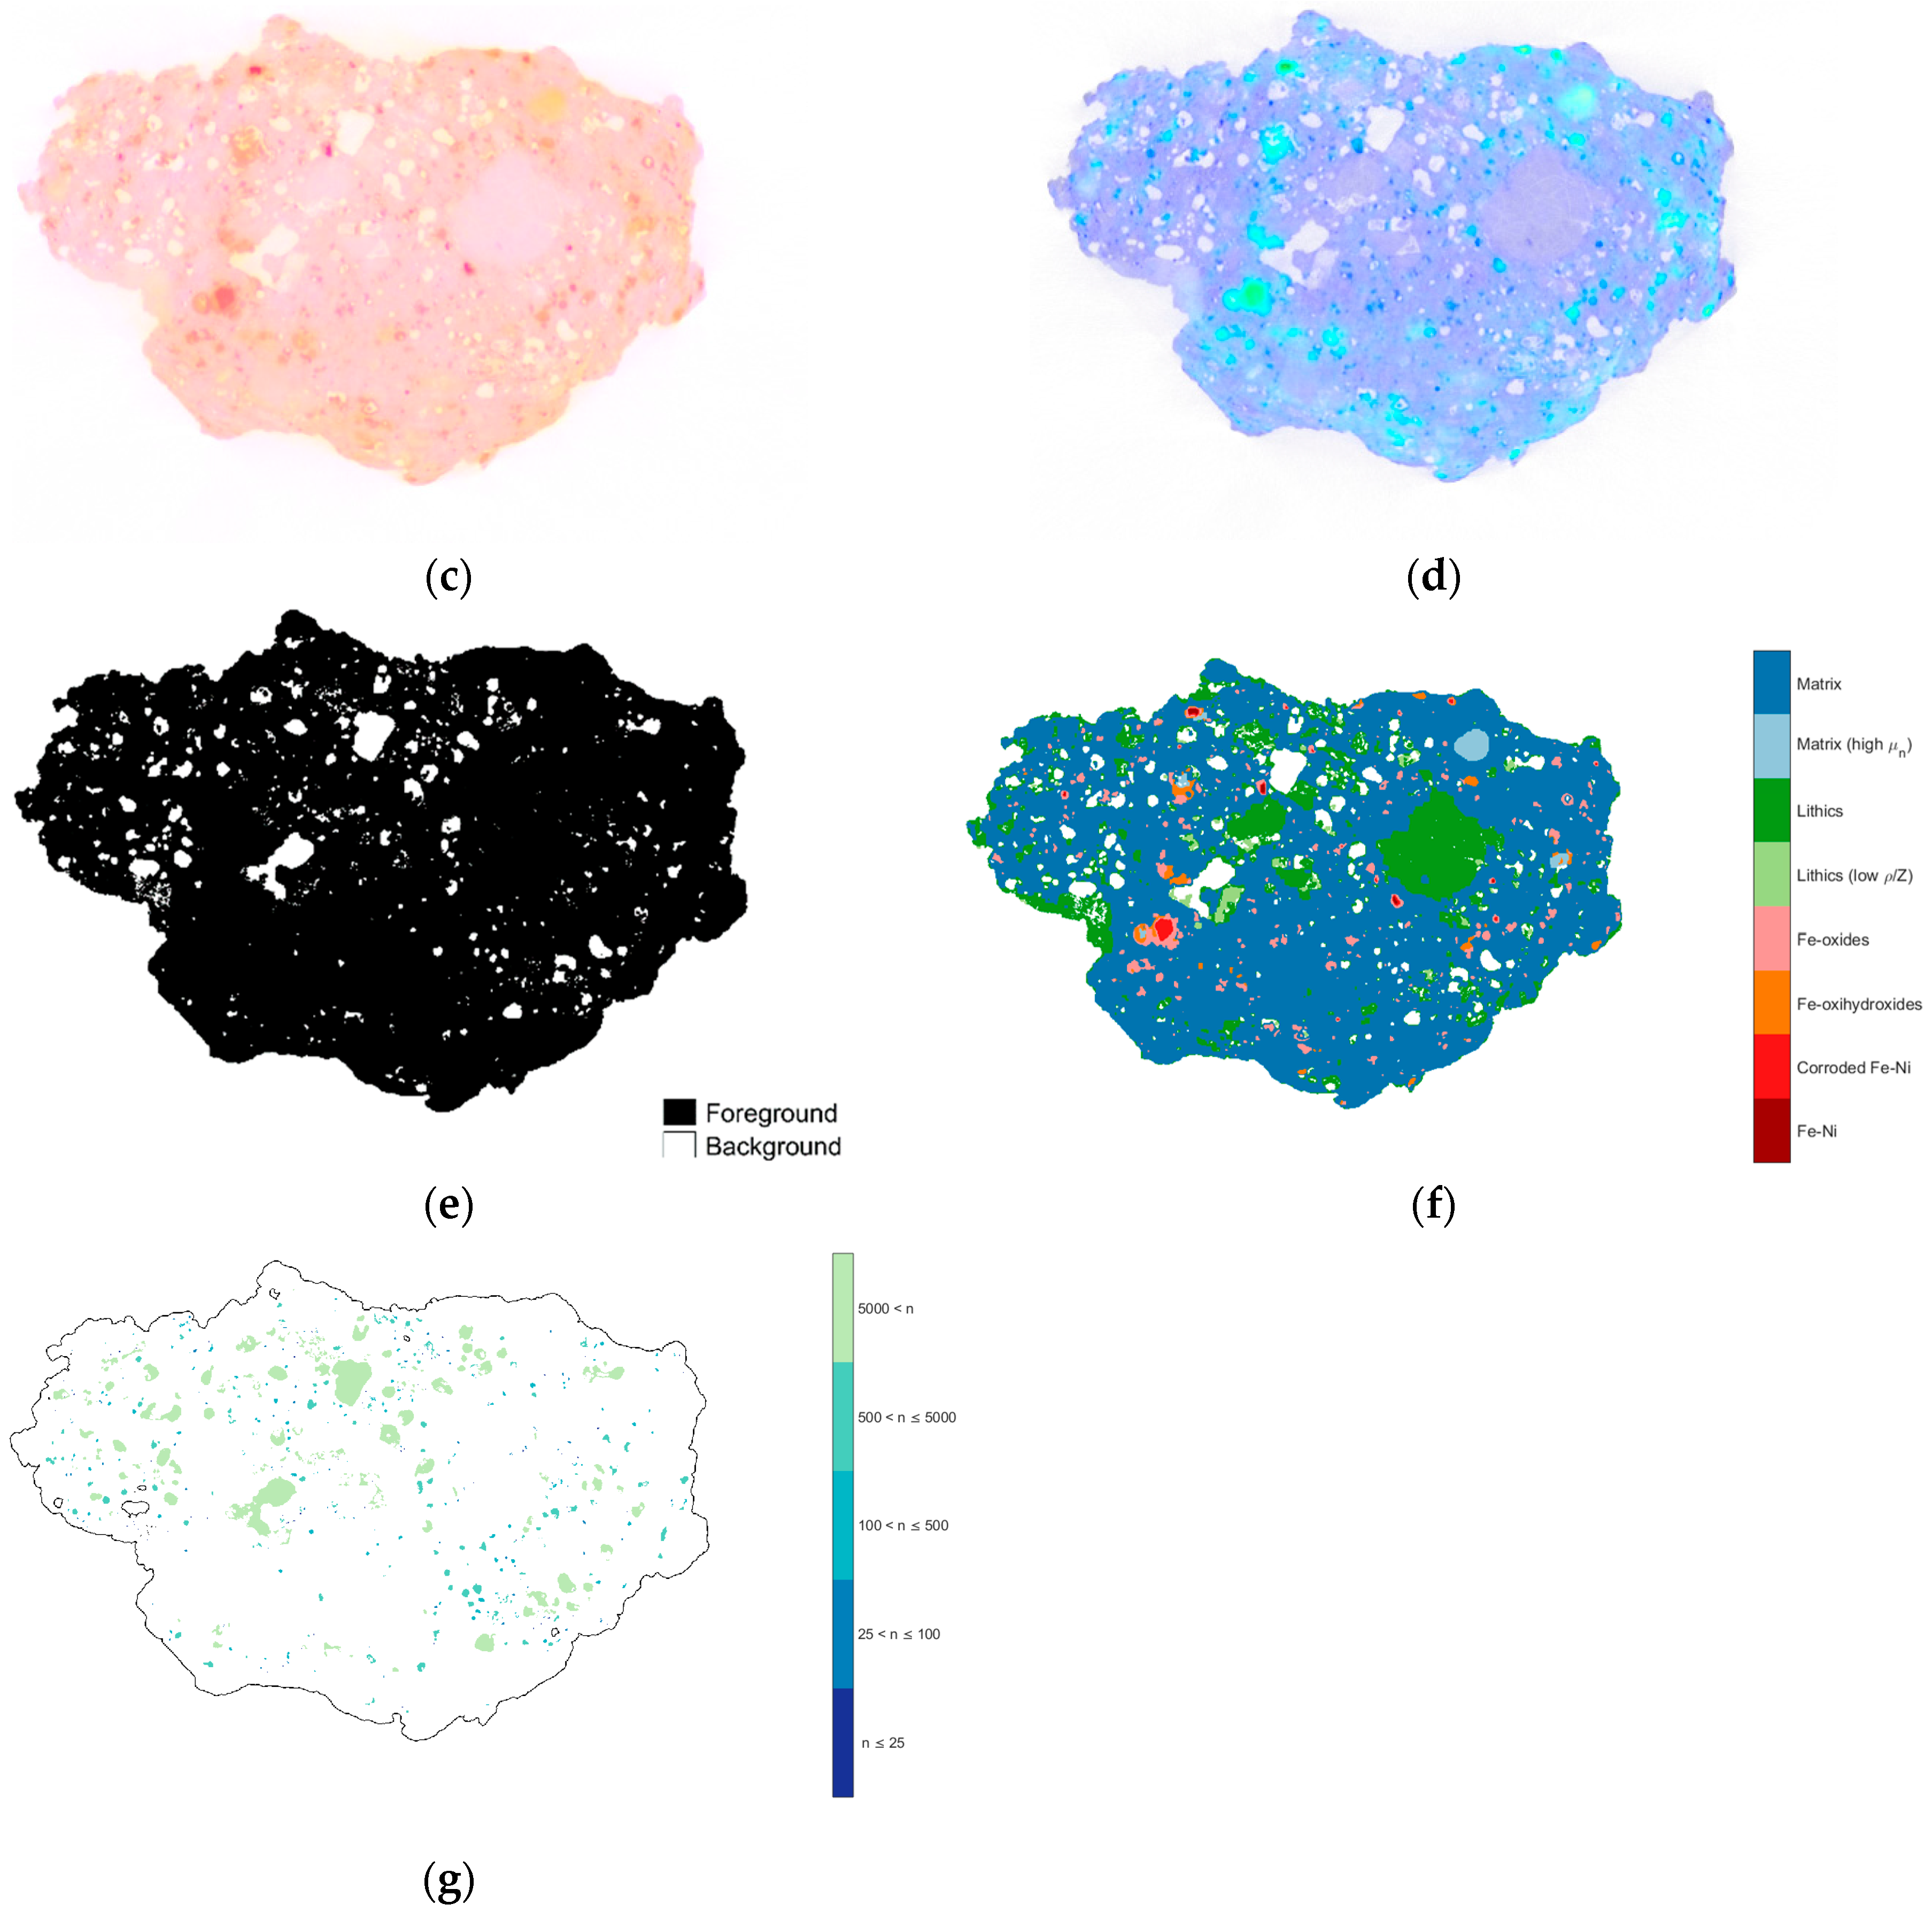
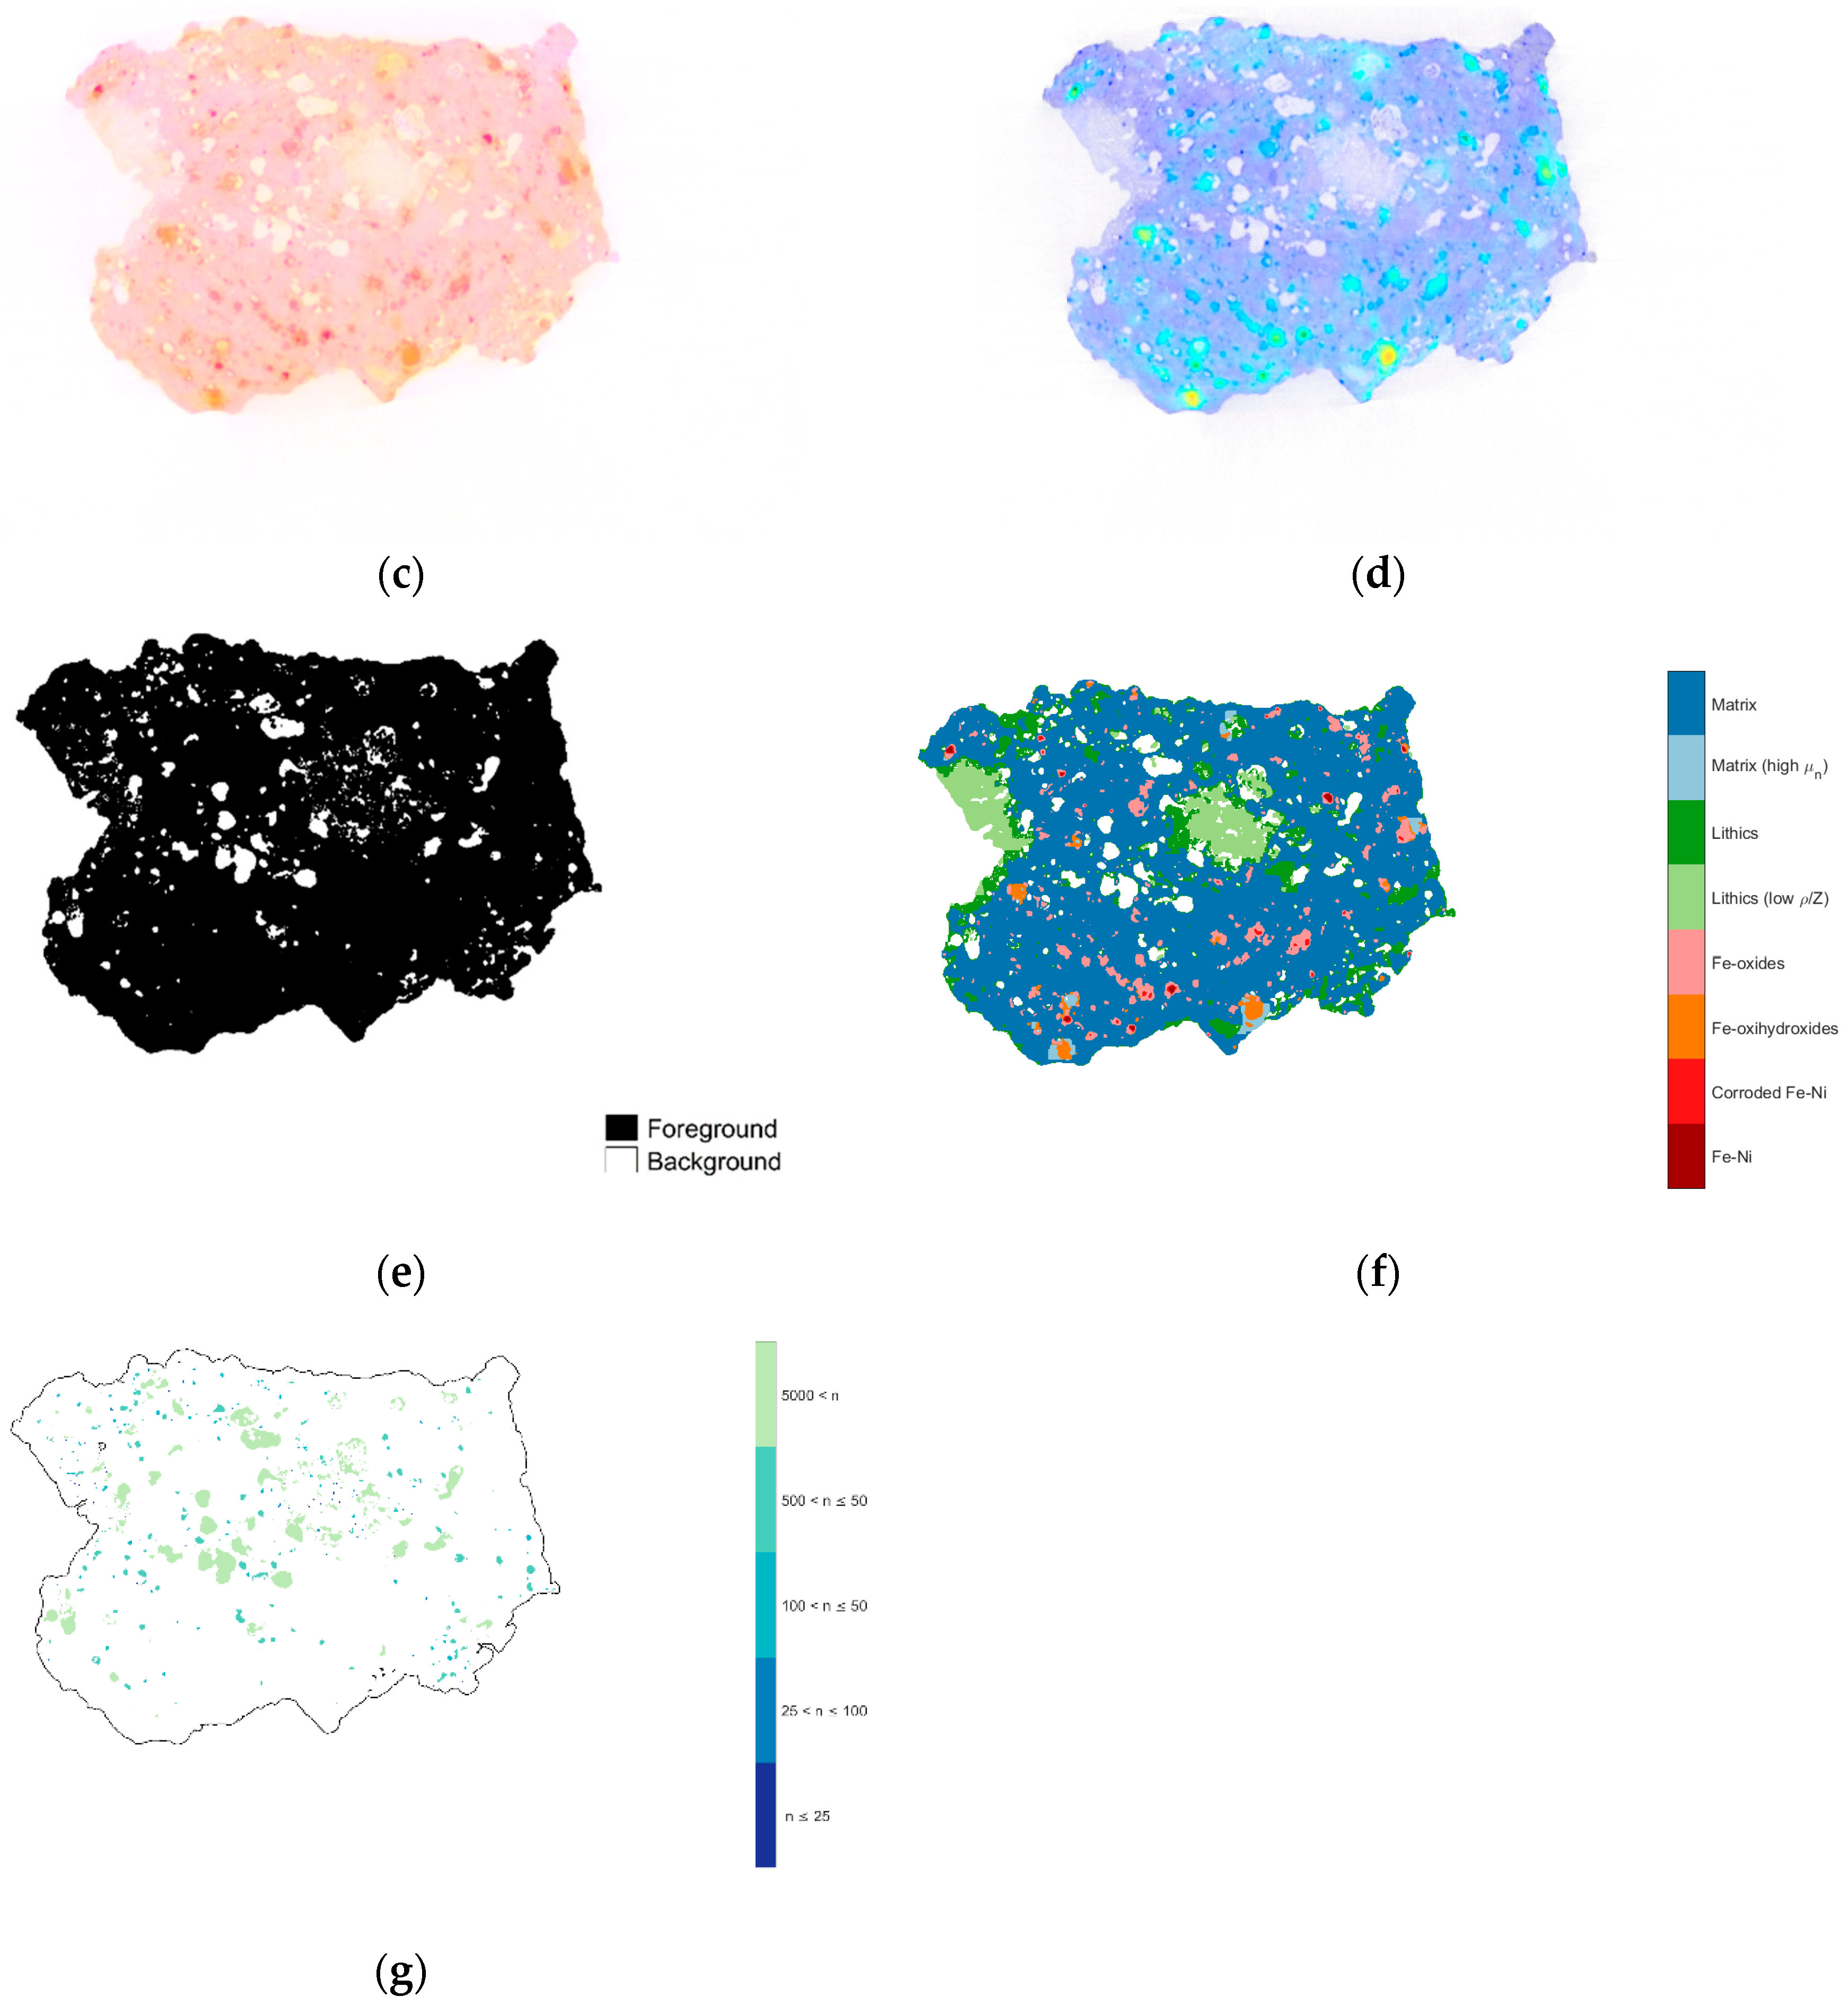
2.3.2. Materials Segmentation
2.3.3. Morphology
3. Results
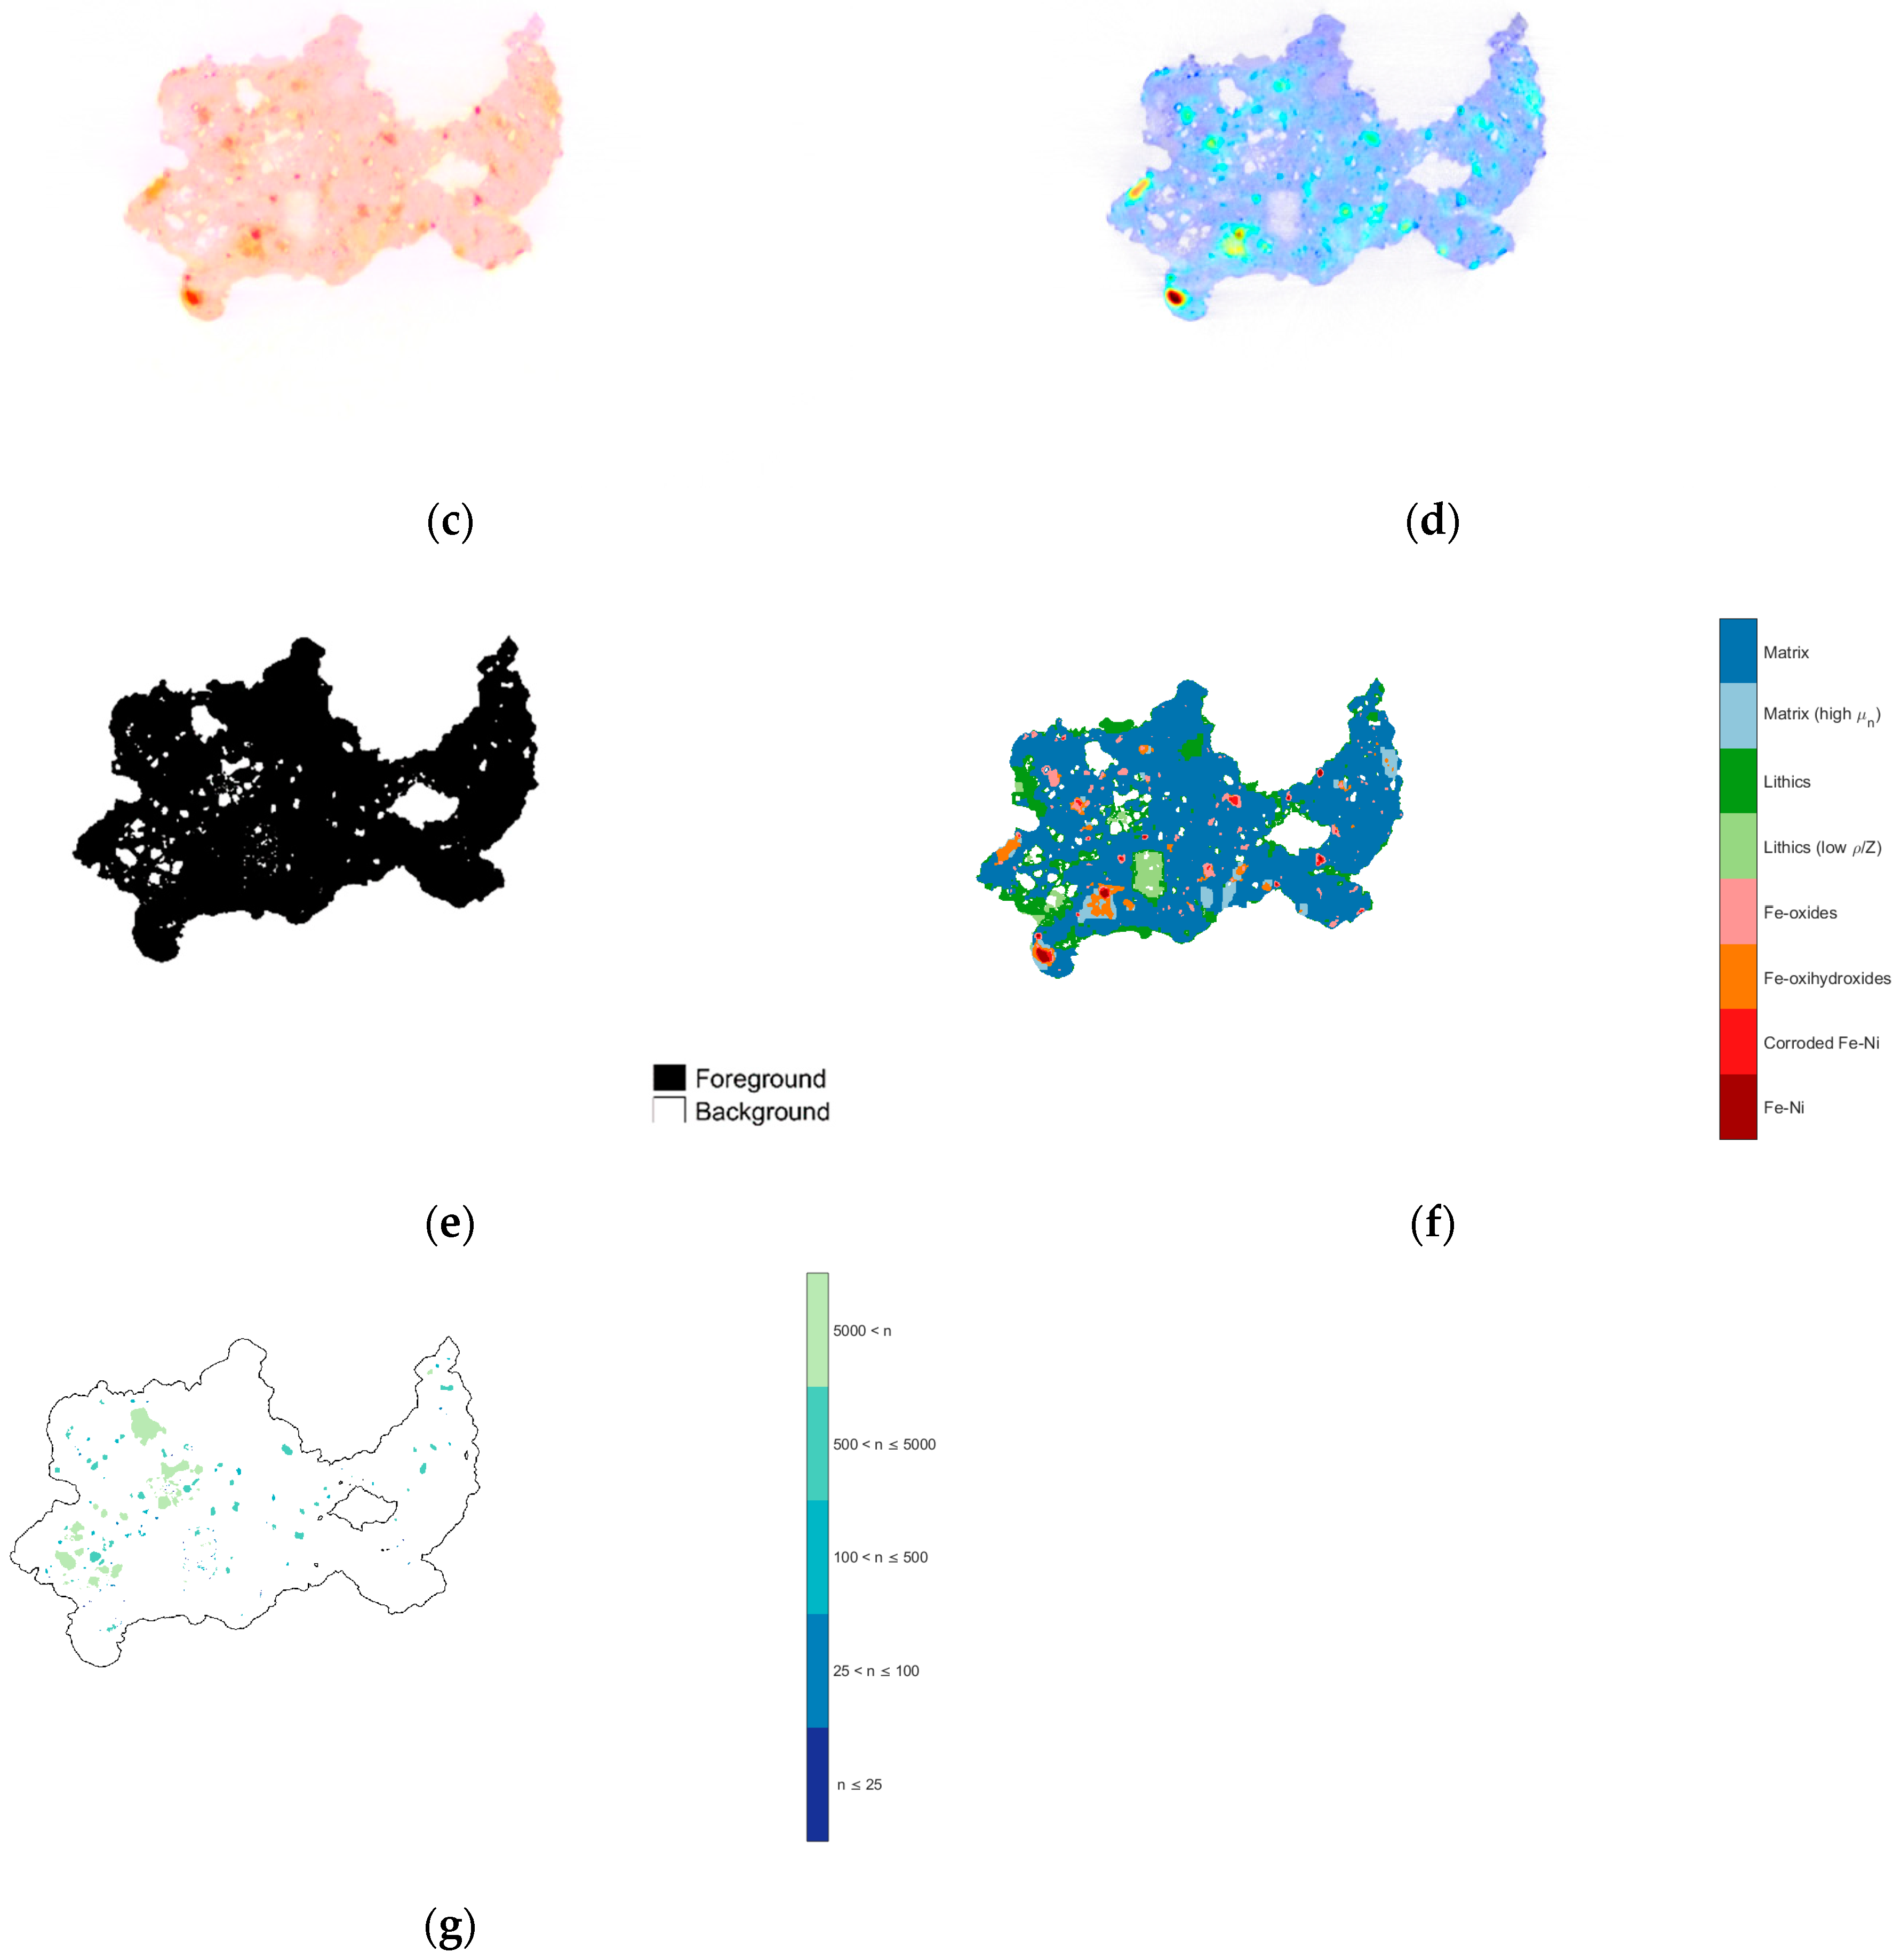
3.1. Visualisation
3.2. Materials Segmentation
3.3. Morphology
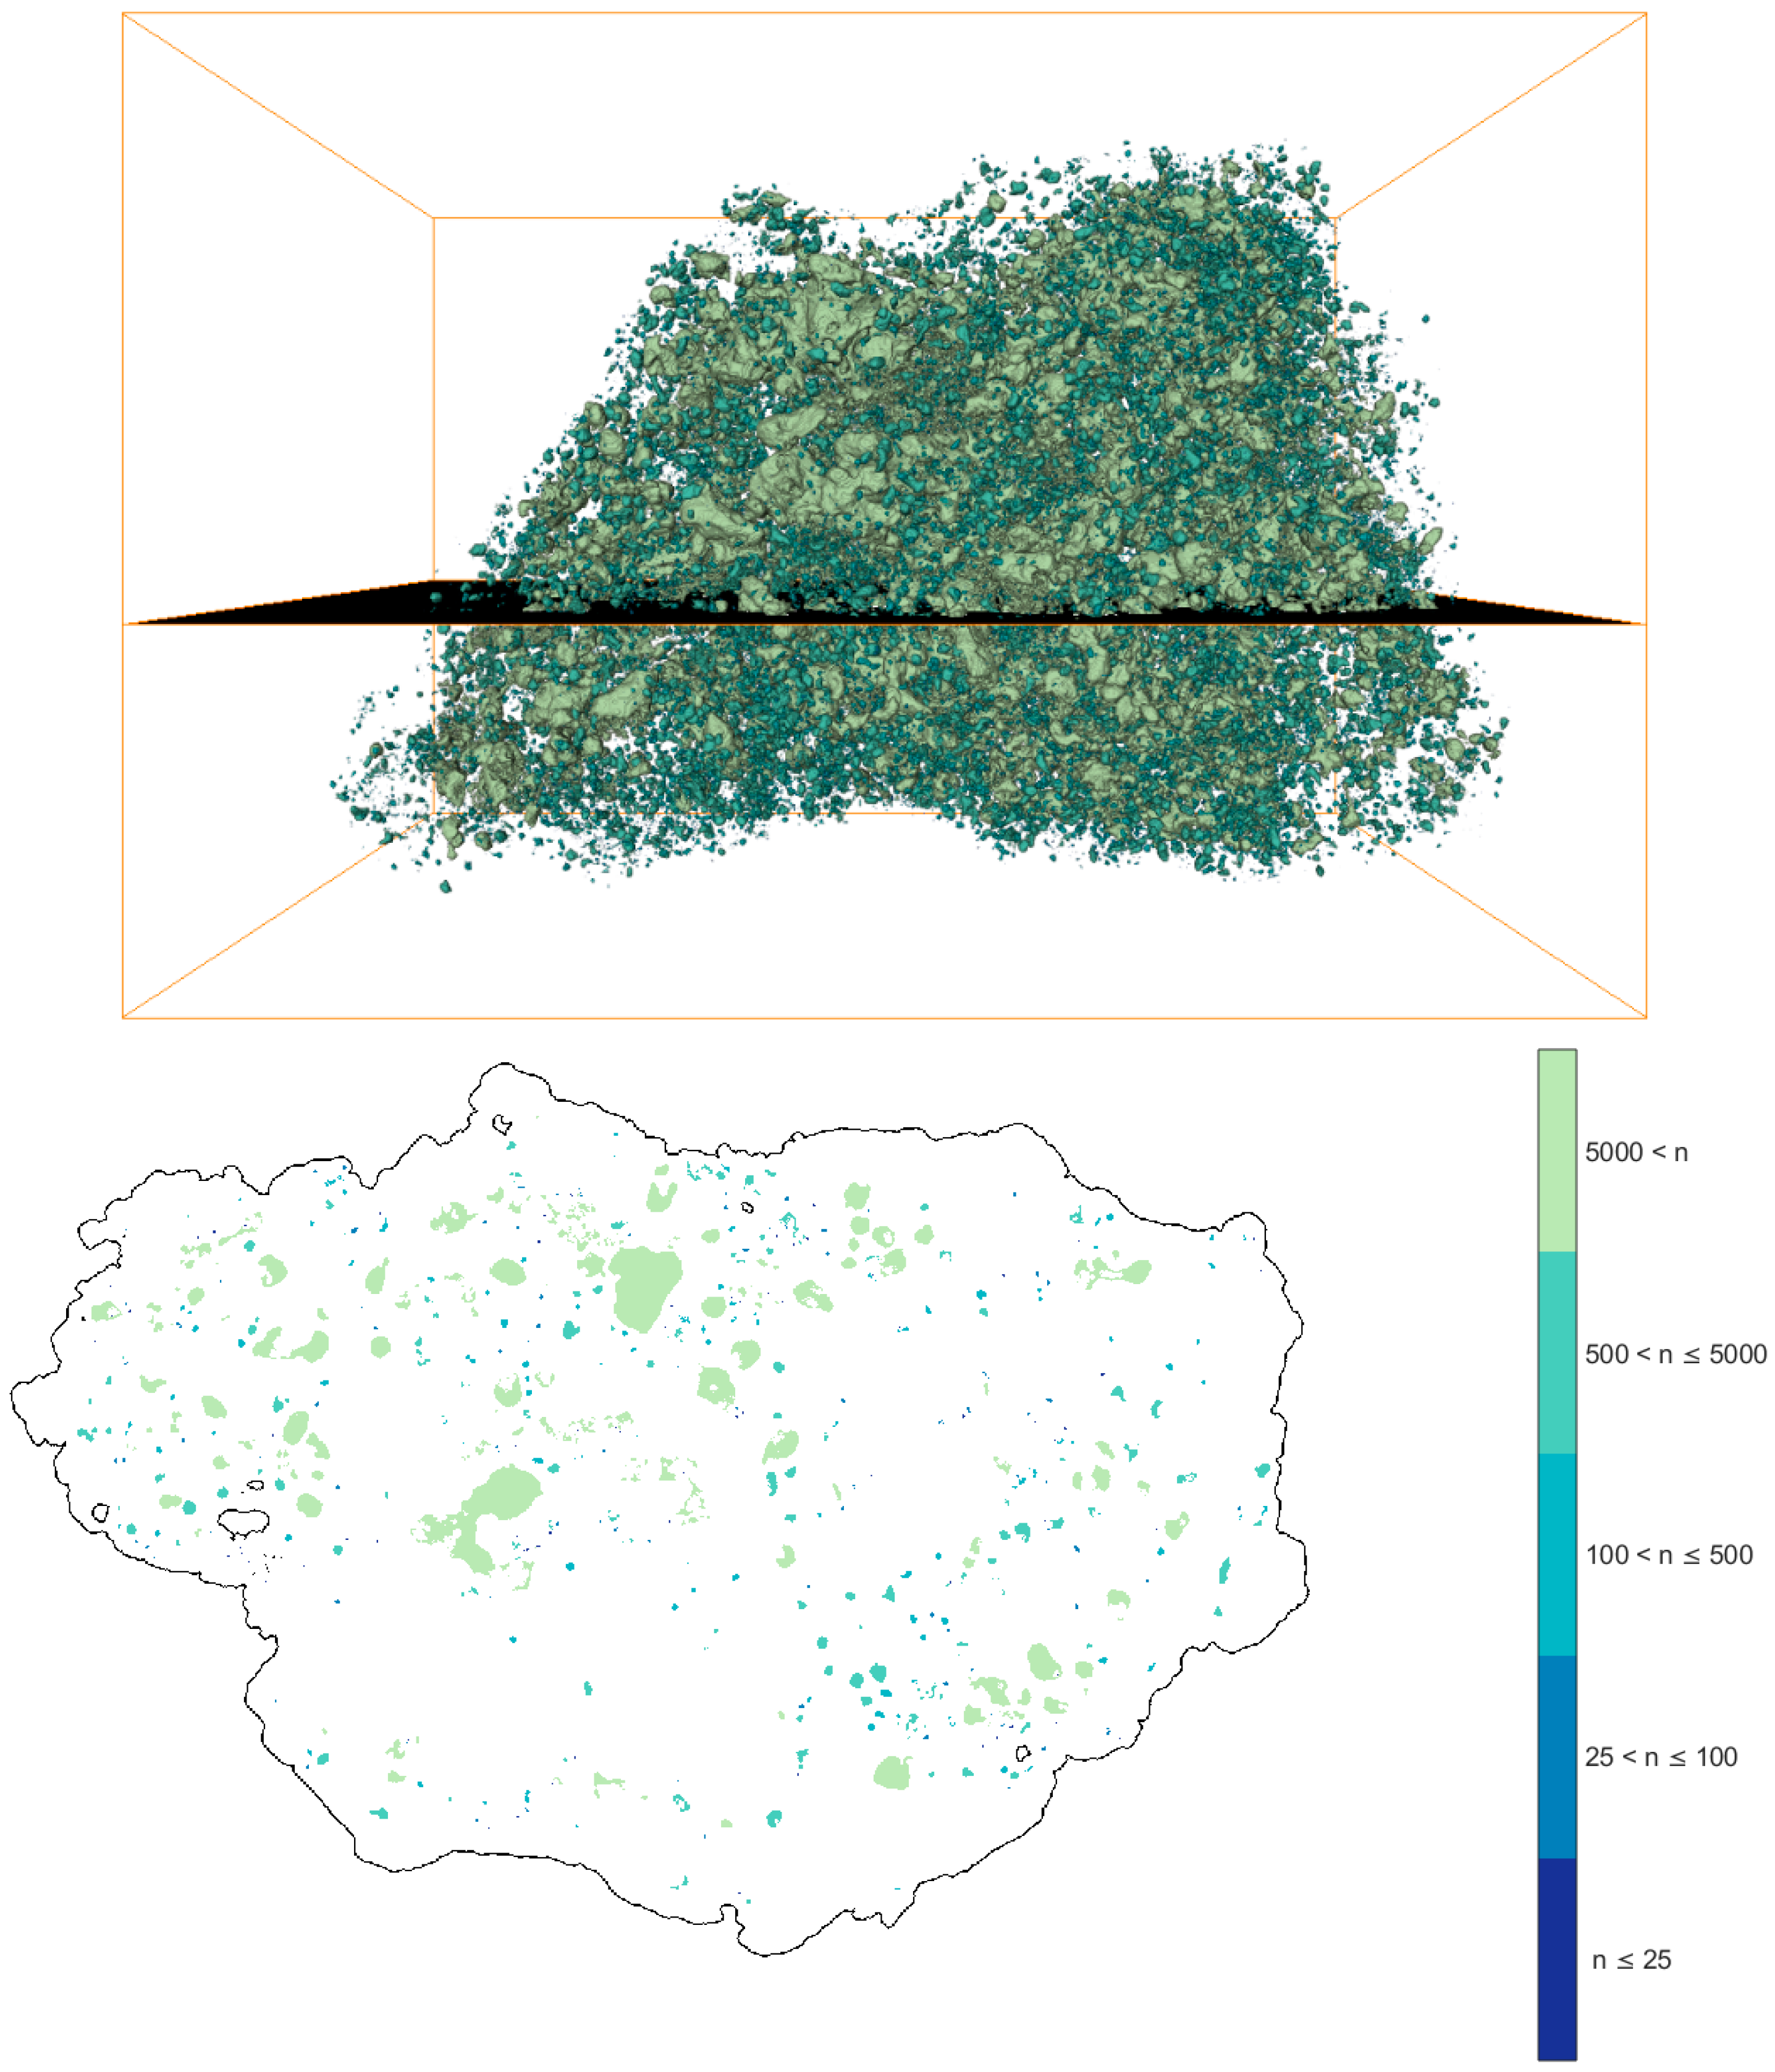
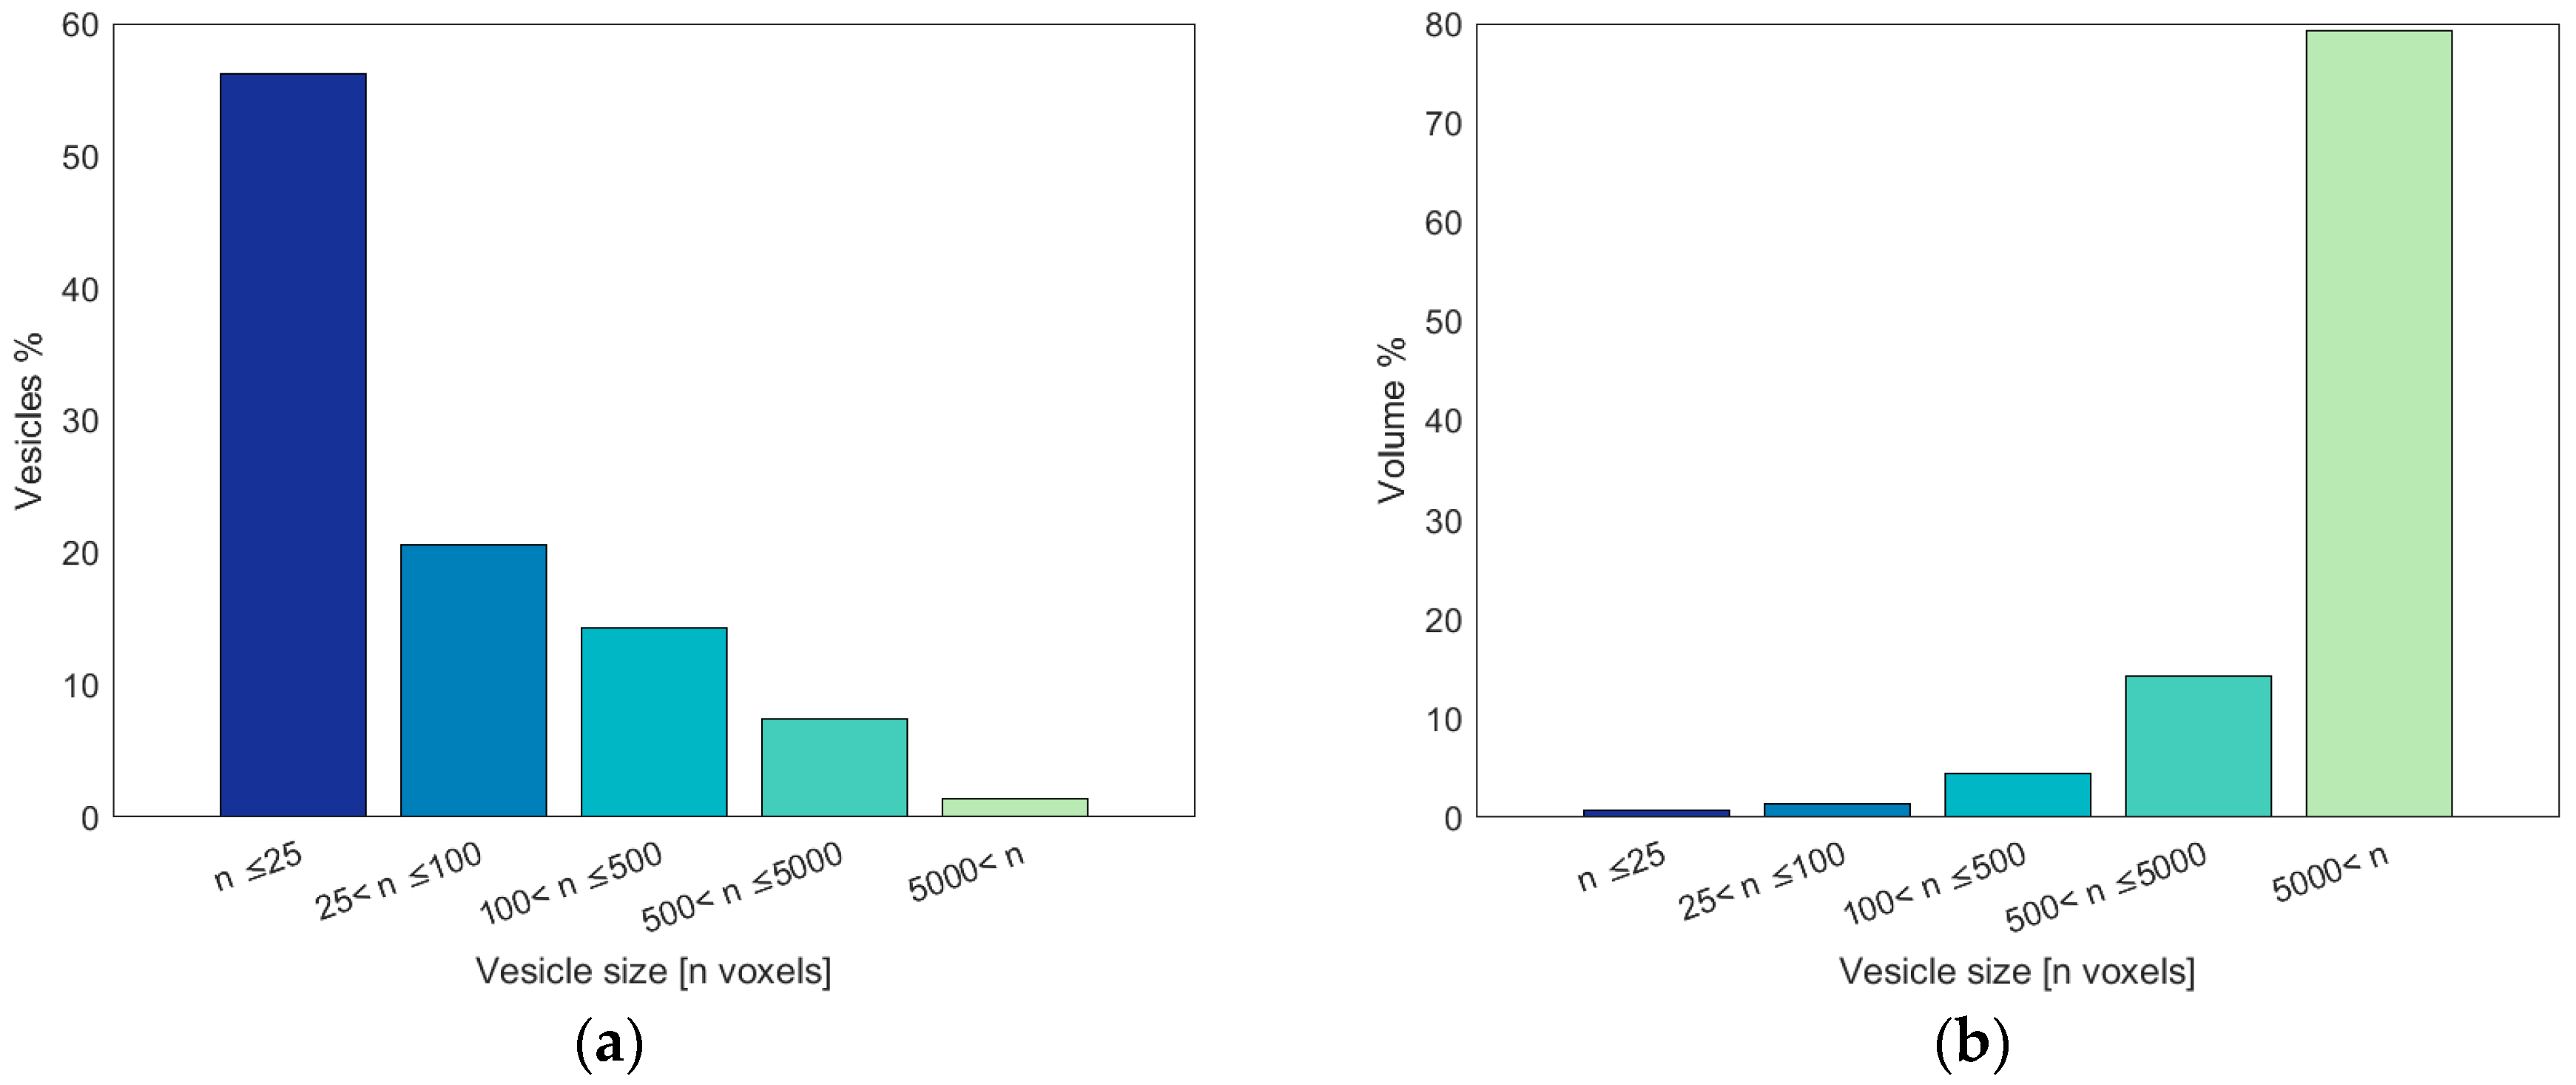
3.3.1. Vesicles Analysis and Quantification
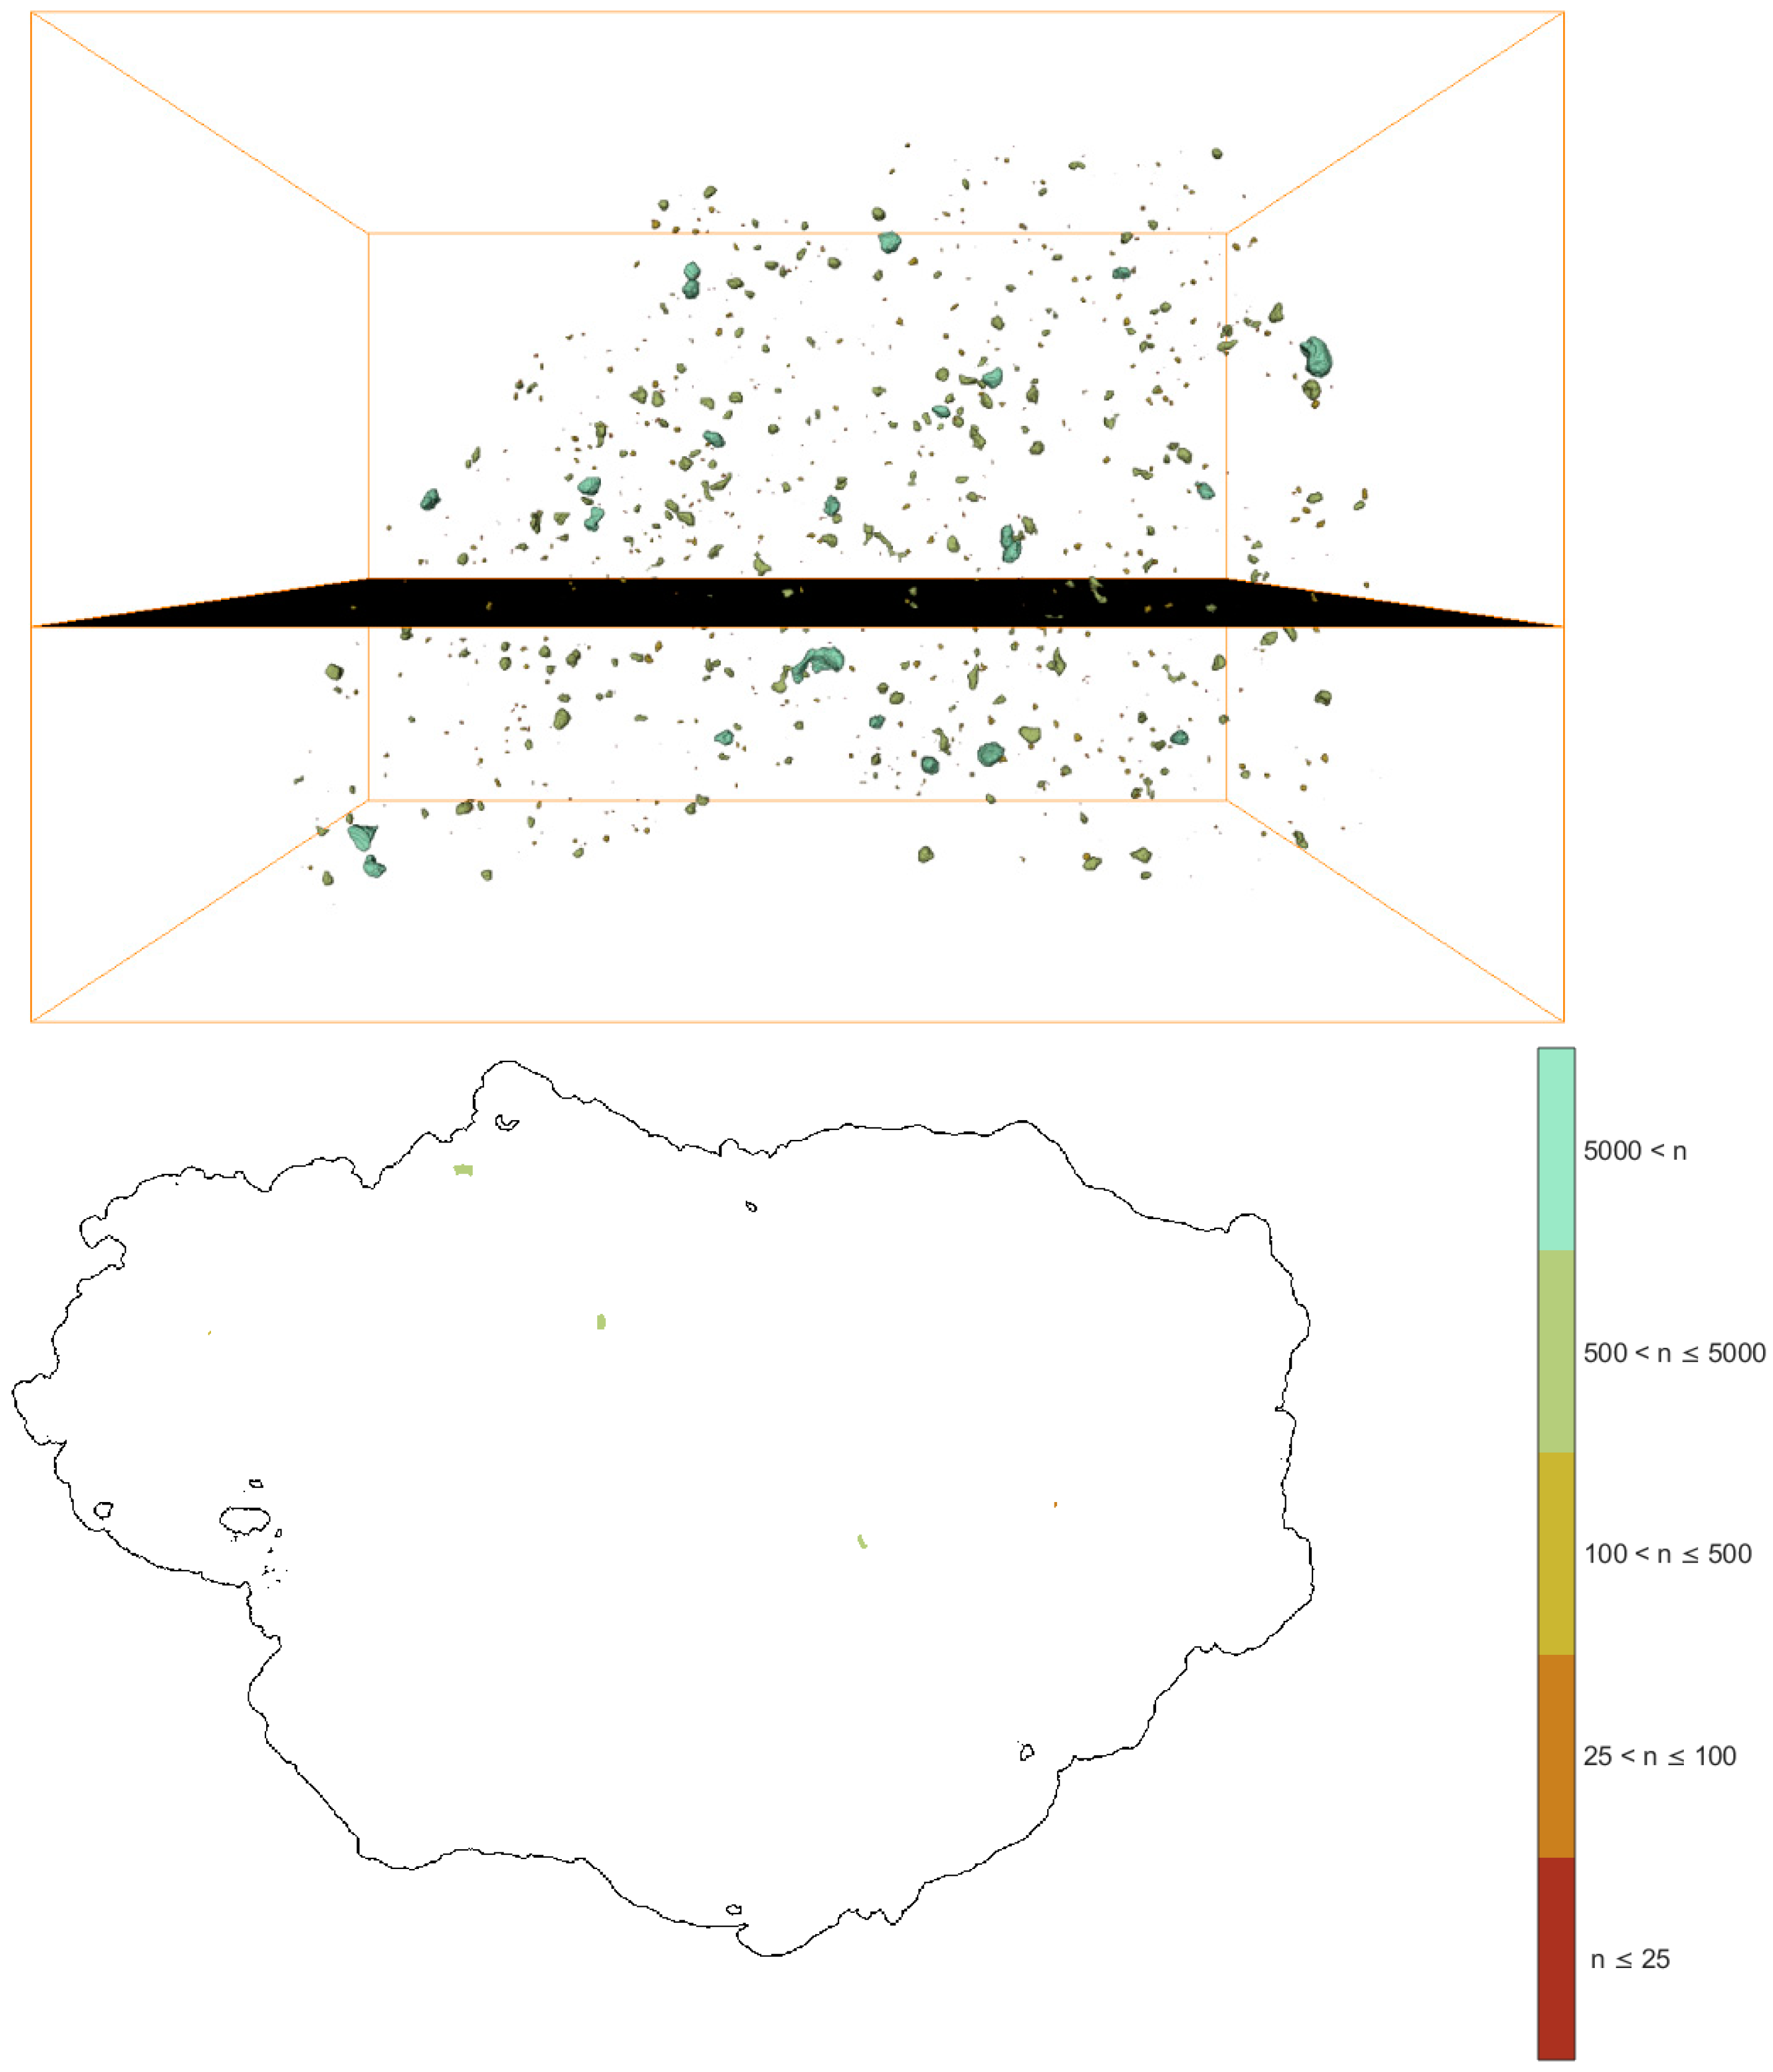
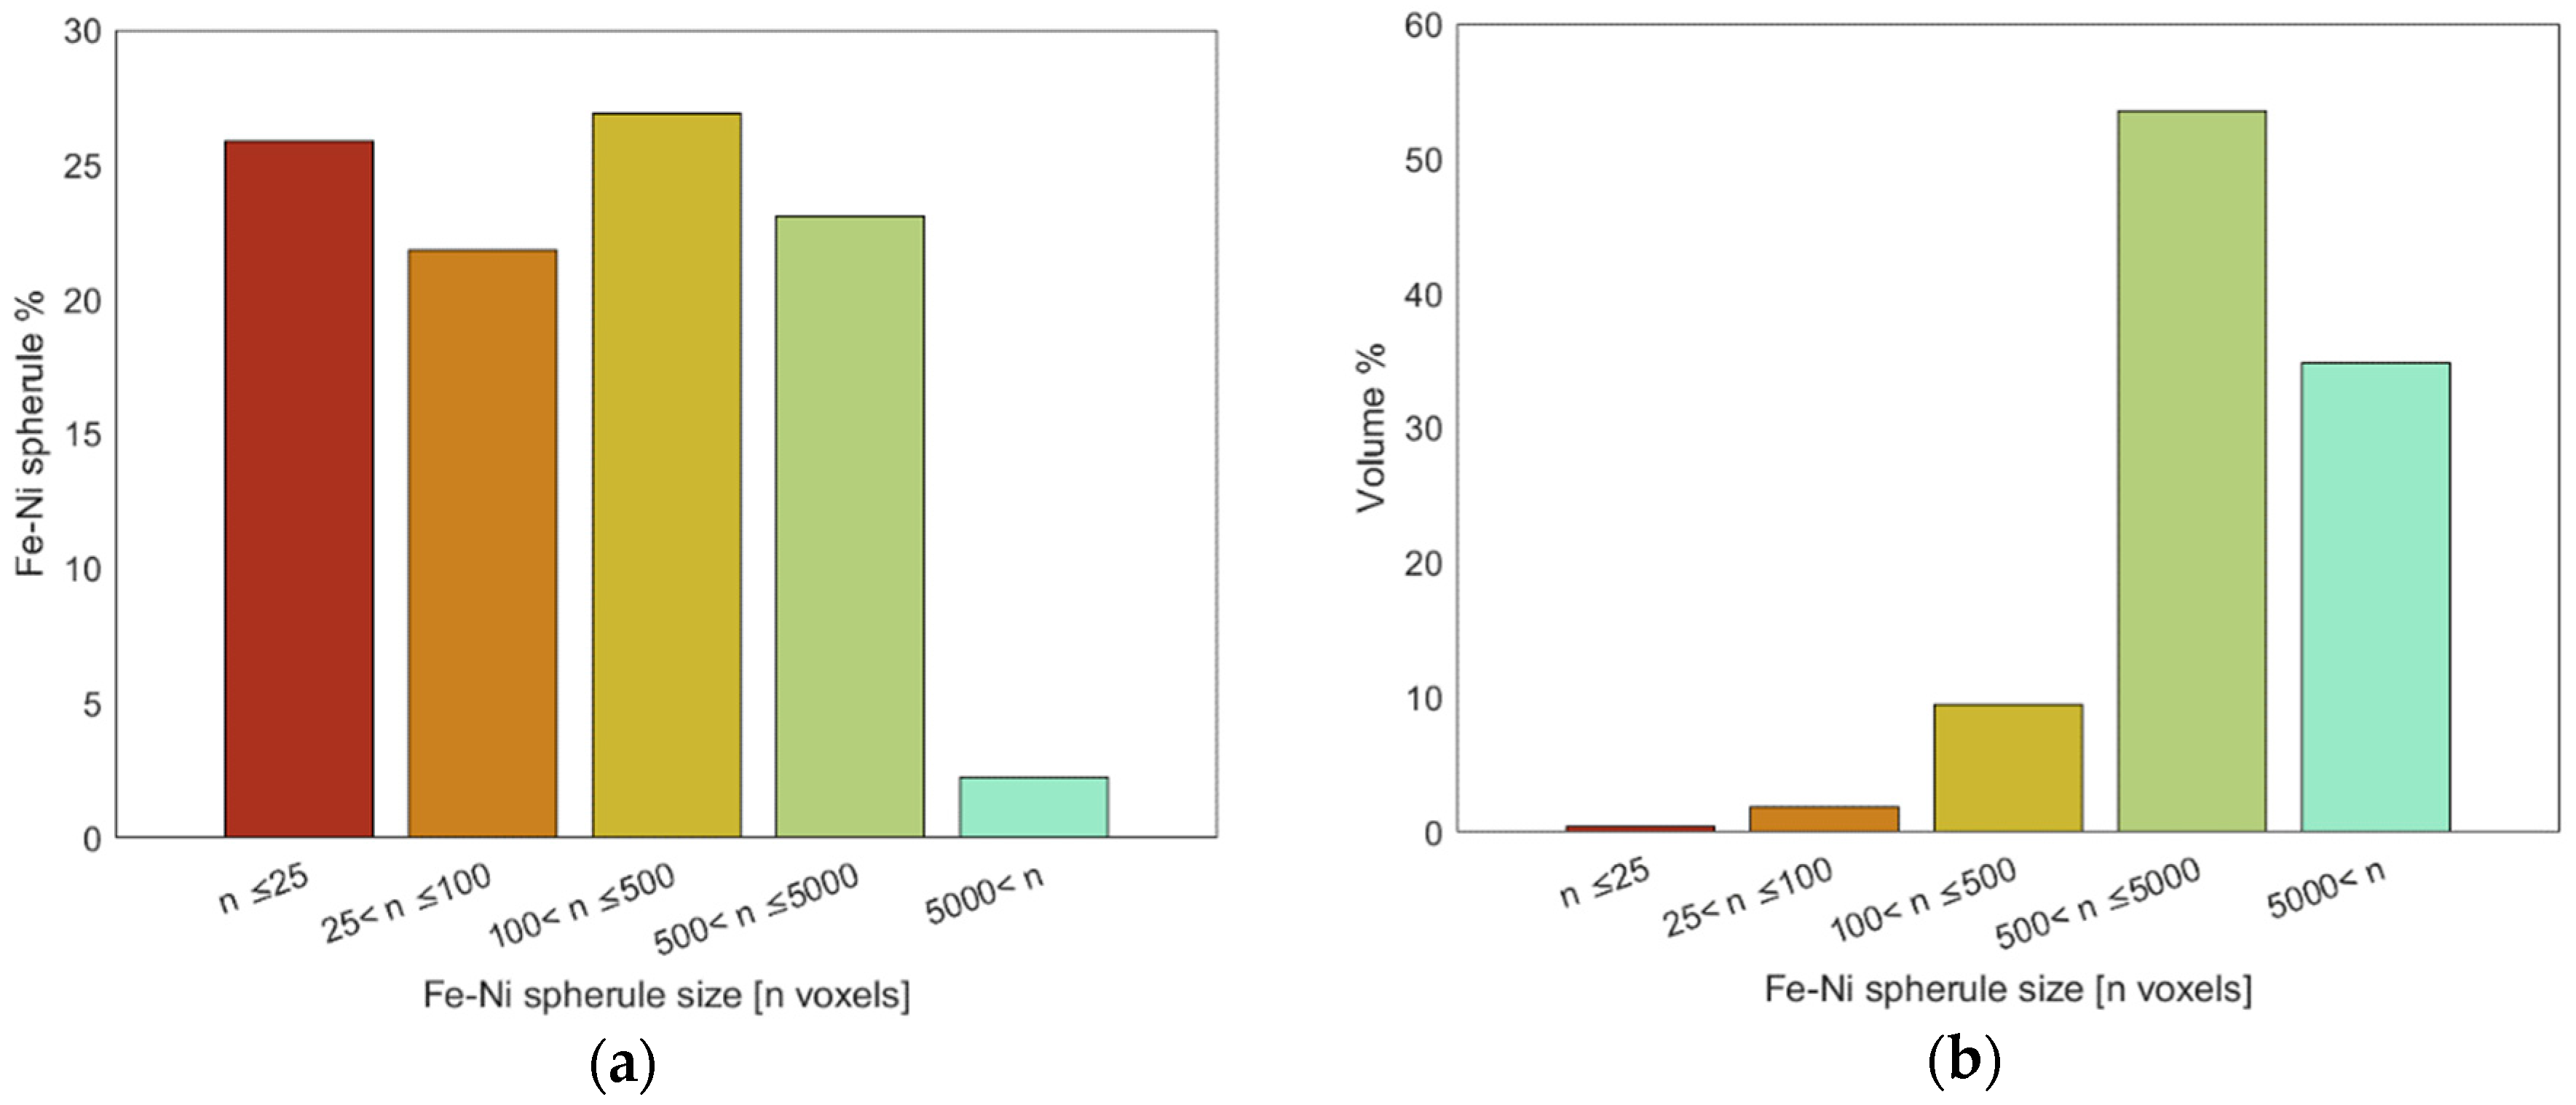
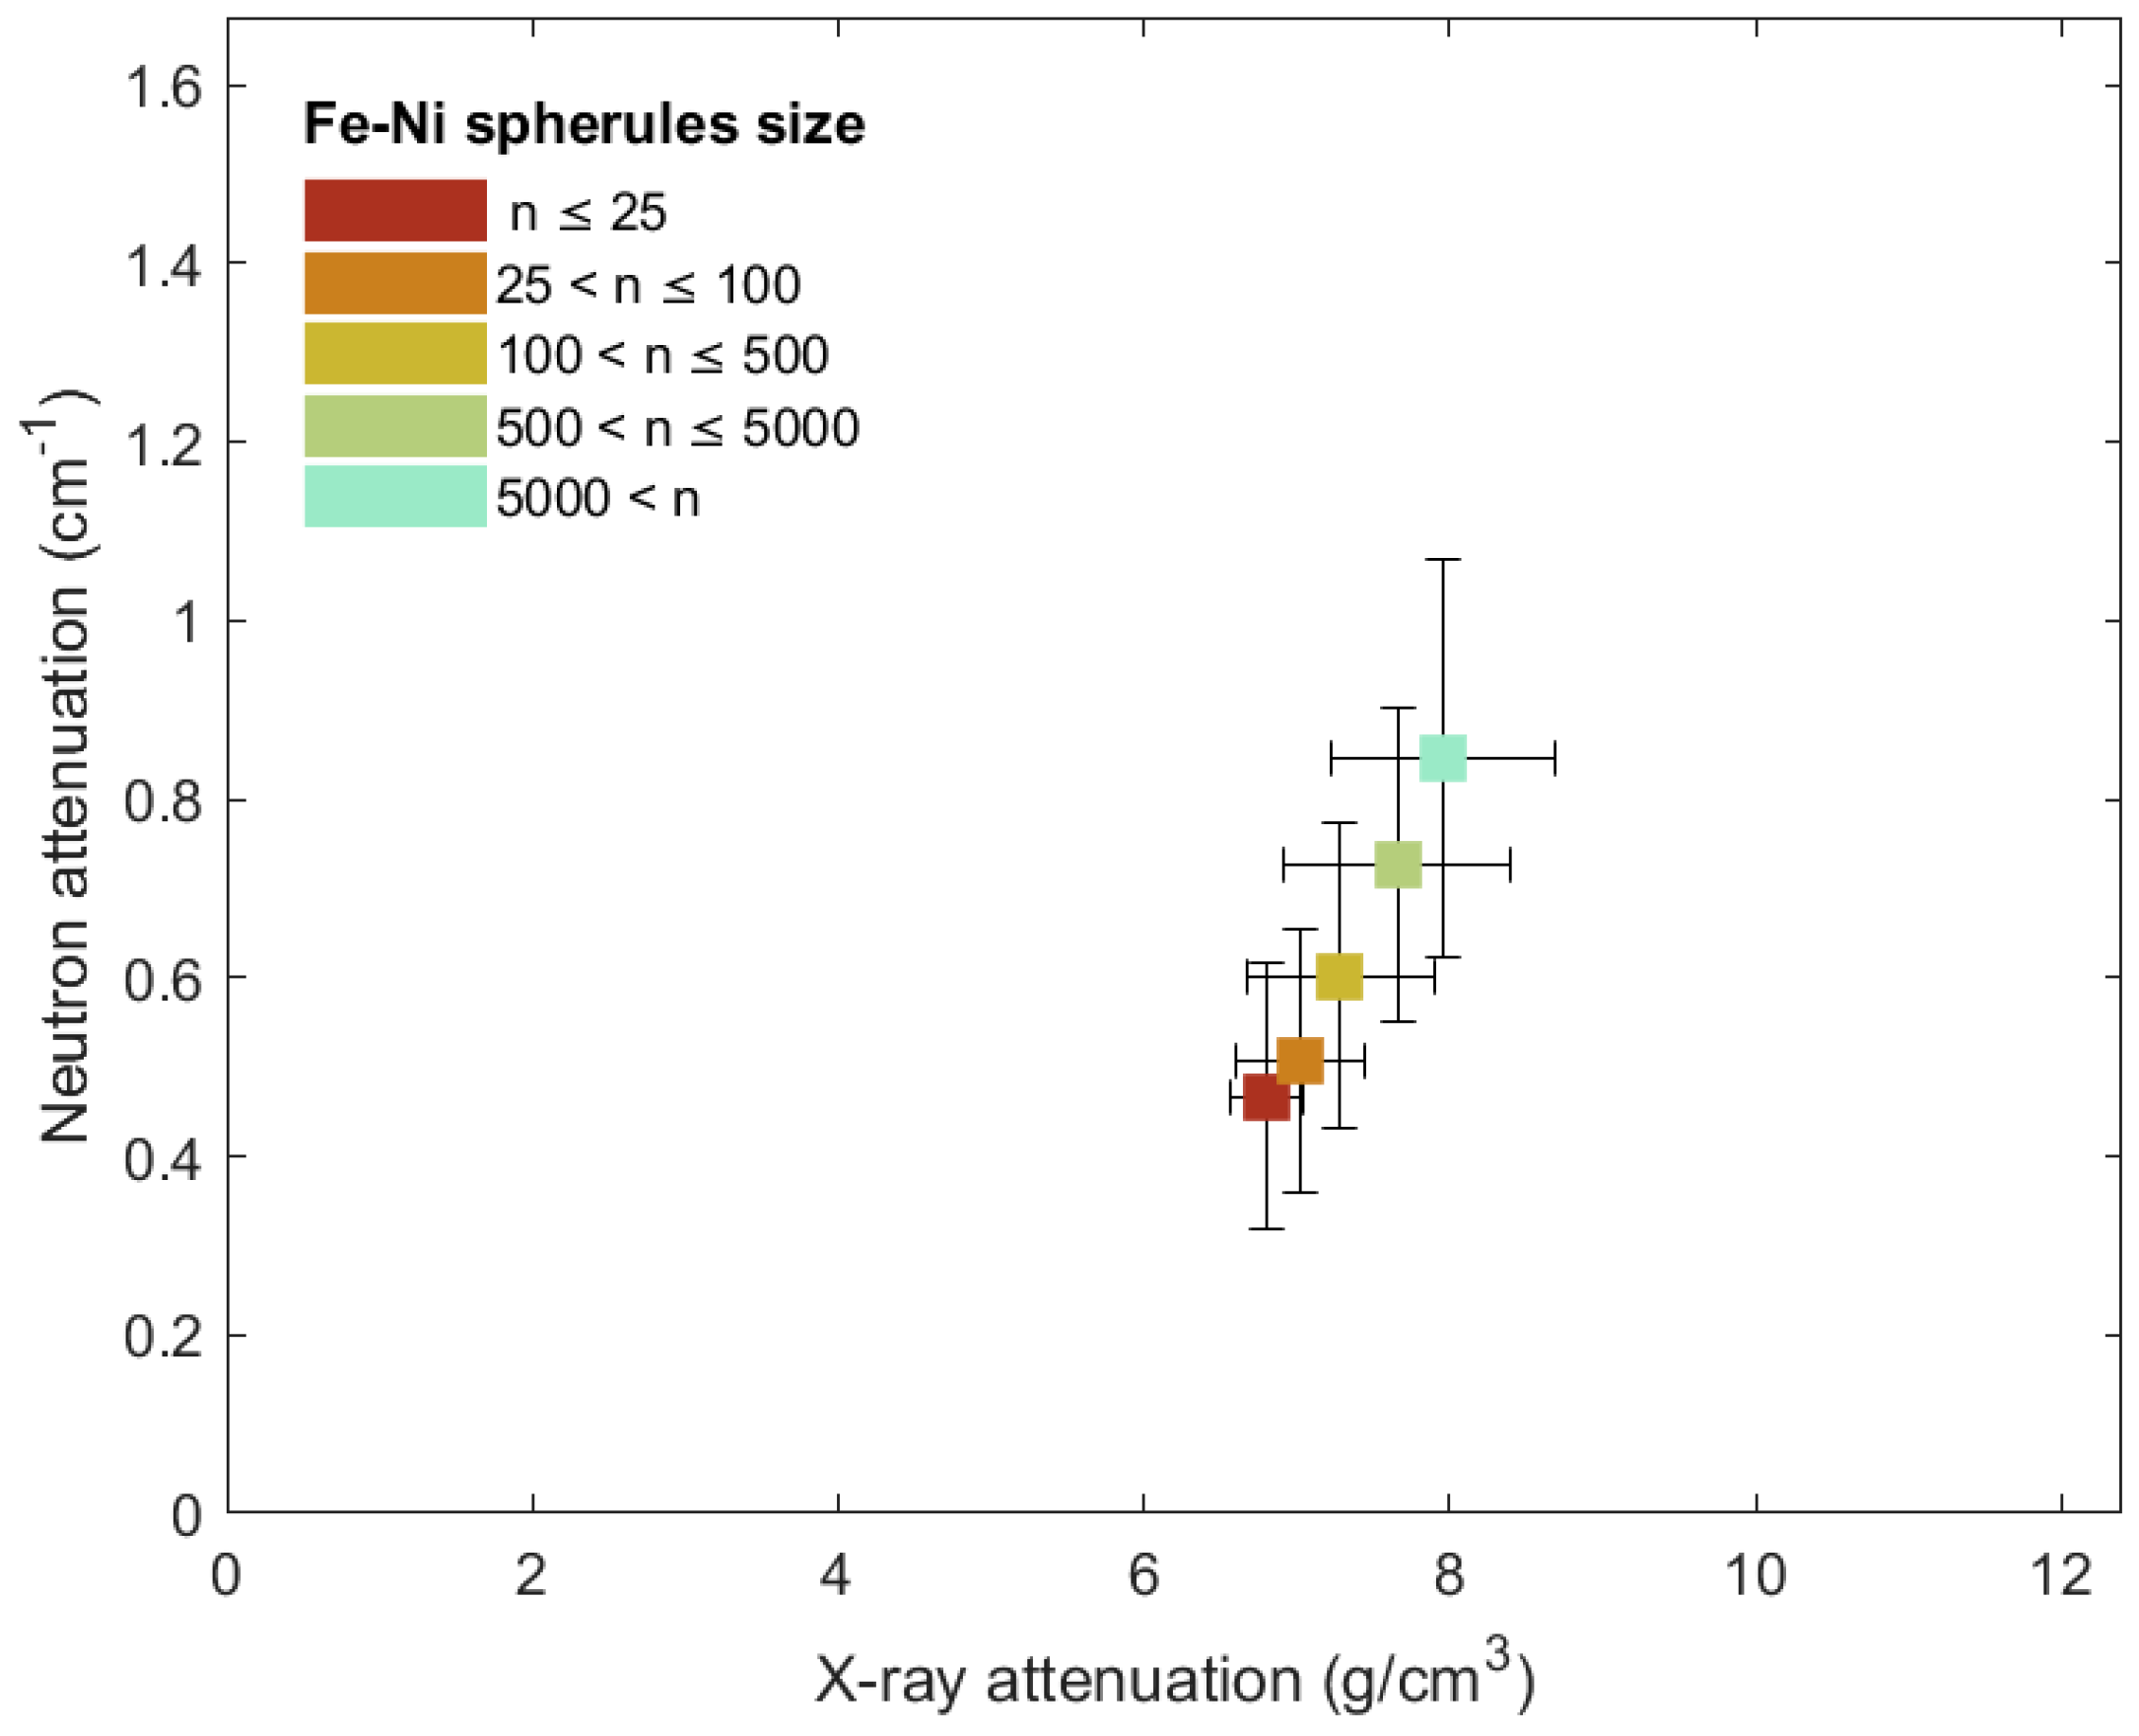
3.3.2. Spherules Analysis and Quantification
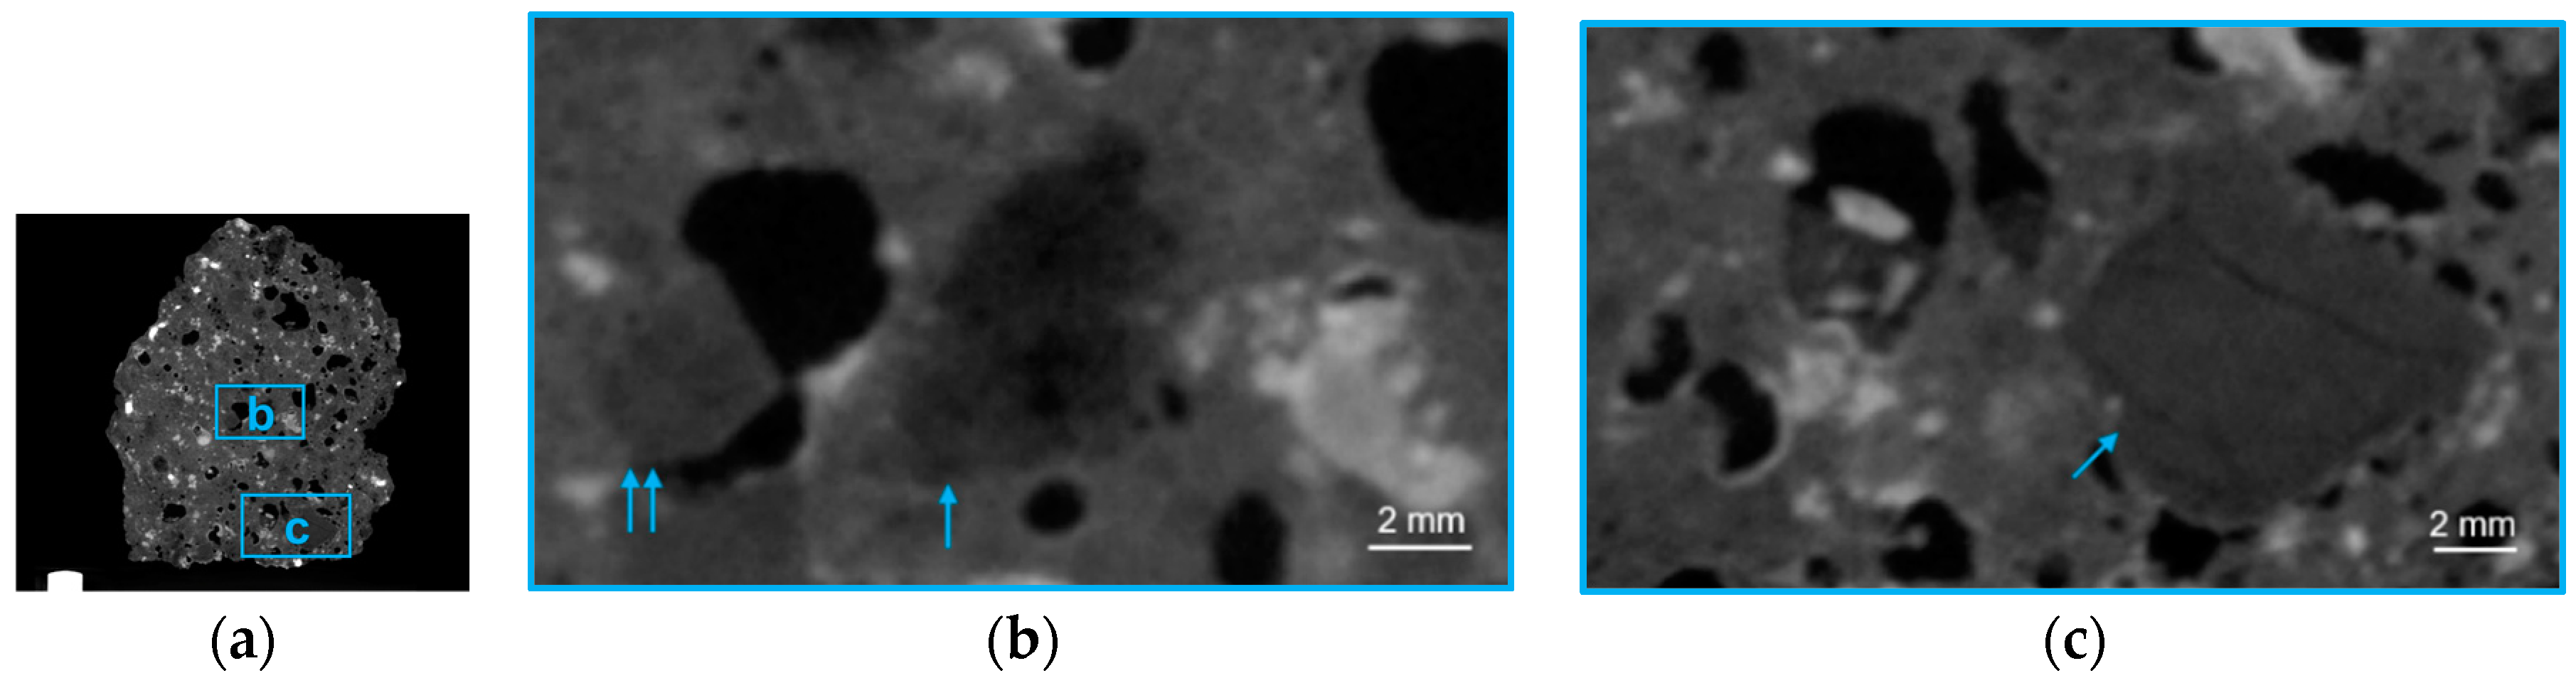
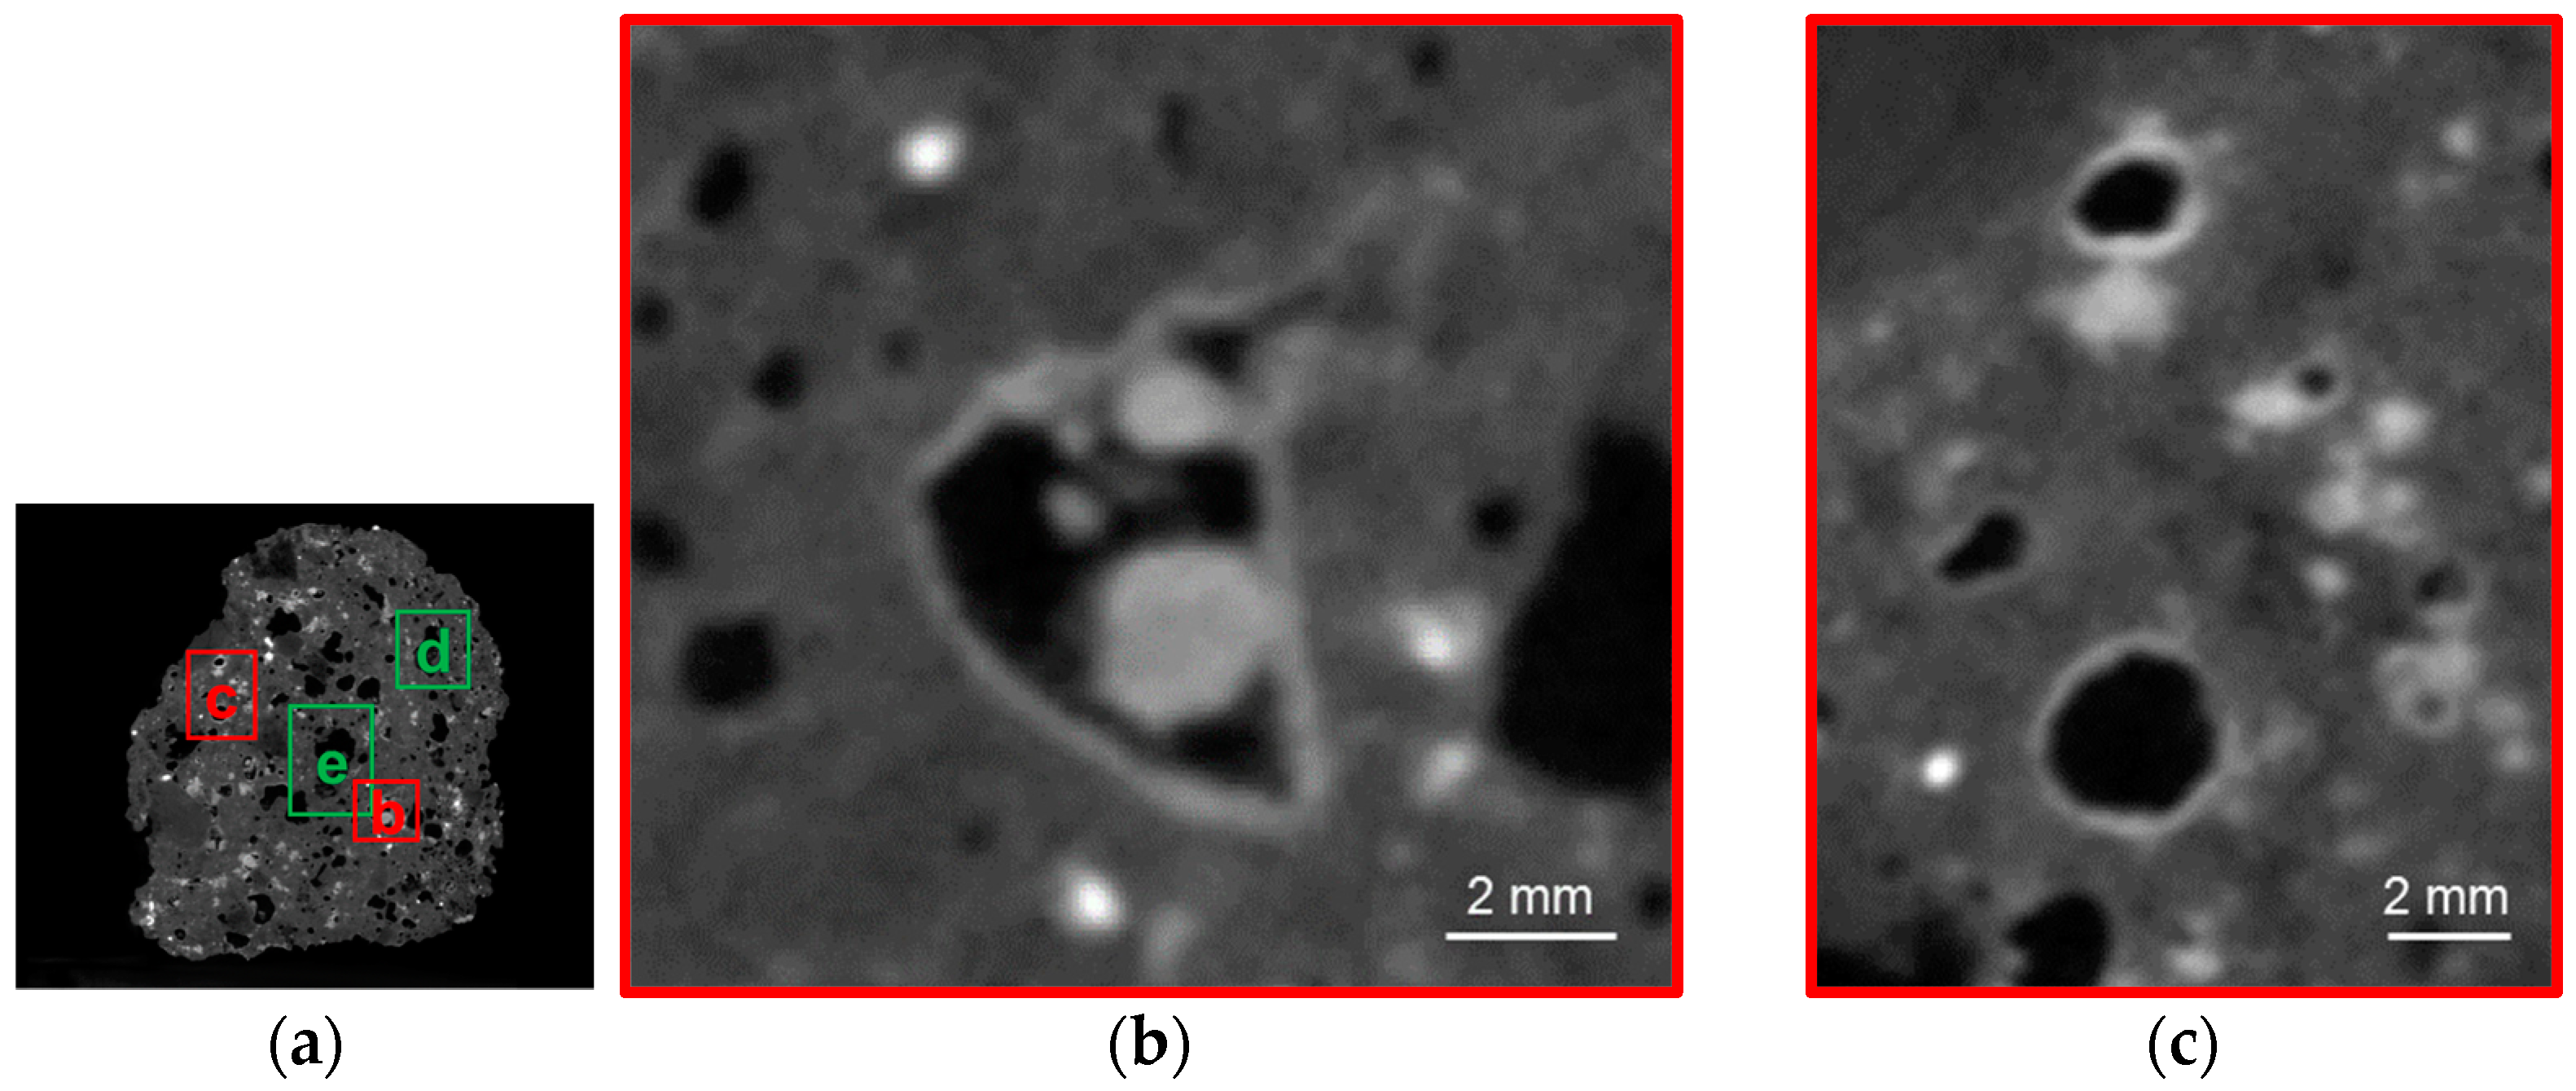
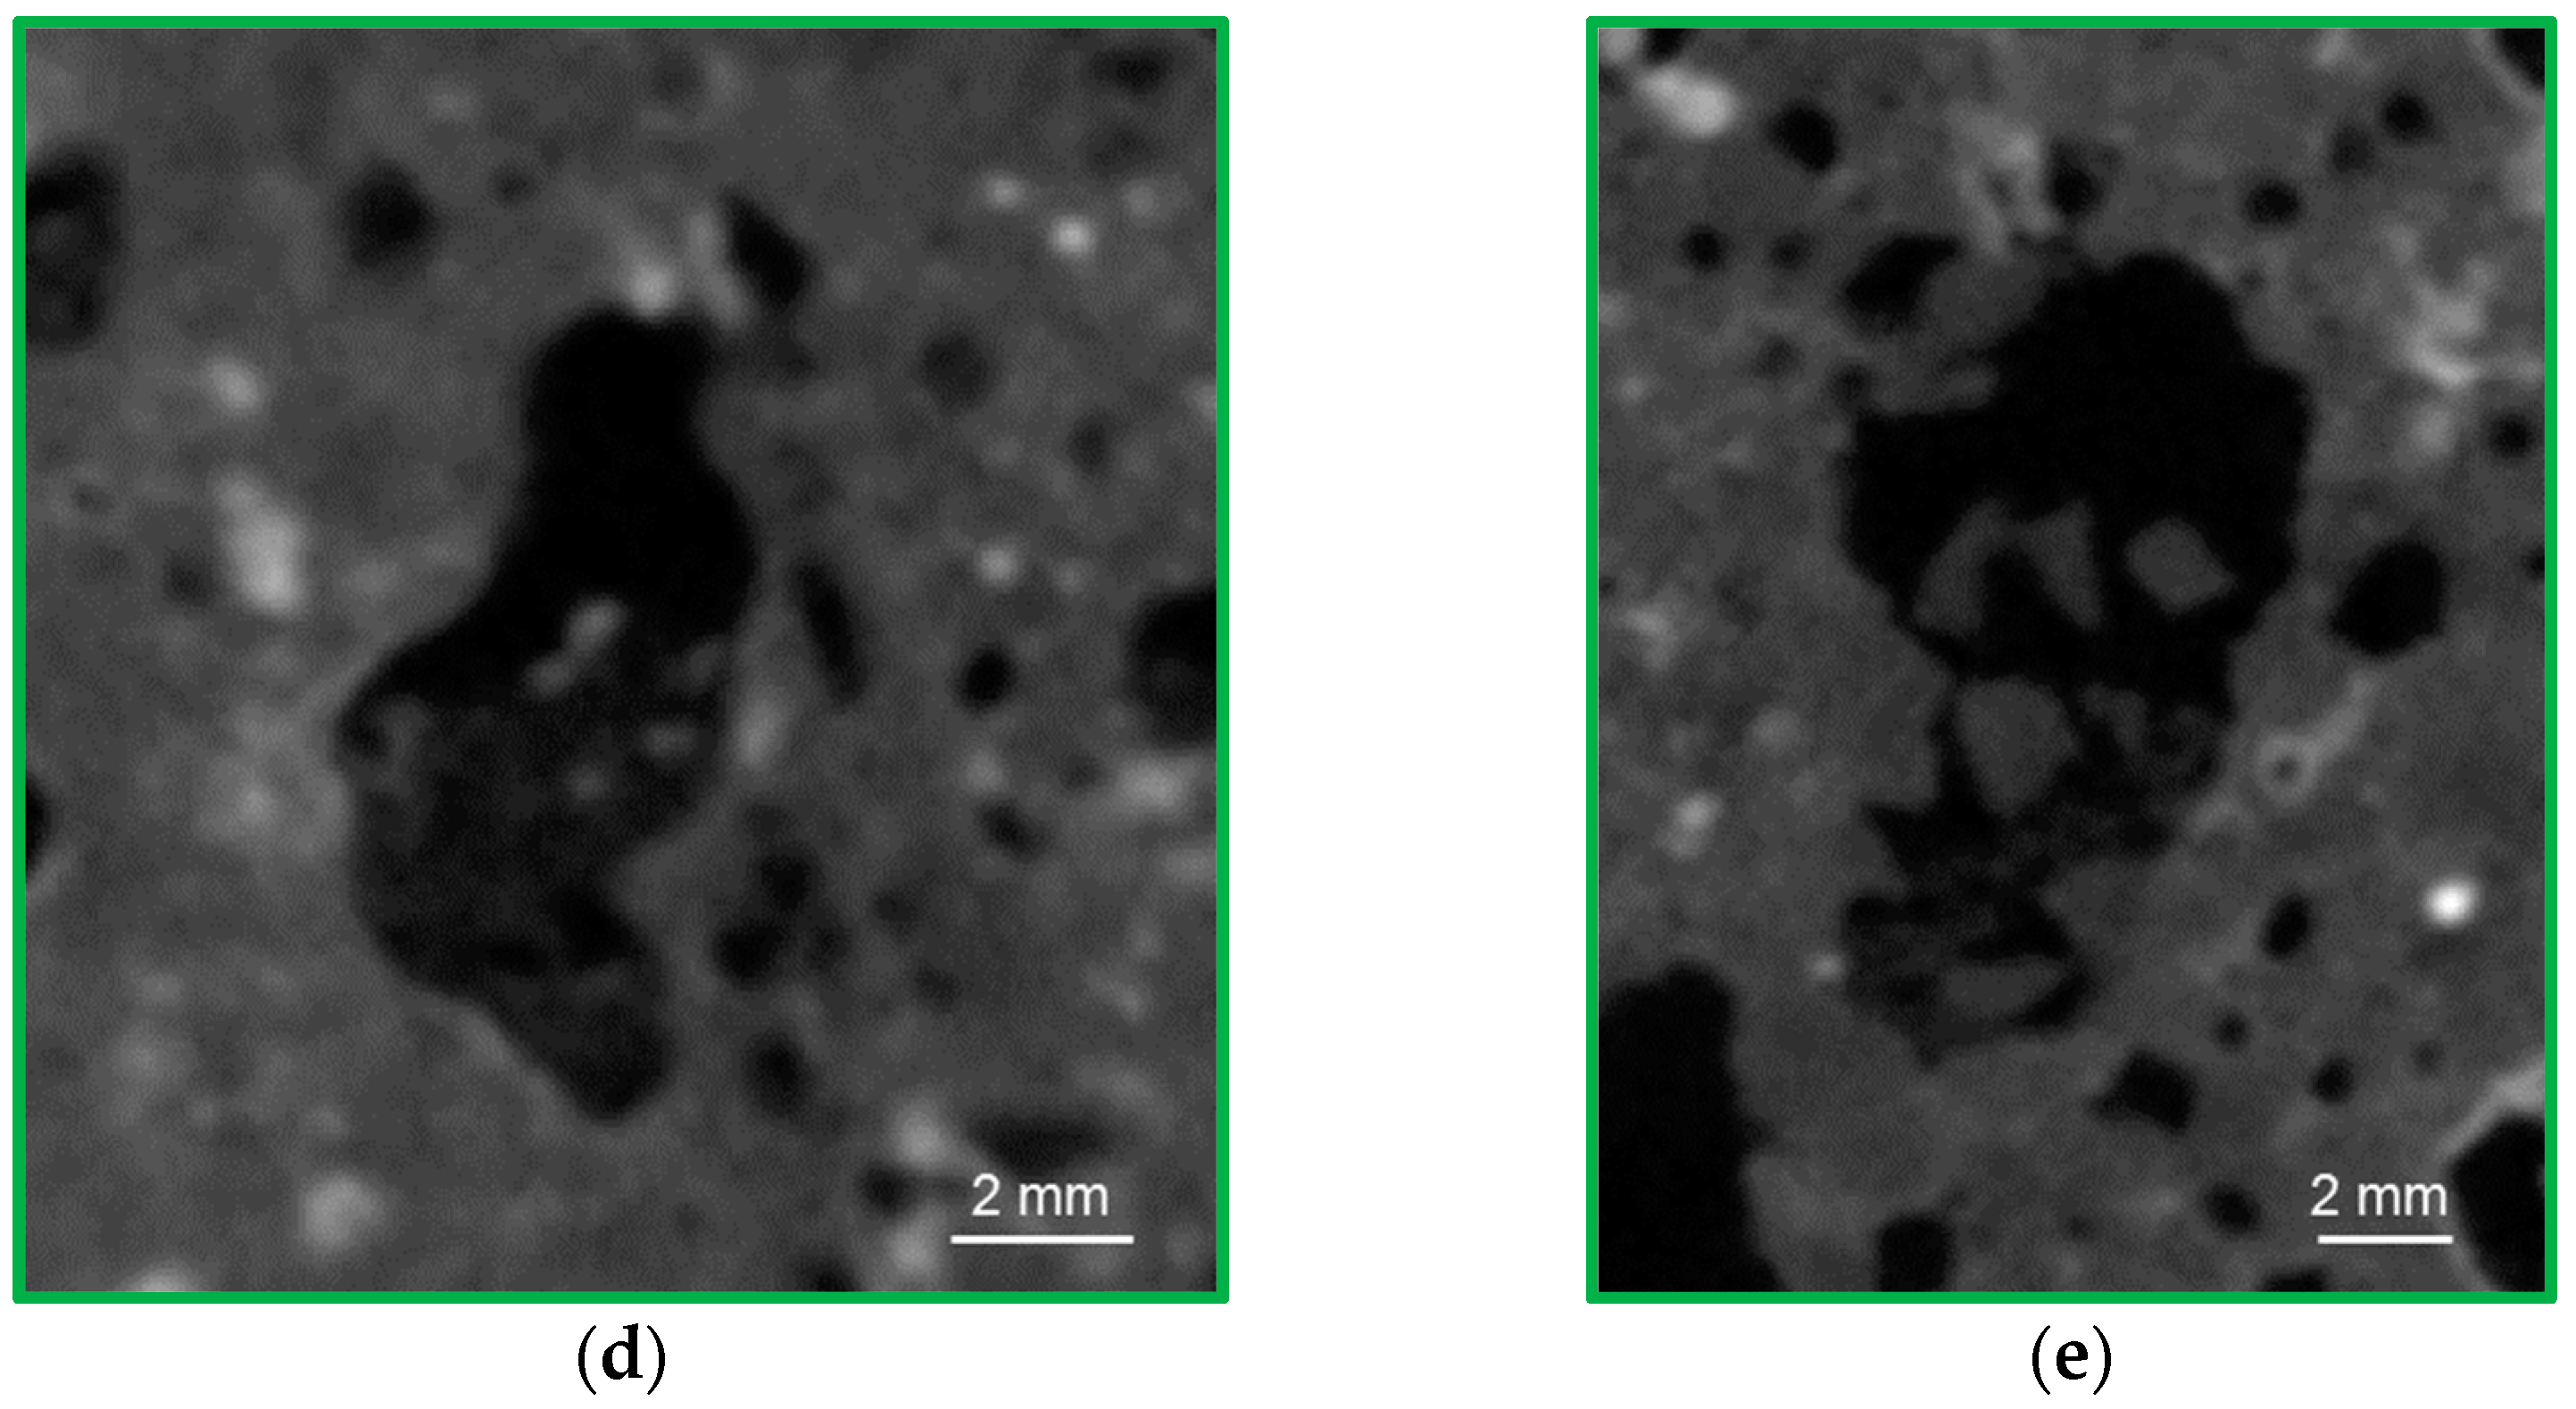
3.3.3. Morphological Details
4. Discussion and Conclusions
Author Contributions
Acknowledgments
Conflicts of Interest
Appendix A


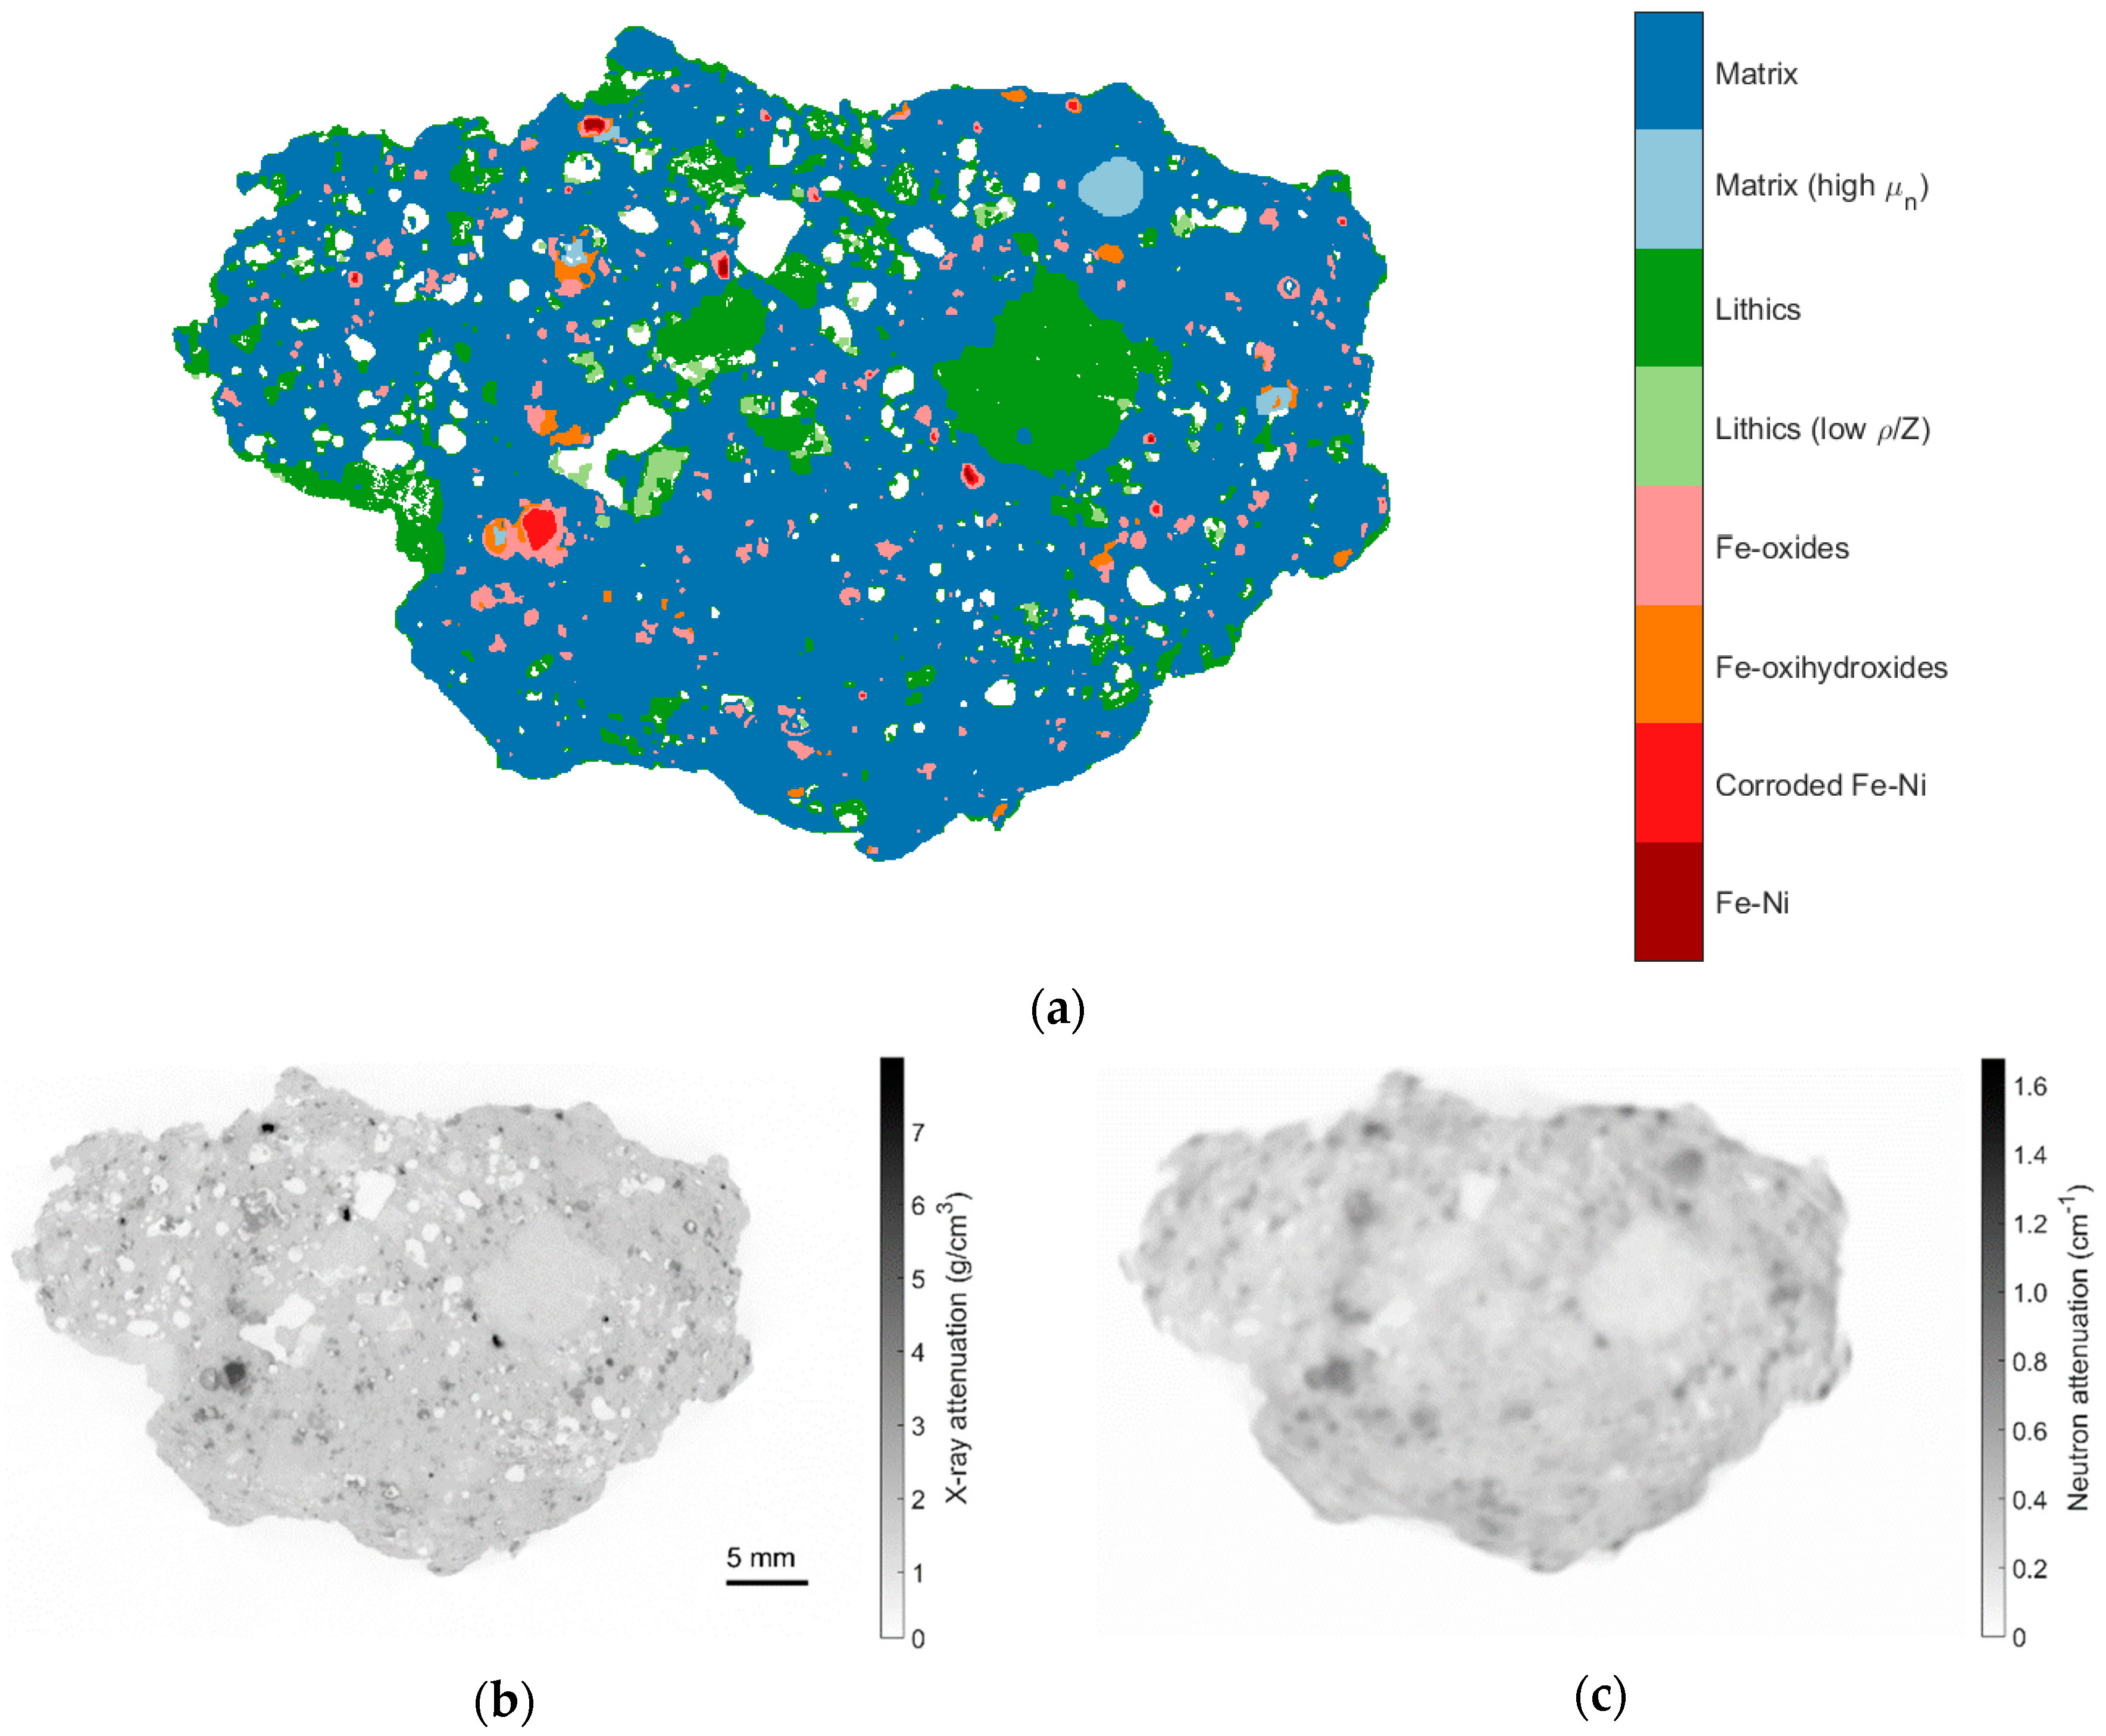
| # | Class Colour | X-ray ρ [g/cm3] | Neutron μ [cm−1] | Material |
|---|---|---|---|---|
| 1 | ■ | 1.6 | 0.27 | Matrix glass |
| 2 | ■ | 1.5 | 0.73 | Matrix (high neutron attenuation µn) |
| 3 | ■ | 1.0 | 0.19 | Lithic fragments |
| 4 | ■ | 0.65 | 0.18 | Lithic fragments (low ρ/Z) |
| 5 | ■ | 3.5 | 0.36 | Iron oxides (dominantly maghemite) |
| 6 | ■ | 3.15 | 1.20 | Iron oxihydroxides (dominantly goethite) |
| 7 | ■ | 5.2 | 0.80 | Fe-Ni corroded spherules or containing troilite |
| 8 | ■ | 7.8 | 0.82 | Fe-Ni spherules |
References
- Cifelli, R.L.; Lipka, T.R.; Schaff, C.R.; Rowe, T.B. First Early Cretaceous mammal from the eastern seaboard of the United States. J. Vertebr. Paleontol. 1999, 19, 199–203. [Google Scholar] [CrossRef]
- Carlson, W.D.; Rowe, T.; Ketcham, R.A.; Colbert, M.W. Applications of high-resolution X-ray computed tomography in petrology, meteoritics and palaeontology. In Geological Society; Special Publications: London, UK, 2003; Volume 215, pp. 7–22. [Google Scholar]
- Cnudde, V.; Boone, M.N. High-resolution X-ray computed tomography in geosciences: A review of the current technology and applications. Earth-Sci. Rev. 2013, 123, 1–17. [Google Scholar] [CrossRef]
- Winkler, B. Applications of Neutron radiography and Neutron Tomography. Rev. Mineral. Geochem. 2006, 63, 459–471. [Google Scholar] [CrossRef]
- Wilding, M.C.; Wilson, M.; McMillan, P.F. X-ray and neutron diffraction studies and MD simulation of atomic configurations in polyamorphic Y2O3-Al2O3 systems. Philos. Trans. R. Soc. A 2005, 363, 589–607. [Google Scholar] [CrossRef] [PubMed]
- Dierick, M.; Vlassenbroeck, J.; Masschaele, B.; Cnudde, V.; Van Hoorebeke, L.; Hillenbach, A. High-speed neutron tomography of dynamic processes. Nucl. Instrum. Methods Phys. Res. A 2005, 542, 296–301. [Google Scholar] [CrossRef]
- Strobl, M.; Kardjilov, N.; Hilger, A.; Manke, I.; Banhart, J. Topical Review: Advances in neutron radiography and tomography. J. Phys. D 2009, 42, 243001. [Google Scholar] [CrossRef]
- Kaestner, A.P.; Hovind, J.; Boillat, P.; Muehlebach, C.; Carminati, C.; Zarebanadkouki, M.; Lehmann, E.H. Bimodal Imaging at ICON Using Neutrons and X-rays. Phys. Procedia 2017, 88, 314–321. [Google Scholar] [CrossRef]
- LaManna, J.M.; Hussey, D.S.; Baltic, E.; Jacobson, D.L. Neutron and X-ray Tomography (NeXT) system for simultaneous, dual modality tomography. Rev. Sci. Instrum. 2017, 88, 113702. [Google Scholar] [CrossRef] [PubMed]
- Tegantini, A.; Atkins, D.; Giroud, B.; Ando, E.; Beaucour, J.; Viggiani, G. NeXT-Grenoble, a novel facility for Neutron and X-ray Tomography in Grenoble. In Proceedings of the 3rd International Conference on Tomography of Materials and Structures, Lund, Sweden, 26–30 June 2017. [Google Scholar]
- Banhart, J. Advanced Tomographic Methods in Materials Research and Engineering; Oxford University Press: Oxford, UK, 2008. [Google Scholar]
- Fettes, D.; Desmons, J. (Eds.) Metamorphic Rocks: A Classification and Glossary of Terms; Cambridge University Press: Cambridge, UK, 2007. [Google Scholar]
- Echaurren, J.C.; Ocampo, A.C.; Rocca, M.C.L. A Mathematical model for the Monturaqui Impact Crater, Chile, South America, Meteoritics & Planetary Science 40, Supplement. In Proceedings of the 68th Annual Meteoritical Society Meeting of the Meteoritical Society, Gatlinburg, TN, USA, 12–16 September 2005; p. 5004. [Google Scholar]
- Evans, N.J.; Gregoire, D.C.; Grieve, R.A.F.; Goodfellow, W.D.; Veizer, J. Use of platinum-group elements for impactor identification: Terrestrial impact craters and Cretaceous-Tertiary boundary. Geochim. Cosmochim. Acta 1993, 57, 3737–3748. [Google Scholar] [CrossRef]
- Ebert, M.; Hecht, L.; Deutsch, A.; Kenkmann, T. Chemical modification of projectile residues and target material in a MEMIN cratering experiment. Meteorit. Planet. Sci. 2013, 48, 134–149. [Google Scholar] [CrossRef]
- Hamann, C.; Hecht, L.; Ebert, M.; Wirth, R. Chemical projectile–target interaction and liquid immiscibility in impact glass from the Wabar craters, Saudi Arabia. Geochim. Cosmochim. Acta 2013, 121, 291–310. [Google Scholar] [CrossRef]
- French, B.M.; Koeberl, C. The Convincing Identification of Terrestrial Meteorite Impact Structures: What Works, What Doesn’t and Why. Earth-Sci. Rev. 2010, 98, 123–170. [Google Scholar] [CrossRef]
- Ukstins Peate, I.; van Soest, M.; Wartho, J.; Cabrol, N.; Grin, E.; Piatek, J.; Chong, G. A Novel Application of (U-Th)/He Geochronology to Constrain the Age of Small, Young Meteorite Impact Craters: A Case Study of the Monturaqui Crater, Chile. In Proceedings of the 41st Lunar and Planetary Science Conference, Houston, TX, USA, 1–5 March 2010. [Google Scholar]
- Sanchez, J.; Cassidy, W. A previously undescribed meteorite crater in Chile. J. Geophys. Res. 1966, 70, 4891–4895. [Google Scholar] [CrossRef]
- Hartley, A.J.; Chong, G.; Houston, J.; Mather, A.E. 150 million years of climatic stability: Evidence from the Atacama Desert, northern Chile. J. Geol. Soc. 2005, 162, 421–424. [Google Scholar] [CrossRef]
- Ugalde, H.; Valenzuela, M.; Milkereit, B. An integrated geophysical and geological study of the Monturaqui impact crater, Chile. Meteorit. Planet. Sci. 2007, 42, 2153–2163. [Google Scholar] [CrossRef]
- Ramirez, C.F.; Gardeweg, M. Hoja Toconao, Region de Antofagasta; Servicio Nacional de Geología y Minería: Santiago, Chile, 1982. [Google Scholar]
- Bunch, T.E.; Cassidy, W.A. Petrographic and electron microprobe study of the Monturaqui impactite. Contrib. Mineral. Petrol. 1972, 36, 95–112. [Google Scholar] [CrossRef]
- Lipka, J.; Madsen, M.B.; Koch, C.B.; Miglierini, M.; Knudsen, J.M.; Morup, S. The Monturaqui impactite and the iron in it. Meteoritics 1994, 29, 492. [Google Scholar]
- Gibbons, R.V.; Hörz, F.; Thompson, T.D.; Brownlee, D.E. Metal spherules in Wabar, Monturaqui, and Henbury impactites. In Proceedings of the 7th Lunar and Planetary Science Conference, Houston, TX, USA, 15–19 March 1976; pp. 863–880. [Google Scholar]
- Koch, C.B. Weathering of impactite from Monturaqui. Program Abstr. Clay Miner. Soc. 1991, 91. [Google Scholar]
- Koch, C.; Buchwald, V.F. Weathering of Iron Meteorites from Monturaqui, Chile. Meteoritics 1994, 29, 443. [Google Scholar]
- Kearsley, A.; Graham, G.; McDonnell, T.; Bland, P.; Hough, R.; Helps, P. Early fracturing and impact residue emplacement: Can modelling help to predict their location in major craters? Meteorit. Planet. Sci. 2004, 39, 247–265. [Google Scholar] [CrossRef]
- Kloberdanz, C.M. Geochemical Analysis of the Monturaqui Impact Crater, Chile. Master’s Thesis, University of Iowa, Iowa City, IA, USA, 2010. [Google Scholar]
- Cukierski, D.O. Textural and Compositional Analysis of Fe-Ni Metallic Spherules in Impact Melt from Monturaqui Crater, Chile. Unpublished Master’s Thesis, University of Iowa, Iowa City, IA, USA, 2013. Available online: https://ir.uiowa.edu/cgi/viewcontent.cgi?article=4595&context=etd (accessed on 12 May 2018).
- Ikeda, Y.; Kojima, H. Terrestrial alteration of Fe-Ni metals in Antarctic ordinary chondrites and the relationships to their terrestrial ages. Proc. NIPR Symp. Antarct. Meteor. 1991, 4, 307–318. [Google Scholar]
- Jackson, D.F.; Hawkes, D.J. X-ray attenuation coefficients of elements and mixtures. Phys. Rep. 1981, 70, 169. [Google Scholar] [CrossRef]
- Jenkins, R.; Snyder, R.L. Introduction to X-ray Powder Diffractometry; John Wiley: New York, NY, USA, 1996. [Google Scholar]
- Vlassenbroeck, J.; Cnudde, V.; Masschaele, B.; Dierick, M.; van Hoorebekel, L.; Jacobs, P. A comparative and critical study of X-ray CT and neutron CT as non-destructive material evaluation techniques. Geol. Soc. 2007, 271, 277–285. [Google Scholar] [CrossRef]
- Kak, A.C.; Slanley, M. Principles of Computerised Tomographic Imaging; IEEE Press: New York, NY, USA, 1988. [Google Scholar]
- Cormack, A.M. Representation of functions by its line integrals with some radiological applications. J. Appl. Phys. 1963, 34, 2722. [Google Scholar] [CrossRef]
- Hounsfield, G.N. Computerized transverse axial scanning (tomography). Br. J. Radiol. 1973, 46, 1016. [Google Scholar] [CrossRef] [PubMed]
- Ott, F.; Loupiac, C.; Désert, S.; Hélary, A.; Lavie, P. IMAGINE: A cold neutron imaging station at the Laboratoire Léon Brillouin. Phys. Procedia 2015, 69, 67–70. [Google Scholar] [CrossRef]
- Inside Matters. Octopus. 2017. Available online: https://octopusimaging.eu/octopus/octopus-reconstruction (accessed on 1 October 2017).
- Deans, S.R. The Radon Transform and Some of Its Applications; Courier Corporation: North Chelmsford, MA, USA, 2007. [Google Scholar]
- Schindelin, J.; Arganda-Carreras, I.; Frise, E.; Kaynig, V.; Longair, M.; Pietzsch, T.; Preibisch, S.; Rueden, C.; Saalfeld, S.; Schmid, B.; et al. Fiji: An open-source platform for biological-image analysis. Nat. Methods 2012, 9, 676–682. [Google Scholar] [CrossRef] [PubMed]
- Penny, W.D.; Ashburner, J.; Kiebel, S.; Henson, R.; Glaser, D.E.; Phillips, C.; Friston, K. Statistical Parametric Mapping: An Annotated Bibliography. 2001. Available online: http://www.fil.ion.ucl.ac.uk/spm/ software/spm8/ (accessed on 1 October 2017).
- Collignon, A.; Maes, F.; Delaere, D.; Vandermeulen, D.; Suetens, P.; Marchal, G. Automated Multi-modality Image Registration Based On Information Theory. In Proceedings of Information Processing in Medical Imaging; Bizais, Y., Barillot, C., Di Paola, R., Eds.; Kluwer Academic Publishers: Dordrecht, The Netherlands, 1995. [Google Scholar]
- Studholme, C.; Hill, D.L.; Hawkes, D.J. An overlap invariant entropy measure of 3D medical image alignment. Pattern Recognit. 1999, 32, 71–86. [Google Scholar] [CrossRef]
- Viola, P.; Wells, W.M., III. Alignment by maximization of mutual information. In Proceedings of the International Conference on Computer Vision, Cambridge, MA, USA, 20–23 June 1995; Grimson, E., Shafer, S., Blake, A., Sugihara, K., Eds.; IEEE Computer Society Press: Los Alamitos, CA, USA, 1995; pp. 16–23. [Google Scholar]
- Otsu, N. A Threshold Selection Method from Gray-Level Histograms. IEEE Trans. Syst. Man Cybern. 1979, 9, 62–66. [Google Scholar] [CrossRef]
- Li, S.Z. Markov Random Field Modeling in Image Analysis; Springer: Berlin, Germany, 2009. [Google Scholar]
- Brett, R. Metallic spherules in impactite and tektite glasses. Am. Miner. 1967, 52, 721–733. [Google Scholar]


| Imaging Set-up | X-ray | Neutron |
|---|---|---|
| Pixel size (μm) | 33.1 | 75.0 |
| Projections (n°) | 3143 | 360 |
| Magnification | 1.32 | 1 |
| CCD size (pixels) | 2048 × 2048 | 2560 × 2160 |
| Field of view (mm) | 150 × 150 | 100 × 100 |
| Source spectrum | 200 kVp (479 μA current) | cold neutrons (peaked at ~4 Å) |
| Filter | Al, 0.250 mm thick | none |
| Rotating angle (°) | 0–360 | 0–360 |
| Mineral | Chemical Formula | ρ (g/cm3) | μ (4 Å) (cm−1) | Class Colour | Material Class | X-ray ρ (g/cm3) | Neutron μ (cm−1) |
|---|---|---|---|---|---|---|---|
| Quartz | SiO2 | 2.65 | 0.293 | ■ | Matrix glass | 1.2–2.5 | 0.04–0.60 |
| Magnetite | Fe3O4 | 5.17 | 0.926 | ■ | Iron oxides | 2.5–5.2 | 0.08–0.75 |
| Hematite | Fe2O3 | 5.24 | 0.936 | ■ | Iron oxides | 2.5–5.2 | 0.08–0.75 |
| Ilmenite | FeTiO3 | 4.79 | 0.898 | ■ | Iron oxides | 2.5–5.2 | 0.08–0.75 |
| Goethite | FeO(OH) | 4.13 | 3.038 | ■ | Iron oxihydroxides | 2.2–5.1 | 0.58–1.45 |
| Troilite | FeS | 4.61 | 0.616 | ■ | Fe-Ni + troilite | 4.4–6.7 | 0.32–1.60 |
| Pyrrhotite | Fe(1−x)S | 4.61 | 0.616 | ■ | Fe-Ni + troilite | 4.4–6.7 | 0.32–1.60 |
| Kamacite | Fe0.9Ni0.1 | 7.9 | 1.576 | ■ | Fe-Ni spherules | 6.4–12.3 | 0.33–1.68 |
| Taenite | Fe0.8Ni0.2 | 8.01 | 1.672 | ■ | Fe-Ni spherules | 6.4–12.3 | 0.33–1.68 |
| Ferrite | Fe | 7.89 | 1.469 | ■ | Fe-Ni spherules | 6.4–12.3 | 0.33–1.68 |
| # | Class Colour | Material | Volume % |
|---|---|---|---|
| 1 | ■ | Matrix glass | 78.14 |
| 2 | ■ | Matrix (high neutron attenuation µn) | 0.83 |
| 3 | ■ | Lithic fragments | 13.78 |
| 4 | ■ | Lithic fragments (low ρ/Z) | 2.90 |
| 5 | ■ | Iron oxides (dominantly maghemite) | 3.16 |
| 6 | ■ | Iron oxihydroxides (dominantly goethite) | 0.89 |
| 7 | ■ | Fe-Ni corroded spherules or containing troilite | 0.19 |
| 8 | ■ | Fe-Ni spherules | 0.12 |
© 2018 by the authors. Licensee MDPI, Basel, Switzerland. This article is an open access article distributed under the terms and conditions of the Creative Commons Attribution (CC BY) license (http://creativecommons.org/licenses/by/4.0/).
Share and Cite
Fedrigo, A.; Marstal, K.; Bender Koch, C.; Andersen Dahl, V.; Bjorholm Dahl, A.; Lyksborg, M.; Gundlach, C.; Ott, F.; Strobl, M. Investigation of a Monturaqui Impactite by Means of Bi-Modal X-ray and Neutron Tomography. J. Imaging 2018, 4, 72. https://doi.org/10.3390/jimaging4050072
Fedrigo A, Marstal K, Bender Koch C, Andersen Dahl V, Bjorholm Dahl A, Lyksborg M, Gundlach C, Ott F, Strobl M. Investigation of a Monturaqui Impactite by Means of Bi-Modal X-ray and Neutron Tomography. Journal of Imaging. 2018; 4(5):72. https://doi.org/10.3390/jimaging4050072
Chicago/Turabian StyleFedrigo, Anna, Kasper Marstal, Christian Bender Koch, Vedrana Andersen Dahl, Anders Bjorholm Dahl, Mark Lyksborg, Carsten Gundlach, Frédéric Ott, and Markus Strobl. 2018. "Investigation of a Monturaqui Impactite by Means of Bi-Modal X-ray and Neutron Tomography" Journal of Imaging 4, no. 5: 72. https://doi.org/10.3390/jimaging4050072