Single-Shot X-ray Phase Retrieval through Hierarchical Data Analysis and a Multi-Aperture Analyser


Department of Medical Physics and Biomedical Engineering, University College London, Gower Street, London WC1E 6BT, UK
*
Author to whom correspondence should be addressed.
J. Imaging 2018, 4(6), 76; https://doi.org/10.3390/jimaging4060076
Submission received: 11 May 2018
/
Revised: 29 May 2018
/
Accepted: 5 June 2018
/
Published: 6 June 2018
(This article belongs to the Special Issue Phase-Contrast and Dark-Field Imaging)
Abstract
:A multi-aperture analyser set-up was recently developed for X-ray phase contrast imaging and tomography, simultaneously attaining a high sensitivity and wide dynamic range. We present a single-shot image retrieval algorithm in which differential phase and dark-field images are extracted from a single intensity projection. Scanning of the object is required to build a two-dimensional image, because only one pre-sample aperture is used in the experiment reported here. A pure-phase object approximation and a hierarchical approach to the data analysis are used in order to overcome numerical instabilities. The single-shot capability reduces the exposure times by a factor of five with respect to the standard implementation and significantly simplifies the acquisition procedure by only requiring sample scanning during data collection.
1. Introduction
Non-destructive inspection is often carried out using X-ray radiation because high resolution images can be obtained through significant thicknesses over a wide range of materials. X-ray imaging is applied across a huge variety of fields, such as medicine, materials engineering, biology, and security. Since their introduction more than a hundred years ago, X-ray systems have relied on attenuation to generate contrast and produce an image. When the attenuation contrast is too weak to visualise the internal structure of a sample, phase effects can be exploited to modulate the detected intensity and to enhance the visibility of details that lack sufficient absorption contrast [1]. A number of different approaches have been developed for X-ray Phase Contrast Imaging (XPCI), relying both on laboratory sources and synchrotron radiation facilities, including free-space propagation (with single-distance implementations), crystal analysers, grating interferometry, and speckle-based methods [2,3,4,5,6,7,8,9,10,11,12,13,14,15,16,17,18]. Edge illumination (EI) [19] was developed at a synchrotron facility and later translated to laboratory sources [20]. It has been shown to provide high resolution, quantitative phase, and dark field images [21,22,23]. Low spatial and temporal coherence is extremely well tolerated by the technique, which is also stable against thermal and mechanical stresses [24,25,26,27]. The main concept behind the EI approach is that by strongly shaping the X-ray beam in one direction and inserting a sharp absorbing element before detection, small angular deviations in the direction of propagation of the X-rays are translated into intensity modulations at the detector. When a sample is present in the beam, three main effects can be detected. A certain amount of radiation stops in the sample; this is the sample transmission and reduces the total intensity of the beam that reaches the analyser. The beam is shifted in one direction; this is the sample refraction, and it is translated into an increased or a decreased detected intensity, depending on the direction of shifting. The angular dispersion of the X-ray beam is increased; this is also reflected as a change in intensity depending on the relative arrangement of the structuring and the analysing element.
Building on the EI approach, a multi-aperture analyser set-up was recently developed enabling the simultaneous attainment of high sensitivity and a dynamic range [28,29]. When compared to other full-field imaging techniques, having one pre-sample aperture imposes sample scanning to construct a planar, two-dimensional image. This requirement can be relaxed or eliminated by using a pre-sample mask. One advantage is the possibility of operating single-shot, which can be of interest when the dose to sample or total scanning time need to be optimised. A phase retrieval and data processing scheme is presented, which provides differential phase and dark field images from a single detector exposure.
2. Experimental
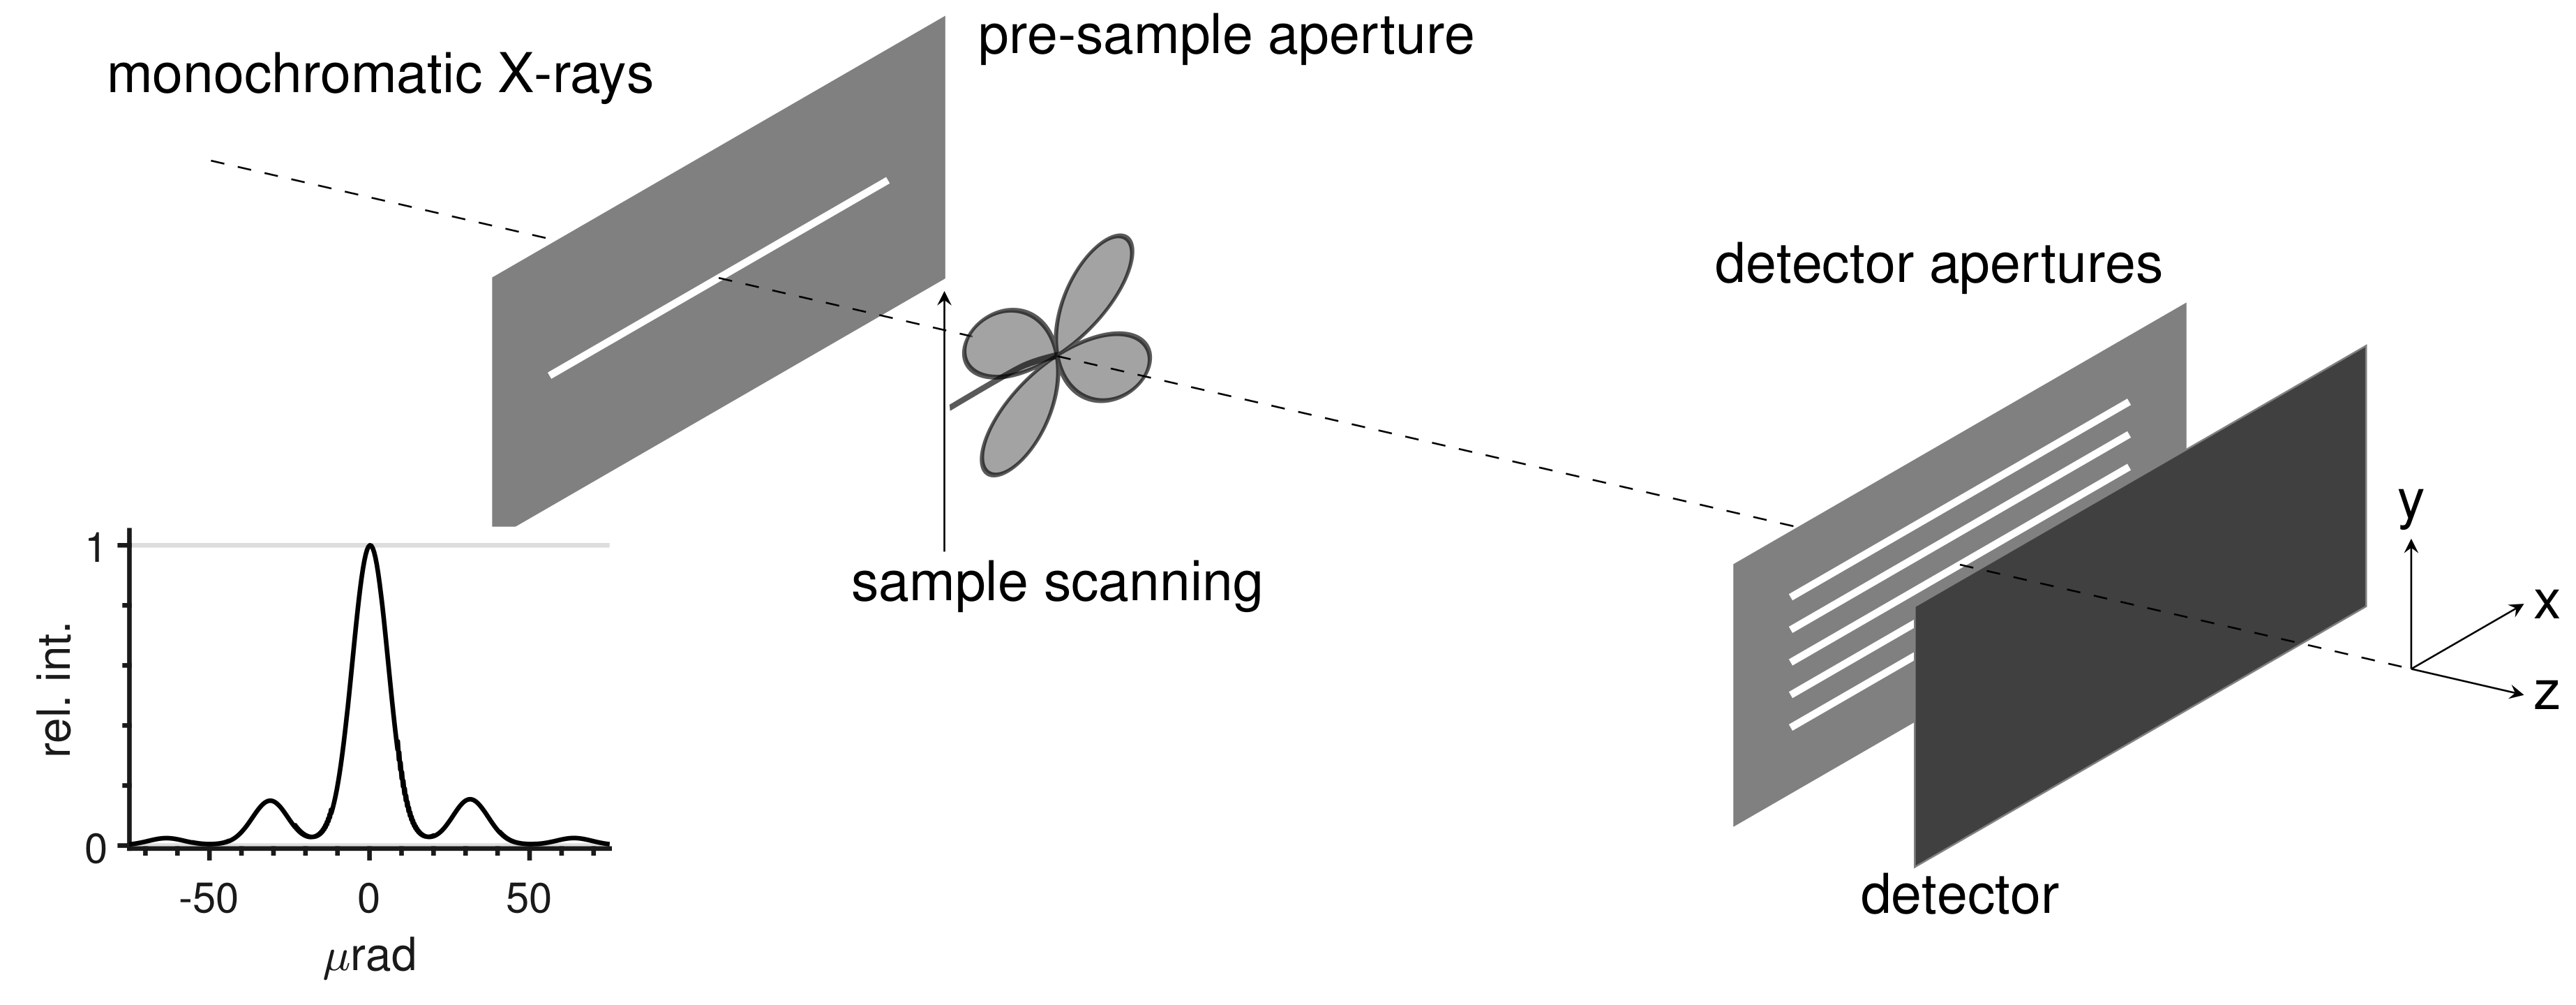
The multi-aperture analyser setup is composed of a pre-sample slit for beam shaping and a multi-aperture slit for beam analysis before detection. A schematic of the set-up is shown in Figure 1. For a comparison of the multi-aperture setup against the more conventional single-aperture setup, please refer to the Supplemental Material of ref. [28]. Since, in this case, a single aperture (before the sample) was available, a single image line was acquired for each detector exposure, and a two-dimensional image was built by scanning the sample vertically and collecting multiple exposures. Five apertures in the detector mask were used in this experiment.
The intensity measured in the detector pixels is modulated by scanning the analyser vertically, and is a function of its misalignment with the pre-sample aperture (maximum intensity at ). This is typically referred to as the illumination function (IF) which characterises the imaging system (shown in the inset in the bottom left corner of Figure 1). Once the sample, O, is placed in the beam, the intensity at the detector can be expressed as a convolution between the sample and the IF [28]:
It is useful to express I as a sum of Gaussian functions [22] in order to separate the contributions from the (known) IF and the (unknown) sample:
where , (), and (). A, and are the usual three parameters that specify a Gaussian function, namely its amplitude, mean and width. The parameters are defined according to , and . Equations (1) and (2) hold independently for each image pixel.
The data (used to retrieve the images shown later) were collected at the SYRMEP beamline of the Elettra Synchrotron Facility in Trieste, Italy. The pre-sample aperture, placed at 22 m from the source, was 20 m wide, whilst the analyser apertures were 23 m wide with a periodicity of 79 m and positioned m downstream. The sample was positioned at 26 cm from the pre-sample aperture and was scanned in a step-and-shoot fashion. Synchrotron radiation at 20 keV was selected from a bending magnet source by using a double-bounce Si(111) monochromator. The detector was a Photonic Science Ltd. charge-coupled device with a m pixel pitch. Exposures were 500 ms per sample position. The sample was a Lunaria annua flower of which two petals were exposed. The field of view was limited horizontally by the width of the pre-sample aperture to 40 mm, while vertically, it was determined by the length of the acquisition scan.
3. Algorithm and Results
The standard acquisition scheme [28] entailed five exposures per sample position, each with the analyser aligned to a different , therefore selecting different illumination levels. In this work, five intensities wee recorded through each aperture j () for each pixel i without moving the analyser. The intensities recorded with and without the sample in the beam were then compared to extract the sample function, O, at each position in the plane . This function contains the properties of the sample in terms of transmission (amplitude), refraction (mean) and scattering (width). Retrieval of the function, O, is achieved through a non-linear fitting procedure that minimises , where I is the model function of Equation (2), b its set of parameters (specifying the Gaussian model of Equation (2)) and is the X-ray intensity measured through each aperture at a single analyser position . A maximum number of 100 iterations was performed in the search for the optimal parameters. For the single-shot case, only one position of the analyser was used. Reducing the amount of data by a factor of five, compared to the five-shots method previously employed, resulted in numerical instability of the retrieval—the noise in the raw intensity data propagated through the retrieval and compromised the quality of the sample images.
In order to overcome this problem we first imposed a pure phase object constraint. This was justified by observing that at relatively high energy (20 keV) and for a thin petal (≲m) the absorption was estimated to be less than .
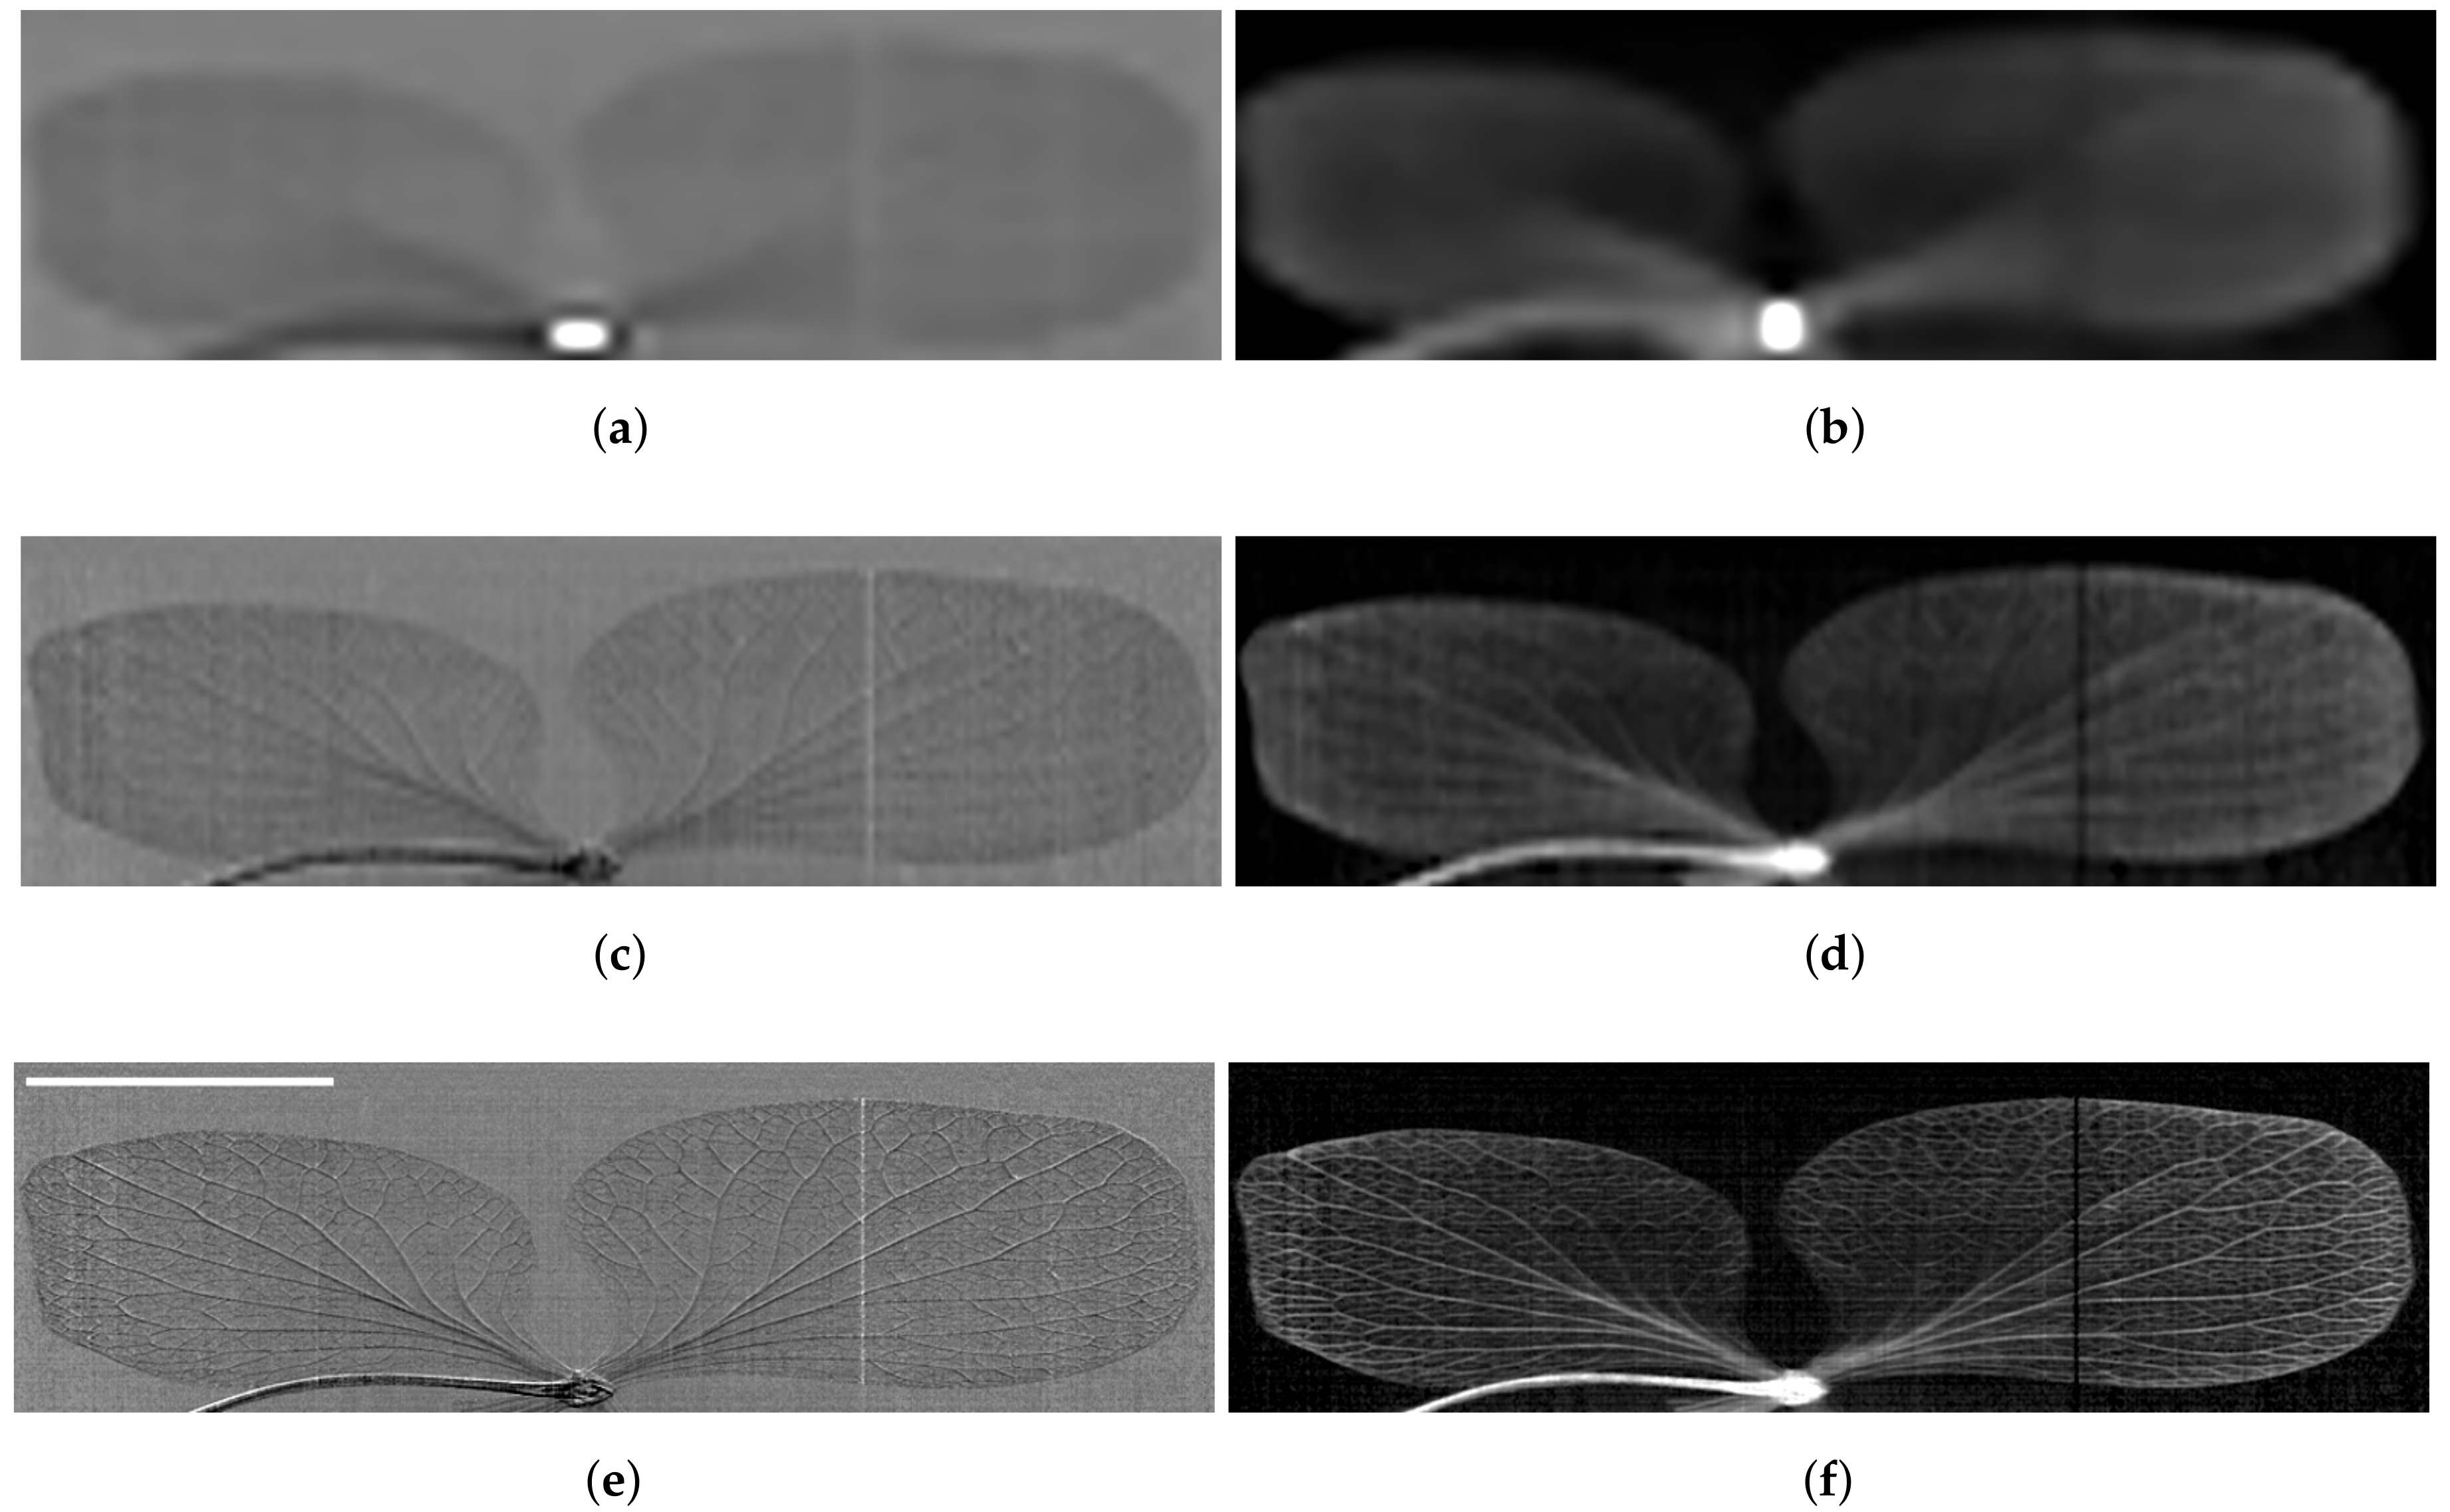
A good initial guess is also critical for successful retrieval in the presence of noise. In other words, the optimal values should be obtained with few iterations before the propagation of noise takes over the signal. This problem was addressed through a hierarchical data processing approach. The algorithm worked in the following way: the raw intensity images were heavily binned, providing an image with very few pixels but excellent photon statistics. Phase retrieval was applied to this data, starting the iteration from a flat, inaccurate guess centred around zero. Because of the excellent statistics, the actual noise was extremely small and the retrieval performed well, with fast and robust convergence. The values of the sample function, O, obtained in this way were accurate but had low resolution. They did, however, provide a good starting point for the next iteration. The following iteration step was implemented by taking the retrieved O function, expanding it to match the new binning factor of the raw intensity image and using it as the initial guess for the phase retrieval. A schematic representation of the algorithm is also reported in Figure 2. The results obtained with this procedure are shown in Figure 3 where differential phase and dark-field images were obtained with three different binning factors: , and . As a rule of thumb, we roughly halved the binning factor at each iteration.
This procedure stabilised the retrieval and enabled single-shot, high resolution images to be extracted from the data. Some stripe artefacts were still visible in the images; these are most likely due to the type of acquisition that, in this configuration, requires a vertical scan. An ill-behaved pixel affects a whole image column, and its effect therefore becomes much more visible with respect to a standard two-dimensional pixel arrangement.
4. Conclusions
In summary, we have presented a hierarchical data processing algorithm that enables single-shot hard X-ray phase and dark-field imaging retrieval. The experimental set-up is based on the multi-aperture analyser that, when used in this configuration, does not require any instrumentation movement during data acquisition. In the configuration used here, the sample has to be scanned through the laminar beam created by the pre-sample aperture in order to build a two-dimensional image and this is due to using only a single pre-sample aperture. This data acquisition and analysis scheme could be of interest when exposure times have to be reduced in favour of dose or total scanning time, or when having stationary optical elements offers improved stability and accuracy in the measurement.
Author Contributions
Author Contributions: M.E., F.A.V. and A.O. conceived, designed and performed the experiments; M.E. analysed the data and wrote the paper with contributions from F.A.V. and A.O.
Acknowledgments
Acknowledgments: M.E. was supported by the Royal Academy of Engineering under the RAEng Research Fellowships scheme. F.A.V. was supported by the Royal Academy of Engineering and the Office of the Chief Science Adviser for National Security under the UK Intelligence Community Postdoctoral Fellowship Programme. This work was also supported by the EPSRC (Grant EP/M507970/1). We thank Elettra Sincrotrone Trieste for access to SYRMEP beamline (proposal 20140147) that contributed to the results presented here.
Conflicts of Interest
The authors declare no conflict of interest. The founding sponsors had no role in the design of the study; in the collection, analyses, or interpretation of data; in the writing of the manuscript, and in the decision to publish the results.
Abbreviations
The following abbreviations are used in this manuscript:
| XPCI | X-ray Phase Contrast Imaging |
| IF | Illumination Function |
References
- Endrizzi, M. X-ray phase-contrast imaging. Nucl. Instrum. Methods Phys. Res. Sect. A Accel. Spectrom. Detect. Assoc. Equip. 2018, 878, 88–98. [Google Scholar] [CrossRef]
- Bonse, U.; Hart, M. An X-ray interferometer. Appl. Phys. Lett. 1965, 6, 155–156. [Google Scholar] [CrossRef]
- Goetz, K.; Foerster, E.; Zaumseil, P.; Kalashnikov, M.P.; Mikhailov, I.A.; Sklizkov, G.V.; Fedotov, S.I. Measurements of the parameters of shell targets for laser thermonuclear fusion using an X-ray schlieren method. Kvantovaia Elektron. Mosc. 1979, 6, 1037–1042. [Google Scholar] [CrossRef]
- Davis, T.J.; Gao, D.; Gureyev, T.E.; Stevenson, A.W.; Wilkins, S.W. Phase-contrast imaging of weakly absorbing materials using hard X-rays. Nature 1995, 373, 595–598. [Google Scholar] [CrossRef]
- Ingal, V.N.; Beliaevskaya, E.A. X-ray plane-wave topography observation of the phase contrast from a non-crystalline object. J. Phys. D Appl. Phys. 1995, 28, 2314–2317. [Google Scholar] [CrossRef]
- Wilkins, S.W.; Gureyev, T.E.; Gao, D.; Pogany, A.; Stevenson, A.W. Phase-contrast imaging using polychromatic hard X-rays. Nature 1996, 384, 335–338. [Google Scholar] [CrossRef]
- Chapman, D.; Thomlinson, W.; Johnston, R.E.; Washburn, D.; Pisano, E.; Gmür, N.; Zhong, Z.; Menk, R.; Arfelli, F.; Sayers, D. Diffraction enhanced X-ray imaging. Phys. Med. Biol. 1997, 42, 2015–2025. [Google Scholar] [CrossRef] [PubMed]
- Clauser, J.F. Ultrahigh resolution interferometric X-ray imaging. U.S. Patent 5,812,629, 22 September 1998. [Google Scholar]
- David, C.; Nohammer, B.; Solak, H.H.; Ziegler, E. Differential X-ray phase contrast imaging using a shearing interferometer. Appl. Phys. Lett. 2002, 81, 3287–3289. [Google Scholar] [CrossRef]
- Paganin, D.; Mayo, S.C.; Gureyev, T.E.; Miller, P.R.; Wilkins, S.W. Simultaneous phase and amplitude extraction from a single defocused image of a homogeneous object. J. Microsc. 2002, 206, 33–40. [Google Scholar] [CrossRef] [PubMed] [Green Version]
- Momose, A.; Kawamoto, S.; Koyama, I.; Hamaishi, Y.; Takai, K.; Suzuki, Y. Demonstration of X-ray Talbot Interferometry. Jpn. J. Appl. Phys. 2003, 42, L866. [Google Scholar] [CrossRef]
- Mayo, S.C.; Sexton, B. Refractive microlens array for wave-front analysis in the medium to hard X-ray range. Opt. Lett. 2004, 29, 866–868. [Google Scholar] [CrossRef] [PubMed]
- Pfeiffer, F.; Weitkamp, T.; Bunk, O.; David, C. Phase retrieval and differential phase-contrast imaging with low-brilliance X-ray sources. Nat. Phys. 2006, 2, 258–261. [Google Scholar] [CrossRef] [Green Version]
- de Jonge, M.D.; Hornberger, B.; Holzner, C.; Legnini, D.; Paterson, D.; McNulty, I.; Jacobsen, C.; Vogt, S. Quantitative Phase Imaging with a Scanning Transmission X-ray Microscope. Phys. Rev. Lett. 2008, 100, 163902. [Google Scholar] [CrossRef] [PubMed]
- Wen, H.; Bennett, E.E.; Hegedus, M.M.; Rapacchi, S. Fourier X-ray Scattering Radiography Yields Bone Structural Information1. Radiology 2009, 251, 910–918. [Google Scholar] [CrossRef] [PubMed]
- Morgan, K.S.; Paganin, D.M.; Siu, K.K.W. X-ray phase imaging with a paper analyzer. Appl. Phys. Lett. 2012, 100, 124102. [Google Scholar] [CrossRef]
- Wang, H.; Kashyap, Y.; Sawhney, K. Hard-X-ray directional dark-field imaging using the speckle scanning technique. Phys. Rev. Lett. 2015, 114, 103901. [Google Scholar] [CrossRef] [PubMed]
- Miao, H.; Panna, A.; Gomella, A.A.; Bennett, E.E.; Znati, S.; Chen, L.; Wen, H. A universal moiré effect and application in X-ray phase-contrast imaging. Nat. Phys. 2016, 12, 830–834. [Google Scholar] [CrossRef] [PubMed] [Green Version]
- Olivo, A.; Arfelli, F.; Cantatore, G.; Longo, R.; Menk, R.H.; Pani, S.; Prest, M.; Poropat, P.; Rigon, L.; Tromba, G.; et al. An innovative digital imaging set-up allowing a low-dose approach to phase contrast applications in the medical field. Med. Phys. 2001, 28, 1610–1619. [Google Scholar] [CrossRef] [PubMed]
- Olivo, A.; Speller, R. A coded-aperture technique allowing X-ray phase contrast imaging with conventional sources. Appl. Phys. Lett. 2007, 91, 074106. [Google Scholar] [CrossRef]
- Munro, P.R.; Ignatyev, K.; Speller, R.D.; Olivo, A. Phase and absorption retrieval using incoherent X-ray sources. Proc. Natl. Acad. Sci. USA 2012, 109, 13922–13927. [Google Scholar] [CrossRef] [PubMed] [Green Version]
- Endrizzi, M.; Diemoz, P.C.; Millard, T.P.; Jones, J.L.; Speller, R.D.; Robinson, I.K.; Olivo, A. Hard X-ray dark-field imaging with incoherent sample illumination. Appl. Phys. Lett. 2014, 104, 024106. [Google Scholar] [CrossRef] [Green Version]
- Endrizzi, M.; Vittoria, F.A.; Diemoz, P.C.; Lorenzo, R.; Speller, R.D.; Wagner, U.H.; Rau, C.; Robinson, I.K.; Olivo, A. Phase-contrast microscopy at high X-ray energy with a laboratory setup. Opt. Lett. 2014, 39, 3332–3335. [Google Scholar] [CrossRef] [PubMed]
- Munro, P.R.T.; Ignatyev, K.; Speller, R.D.; Olivo, A. Source size and temporal coherence requirements of coded aperture type X-ray phase contrast imaging systems. Opt. Express 2010, 18, 19681. [Google Scholar] [CrossRef] [PubMed]
- Endrizzi, M.; Vittoria, F.A.; Kallon, G.; Basta, D.; Diemoz, P.C.; Vincenzi, A.; Delogu, P.; Bellazzini, R.; Olivo, A. Achromatic approach to phase-based multi-modal imaging with conventional X-ray sources. Opt. Express 2015, 23, 16473–16480. [Google Scholar] [CrossRef] [PubMed]
- Millard, T.P.; Endrizzi, M.; Ignatyev, K.; Hagen, C.K.; Munro, P.R.T.; Speller, R.D.; Olivo, A. Method for automatization of the alignment of a laboratory based X-ray phase contrast edge illumination system. Rev. Sci. Instrum. 2013, 84, 083702. [Google Scholar] [CrossRef] [PubMed]
- Endrizzi, M.; Basta, D.; Olivo, A. Laboratory-based X-ray phase-contrast imaging with misaligned optical elements. Appl. Phys. Lett. 2015, 107, 124103. [Google Scholar] [CrossRef] [Green Version]
- Endrizzi, M.; Vittoria, F.A.; Rigon, L.; Dreossi, D.; Iacoviello, F.; Shearing, P.R.; Olivo, A. X-ray Phase-Contrast Radiography and Tomography with a Multiaperture Analyzer. Phys. Rev. Lett. 2017, 118, 243902. [Google Scholar] [CrossRef] [PubMed]
- Endrizzi, M.; Vittoria, F.; Brombal, L.; Longo, R.; Zanconati, F.; Olivo, A. X-ray phase-contrast tomography of breast tissue specimen with a multi-aperture analyser synchrotron set-up. J. Instrum. 2018, 13, C02004. [Google Scholar] [CrossRef]
Figure 1.
Sketch of the set-up: 20 keV monochromatic synchrotron radiation is amplitude-modulated with a narrow slit, traverses the sample and is analysed by a set of apertures just before the detector. The sample is scanned along the vertical (y) direction and a two-dimensional image is built line-by-line. The illumination function is shown in the inset in the bottom left corner.

Figure 2.
Schematic representation of the algorithm.

Figure 3.
Single-shot X-ray (a,c,e) differential phase and (b,d,f) dark-field images of a flower obtained through hierarchical data analysis. To overcome numerical instabilities, the raw intensity images were processed by iteratively decreasing binning: (a,b) used , (c,d) used and (e,f) used . The scale bar in panel (e) is 1 cm.

© 2018 by the authors. Licensee MDPI, Basel, Switzerland. This article is an open access article distributed under the terms and conditions of the Creative Commons Attribution (CC BY) license (http://creativecommons.org/licenses/by/4.0/).
Share and Cite
MDPI and ACS Style
Endrizzi, M.; Vittoria, F.A.; Olivo, A. Single-Shot X-ray Phase Retrieval through Hierarchical Data Analysis and a Multi-Aperture Analyser. J. Imaging 2018, 4, 76. https://doi.org/10.3390/jimaging4060076
AMA Style
Endrizzi M, Vittoria FA, Olivo A. Single-Shot X-ray Phase Retrieval through Hierarchical Data Analysis and a Multi-Aperture Analyser. Journal of Imaging. 2018; 4(6):76. https://doi.org/10.3390/jimaging4060076
Chicago/Turabian StyleEndrizzi, Marco, Fabio A. Vittoria, and Alessandro Olivo. 2018. "Single-Shot X-ray Phase Retrieval through Hierarchical Data Analysis and a Multi-Aperture Analyser" Journal of Imaging 4, no. 6: 76. https://doi.org/10.3390/jimaging4060076
Note that from the first issue of 2016, this journal uses article numbers instead of page numbers. See further details here.