On the Adequacy of API 521 Relief-Valve Sizing Method for Gas-Filled Pressure Vessels Exposed to Fire
by
 , ,
, ,
Anders Andreasen
1,* ,
,
Filippo Borroni
2,
Marcos Zan Nieto
2,
Carsten Stegelmann
1 and
Rudi P. Nielsen
2
1
Process and Technical Safety, Ramboll Energy, Bavnehøjvej 5, 6700 Esbjerg, Denmark
2
Department of Chemistry and Bioscience, Aalborg University Esbjerg, Niels Bohrs Vej 8A, 6700 Esbjerg, Denmark
*
Author to whom correspondence should be addressed.
Safety 2018, 4(1), 11; https://doi.org/10.3390/safety4010011
Submission received: 22 December 2017
/
Revised: 11 March 2018
/
Accepted: 14 March 2018
/
Published: 19 March 2018
Abstract
:In this paper, the adequacy of the legacy API 521 guidance on pressure relief valve (PRV) sizing for gas-filled vessels subjected to external fire is investigated. Multiple studies show that in many cases, the installation of a PRV offers little or no protection—therefore provides an unfounded sense of security. Often the vessel wall will be weakened by high temperatures, before the PRV relieving pressure is reached. In this article, a multiparameter study has been performed taking into consideration various vessel sizes, design pressures (implicitly vessel wall thickness), vessel operating pressure, fire type (pool fire or jet fire) by applying the methodology presented in the Scandpower guideline. A transient thermomechanical response analysis has been carried out to accurately determine vessel rupture times. It is demonstrated that only vessels with relatively thick walls, as a result of high design pressures, benefit from the presence of a PRV, while for most cases no appreciable increase in the vessel survival time beyond the onset of relief is observed. For most of the cases studied, vessel rupture will occur before the relieving pressure of the PRV is reached.

1. Introduction
In order to protect pressure vessels against overpressure in case of a fire scenario, a pressure relief valve (PRV/PSV) is usually installed as a secondary barrier to protect against vessel rupture, further escalation and potential catastrophic events. The installation of a fire PRVin both upstream and downstream industries is according to codes, standards, recommendations and best practices [1,2,3].
When a gas-filled vessel is subject to an external fire, the vessel material heats up. Part of the heat is transferred to the gas inventory. When the inventory is heated up, the gas expands, and the pressure increases. At some point, the pressure reaches the set pressure of the pressure relieving valve, and it will open. If properly sized, the relief valve will protect against further increases in pressure.
The API standard 521 provides guidance for the sizing of a PRV for a gas-filled vessel [3]. The sizing equation is very simple and assumes the release rate is at its maximum, when the vessel wall material has reached its maximum temperature (assumed to be 595 °C for carbon steel), and the gas is at its relieving temperature, i.e., this is assumed to be the governing driving force for the heat transfer.
The adequacy of the API sizing equation has been questioned in a number of references [4,5,6]. API 521 itself highlights some potential issues with the sizing methods and recommends that more rigorous methods should be applied, if the underlying assumptions are not applicable.
Due to poor heat transfer between the vessel inner wall and the gas inventory, the vessel material will heat up relatively more than the gas. At some point, the vessel wall temperature has increased to a point, where it is weakened below the rupture stress limit.
Wong [6] has addressed this issue and argues that this will occur before the internal gas pressure reaches the set pressure of the PRV due to local hot spots. No proof of the points made is provided other than arguments. Heitner et al. [5] has performed transient analysis of a gas-filled vessel thermomechanical response when subjected to fire heat loads from a pool fire. Their chosen example showed that relieving conditions are reached after 6 min and that vessel failure will occur between 19–27 min depending on the chosen relief valve size and material properties. Their results show that in using the API 521 sizing method, the relief valve will be grossly oversized. They also compare the heat load implicitly assumed by the API 521 sizing for a gas-filled vessel with that of a liquid-filled vessel with the same heat transfer area. The API sizing for a liquid-filled vessel (where the relief is vapor generated by evaporation of the liquid phase) scales the total heat transfer rate with the surface area raised to the power of 0.82. The authors notice that proper sizing of a relief valve for a gas-filled vessel using transient analysis results in an effective heat transfer rate comparable to using the same area scaling as for a liquid-filled vessel. The authors state this may be a coincidence.
Nylund [4] has also carried out a transient analysis of the thermomechanical response of a gas-filled vessel subjected to a fire heat load. Nylund investigates both the effect of local heat loads due to different sizes of impinging jet fires as well as the full engulfment of a pool fire. The result for the jet fire heat load shows that for a small impingement area, the total heat load is not sufficient to raise the pressure above the relief valve set pressure nor above the stress level for a vessel rupture. For a certain size of jet flame, the vessel pressure increases more, and vessel failure will occur between 4–8 min—long before the PRV set pressure is reached. For the pool fire case, where the pressure increases, vessel failure occurs much more rapidly—just after 4 min after the start of the fire, when no PRV is installed. A properly sized relief valve only extends the survival time by less than 1 min. The conclusion by Nylund is that a PRV offers no protection of a vessel subjected to a fire heat load.
The authors of the present paper have recently conducted a study on the effect of the presence of a PRV for vessels containing both gas and liquid. A number of different representative pressure vessels, such as e.g., three-phase separators, suction scrubbers etc. were investigated by transient analysis of the thermomechanical response. In cases where the unwetted part was subjected to heat loads from either a small or a large jet fire, no real difference in vessel survival time was observed whether a PRV was installed or not. For a pool fire heat load, the vessel survival time could be extended significantly in some cases while in other cases not at all or only by a few minutes [7].
When reviewing the literature on the subject, two questions arise:
- Is the API 521 sizing too conservative leading to too large PRVs? Thus, increasing installation costs due to larger piping and valves—but even more importantly an overly large valve—may lead to chatter, jeopardizing the integrity of the valve due to vibrations, ultimately leading to failure of the PRV.
- Does the PRV really offer protection of the vessel or is it just a false sense of security? This question could also be posed as; in which situations does the PRV actually offer real protection of the vessel?
The latter has been addressed in general terms by Dalzell and Chestermann [8]. They argue that safety systems should only be installed, if they provide a safety benefit, and not merely because it is recommended in standards, or because it is the normal industry practice.
In this paper, we will address the above questions by performing a parameter study of different vessel sizes designed for different pressures and operated at different pressures, where the thermomechanical response is calculated using a transient analysis by following the most recent industry best practices introduced by the Scandpower guideline [9]. To the best of our knowledge a broad parameter study of gas filled vessel thermomechanical response to external fire has not previously been published. This facilitates more general conclusions, compared to previous studies where the vessel conditions only cover a limited range in vessel size, design pressure, operating conditions and fire type.
While the methodology introduced in the Scandpower guideline [9] originally targeted offshore installations on the Norwegian continental shelf [10], this methodology is now advocated for more widespread use via guidelines from the Petroleum Institute in the UK [11,12], and a similar methodology has been incorporated in the API 521 standard [3,13].
2. Methods
2.1. API 521 Relief Valve Sizing
The API 521 standard [3] includes a formulae for calculating the relief capacity, W (lb/h), for a gas-filled vessel subjected to fire heat loads (pool fires):
where,
- A′: Fire exposed area of vessel (in2)
- : Vessel pressure at relieving conditions including allowed overpressure (psi)
- M′: Relative molecular mass of gas
- TW: Maximum vessel wall temperature (°R). For carbon steel plates, this is normally set to 1100 °F (593 °C)
- T1: Vessel inventory temperature at relieving conditions (°R)
The temperature at relieving conditions is calculated by:
where,
- Tn: Normal operating temperature (°R)
- : Normal operating pressure (psi)
Following API 520 Part 1 [14], the required relief area for critical gas service can be found from:
where,
- A: Required relief valve area (in2)
- Kb: Back pressure correction factor. Assumed equal to 1
- Kd: Effective discharge coefficient. Assumed to be 0.975
- Kc: Combination correction factor. Assumed to be 1 (no rupture disc installed)
- Z: Compressibility of the gas
- M: Molecular mass of gas (lbm/lb-mole)
C is a function of the ratio of the ideal gas specific heats (k = Cp/Cv) of the gas or vapor at inlet relieving temperature.
The API formulae for relief capacity of gas-filled vessels exposed to fire heat loads is based on the derivation made by Duggan, Gilmour and Fisher [15] and a brief overview of the derivation is provided in [16]. The derivation applies a number of simplifying assumptions:
- Ideal gas law. The assumption that an ideal gas inside the vessel is used several times during the derivation of the relief rate equation. The relieving temperature calculation assumes ideal gas behaviour, and the density of the gas is assumed to be that of an ideal gas. However, at elevated temperatures, the deviation between ideal gas and real gas decreases, and this assumption may not be severe.
- Gas similar to air. The assumption that gas viscosity is similar to that of air can give relief rates of up to a factor of two for other gases compiled in [15].
- The gas properties relevant to the heat transfer from the hot vessel wall to the gas used in the derivation should in reality be evaluated at the film temperature, (Twall − Tgas)/2 [17]. However, thermal conductivity, heat capacity, viscosity and gas expansion factors, which all appear in the applied relation for the heat transfer coefficient for natural convection, are either evaluated at the gas temperature, or at 20 °C.
- Assumed Twall. The assumption of a maximum wall temperature of 1100 °F (593 °C) may not be justified. Depending on the steel grade, the vessel may fail at temperatures below 1100 °F [5], and in that case the sizing becomes conservative. Furthermore, many relief devices are limited to 1000 °F (538 °C) [5,6], thus the assumptions in the capacity calculation exceeds that of the relief valve design.
- Steady state. It is assumed that the relief process is a steady-state process in the derivation of the formulae. This is far from reality. Before the relieving pressure is reached, the temperature of the vessel material and the gas inventory increases steadily, and pressure builds up. When the relief valve opens, the vessel material continues to heat up, and the temperature difference between the wall and the gas is reduced.
- Vessel insulation is not taken into account.
2.2. Fire Heat Flux Modelling
The fire heat flux depends on various parameters such as the type of fire (pool fire, jet fire), congestion, relief rate (for jet fire), engulfed/impinged area etc. In this study we will, for simplicity, consider two scenarios: a pool fire, where the investigated vessel is fully engulfed in the pool fire flames and a large jet fire also resulting in full engulfment. The heat loads for the two types of fire are adapted from the Scandpower guideline [9] and the NORSOK S-001 [10] standard and are shown in Table 1. The heat fluxes are incident heat fluxes.
The global average (background) heat load is used for calculation of the pressure inside the vessel as a function of time. The local heat load is applied to a small fraction of the total surface area and contributes minimally to the global average heat load and the pressure profile.
The net heat flux (both local and global) is calculated based on the Stefan–Boltzmann (S–B) fire equation:
where,
- : heat absorbed by a segment (W/m2)
- σ: Stefan–Boltzmann constant, 5.67 × 10⁻⁸ (W/m2 K4)
- Tf: flame temperature (K)
- Tamb: ambient temperature (K)
- hf: flame convective heat transfer coefficient (W/m2 K)
- αs: surface absorptivity
- εs: surface emissivity
- εf: flame emissivity
- Ts: segment temperature (K) (time dependent)
The heat transfer is calculated based on radiation and convection from the flame. The heat transfer will thus decrease, when the segment temperature increases due to back radiation and lower temperature differences between the hot gas/flame and the outer surface of the vessel. Additionally, a term accounting for heat convection to the inventory inside the vessel is also present.
The flame temperature and gas temperature are assumed to be equal, as it is assumed that each segment is engulfed by the fire. The convective heat transfer coefficient, hf, is set to 100 W/m2 K for a jet fire, and 30 W/m2 K for a pool fire according to Scandpower recommendations.
The input values for the heat flux equation, such as temperatures and emissivities, are based on recommendations from Scandpower [9,18]. The flame temperature is calibrated using the following equation as recommended by Scandpower for the incident heat flux given in Table 1:
Applying and solving this equation for the flame temperature, the following temperatures are found for the various incident heat fluxes, cf. Table 2. Table 2 also includes the applied absorptivity and emissivities. The ambient temperature has been assumed to be 25 °C, for the purpose of flame temperature calibration. For more elaboration on the ranges of input parameters and heat fluxes, refer to refs. [3,11,18].
For simplicity, a distinction has not been made between the background heat load for pool fire and jet fire. For both fire scenarios, a convective heat transfer coefficient of 30 W/m2 K has been applied. It is found that the initial heat flux is the governing parameter. The applied value of emissivity and convective heat transfer coefficient is less important for the vessel pressure as a function of time [19].
2.3. Vessel Rupture Criteria
It is assumed that when the von Mises stress, σe (MPa), exceeds the allowable tensile strength of the material, allowable tensile strength (ATS) (MPa), rupture will occur, i.e., when σe > ATS.
The ATS is calculated as [9]
where ks and ky are safety factors and Ultimate Tensile Strength (UTS) is the ultimate tensile strength (MPa). In this study, a value of 0.85 is used for ks, and a value of 1 is applied for ky. See ref. [9] for more details. The von Mises stress is calculated by:
where
- σa: Longitudinal stress due to the external force. Assumed to be 30 MPa [9]
- D: Outside diameter
- d: Inside diameter
- p: Gas pressure (MPa)
2.4. Simulation Software and Post-Processing
The dynamic vessel pressure response to the heat input calculated via the Stefan–Boltzmann fire heat flux equation is performed using the depressurisation utility provided with the Aspen HYSYS® (V8.3, Aspen Technology, Inc., Bedford, MA, USA). The software accounts for both heat and mass balances for the control volume in question. Real gas effects are accounted for by employing the Peng-Robinson equation of state (EoS) [20]. The gas phase viscosity and heat conductivity are calculated using a modified National Bureau of Standards (NBS) method of Ely and Hanley [21].
The heat input from the S–B equation is applied to the external surface of the vessel with the vessel surface temperature being continuously updated during the simulation, as the vessel material heats up. Heat transfer through the vessel wall via conduction as well as convective heat transfer between the vessel inner wall to the gas is considered. The inventory of the vessel is considered as a homogeneous fluid, i.e., no stratification of energy/temperature [22]. The convective heat transfer in HYSYS® is based on the following correlations for natural convection (see e.g., [17])
where,
- Nu: Nusselt number
- Gr: Grashof number
- Pr: Prandtl number
- k: Thermal conductivity of the gas (W/m K)
- L: Characteristic length (m) (defined internally by simulation software)
- a: Empirical coefficient, selected by simulation software
- m: Empirical exponent, selected by simulation software
While several experiments have been performed on pressure vessels with both gas and liquid (two-phase) subjected to fire exposure [23,24,25], to the best of our knowledge no experiments have been reported for pressurized gas-filled steel vessels subjected to fire heat loads. Results have been reported for composite gas cylinders [26,27], but the relevant material properties for correctly modelling the conductive heat transfer may be uncertain, and thus the experiments have not been considered in this study. In order to validate the heat transfer model used in the utilized simulation software, an experiment reported in [28,29] is used as a high level validation. The experiment considers a pressure vessel containing gas (N2) being blown down via an orifice and has been used in the validation of various codes [28,29,30]. The heat transfer is from the ambient stagnant air to the outer vessel wall, through the vessel wall and finally from the vessel inner wall to the gas inventory via natural convection. See the results section.
The relief valve modelled has a linear characteristic between the set pressure and an arbitrary pressure set fully open (in this case 110% of the set pressure). The actual choice of relief valve action is not considered to be pivotal for the points made in the present article. The purpose of the valve is simply to maintain a constant pressure inside the vessel, once relieving conditions are reached—assuming that the valve is not undersized.
In order to calculate the thermal response of the local heat load applied, a post-processing step is applied using the pressure profile calculated with HYSYS®. In this step, the local heat load is applied to an element of the vessel wall, and at the same time heat loss from this element to the gas inventory is accounted for. To be able to calculate the convective heat transfer coefficient for the internal heat transfer, temperature and pressure-dependent gas properties were derived using HYSYS®.
The gas convective heat transfer coefficient for the local hot spot to the inside of the vessel, hg, has been calculated and incorporated to the vessel wall heat balance.
where,
- Qnet: The net heat load to an element of the vessel wall (W/m2)
- Qconv: The heat loss from a vessel wall element to the gas inventory by convection (W/m2)
The convective heat loss is calculated by
where
- Tg: Temperature of the gas inventory (K)
- h: Inside gas convective heat transfer coefficient (W/m2 K)
The assumed geometry has been that of a vertical plate, as is the wall in a vertically-orientedvessel. The Nusselt number is calculated for the case of a vertical plate. The corresponding correlation is shown next [31]:
The Nusselt number is determined by means of the Grashof, Prandtl and Rayleigh dimensionless parameters, as seen below [31]:
where,
- g: Gravitational acceleration (m/s2)
- β: Gas thermal expansion coefficient
- Ts: Internal surface temperature (K)
- Tg: Gas inventory temperature (K)
- ν: Gas kinematic viscosity (m2/s)
- Cp: Gas specific heat capacity (J/kg K)
- μ: Dynamic viscosity (kg/m s)
- L: Characteristic length set equal to the vertical vessel tan-to-tan height (m)
2.5. Calculation Workflow
- The calculation workflow begins by calculating the pressure response due to the global heat flux from the S–B equation. This is done by integration of the vessel energy and mass balances using the chosen simulation software. The calculations are performed for a sufficient period in order for the relief valve to be activated. It is verified that the selected relief valve has sufficient capacity to keep the pressure below 121% of the set pressure/assumed design pressure.
- The local vessel wall temperature is performed by a local heat balance employing a simple approach using the flame temperature calibrated for the local heat loads. Both pool fire and jet fire temperature responses are calculated.
For a chosen time step Δt, the temperature in the next step (i + 1) is calculated as:
The increase in temperature is estimated as:
where,
- : Density of steel (kg/m3)
- : Vessel wall thickness (m)
- : specific heat capacity of steel (J/kg K)
The steel density is assumed to be invariant. Both the heat flux and the heat capacity vary with the vessel surface temperature. In order to keep the scheme explicit, the heat capacity in the next time step is approximated by (Ts,i + 25 K) [32]. A time step of 30 s is applied in all calculations. Once the local temperature of the vessel wall is calculated, the ATS is evaluated based on the temperature-dependent UTS data. The von Mises stress can be calculated based on the calculated pressure profile.
3. Results and Discussion
3.1. Validation
In order to validate the simulation code, experiment I1 from ref. [29] is used. The experiment is a blowdown of a vertically oriented cylindrical vessel with flat ends. The vessel length is 1.524 m, the inside diameter is 0.273 m and the wall thickness is 25 mm. Vessel contents and initial conditions: 100% N2 at 150 bar, 288.1 K. Ambient temperature is 288.1 K. The blowdown orifice diameter is 6.35 mm. The results are shown in Figure 1. The discharge coefficient of the orifice (relief type) has been adjusted to 0.75 in order to match the vessel pressure profile. The back pressure is set to atmospheric conditions.
As seen from Figure 1, the calculations compare well with the experimental results. The calculated temperature of the bulk vapor is within the experimental range of measured temperature at all times during the simulation. It is also noted that the minimum temperature is reached at the same time as in the experiments. The calculated vessel inner wall temperature does not decline as rapidly as the experiments—but from around a calculation time of 60 s, the temperature is within the experimentally observed inner wall temperature. If the calculations had been performed at adiabatic conditions, the lack of heat transfer would result in a monotonically decreasing temperature of the bulk vapor. The increase in temperature after t = 40 s is due to heat transfer from the ambient surroundings through the vessel wall and natural convection at the inner wall surface. Given the absence of other validation experiments, it is concluded that the heat transfer model applied in the simulation tool is of sufficient quality to provide accurate enough results for further use.
3.2. Calculation and Simulation Matrix
A calculation matrix has been set up in order to explore relief valve sizing using the API 521 method and for further analysis applying dynamic simulation with vessel rupture calculations performed by post-processing the dynamic simulation results. The matrix includes four different vertical vessel sizes all with an L/D ratio of 3 applied. The calculation matrix is shown in Table 3.
For each vessel size, three different design pressures are investigated, and for each design pressure two operating pressures are investigated. The low operating pressure is set to 1/3 of the design pressure, and the “normal” operating pressure is set to 5, 10 and 20 bar below the design pressure for 15, 45 and 135 bar design pressure, respectively. The term operating pressure is used for the vessel pressure at the start of the calculations. This can be the operating pressure, or it can the settle-out pressure [33] for a blocked in volume.
For each combination of design pressure and vessel diameter, the vessel thickness is calculated according to the ASME Boiler and Pressure Vessel code [1] for circumferential stress for a thin-walled vessel.
where,
- P: Design pressure (MPa gauge)
- D: Diameter of vessel (m)
- S: Maximum allowable stress (MPa)
- E: Joint efficiency (assumed 1.0 in this study)
The allowed stress is set to 3.5 times lower than the UTS, and carbon steel is assumed with an allowable stress of 160 MPa (i.e., an assumed UTS of 560 MPa). A corrosion allowance of 3 mm is included, and a minimum vessel thickness of 10 mm is assumed regardless of the result of the vessel thickness calculation.
As seen from the API 521 relief valve sizing in Figure 2, it is generally observed that the larger the surface area, the higher is the relief area required. The relief rate scales linearly. It is also observed that the higher the design/relief pressure, the smaller is the area required due to larger relief capacity per unit area of the relief valve. The latter is valid for the chosen margins from the operating pressure to the design pressure.
In all dynamic simulations, a D-orifice has been found to be sufficient in order to keep the vessel pressure below 121% of the set pressure. This is significantly smaller than many of the sizes found using the API 521 sizing formulae, where up to G-orifices were calculated.
3.3. Dynamic Thermomechanical Vessel Response and Rupture
For dynamic simulations with rupture calculations, the material properties in terms of tensile strength as a function of temperature is taken from the Scandpower guideline [9] for the carbon steel type 360 LT. The curve has been scaled relatively in order to give a value of 560 MPa @ 100 °C (assumed design temperature). The resulting tensile strength as a function of temperature is shown in Figure 3.
The results of the dynamic thermomechanical vessel response are summarized in Table 4. Included is the calculated relief temperature, the time to relief, and the time to rupture for both pool fire and jet fire heat loads. The calculated relief temperature is the temperature, when the relief valve starts to lift. This is coinciding with the design/set pressure and therefore somewhat lower than, what is predicted by the API 521 relief sizing, which has assumed that relieving conditions are at 121% of the design/set pressure. Included in the table in the last column is also an indication if the PRV has reached the specified set pressure before vessel rupture occurs. Since in the case of a jet fire, it has been proved that the vessel rupture happens before relief in all but one of the cases, the “Relief Valve Activation” column is referred to as the pool fire case scenario.
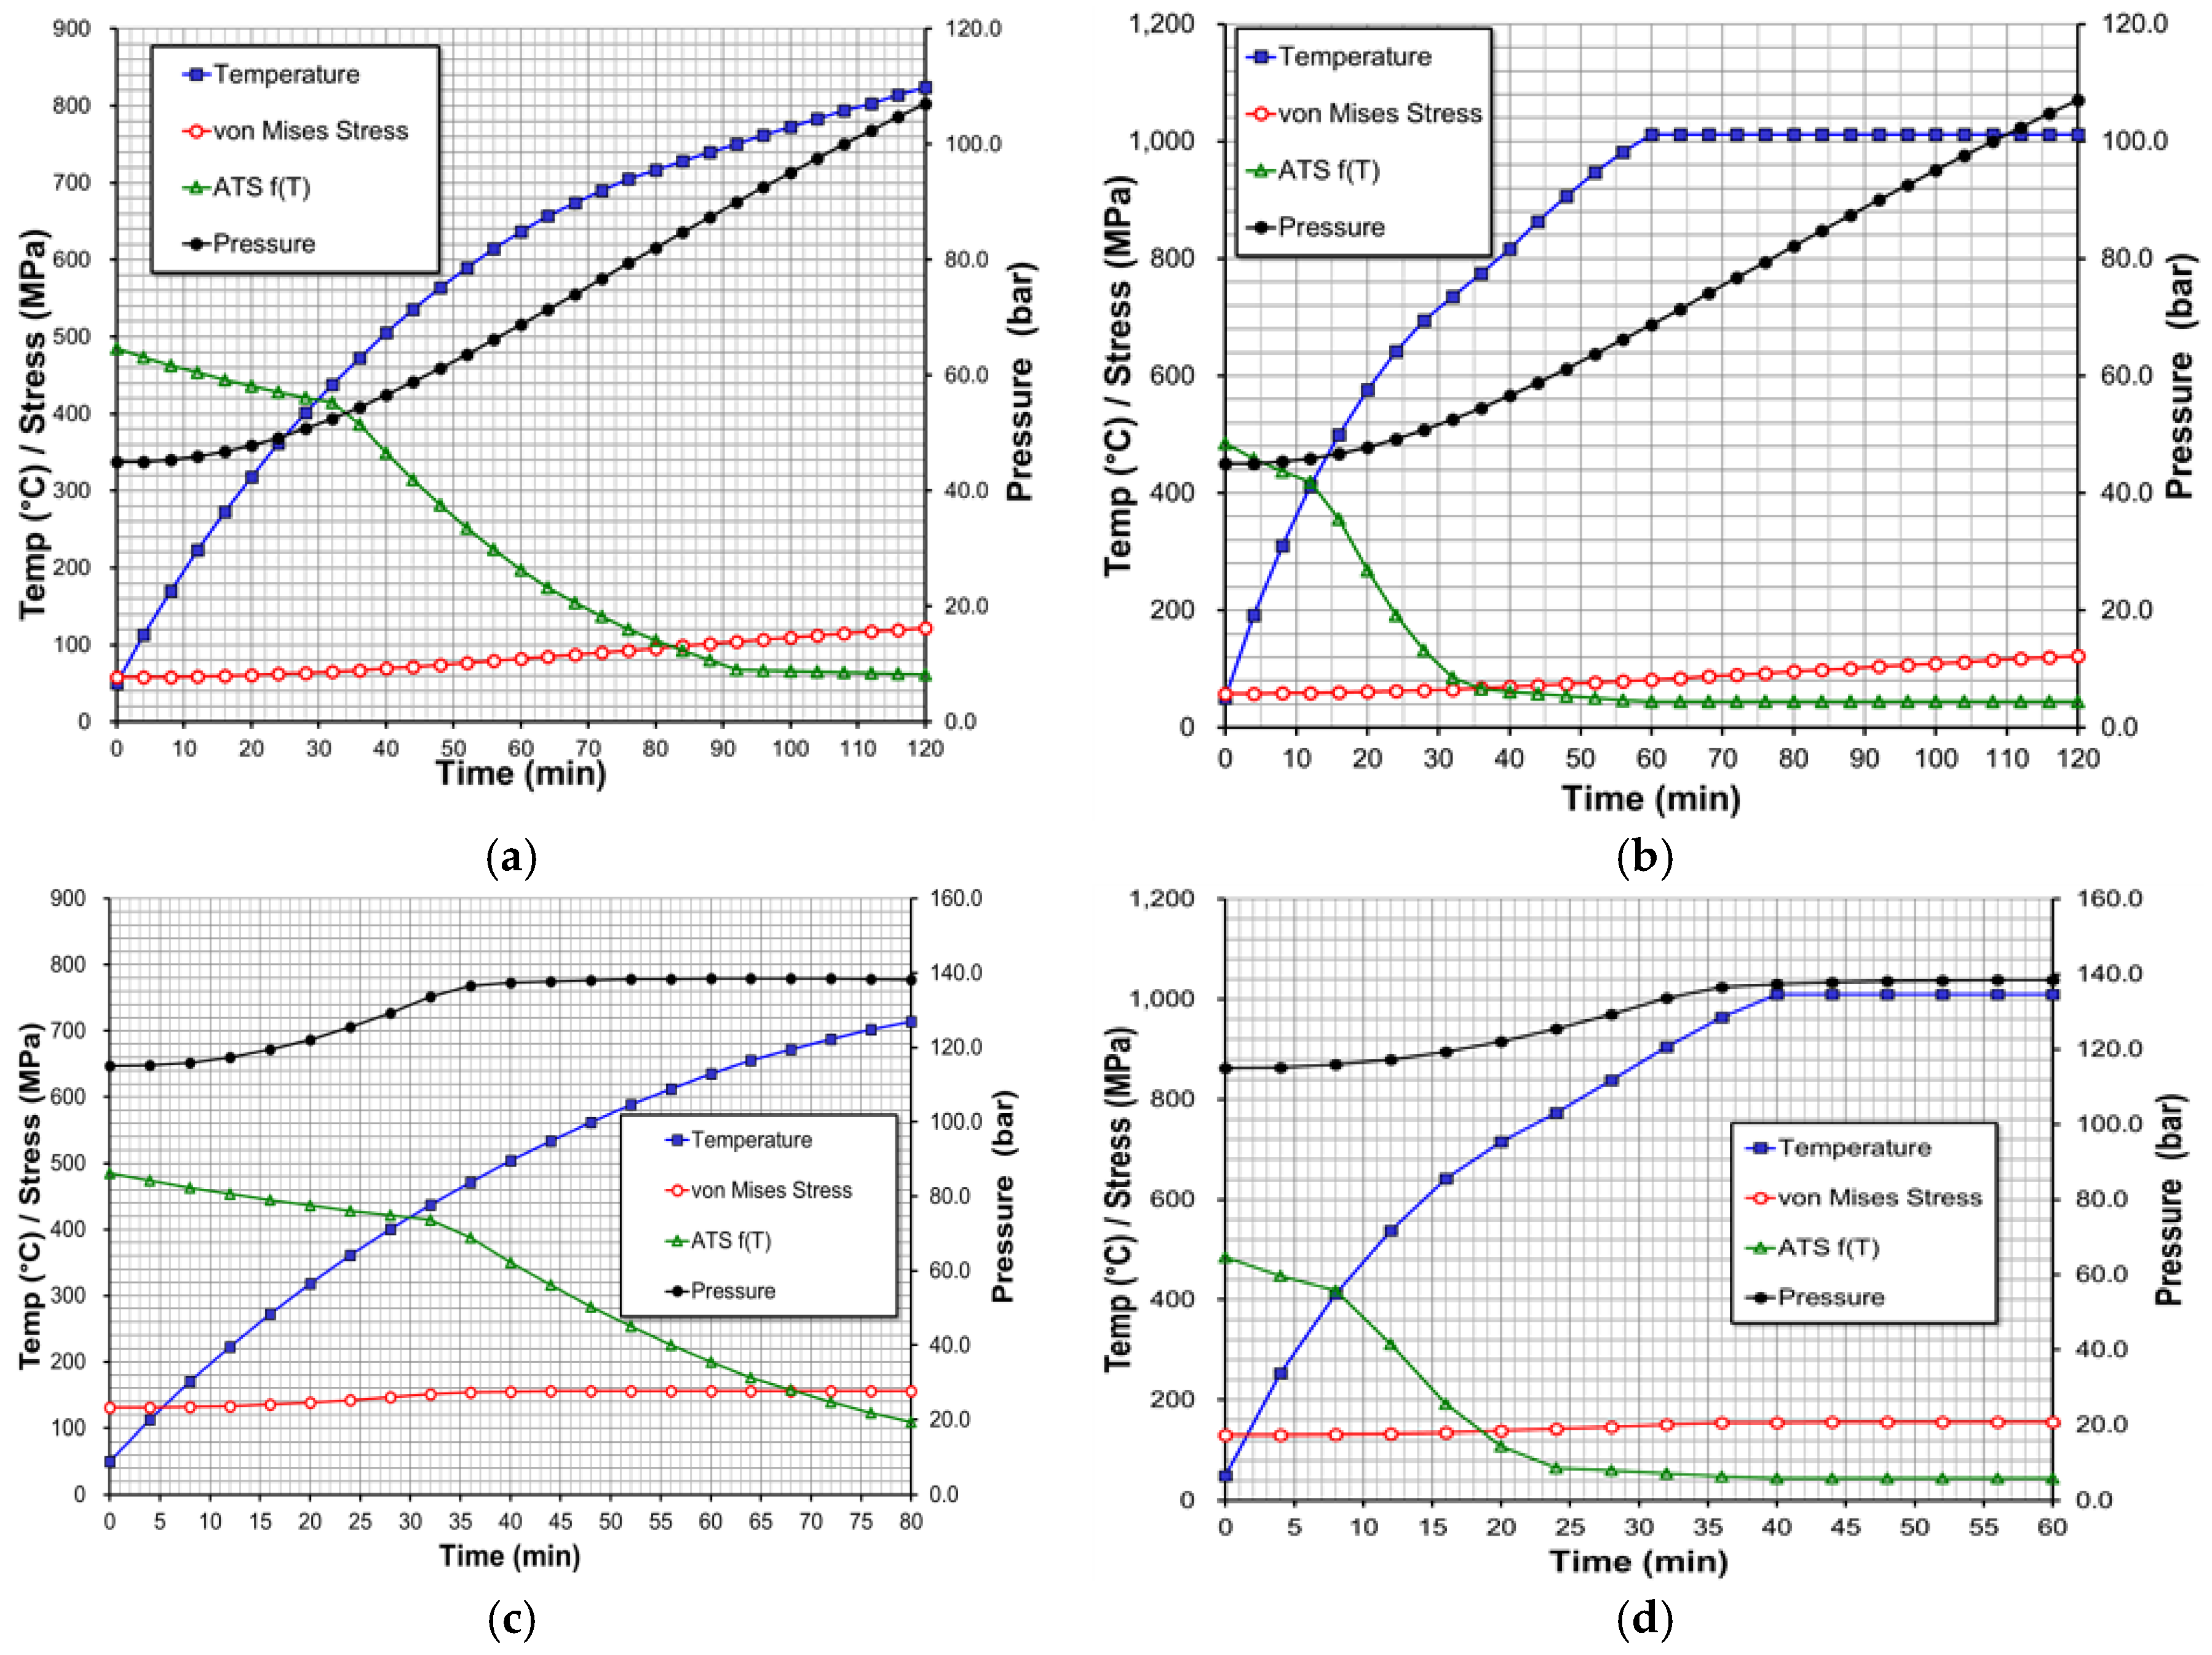
Example results for some of the vessel responses in terms of pressure, maximum wall temperature (local heat load applied), von Mises stress and allowable tensile stress as a function of temperature are shown in Figure 4 and Figure 5.
In Figure 4, the results for the vessel with a 0.5 m diameter and 45 bar design pressure are shown both with normal and low operating pressure and for both pool and jet fire. Figure 5 displays the results for the 3-m diameter vessel with a 135 bar design pressure.
As seen from Figure 4c, for the normal operating pressure (35 bar) and pool fire heat loads, rupture occurs slightly before the pressure has reached the relief valve set pressure (1 min).Thus, for a pool fire case which is the applicable fire scenario for API 521 PRV sizing [3], the presence of a PRV does not extend the survivability of the vessel. With a low operating pressure (15 bar) as a starting point cf. Figure 4a, vessel rupture occurs long before the pressure has increased to the relieving pressure. When a jet fire heat load is applied cf. Figure 4b,d, rupture generally occurs at an earlier time compared to a pool fire heat load, and in both cases rupture occurs when the pressure has just started to increase. For the illustrated case, the presence of a relief valve does not improve the survival of the vessel.
From Figure 5c, it is seen that for a pool fire heat load with a normal operating pressure (115 bar) as a starting point, the presence of a relief valve actually extends the survival time of the vessel. The relieving conditions are reached after 33 min, but rupture occurs after 68 min. Had the relief valve not been installed, rupture would have occurred earlier due to the steadily increasing pressure. In this case, the relief valve fulfils its purpose. For a low operating pressure (45 bar) as a starting point cf. Figure 4a, rupture occurs well before the relieving conditions are reached, and this also applies for the two jet fire cases cf. Figure 4b,d.
The results shown for illustrative purposes in Figure 4 and Figure 5 display some general trends, which are applicable for all the investigated cases. For low operating pressure compared to the design/PRV set pressure, vessel rupture occurs, before the relieving pressure is reached. For a jet fire heat load, rupture also occurs well before the relieving pressure has been reached (except for a few cases, where rupture occurs coincident with relief, or very shortly after). Also, a higher design pressure and thereby a thicker vessel wall extends the survival time of the vessel.
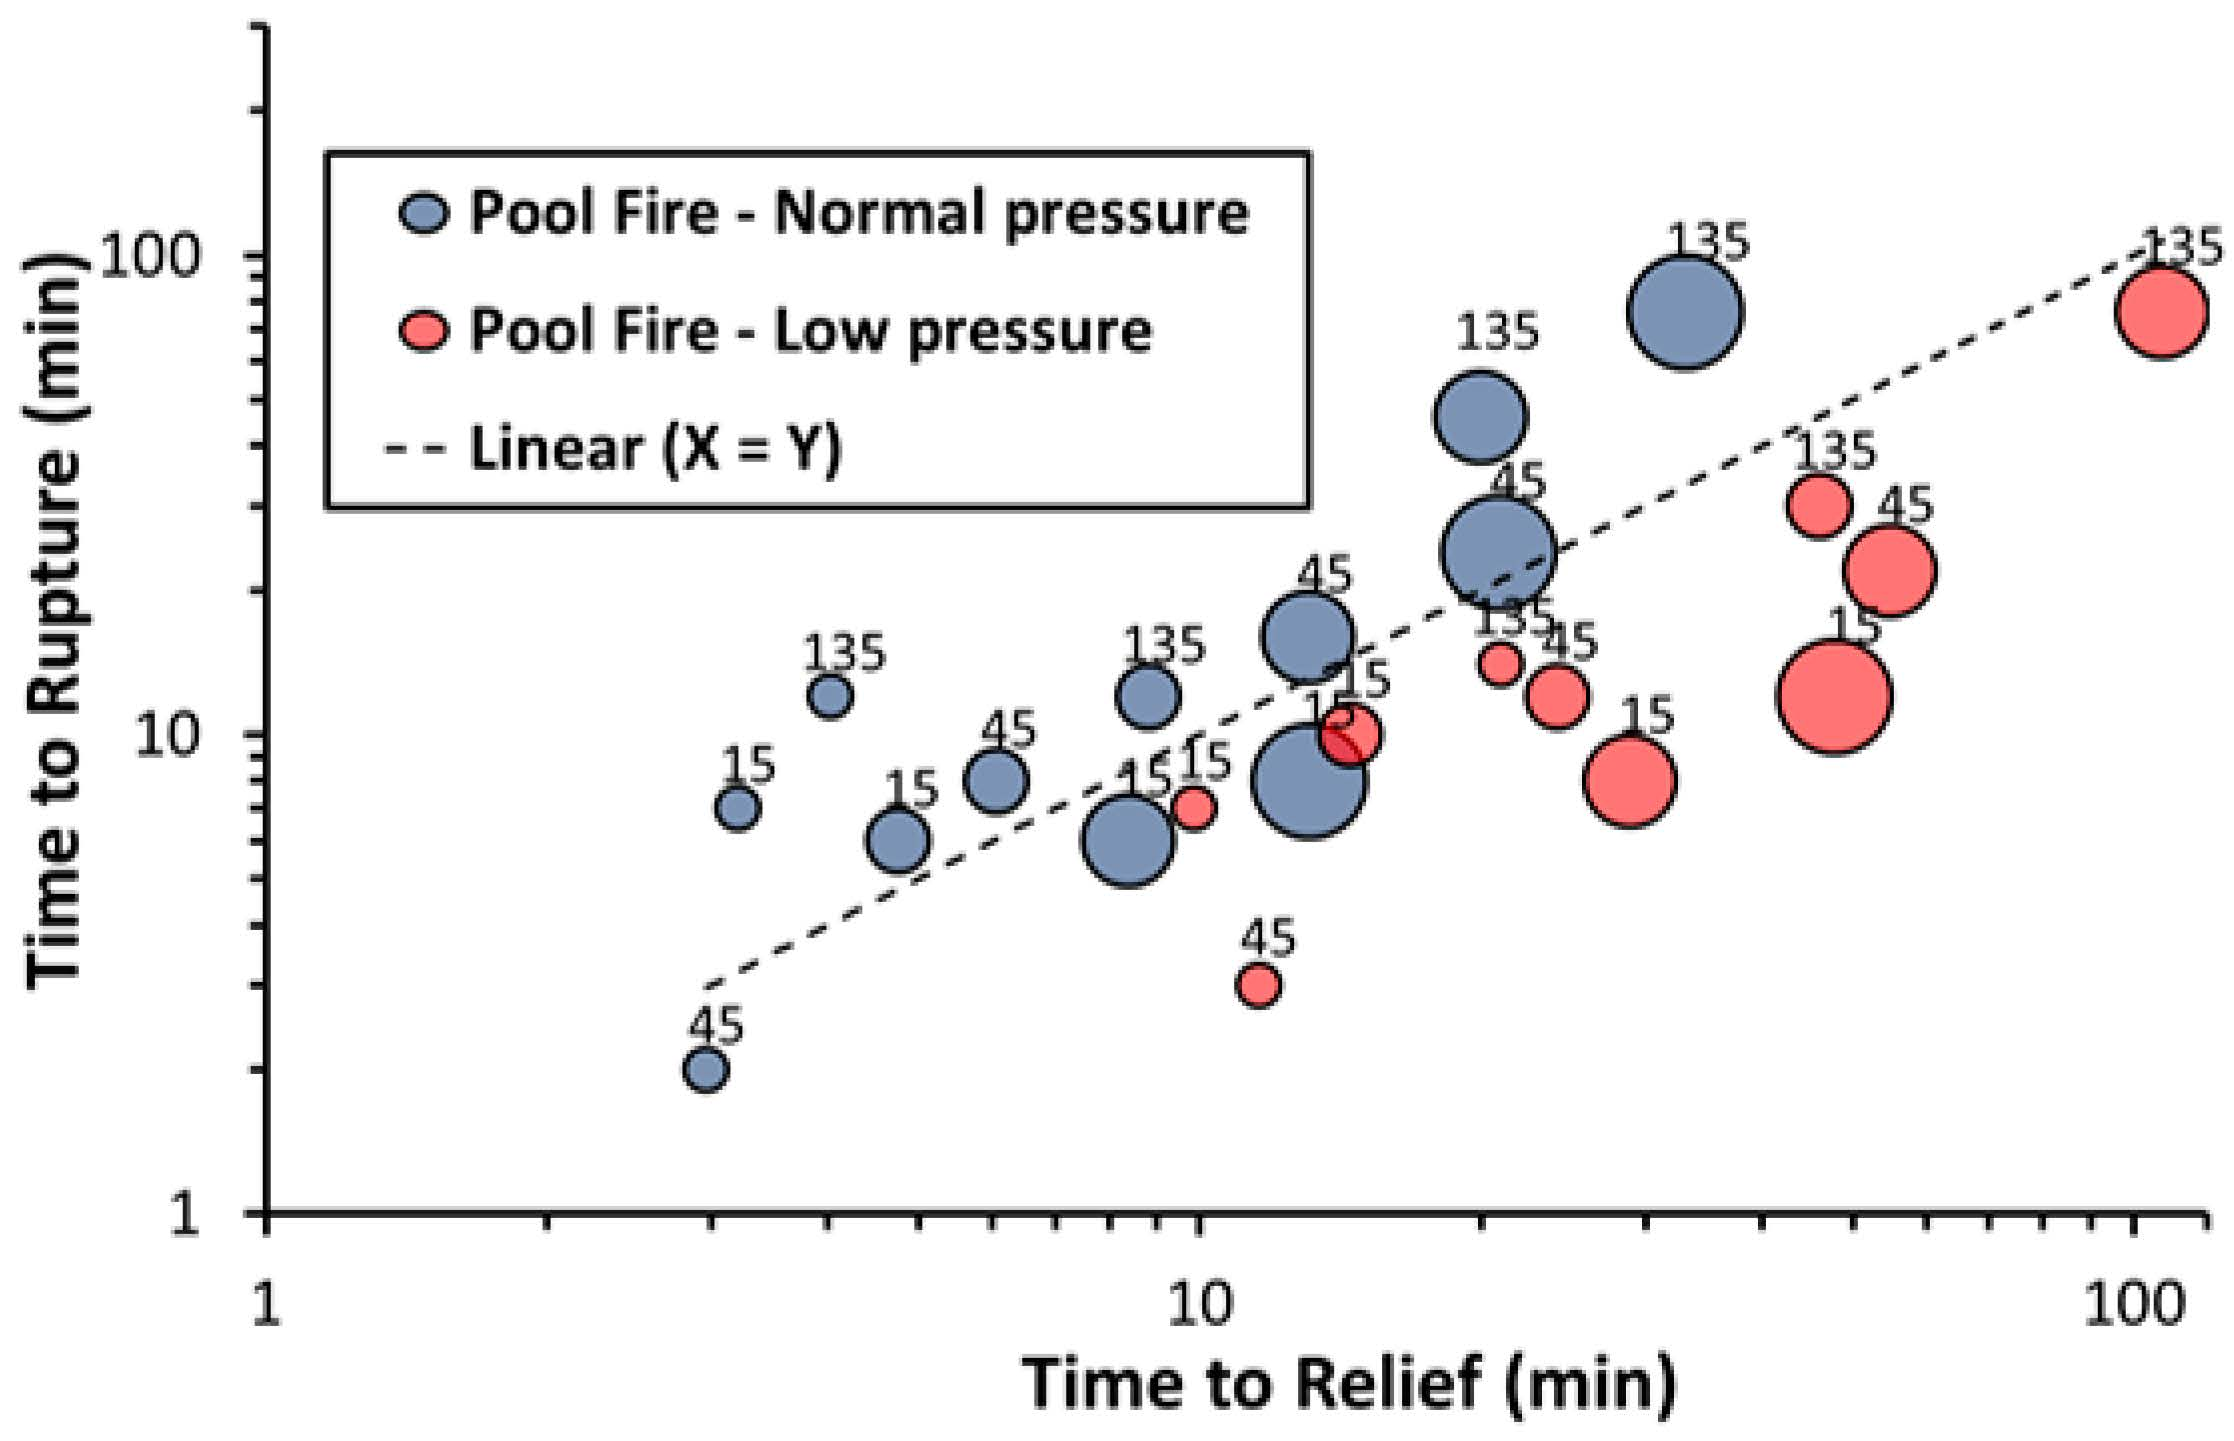
Results for all cases in terms of vessel time to relief and time to rupture for both pool fire and jet fire heat loads are summarized in Figure 6 and Figure 7, respectively. For each case, the bubble size indicates the vessel size and the corresponding data label shows the design pressure. For each heat load, the results are grouped into normal and low operating pressure. Points below the y = x line are cases, where rupture occurs, before the PRV opens, and points above the line are cases, where rupture occurs after the PRV opens.
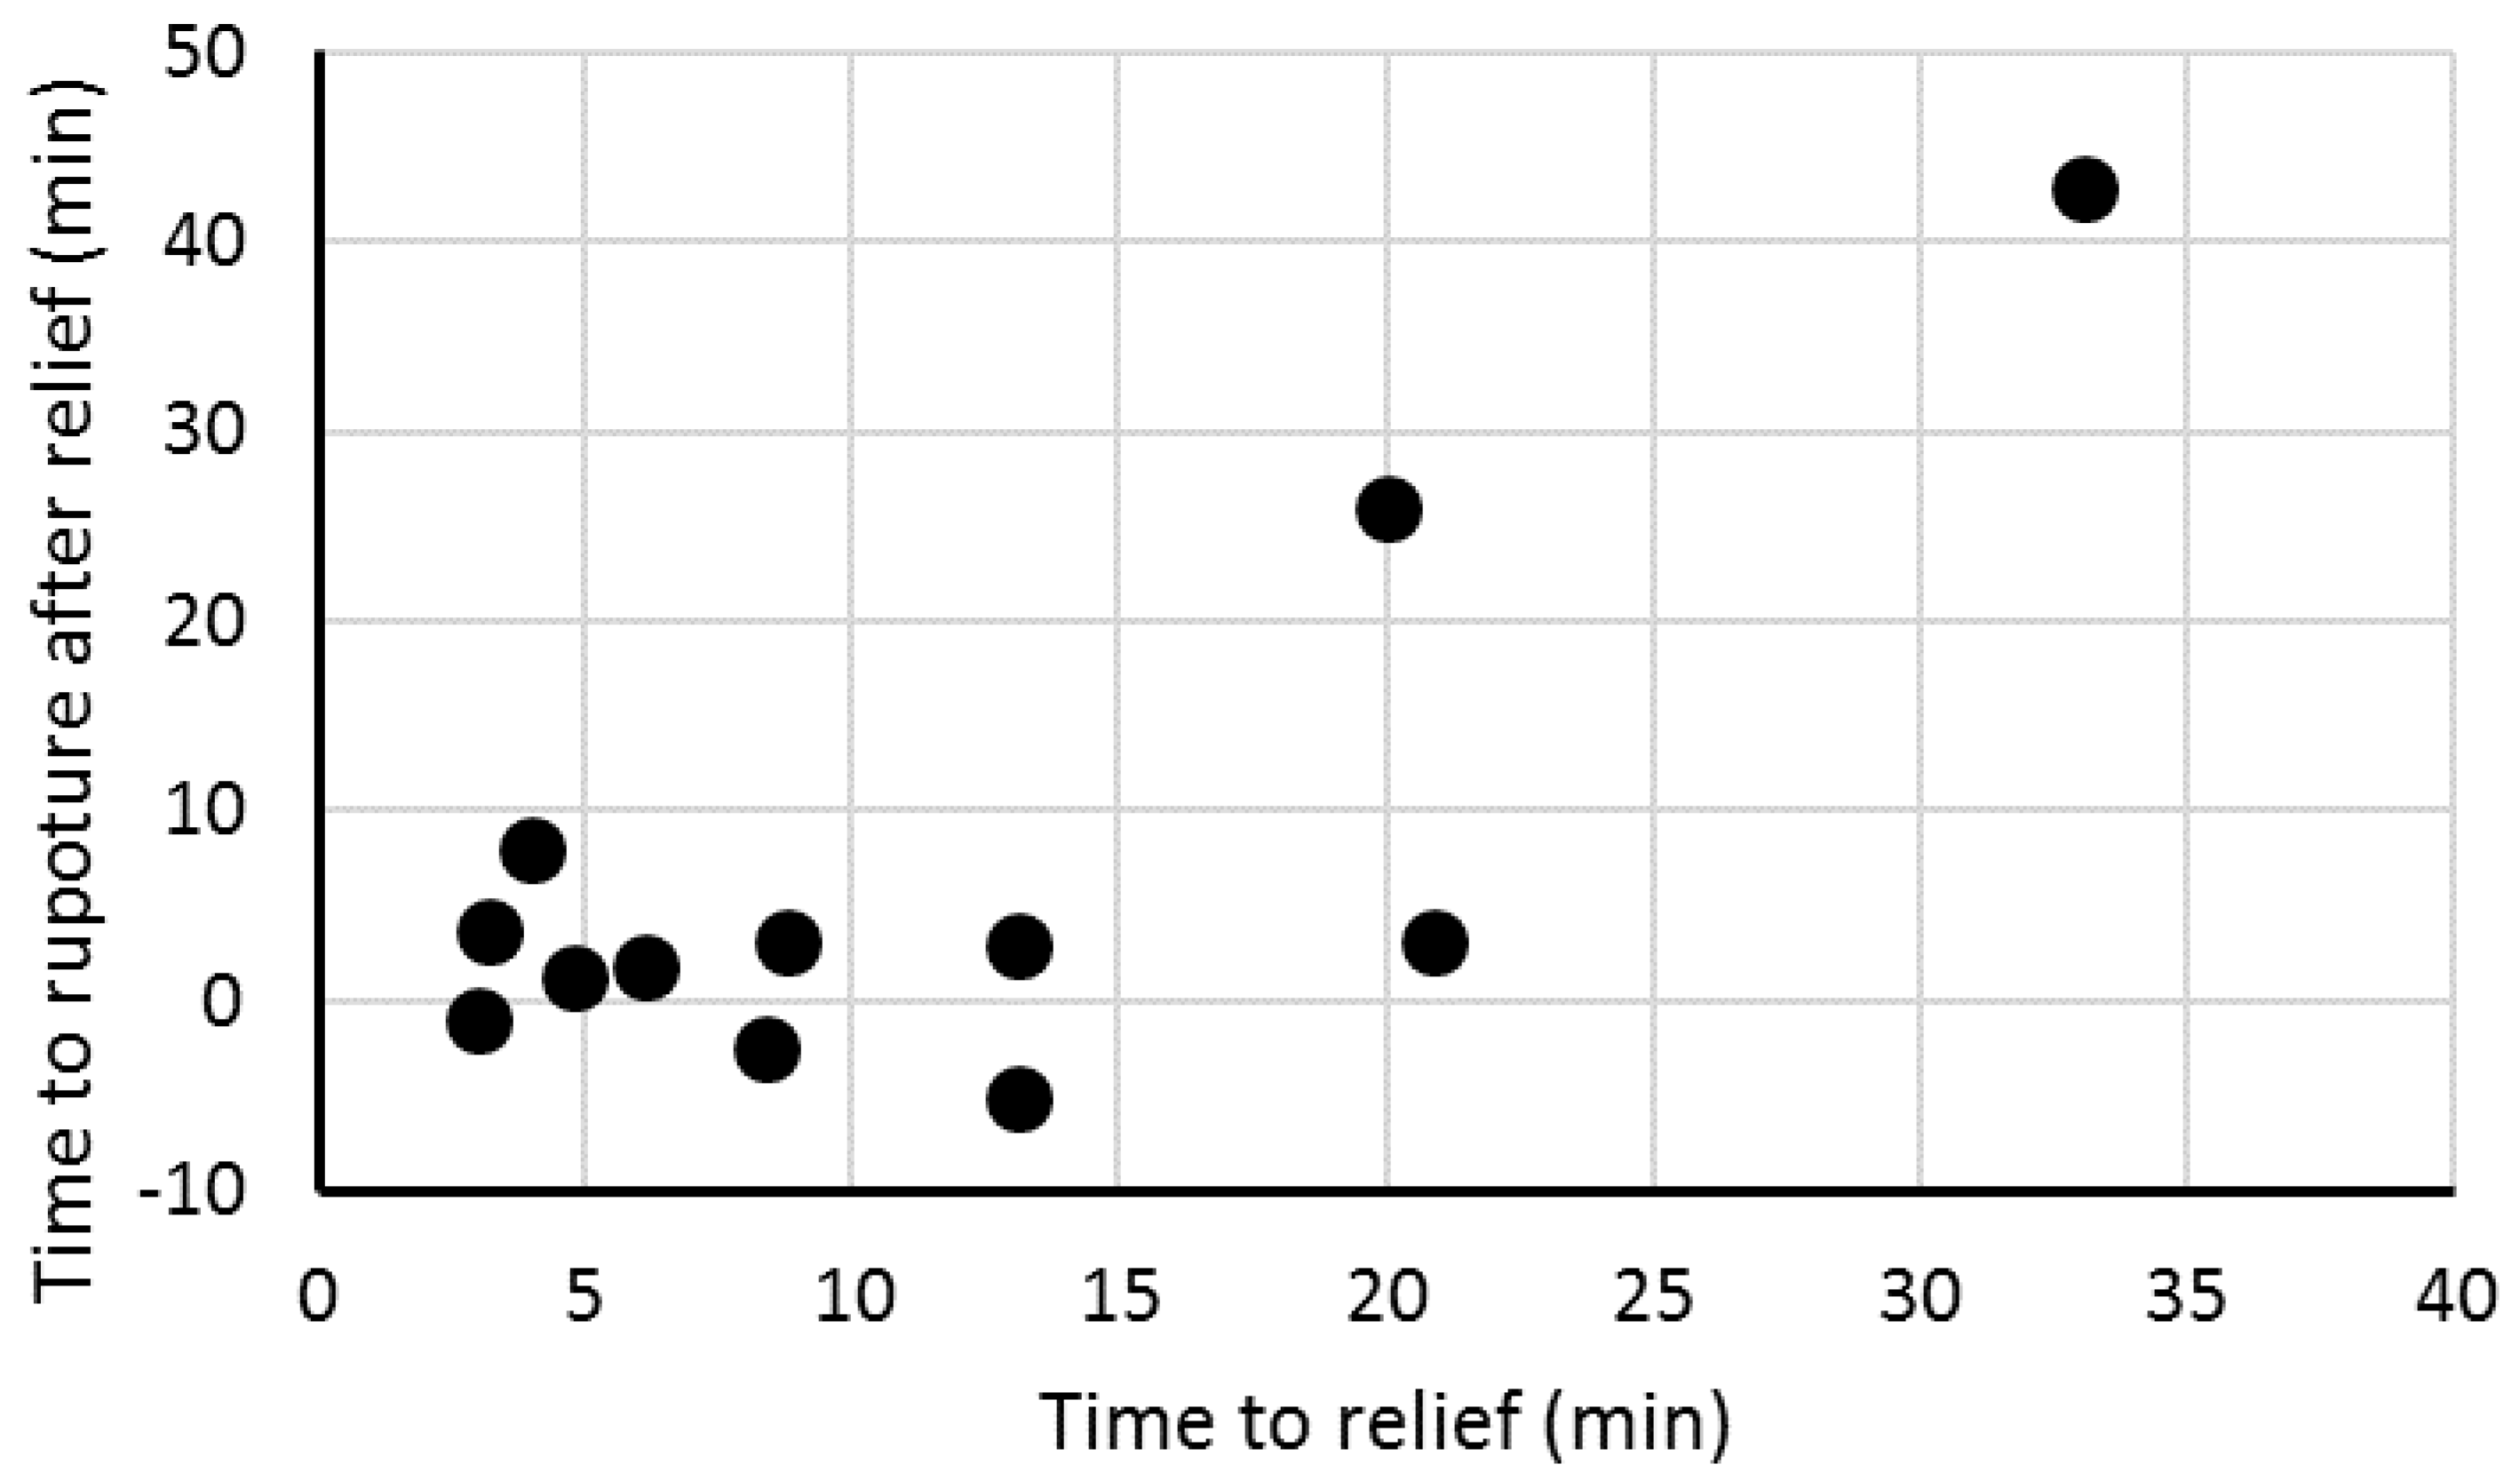
As seen from the results in Figure 6 for the pool fire heat load, in the majority of the cases rupture actually occurs before the relieving pressure of the PRV is reached. Looking into the grouping of operating pressures, it is observed that for a lower starting pressure relative to the relief pressure, all cases show rupture before opening of the PRV. For the normal operating pressure cases, most of the cases rupture occurs after the PRV has reached the relieving pressure, and it can be claimed that the PRV actually extends the survival time of the vessel. The effectiveness of the PRV is investigated in more detail in Figure 8. As seen from the figure, only in a few cases it is predicted that the rupture time occurs significantly later than the time of relief. Besides the three cases, where rupture actually occurs before the PRV opens, most of the other cases show rupture just a few minutes, after the PRV has started relieving.
As seen from Figure 7 for the jet fire cases, rupture occurs at best at the same time or well before the relieving pressure is reached—except for a single case, where the vessel survival is prolonged insignificantly. This clearly shows that a PRV has no effect in terms of protecting a gas-filled vessel subjected to a jet fire heat load. API 521 also states that “… protection from jet fire exposure is typically addressed through means other than PRVs, because failure often occurs due to localized overheating, for which a PRV is ineffective”.
4. Conclusions
In this paper, we have examined relief valves for protection of gas-filled vessels against overpressure due to external fire. Both the sizing of the relief valves has been studied as well as the effectiveness of the relief valve to actually protect the vessel from rupture. Both pool fire and jet fire scenarios have been evaluated.
It is generally found that applying the API 521 relief-valve sizing methodology, the relief valves are grossly oversized compared the actual size used in the dynamic simulations where a D-orifice is sufficient to keep the vessel pressure below 121% of the design pressure. This may lead to chatter and potentially challenges the mechanical/structural integrity of the valve. Furthermore, an extensive number of calculations have been performed for different vessel sizes, design pressure, operating pressure etc. When a gas-filled vessel is subjected to a pool fire, only a few of the investigated cases have a significant benefit of a PRV in terms of extending the vessel survival before rupture. Only vessels with a thick wall (due to high design pressure) have a real benefit from the PSV. For the remaining vessels, the lifetime of the vessel is only prolonged slightly or not at all. These are for cases with a normal operating pressure. If the vessels are operated at a low pressure, the picture is even worse, and no vessels survive long enough for the relief pressure to be reached. For the jet fire cases, the effect of the PRV is nonexisting, and only a single case sees any benefit from a PRV, and even so the lifetime is only extended shortly, after the relief valve has been activated.
Based on these investigations, we recommend that extreme caution should be taken, if and when designing relief systems for gas-filled vessels, and we propose the following recommendations:
- Never base relief valve sizing for gas-filled vessels on API 521 equations—except maybe for early phase studies for cost estimation purposes. For detailed design and actual installation purposes, always base relief valve sizing on dynamic simulations with rigorous modelling of the heat transfer process in order to avoid grossly oversized PRVs.
- Carefully consider if the vessel survival time actually benefits from an installed PRV by performing thermomechanical calculations of the vessel rupture time and taking the chosen material properties into account.
- If the vessel rupture time is not significantly prolonged by the presence of a PRV, consider alternative means for protecting the vessel, such as e.g., insulation, or even better, blowdown activated by fusible plugs.
- In case of protection against jet fire, never rely on a PRV; always consider alternative means of protection.
Acknowledgments
The authors would like to thank Language Secretary, Susanne Tolstrup, Technical Safety, Ramboll Energy, for proofreading the manuscript and providing valuable input for improving the language of the paper.
Author Contributions
Anders Andreasen, Rudi P. Nielsen and Carsten Stegelmann conceived the idea for the paper. Anders Andreasen wrote an initial draft version of the paper and laid out the calculational setup. Filippo Borroni and Marcos Zan Nieto improved the model with local inner wall convective heat transfer and ran all simulations and rupture calculations. All authors contributed to the writing of the final manuscript.
Conflicts of Interest
The authors declare no conflicts of interest.
References
- ASME. Asme International Boiler and Pressure Vessel Code Section 8: Rules for Construction of Pressure Vessels Division 1; American Society of Mechanical Engineers: New York, NY, USA, 2013. [Google Scholar]
- American Petroleum Institute. Recommened Practise for Analysis, Design, Installation, and Testing of Basic Surface Safety Systems for Offshore Production Platforms; American Petroleum Institute: Washington, DC, USA, 2001; ISBN 5925731107. [Google Scholar]
- American Petroluem Institute. Pressure-Relieving and Depressuring Systems, API Standard 521; American Petroleum Institute: Washington, DC, USA, 2014. [Google Scholar]
- Nylund, J. Fire Survival of Process Vessels Containing Gas. I. Chem. E. Symp. Ser. 1984, 85, 137–148. [Google Scholar]
- Heitner, I.; Trautmanis, T.; Morissey, M. Relieving requirements for gas-filled vessels exposed to fire. In Proceedings of the API Refining Department 48th Midyear Meeting, Los Angeles, CA, USA, 9–12 May 1983. [Google Scholar]
- Wong, W.Y. Improve the Fire Protection of Pressure Vessels. Chem. Eng. 1999, 106, 193–196. [Google Scholar]
- Bjerre, M.; Eriksen, J.G.I.; Andreasen, A.; Stegelmann, C.; Mandø, M. Analysis of pressure safety valves for fire protection on offshore oil and gas installations. Process Saf. Environ. Prot. 2017, 105, 60–68. [Google Scholar] [CrossRef]
- Dalzell, G.; Chesterman, A. Nothing, Is Safety Critical. Process Saf. Environ. Prot. 1997, 75, 152–156. [Google Scholar] [CrossRef]
- Hekkelstrand, B.; Skulstad, P. Guidelines for the Protection of Pressurised Systems Exposed to Fire; Scandpower Risk Management AS: Kjeller, Norway, 2004. [Google Scholar]
- NORSOK. Technical Safety, NORSOK Standard S-001; NORSOK: Lysaker, Norway, 2008. [Google Scholar]
- Roberts, T.A.; Buckland, I.; Shirvill, L.C.; Lowesmith, B.J.; Salater, P. Design and Protection of Pressure Systems to Withstand Severe Fires. Process Saf. Environ. Prot. 2004, 82, 89–96. [Google Scholar] [CrossRef]
- Energy Institute. Guidelines for the Design and Protection of Pressure Systems to Withstand Severe Fires; Energy Institute: London, UK, 2003. [Google Scholar]
- Zamejc, E. API Standard 521 new alternative method to evaluate fire relief for pressure relief device sizing and depressuring system design. J. Loss Prev. Process Ind. 2014, 27, 21–31. [Google Scholar] [CrossRef]
- American Petroluem Institute. Sizing, Selection and Installation of Pressure Relieving Devices in Refineries, Part I—Sizing and Selection. API Standard 520; American Petroleum Institute: Washington, DC, USA, 2008. [Google Scholar]
- Duggan, J.J.; Gilmour, C.H.; Fisher, P.F. Requirements for relief of pressure vessels. Trans. ASME 1944, 66, 1–53. [Google Scholar]
- Rahimi, S. The Basis of API Correlation for Fire Relief of Unwetted Vessels. Available online: https://www.scribd.com/document/246359787/The-Basis-of-API-Corrolation-for-Fire-Relief-of-Unwetted-Vessels (accessed on 13 April 2016).
- Geankoplis, C.J. Transport Processes and Unit Operations, 3rd ed.; Chemical Engineering; PTR Prentice Hall: Upper Saddle River, NJ, USA, 1993; ISBN 9780139304392. [Google Scholar]
- Salater, P.; Overaa, S.J.; Kjensjord, E. Size Depressurization and Relief Devices for Pressurized Segments Exposed to Fire. CEP Mag. 2002, 98, 38–45. [Google Scholar]
- Biswas, S.; Fischer, B.J. Application and validation of the API analytical fire method in pressure-relieving and depressuring systems. J. Loss Prev. Process Ind. 2017, 50, 154–164. [Google Scholar] [CrossRef]
- Peng, D.-Y.; Robinson, D.B. A New Two-Constant Equation of State. Ind. Eng. Chem. Fundam. 1976, 15, 59–64. [Google Scholar] [CrossRef]
- Ely, J.F.; Hanley, H.J.M. A Computer Program for the Prediction of Viscosity and Thermal Conductivity in Hydrocarbon Mixtures—NBS Technical Note 1039; National Bureau of Standards: Boulder, CO, USA, 1981.
- D’Aulisa, A.; Simone, D.; Landucci, G.; Tugnoli, A.; Cozzani, V.; Birk, M. Numerical simulation of tanks containing pressurized gas exposed to accidental fires: Evaluation of the transient heat up. Chem. Eng. Trans. 2014, 36, 241–246. [Google Scholar] [CrossRef]
- Birk, A.M.; Poirier, D.; Davison, C. On the response of 500 gal propane tanks to a 25% engulfing fire. J. Loss Prev. Process Ind. 2006, 19, 527–541. [Google Scholar] [CrossRef]
- Moodie, K.; Cowley, L.T.; Denny, R.B.; Small, L.M.; Williams, I. Fire engulfment tests on a 5 tonne LPG tank. J. Hazard. Mater. 1988, 20, 55–71. [Google Scholar] [CrossRef]
- Droste, B.; Schoen, W. Full scale fire tests with unprotected and thermal insulated LPG storage tanks. J. Hazard. Mater. 1988, 20, 41–53. [Google Scholar] [CrossRef]
- Zheng, J.; Ou, K.; Hua, Z.; Zhao, Y.; Hu, J.; Han, B. Experimental and Numerical Studies on High-Pressure Composite Cylinders Subjected to Localized and Engulfing Fire. J. Press. Vessel Technol. 2013, 135, 51405. [Google Scholar] [CrossRef]
- Ruban, S.; Heudier, L.; Jamois, D.; Proust, C.; Bustamante-Valencia, L.; Jallais, S.; Kremer-Knobloch, K.; Maugy, C.; Villalonga, S. Fire risk on high-pressure full composite cylinders for automotive applications. Int. J. Hydrog. Energy 2012, 37, 17630–17638. [Google Scholar] [CrossRef]
- Richardson, S.M.; Saville, G. Blowdown of Vessels and Pipelines. I. Chem. E. Symp. Ser. 1993, 130, 195–209. [Google Scholar]
- Haque, M.A.; Richardson, S.M.; Saville, G.; Chamberlain, G.; Shirvill, L. Blowdown of pressure vessels II. Experimental Validation of Computer Model and Case Studies. Trans. IChemE 1992, 70, 10–17. [Google Scholar]
- Speranza, A.; Terenzi, A. Blowdown of hydrocarbons pressure vessel with partial phase separation. In Applied and Industrial Mathematics in Italy; World Scientific: Singapore, 2005; pp. 508–519. [Google Scholar]
- Incropera, F.P.; Incropera, F.P. Fundamentals of Heat and Mass Transfer; John Wiley: Hoboken, NJ, USA, 2007; ISBN 0471457280. [Google Scholar]
- European Union. Eurocode 3: Design of Steel Structures—Part 1–2: General rules—Structural Fire Design; European Union: City of Brussels, Belgium, 2005. [Google Scholar]
- Andreasen, A.; Eriksen, J.G.I.; Stegelmann, C.; Lynggaard, H. Method improves high-pressure settle-out calculations. Oil Gas J. 2015, 113, 88–96. [Google Scholar]
Figure 1.
Comparison between simulated and experimental results for an N2-filled pressure vessel blowdown at ambient conditions.
Figure 1.
Comparison between simulated and experimental results for an N2-filled pressure vessel blowdown at ambient conditions.
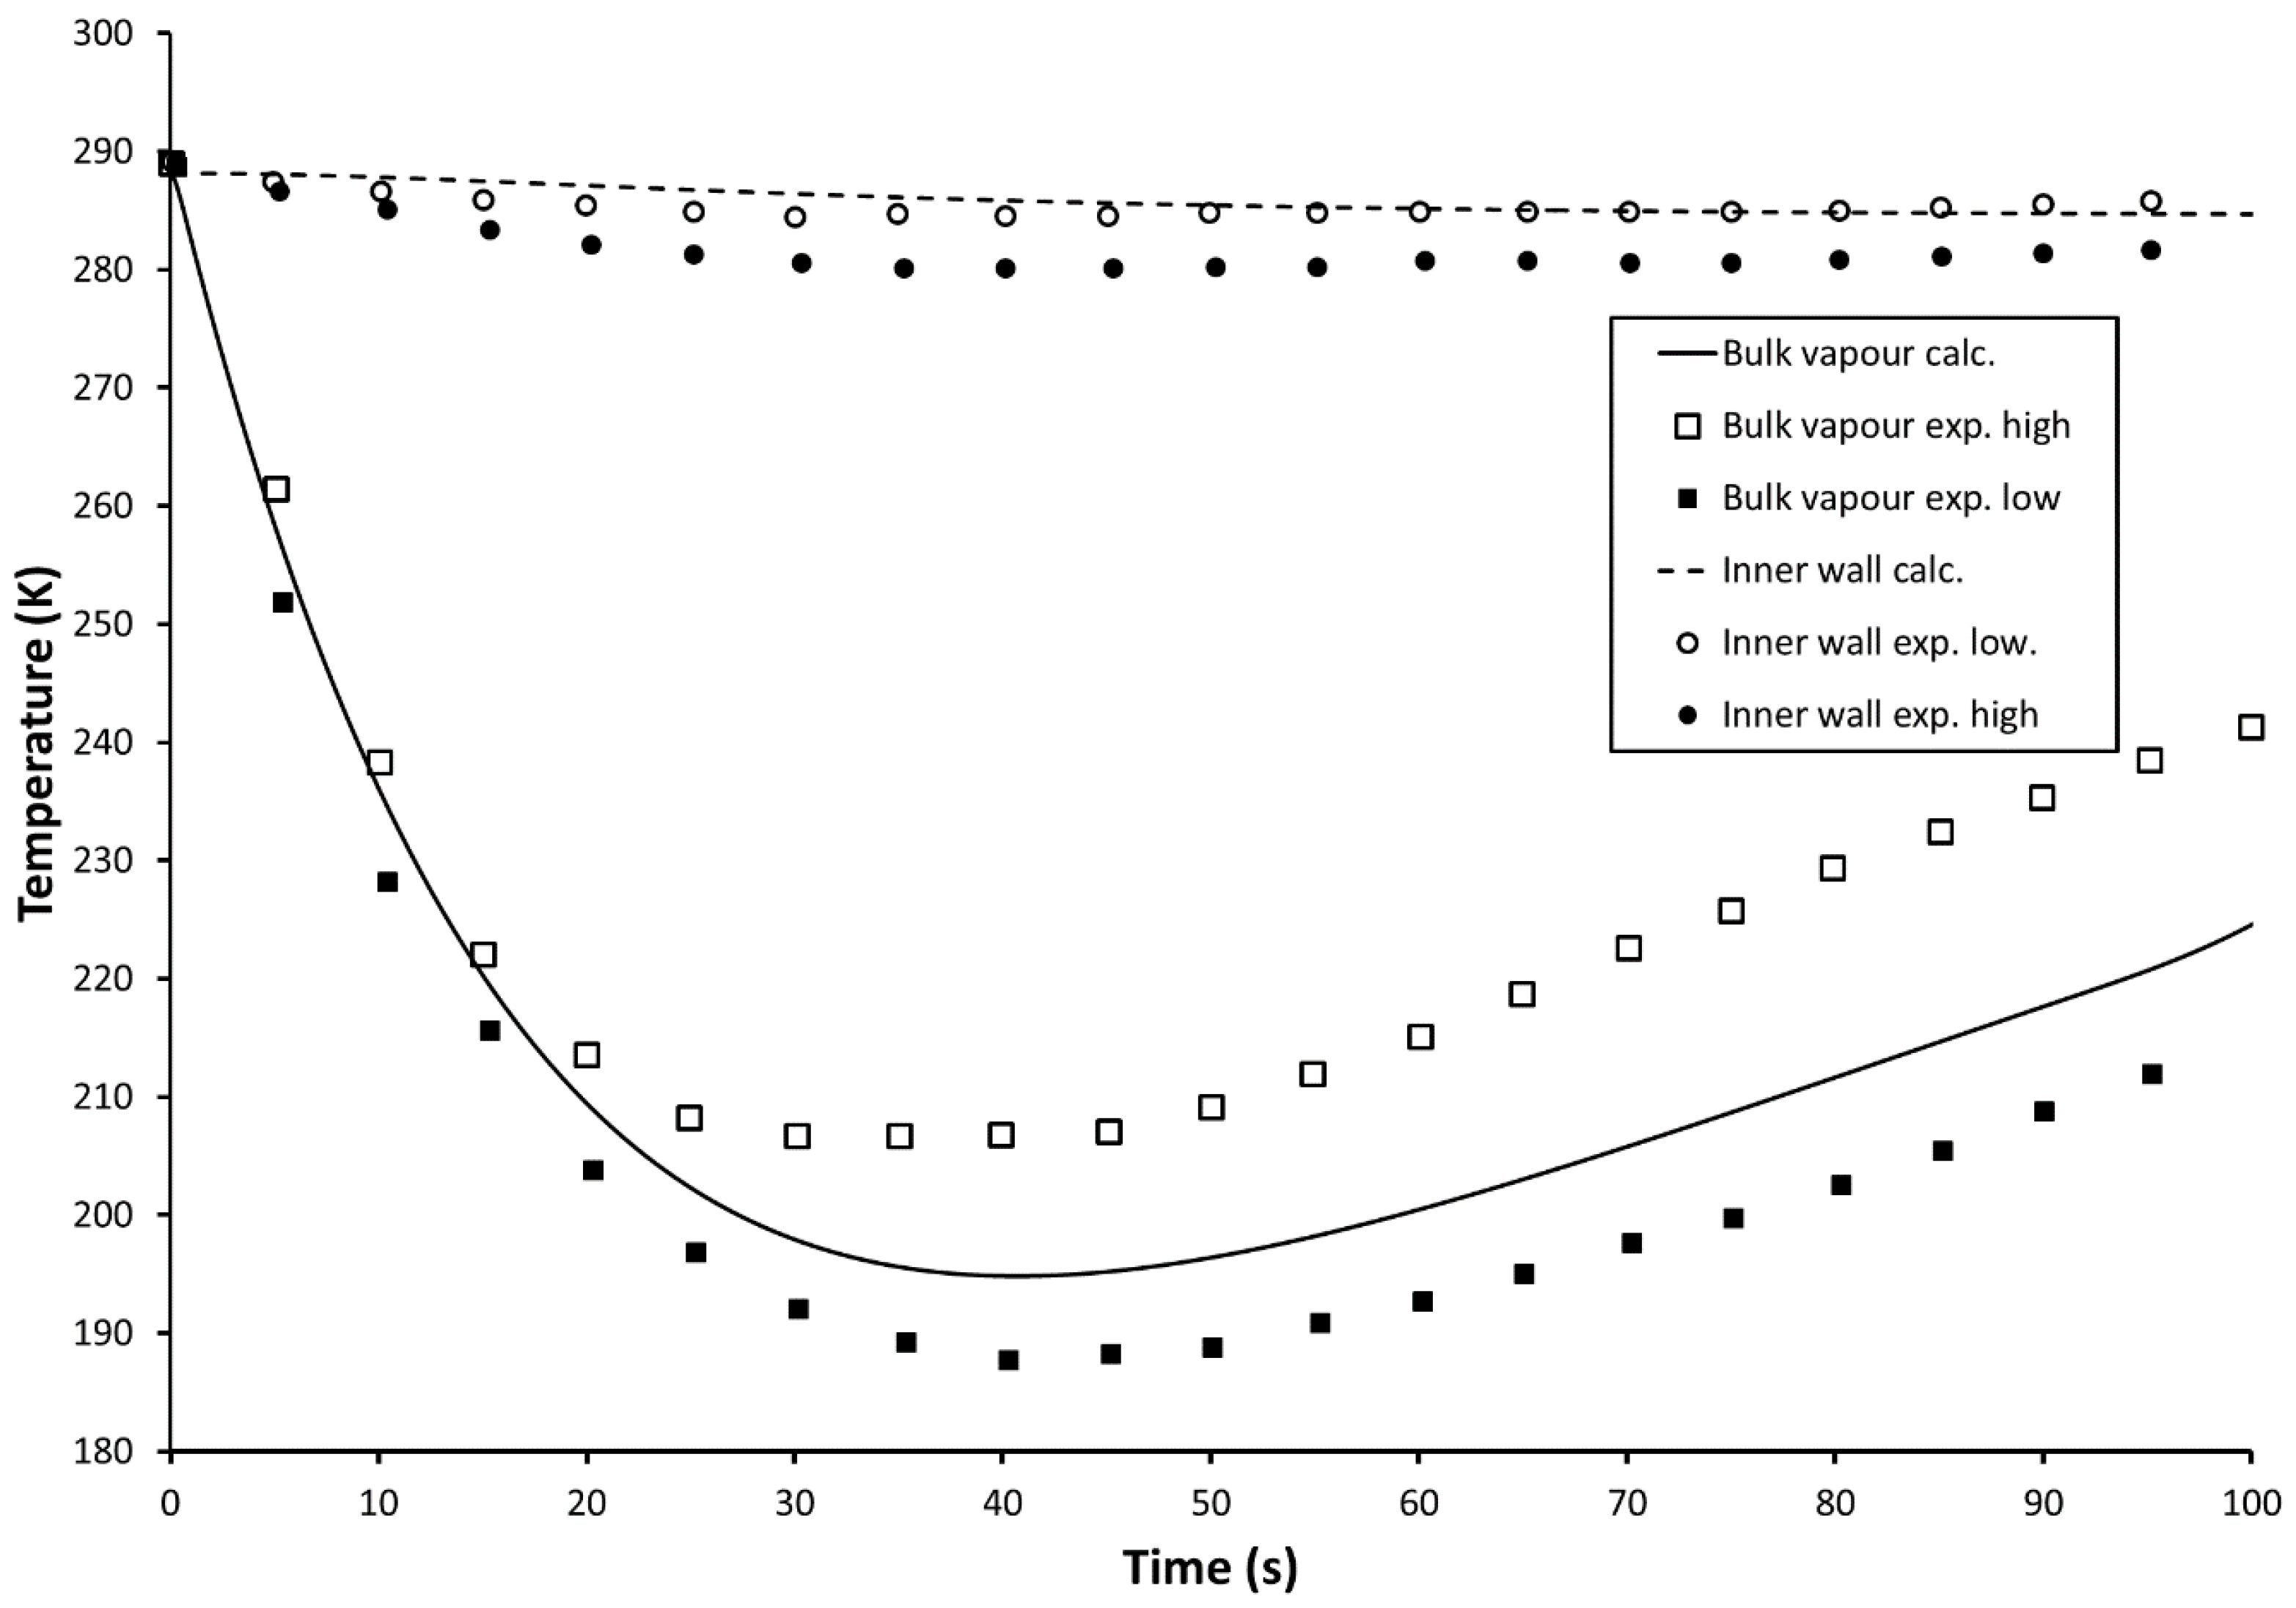
Figure 2.
API 521 relief valve sizing results for the four vessel sizes investigated. Three different design pressures are applied for each vessel size and for each design pressure, a high and low operating (initial) pressure is applied.
Figure 2.
API 521 relief valve sizing results for the four vessel sizes investigated. Three different design pressures are applied for each vessel size and for each design pressure, a high and low operating (initial) pressure is applied.
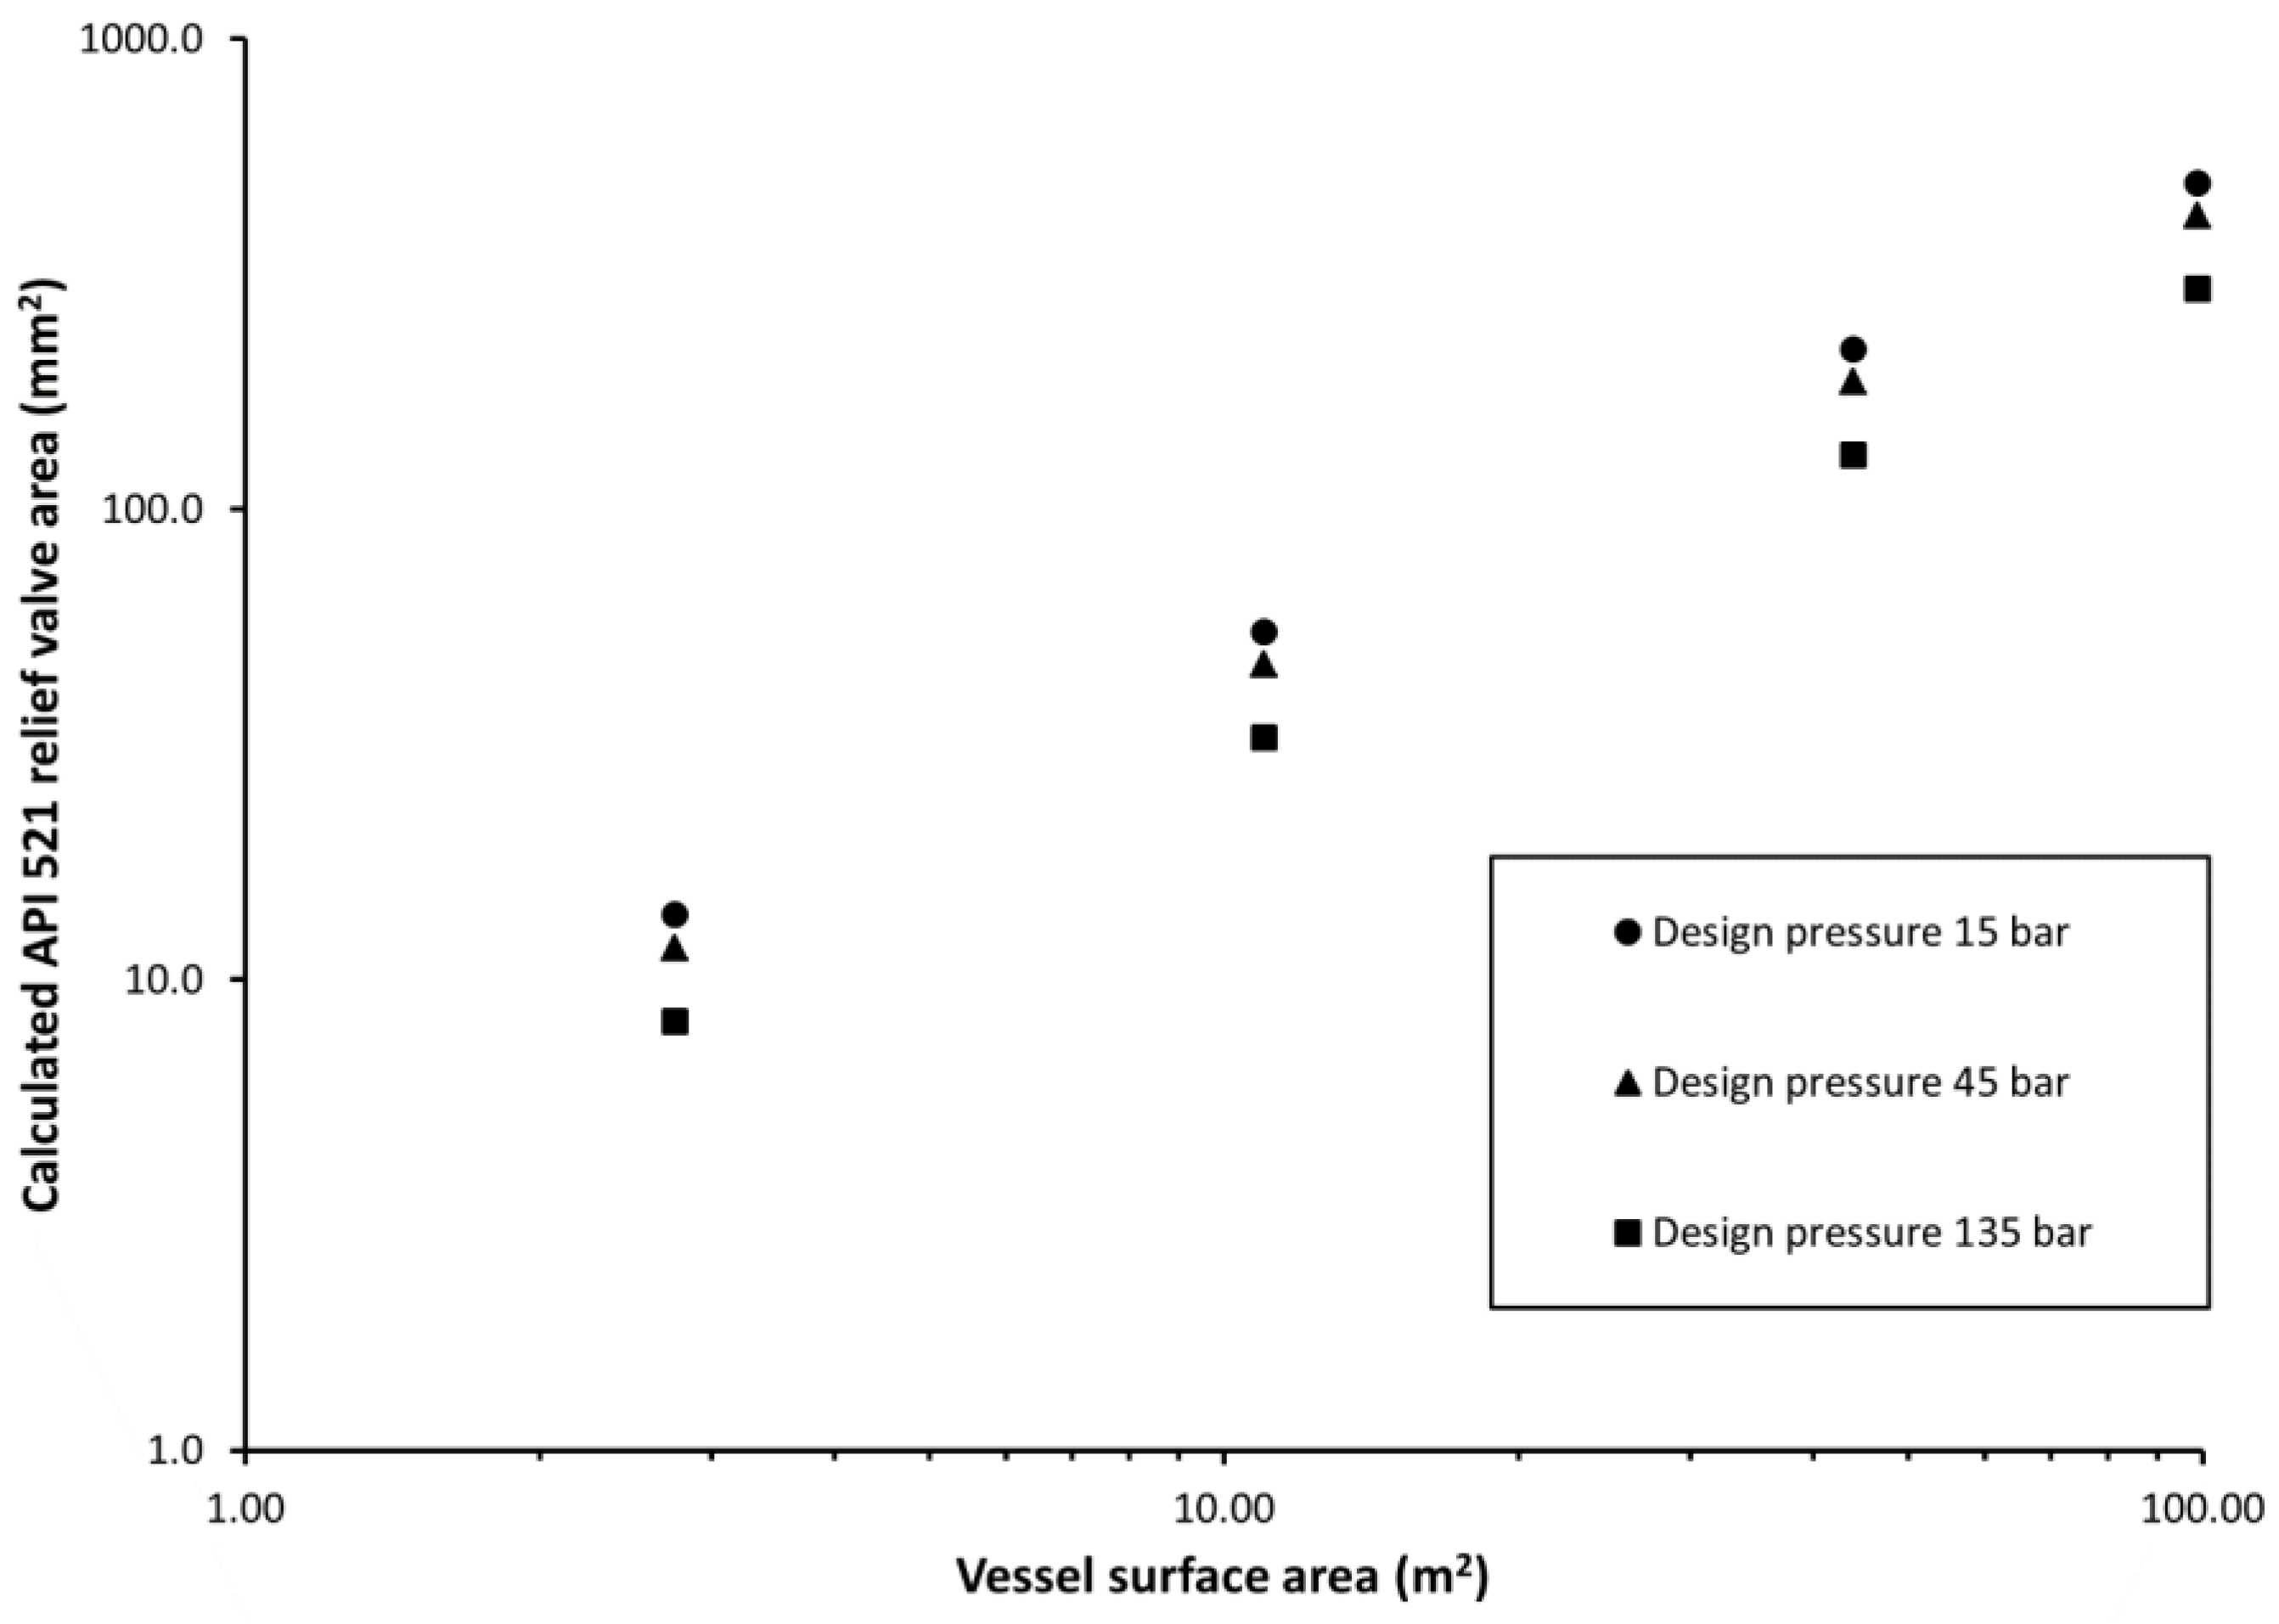
Figure 3.
Assumed material tensile strength as a function of temperature. Data adapted from [9] and scaled to give the assumed UTS of 560 MPa at 100 °C.
Figure 3.
Assumed material tensile strength as a function of temperature. Data adapted from [9] and scaled to give the assumed UTS of 560 MPa at 100 °C.
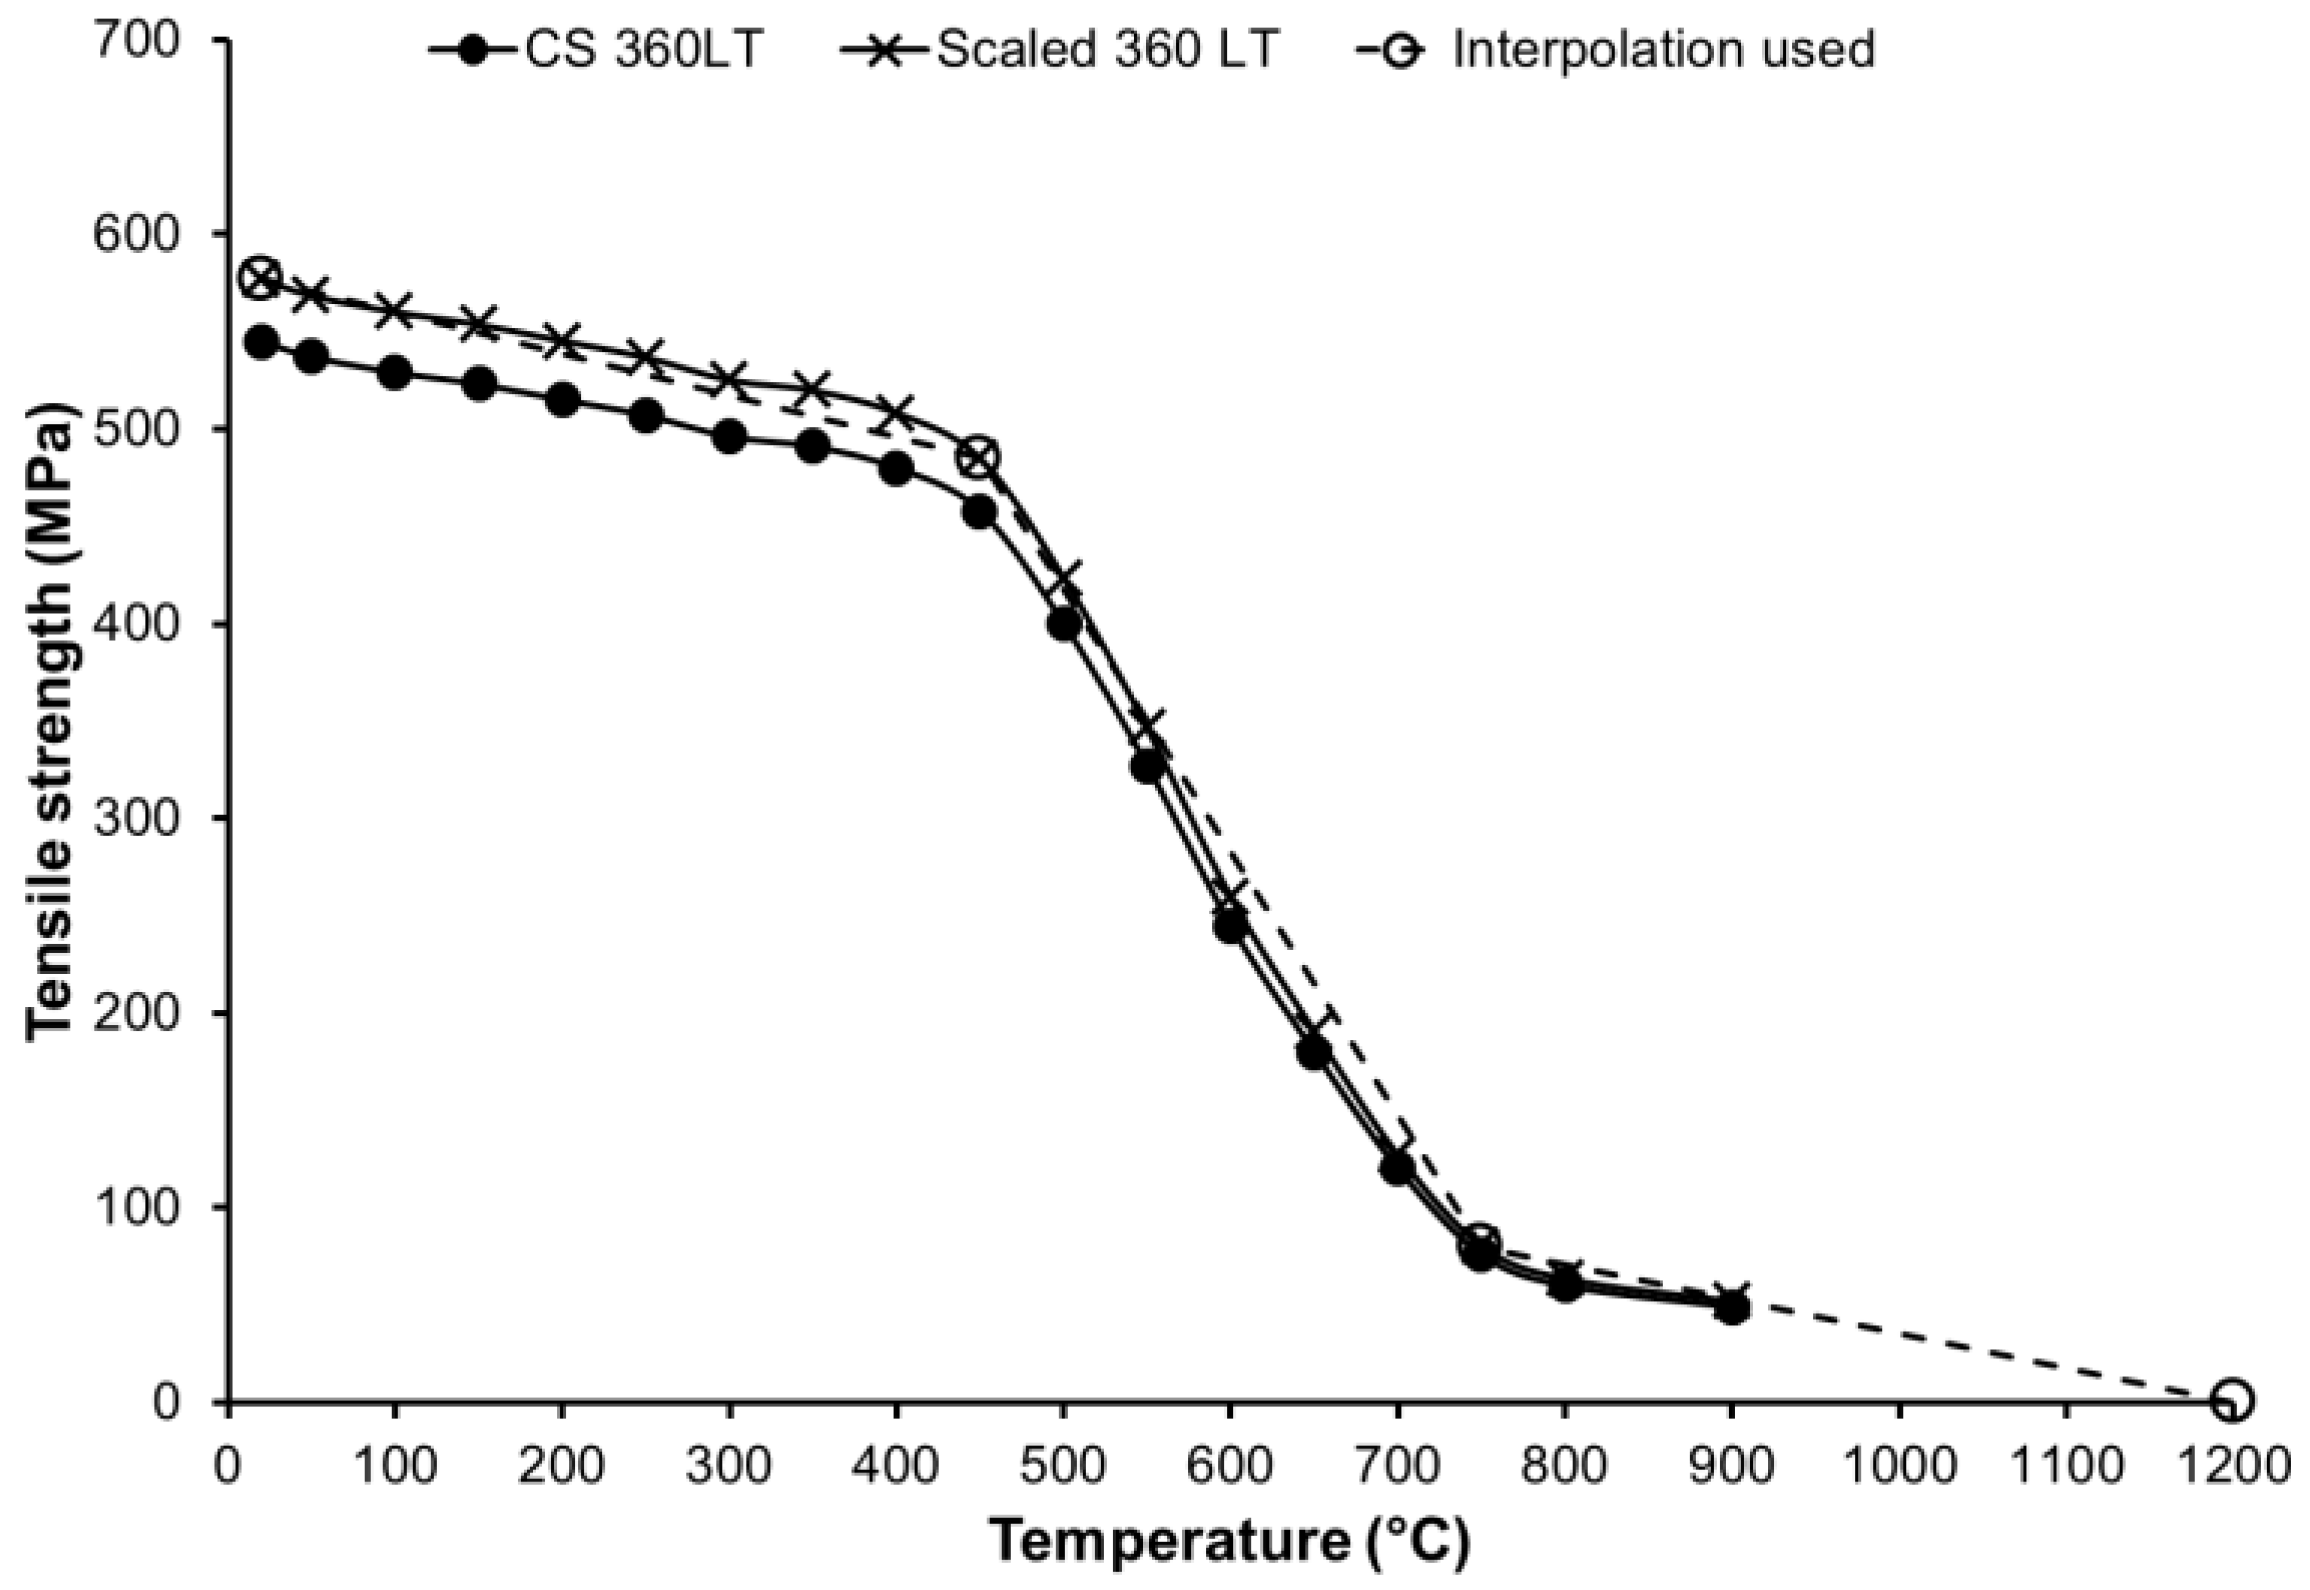
Figure 4.
Results for 0.5-m diameter vessel with 45 bar design pressure. The graphs show vessel pressure (right axis), temperature (where peak heat load is applied), von Mises stress and ATS (left axis) as a function of time. (a) Pool fire scenario at 15 bar; (b) jet fire scenario at 15 bar; (c) pool fire scenario at 35 bar; and (d) jet fire scenario at 35 bar.
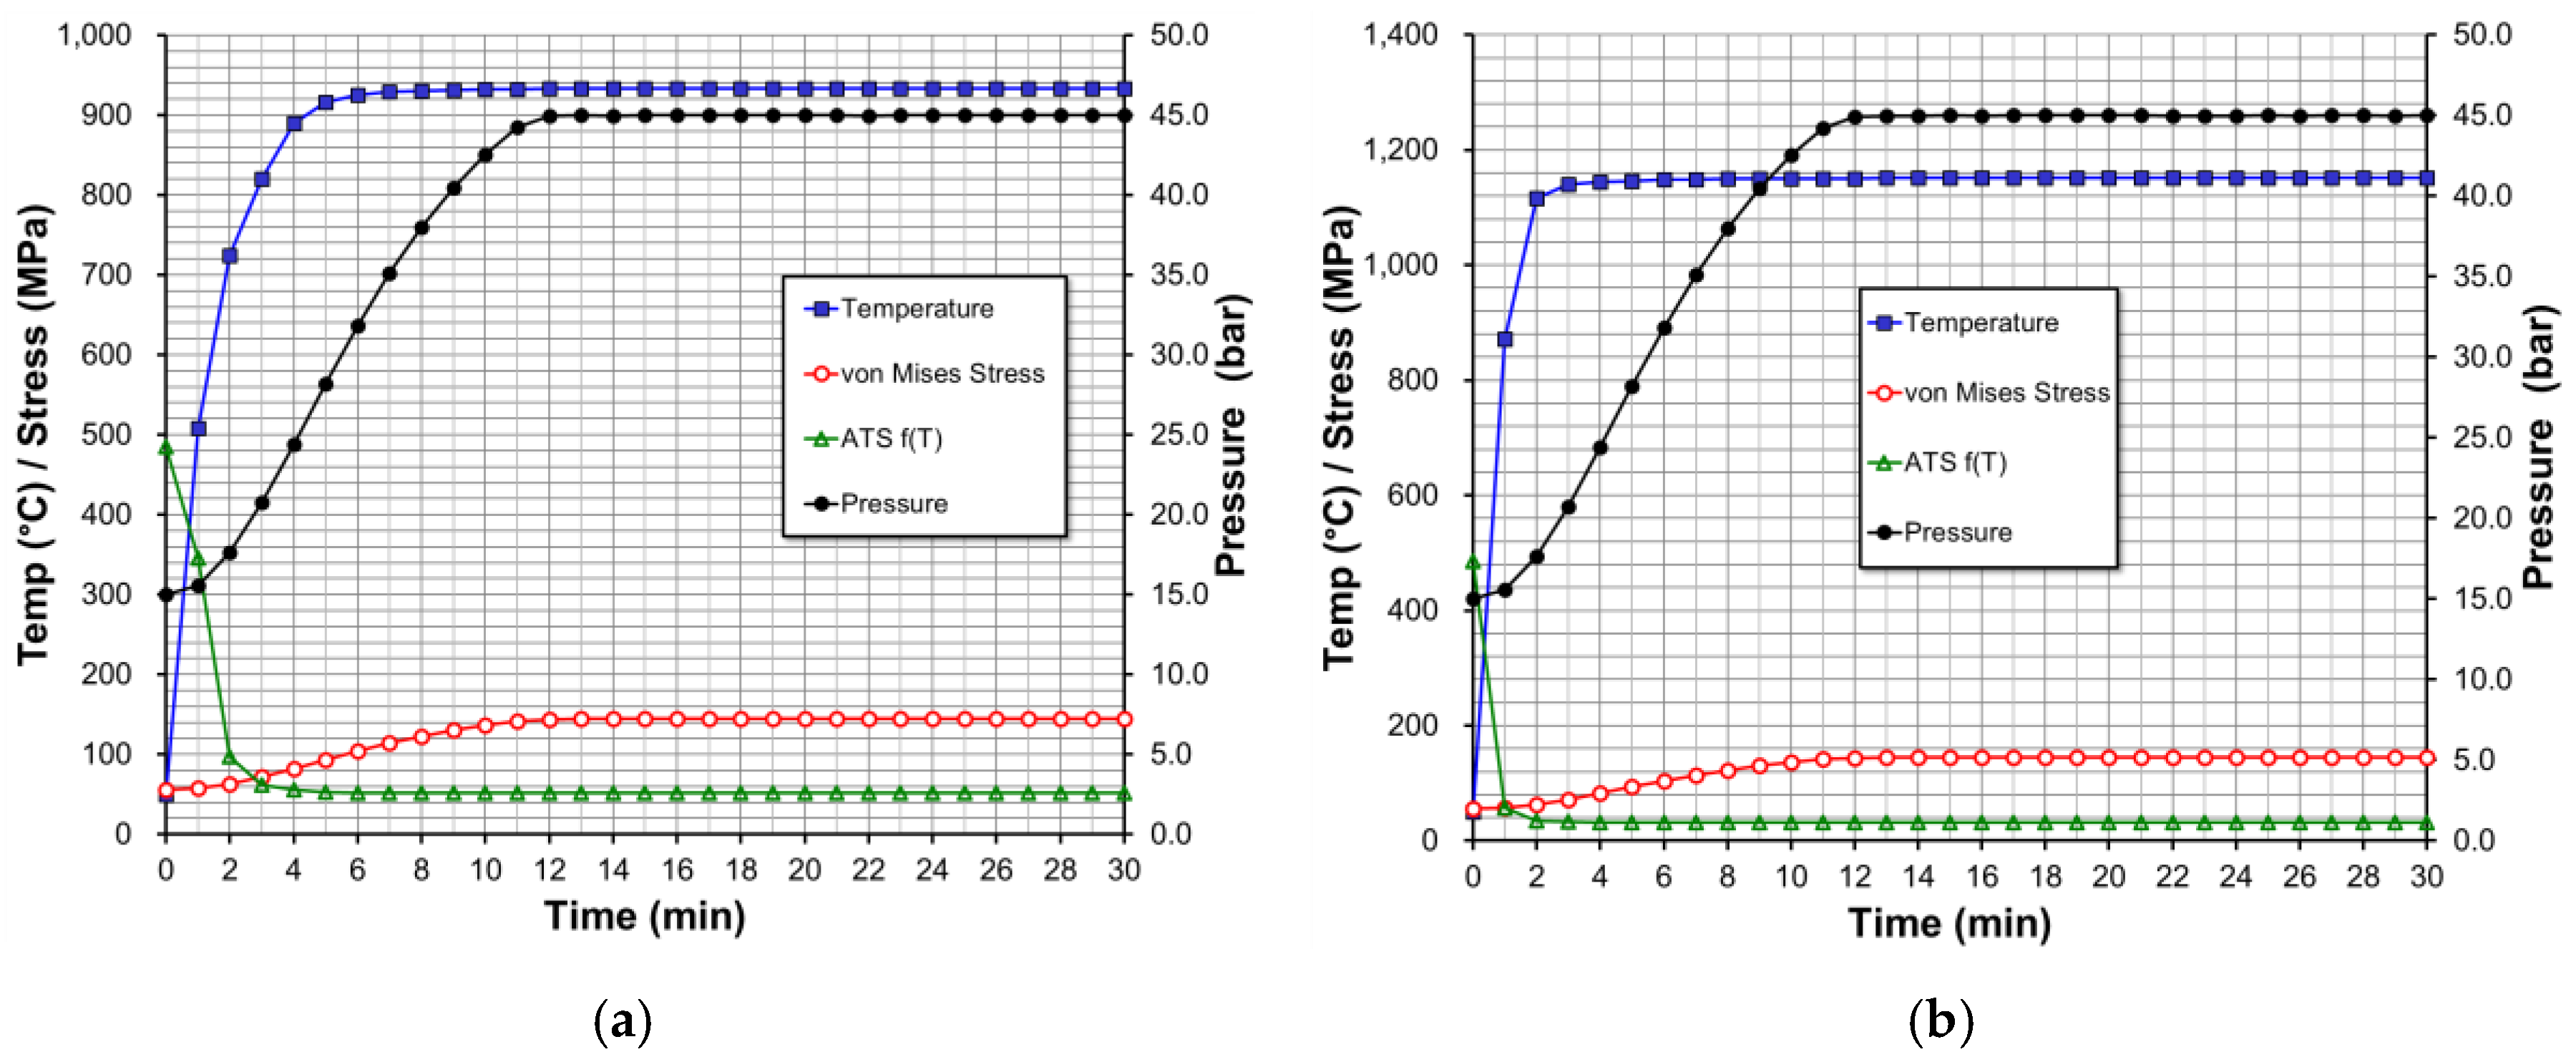
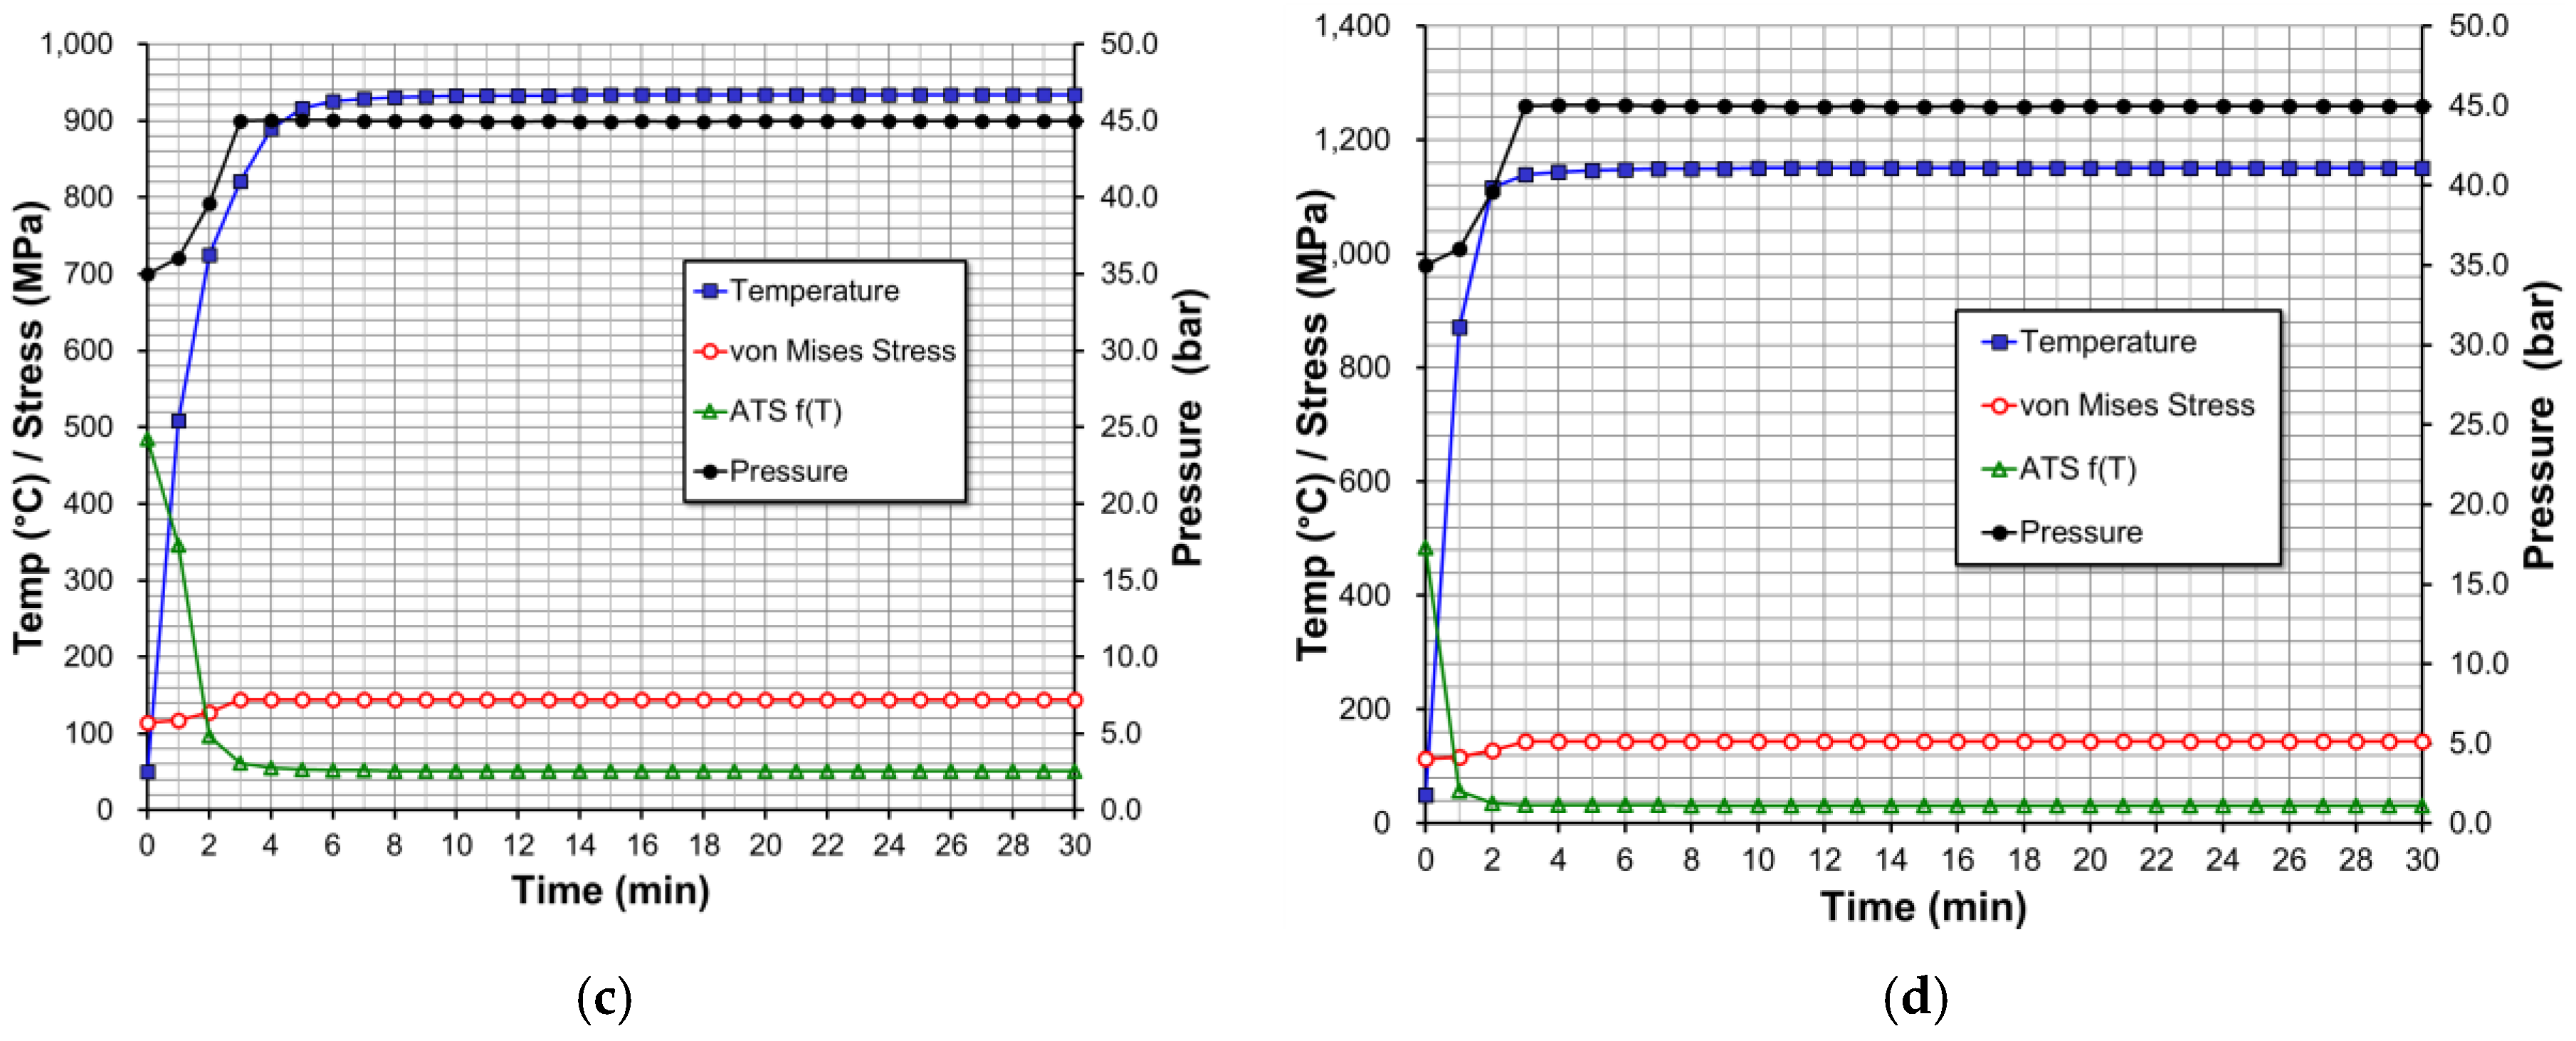
Figure 5.
Results for a 3-m diameter vessel with 135 bar design pressure. The graphs show vessel pressure (right axis), temperature (where peak heat load is applied), von Mises stress and ATS (left axis) as a function of time. (a) Pool fire scenario at 45 bar; (b) jet fire scenario at 45 bar; (c) pool fire scenario at 115 bar; and (d) jet fire scenario at 115 bar.

Figure 6.
Grouped results for the pool fire scenario in terms of vessel diameter, design pressure and operating pressure.
Figure 6.
Grouped results for the pool fire scenario in terms of vessel diameter, design pressure and operating pressure.
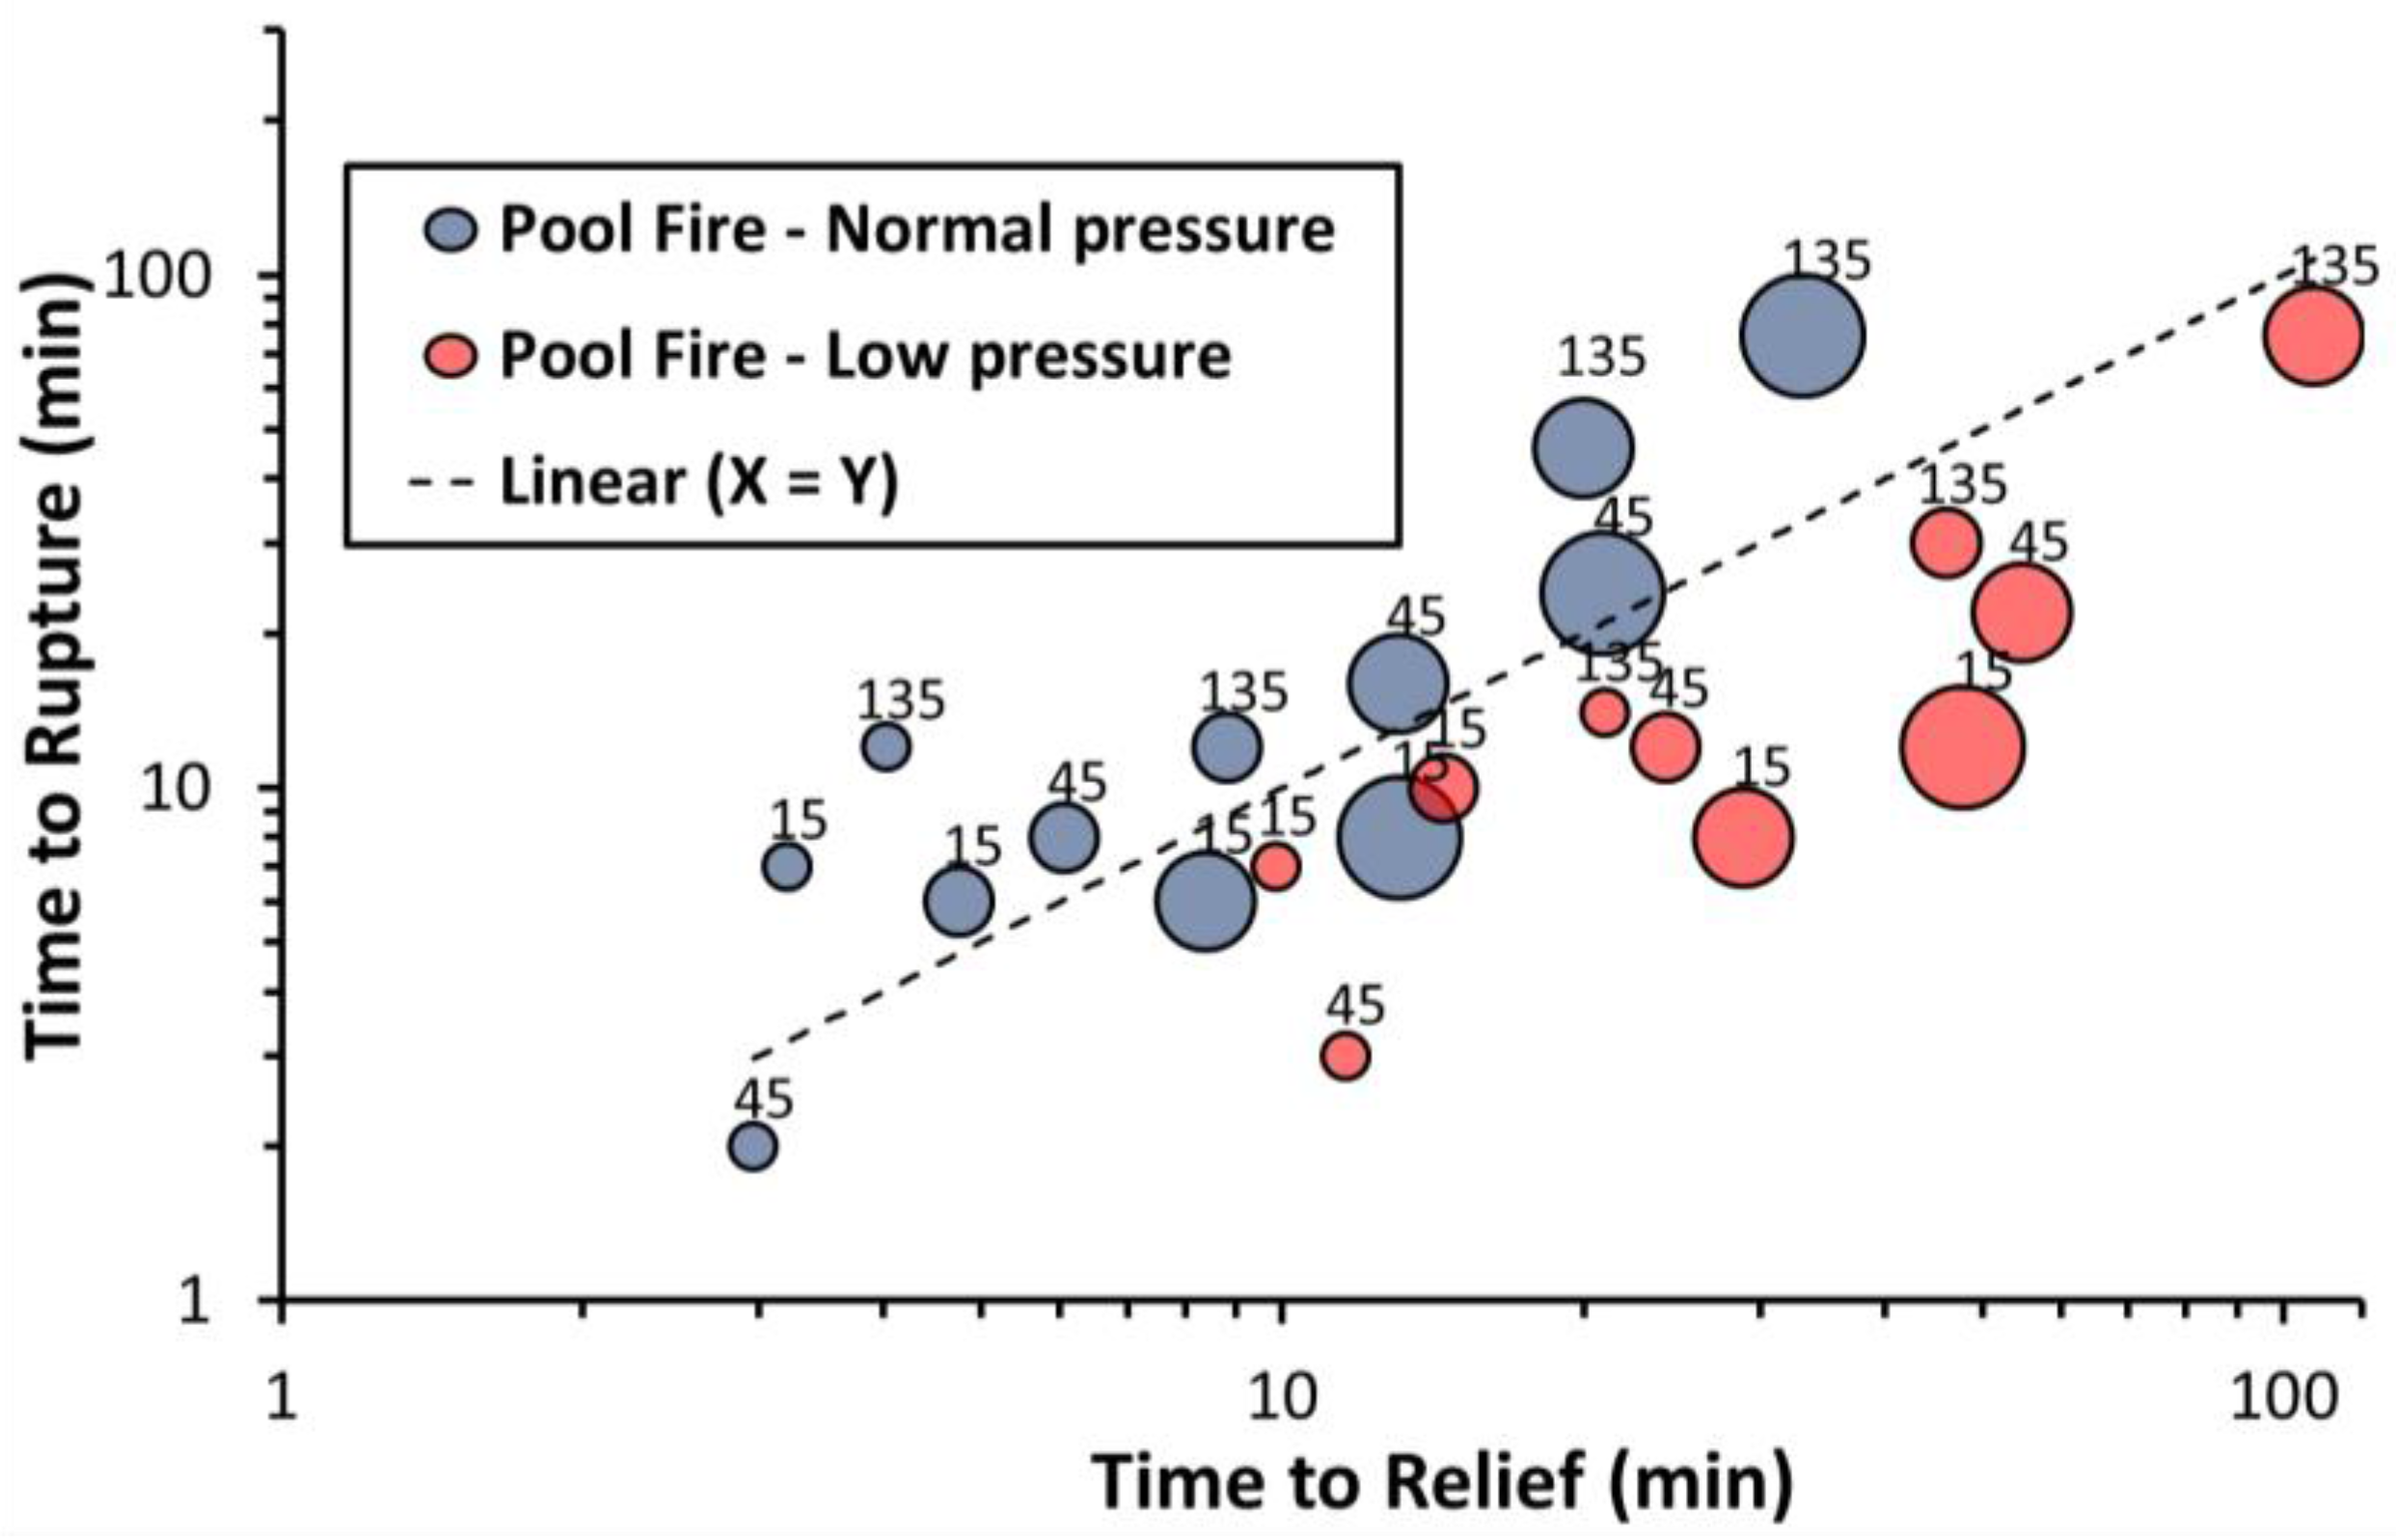
Figure 7.
Grouped results for the jet fire scenario in terms of vessel diameter, design pressure and operating pressure.
Figure 7.
Grouped results for the jet fire scenario in terms of vessel diameter, design pressure and operating pressure.
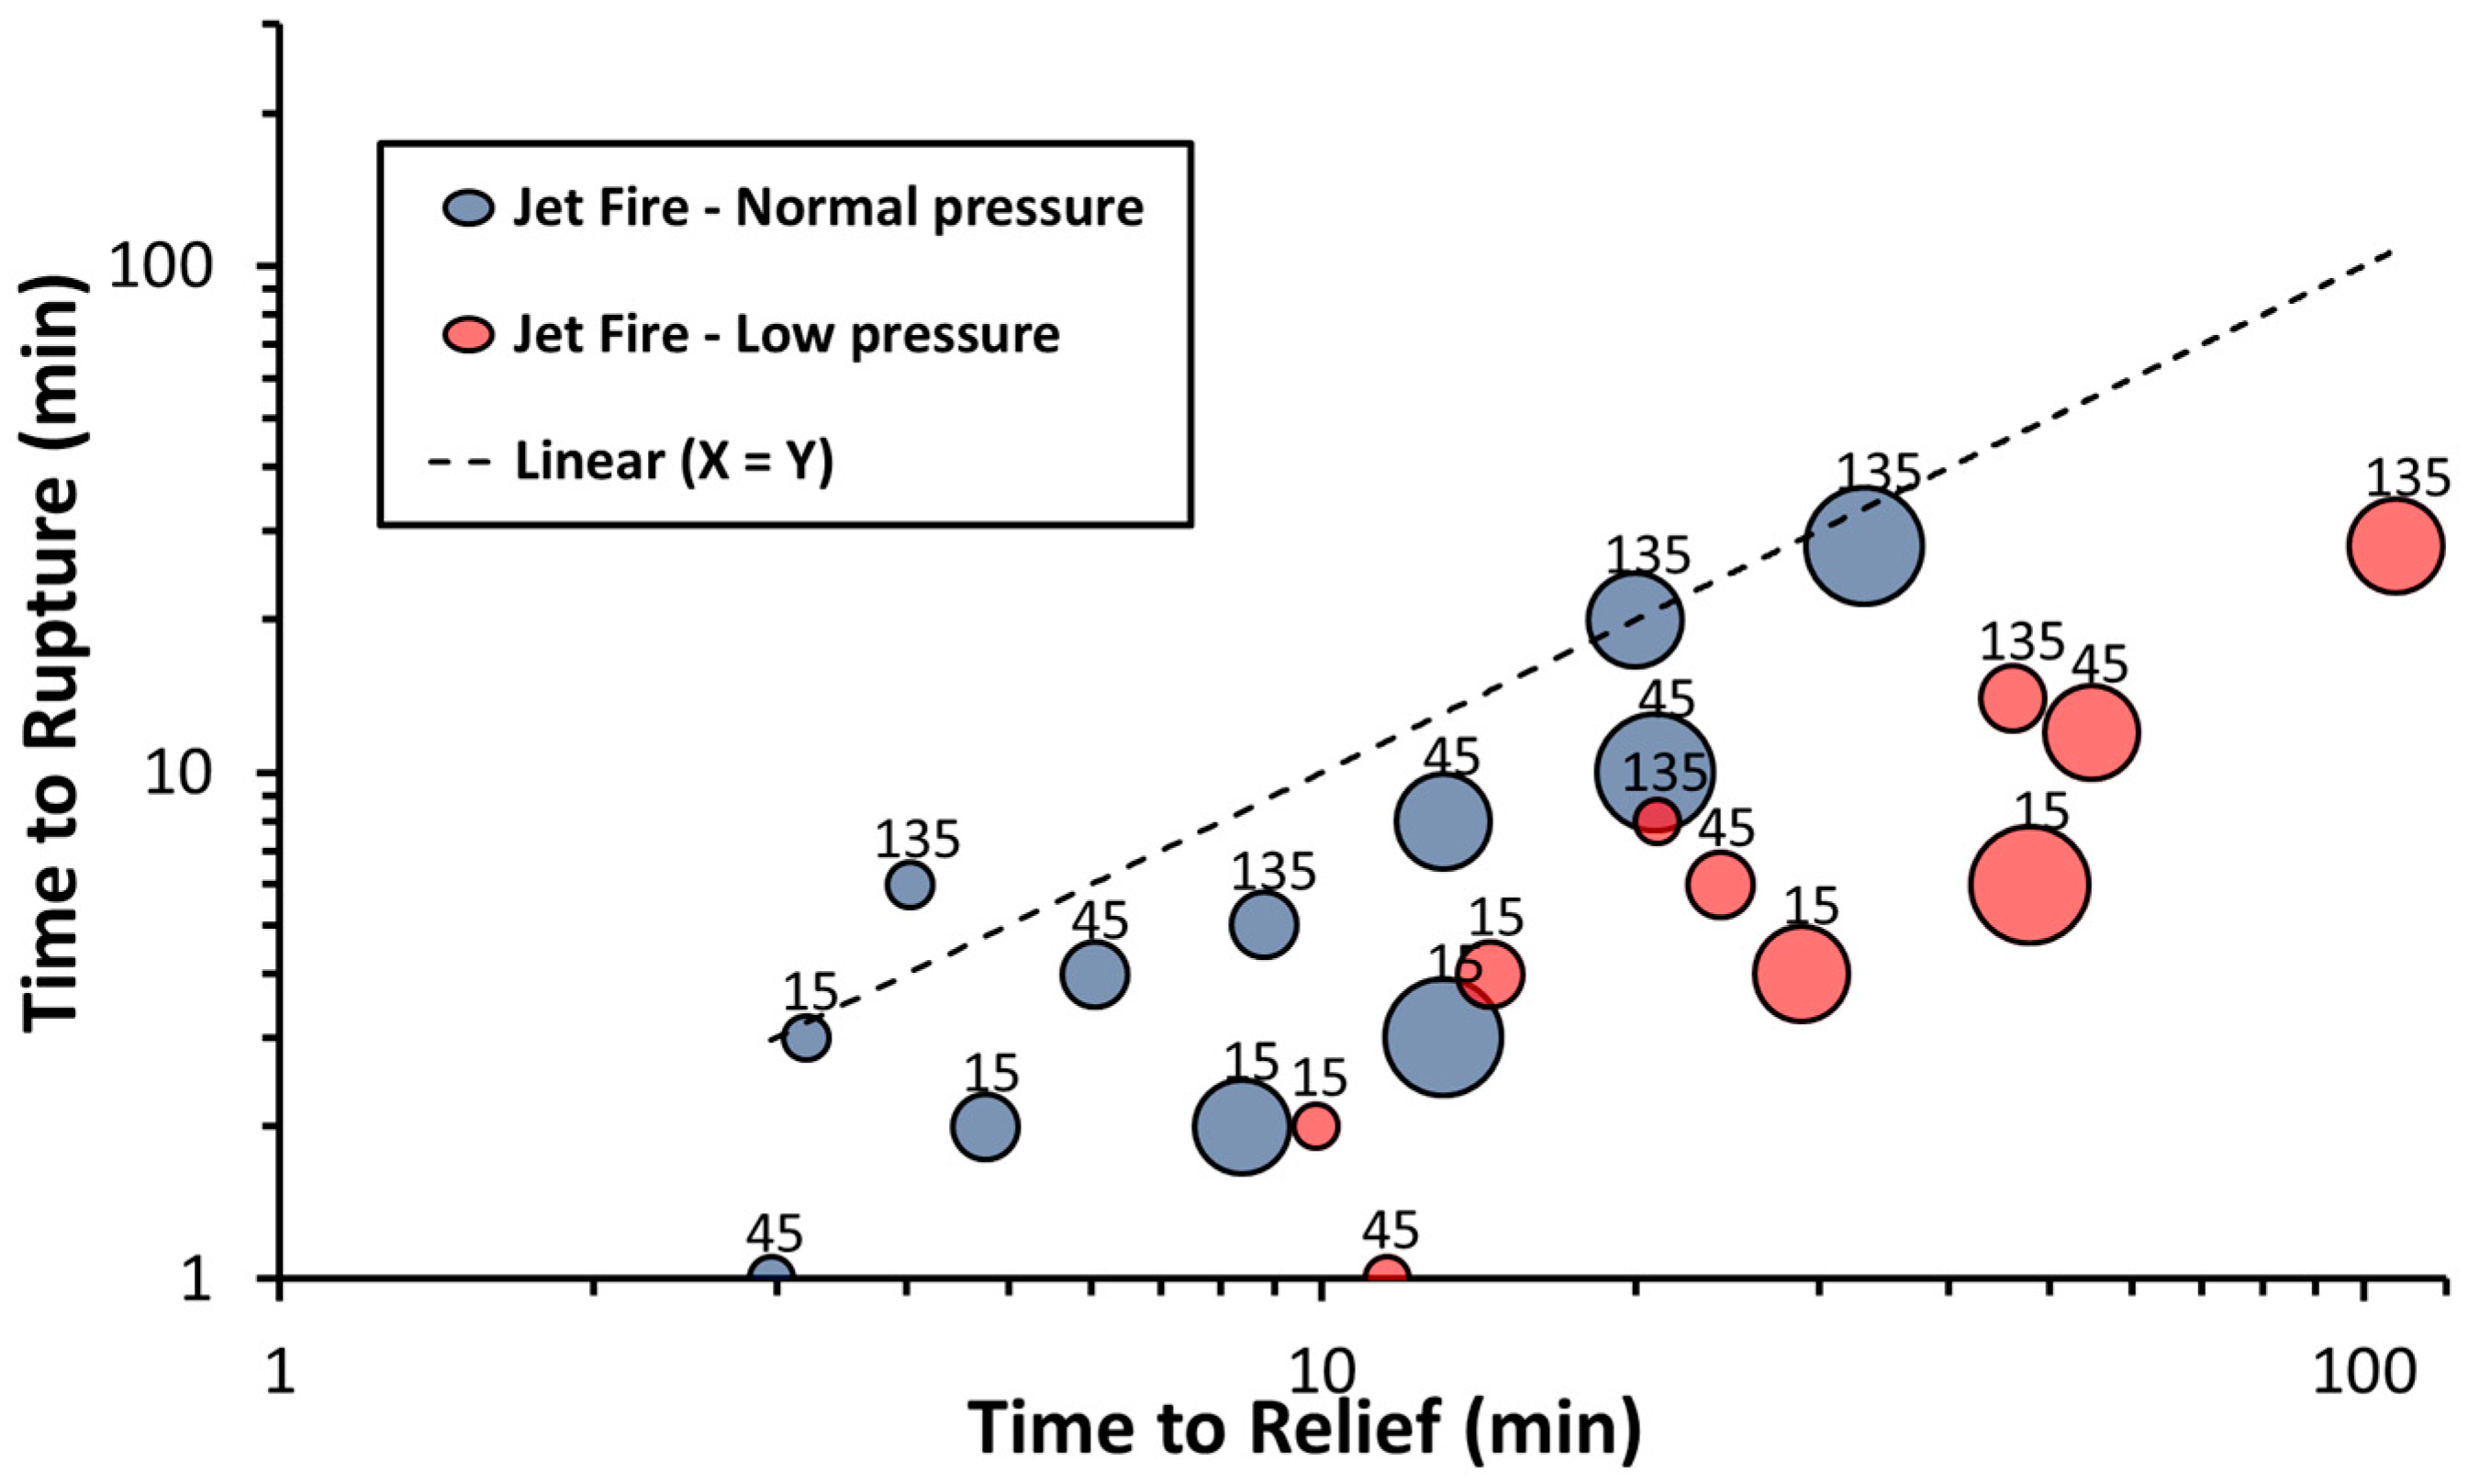
Figure 8.
Extension of vessel rupture time after the onset of relief as a function of time to relief for pool fire cases with normal operating pressure. Negative values indicate that rupture is predicted to occur before PRV relief pressure is reached.
Figure 8.
Extension of vessel rupture time after the onset of relief as a function of time to relief for pool fire cases with normal operating pressure. Negative values indicate that rupture is predicted to occur before PRV relief pressure is reached.

Table 1.
Proposed incident heat fluxes in kW/m2 based on [9].
Table 1.
Proposed incident heat fluxes in kW/m2 based on [9].
| Jet Fire | Pool Fire | ||
|---|---|---|---|
| Leak Rate > 2 kg/s | 0.1 kg/s < Leak Rate < 2 kg/s | ||
| Local peak heat load | 350 | 250 | 150 |
| Global average heat load | 100 | 0 | 100 |
Table 2.
Applied parameters in the fire heat flux modelling.
| Parameter | Unit | Global Heat Load | Local Heat Load | |
|---|---|---|---|---|
| Pool Fire | Jet Fire | |||
| Tf | K | 1078 | 1212 | 1429 |
| Tg | K | 1078 | 1212 | 1429 |
| αs | -- | 0.85 | 0.85 | 0.85 |
| εs | -- | 1.0 | 1.0 | 1.0 |
| εf | -- | 0.85 | 0.85 | 0.85 |
| H | W/m2 K | 30 | 30 | 100 |
| Q (t = 0) | kW/m2 | 87 | 130 | 311 |
Table 3.
Calculation matrix with steady-state API 521 relief valve sizing. Twenty-one percent overpressure has been applied in the sizing. Relief valve sizing has only been performed for cases with high operating pressure. For cases with low operating pressure, the margin to the design pressure/relief pressure results in the relief temperature exceeds the maximum wall temperature.
| Vessel Geometry and Design Data | API Sizing Data | ||||||||||||
|---|---|---|---|---|---|---|---|---|---|---|---|---|---|
| Diameter (m) | Length (T/T m) | Volume (m3) | Surface Area (m2) | Calc. Thickness (mm) | Chosen Thickness (mm) | Pdesign (bar) | Popr (bar) | Allow. Stress (N/mm2) | Relief Flow Calculated (kg/h) | Required Orifice Area (mm2) | API Orifice | Trelief (°C) | F′factor |
| 0.5 | 1.5 | 0.29 | 2.75 | 5.4 | 10.0 | 15 | 5 | 160 | |||||
| 0.5 | 1.5 | 0.29 | 2.75 | 5.4 | 10.0 | 15 | 10 | 160 | 115.6 | 13.7 | D | 306.3 | 0.012 |
| 0.5 | 1.5 | 0.29 | 2.75 | 10.2 | 10.2 | 45 | 15 | 160 | |||||
| 0.5 | 1.5 | 0.29 | 2.75 | 10.2 | 10.2 | 45 | 35 | 160 | 324.8 | 11.7 | D | 227.6 | 0.017 |
| 0.5 | 1.5 | 0.29 | 2.75 | 25.2 | 25.2 | 135 | 45 | 160 | |||||
| 0.5 | 1.5 | 0.29 | 2.75 | 25.2 | 25.2 | 135 | 115 | 160 | 726.8 | 8.2 | D | 185.3 | 0.021 |
| 1 | 3 | 2.36 | 11.00 | 7.7 | 10.0 | 15 | 5 | 160 | |||||
| 1 | 3 | 2.36 | 11.00 | 7.7 | 10.0 | 15 | 10 | 160 | 462.4 | 55.0 | D | 306.3 | 0.012 |
| 1 | 3 | 2.36 | 11.00 | 17.3 | 17.3 | 45 | 15 | 160 | |||||
| 1 | 3 | 2.36 | 11.00 | 17.3 | 17.3 | 45 | 35 | 160 | 1299.1 | 46.8 | D | 227.6 | 0.017 |
| 1 | 3 | 2.36 | 11.00 | 47.4 | 47.4 | 135 | 45 | 160 | |||||
| 1 | 3 | 2.36 | 11.00 | 47.4 | 47.4 | 135 | 115 | 160 | 2907.0 | 32.7 | D | 185.3 | 0.021 |
| 2 | 6 | 18.85 | 43.98 | 12.4 | 12.4 | 15 | 5 | 160 | |||||
| 2 | 6 | 18.85 | 43.98 | 12.4 | 12.4 | 15 | 10 | 160 | 1849.5 | 219.1 | G | 306.3 | 0.012 |
| 2 | 6 | 18.85 | 43.98 | 31.6 | 31.6 | 45 | 15 | 160 | |||||
| 2 | 6 | 18.85 | 43.98 | 31.6 | 31.6 | 45 | 35 | 160 | 5196.3 | 187.3 | F | 227.6 | 0.017 |
| 2 | 6 | 18.85 | 43.98 | 91.9 | 91.9 | 135 | 45 | 160 | |||||
| 2 | 6 | 18.85 | 43.98 | 91.9 | 91.9 | 135 | 115 | 160 | 11,629.4 | 130.8 | F | 185.3 | 0.021 |
| 3 | 9 | 63.62 | 98.96 | 17.1 | 17.1 | 15 | 5 | 160 | |||||
| 3 | 9 | 63.62 | 98.96 | 17.1 | 17.1 | 15 | 10 | 160 | 4161.5 | 494.8 | H | 306.2 | 0.012 |
| 3 | 9 | 63.62 | 98.96 | 45.9 | 45.9 | 45 | 15 | 160 | |||||
| 3 | 9 | 63.62 | 98.96 | 45.9 | 45.9 | 45 | 35 | 160 | 11691.6 | 421.5 | H | 227.6 | 0.017 |
| 3 | 9 | 63.62 | 98.96 | 136.3 | 136.3 | 135 | 45 | 160 | |||||
| 3 | 9 | 63.62 | 98.96 | 136.3 | 136.3 | 135 | 115 | 160 | 26,166.2 | 294.2 | G | 185.3 | 0.021 |
Table 4.
Results from the thermomechanical response simulations.
| Vessel Geometry and Design Data | Dynamic Simulation Output Data | Rupture Evaluation | |||||||
|---|---|---|---|---|---|---|---|---|---|
| Diameter (m) | Design Pressure (bar) | Operating Pressure (bar) | Time to Relief (min) | Initial Relief Temperature (°C) | Pool Fire Time to Rupture (min) | Pool Fire Pres. at Rupture (bar) | Jet Fire Time to Rupture (min) | Jet Fire Pres. at Rupture (bar) | Relief Valve Activation (Pool Fire) |
| 0.5 | 15 | 5 | 9.9 | 679.08 | 7 | 13.0 | 2 | 6.4 | FAIL |
| 0.5 | 15 | 10 | 3.2 | 202.87 | 7 | 15.0 | 3 | 14.5 | OK |
| 0.5 | 45 | 15 | 11.6 | 645.03 | 3 | 20.7 | 1 | 15.6 | FAIL |
| 0.5 | 45 | 35 | 3.0 | 124.59 | 2 | 39.6 | 1 | 36.0 | FAIL |
| 0.5 | 135 | 45 | 21.0 | 550.36 | 14 | 67.3 | 8 | 52.9 | FAIL |
| 0.5 | 135 | 115 | 4.0 | 78.54 | 12 | 135.1 | 6 | 126 | OK |
| 1 | 15 | 5 | 14.5 | 679.02 | 10 | 8.5 | 4 | 5.6 | FAIL |
| 1 | 15 | 10 | 4.8 | 202.89 | 6 | 12.2 | 2 | 10.2 | OK |
| 1 | 45 | 15 | 24.2 | 644.94 | 12 | 20.6 | 6 | 16.4 | FAIL |
| 1 | 45 | 35 | 6.1 | 124.42 | 8 | 39.4 | 4 | 36.0 | OK |
| 1 | 135 | 45 | 46.0 | 135.00 | 30 | 66.5 | 14 | 50.0 | FAIL |
| 1 | 135 | 115 | 8.8 | 78.55 | 12 | 135.1 | 5 | 121.2 | OK |
| 2 | 15 | 5 | 28.9 | 678.96 | 8 | 5.9 | 4 | 5.2 | FAIL |
| 2 | 15 | 10 | 8.4 | 202.37 | 6 | 10.7 | 2 | 10.1 | FAIL |
| 2 | 45 | 15 | 54.7 | 644.84 | 22 | 19.2 | 12 | 16.2 | FAIL |
| 2 | 45 | 35 | 13.1 | 124.25 | 16 | 38.8 | 8 | 35.9 | OK |
| 2 | 135 | 45 | 107.3 | 550.28 | 76 | 52.3 | 28 | 48.9 | FAIL |
| 2 | 135 | 115 | 20.0 | 78.48 | 46 | 135.7 | 20 | 119.7 | OK |
| 3 | 15 | 5 | 47.8 | 678.91 | 12 | 5.9 | 6 | 5.2 | FAIL |
| 3 | 15 | 10 | 13.1 | 202.21 | 8 | 12.1 | 3 | 10.3 | FAIL |
| 3 | 45 | 15 | - 1 | - 1 | 32 | 18.5 | 14 | 15.6 | OK |
| 3 | 45 | 35 | 20.9 | 124.21 | 24 | 38.4 | 10 | 35.5 | OK |
| 3 | 135 | 45 | - 1 | - 1 | 112 | 50.8 | 42 | 48.2 | OK |
| 3 | 135 | 115 | 33.1 | 78.48 | 76 | 121.4 | 28 | 118.3 | OK |
1 No relief reached.
© 2018 by the authors. Licensee MDPI, Basel, Switzerland. This article is an open access article distributed under the terms and conditions of the Creative Commons Attribution (CC BY) license (http://creativecommons.org/licenses/by/4.0/).
Share and Cite
MDPI and ACS Style
Andreasen, A.; Borroni, F.; Zan Nieto, M.; Stegelmann, C.; P. Nielsen, R. On the Adequacy of API 521 Relief-Valve Sizing Method for Gas-Filled Pressure Vessels Exposed to Fire. Safety 2018, 4, 11. https://doi.org/10.3390/safety4010011
AMA Style
Andreasen A, Borroni F, Zan Nieto M, Stegelmann C, P. Nielsen R. On the Adequacy of API 521 Relief-Valve Sizing Method for Gas-Filled Pressure Vessels Exposed to Fire. Safety. 2018; 4(1):11. https://doi.org/10.3390/safety4010011
Chicago/Turabian StyleAndreasen, Anders, Filippo Borroni, Marcos Zan Nieto, Carsten Stegelmann, and Rudi P. Nielsen. 2018. "On the Adequacy of API 521 Relief-Valve Sizing Method for Gas-Filled Pressure Vessels Exposed to Fire" Safety 4, no. 1: 11. https://doi.org/10.3390/safety4010011
Note that from the first issue of 2016, this journal uses article numbers instead of page numbers. See further details here.