Failure Rates for Aging Aircraft

1
School of Business Administration, Dalhousie University, Halifax, NS B3H 3J5, Canada
2
AlgoPlus Consulting Ltd., Halifax, NS B3H 1H6, Canada
*
Author to whom correspondence should be addressed.
Safety 2018, 4(1), 7; https://doi.org/10.3390/safety4010007
Submission received: 26 January 2017
/
Revised: 13 November 2017
/
Accepted: 20 February 2018
/
Published: 22 February 2018
Abstract
:In any consideration of the operating condition, the age of a particular aircraft is a major factor. Much attention is focused on planes which are aged, that is, aircraft with chronological age or accumulated hours of use beyond a threshold. Being aged is a state, and should be distinguished from aging, which is a process of degradation with use. The degradation process starts at first flight and continues through time, with the rate being affected by aircraft design, patterns of use, and maintenance procedures. In this paper, the cycles, block hours and failures were recorded, and failure rates with accumulated use were calculated. A pattern of increasing failure rates with accumulated use (age) is observable, with improvement (decline in rate) at times of planned maintenance. The evidence supports the hypothesis that aging, that is increasing rates of failure, begins early in the life of an aircraft. Early evidence of degradation is also a precursor for accelerated failure rates as use accumulates along the age trajectory.
1. Introduction
An aircraft is a complex machine composed of many interrelated parts, components and systems. When electrical and mechanical systems are designed there is an expected life length, where length refers to time units (hours) of use. As the aircraft and systems age and their use accumulates, they gradually degenerate until they are no longer able to perform the functions for which they were designed. That is, the system is in a failed state. The failure rate is the probability of failure at a point in time. When a part, component or system is not functional it can be upgraded through replacement or repair, and the condition of the aircraft is restored to some degree. Maintenance can be based on condition, that is, items are repaired when they fail. Failure during operation can have serious consequences, so detection of items with a high probability of failure through periodic inspection is a major component of maintenance. The most comprehensive maintenance is the D check. This major overhaul is a depot maintenance procedure that includes significant teardown of the aircraft, structural sampling for corrosion and cracking, detailed systems testing, and the replacement of worn components.
Of major concern in inspection and maintenance are the cracks in individual Airframes [1]. Widespread fatigue damage (WFD) has been a factor in major accidents. Structural cracks grow exponentially with age, and probabilistic models for projecting growth are critical for safety [2].
There is a growing body of evidence that aging effects are not limited to WFD [3]. The performance of engines, avionics, and other flight systems is also affected by age. Aging systems contribute in numerous ways to the operational equation. An example is the electrical wiring deterioration in older aircraft. Bundles of electrical wires could potentially be exposed to chemicals, chaffing, temperature extremes or even damage caused by maintenance and modification. So significant deterioration in the integrity of wiring can occur during normal operation. Similar deterioration can also occur in aircraft hydraulic systems.
In the US, the safety problems that an aircraft experiences during operation are recorded in Service Difficulty Reports (SDRs), which are maintained by the Federal Aviation Administration. The SDR data base has been considered as a potential source of important information on aircraft failures [4]. In a comparison of failure rates by carrier [5], identified significant factors in explaining the differences in the rate of SDR’s across carriers.
In this paper, the degradation in operating condition of aircraft with age will be considered, with age defined as accumulated hours of use. Operational failure is defined as mechanical problems affecting safety, which result in an unscheduled landing and unscheduled maintenance. A conceptual framework for aging systems is presented in Section 2. The approach centers on a counting process for the number of failures. The health or airworthiness over time of the individual aircraft is defined by failure counts, which are the basis for hypotheses about aging. Alternative statistical models for failure counts are presented in Section 3. In Section 4, the models are fitted to data on aircraft failures recorded from Service Difficulty Reports (SDRs) in the AlgoPlus (2004) data base [6]. The associated age and use data comes from the AVSOFT (2004) data base [7].
2. A Conceptual Framework for Aging and Systems Failure
System reliability involves the study of the overall performance of systems of interconnected components [8]. The main objective of system reliability is the construction of a model for the point process of failures [9]. An aircraft is a system of components. It is assumed that the many interrelated parts and components in an aircraft are subject to degradation with age and accumulated use. The operating condition or airworthiness of the aircraft is determined by the status of individual parts, components and systems, with the items that are most degenerated being the main determinants. There is a condition such that degeneration to that level implies failure, i.e., the item is no longer operational. As well, failure of certain components or combinations of components may render the aircraft not airworthy, which means the aircraft is in a failed state. To address the failure of operating systems, airline management undertakes a program of maintenance, with planned preventive maintenance and on-condition replacement of failed parts, components and systems. In this section, a conceptual framework for the degradation and repair of aircraft is presented. The model provides a foundation for hypotheses about operations which can be tested with field data.
To characterize the degradation process, consider that the operating condition of an aircraft is captured by an underlying health status index [10]. The value of the index is derived from the condition of the various parts, components and systems in the aircraft. Let be the age of an aircraft, defined by the accumulated hours of use, and let:
The condition of the various parts, components and systems is only assessed at a D check, so even if there was a composite formula for health status the value would be unknown most of the time.
The status is a dynamic stochastic process, with the change in status at any age being a random variable. It is assumed that the average condition declines with age, but at any point there is variation in status based on environmental factors and operating characteristics. The dynamics of degradation at a point in time can be represented by a stochastic differential equation as:
where is the degradation rate, is a scaling factor, and is an independent random process. The Brownian motion equation in (2) is intended as a concept: drift + error. There is work on degradation, particularly of airframes, and the degradation is geometric (exponential growth in cracks [2]). So the Health Index is on a log scale and hence the linearity is for log-dynamics. Also the parameters are age and status dependent.
In this degradation framework, at any age (hours of use) there is a chance the status of an item during operation will drop below the critical level for functionality, and the component reaches a failure state. Degradation and failure of components lowers the value of the health status index Y. There is a minimum equipment list (MEL) such that failure of parts and components on the list still leaves the aircraft airworthy [11]. Beyond the MEL list, moderate mechanical failures which occur while an aircraft is in operation would render the aircraft not airworthy. Assume that the critical health status level defines airworthiness. Then an aircraft failure occurs when Failure is not defined by fatalities, but by airworthiness. There is some evidence that fatal crashes are not age related [12].
The implication of degradation with age is an accumulation of failures. While the actual health status is likely unknown, information on failures (time, component/system) is known. Furthermore, the process of accumulated failures to a point in time is used as a proxy for health status in biological aging [13]. So our attention will focus on the number of failures.
Based on the stochastic model, the many parts, components and systems have a probability of failure during operation and therefore the aircraft has a probability of failure. For an airworthy aircraft, the important variable is the time to failure. Let T be the length of life (hours of use before failure) of an aircraft, with the probability distribution and the corresponding density Then the failure rate at time t is:
The failure time distribution is determined by the failure rate, since Failure during operation may precipitate unscheduled maintenance, particularly when items beyond the MEL fail and consequently the aircraft is not airworthy. The repair/replacement of failed items is called on-condition repair. On-condition repair brings the system to the operating status expected of the system given its age, i.e., same status as just prior to failure. These are called minimal repairs [11]. The aircraft failure rate is unchanged by these minimal repairs since other parts, components and systems are still in the degraded state attained just before repair. Typically moderate mechanical failures result in such minimal repair.
In addition to unscheduled maintenance, the whole system is subject to time based or block repair, where items are inspected and replaced/refurbished [14,15]. This is the D check. This scheduled preventive maintenance improves operating condition to a status greater than expected for age and correspondingly reduces the system failure rate [16,17].
To incorporate repair into the degradation model, the age variable is partitioned into intervals based on the block repair times. Assume that the first scheduled block repair is at age (hours of use) , and subsequent block repairs are at regular intervals of hours of use, where Then age can be written as:
where The notation defines the greatest integer less than The expression (4) gives age in terms of the number of block repairs, and the use since last block repair. The definition of age in terms of block repair times in (4) is basic to our approach to studying the accumulation of failures.
The partition of age at block repairs generates renewal cycles for the degradation process, with the first cycle starting at the initial status y0, and subsequent cycles beginning at status defined by the repair line. A representation of the cycles of degradation and repair for an aircraft is shown in Figure 1.
In each renewal phase of the degradation model there is a chance that the aircraft fails, that is, status drops below the critical level For let:
The failure time distribution for is written as with density Given the failure time distribution, the failure rate in the jth cycle is The failure rate is age dependent, but also block repair (cycle) dependent.
Consider:
Since the expected number of failures is:
In the failure rate for each renewal phase, the probability distribution for time to failure has the same form, but the starting state in each phase declines. With starting state in phase as define:
So is the expected number of failures between times 0 and x in phase j + 1, with failure time distribution and starting state Therefore,
This equation is generic and there are no assumptions about the rate of failures within a cycle. A picture of the number of failures process is given in Figure 2.
The accumulated failure process characterized by Equation (9) will be analyzed in the next section.
3. Models for Patterns in the Number of Failures
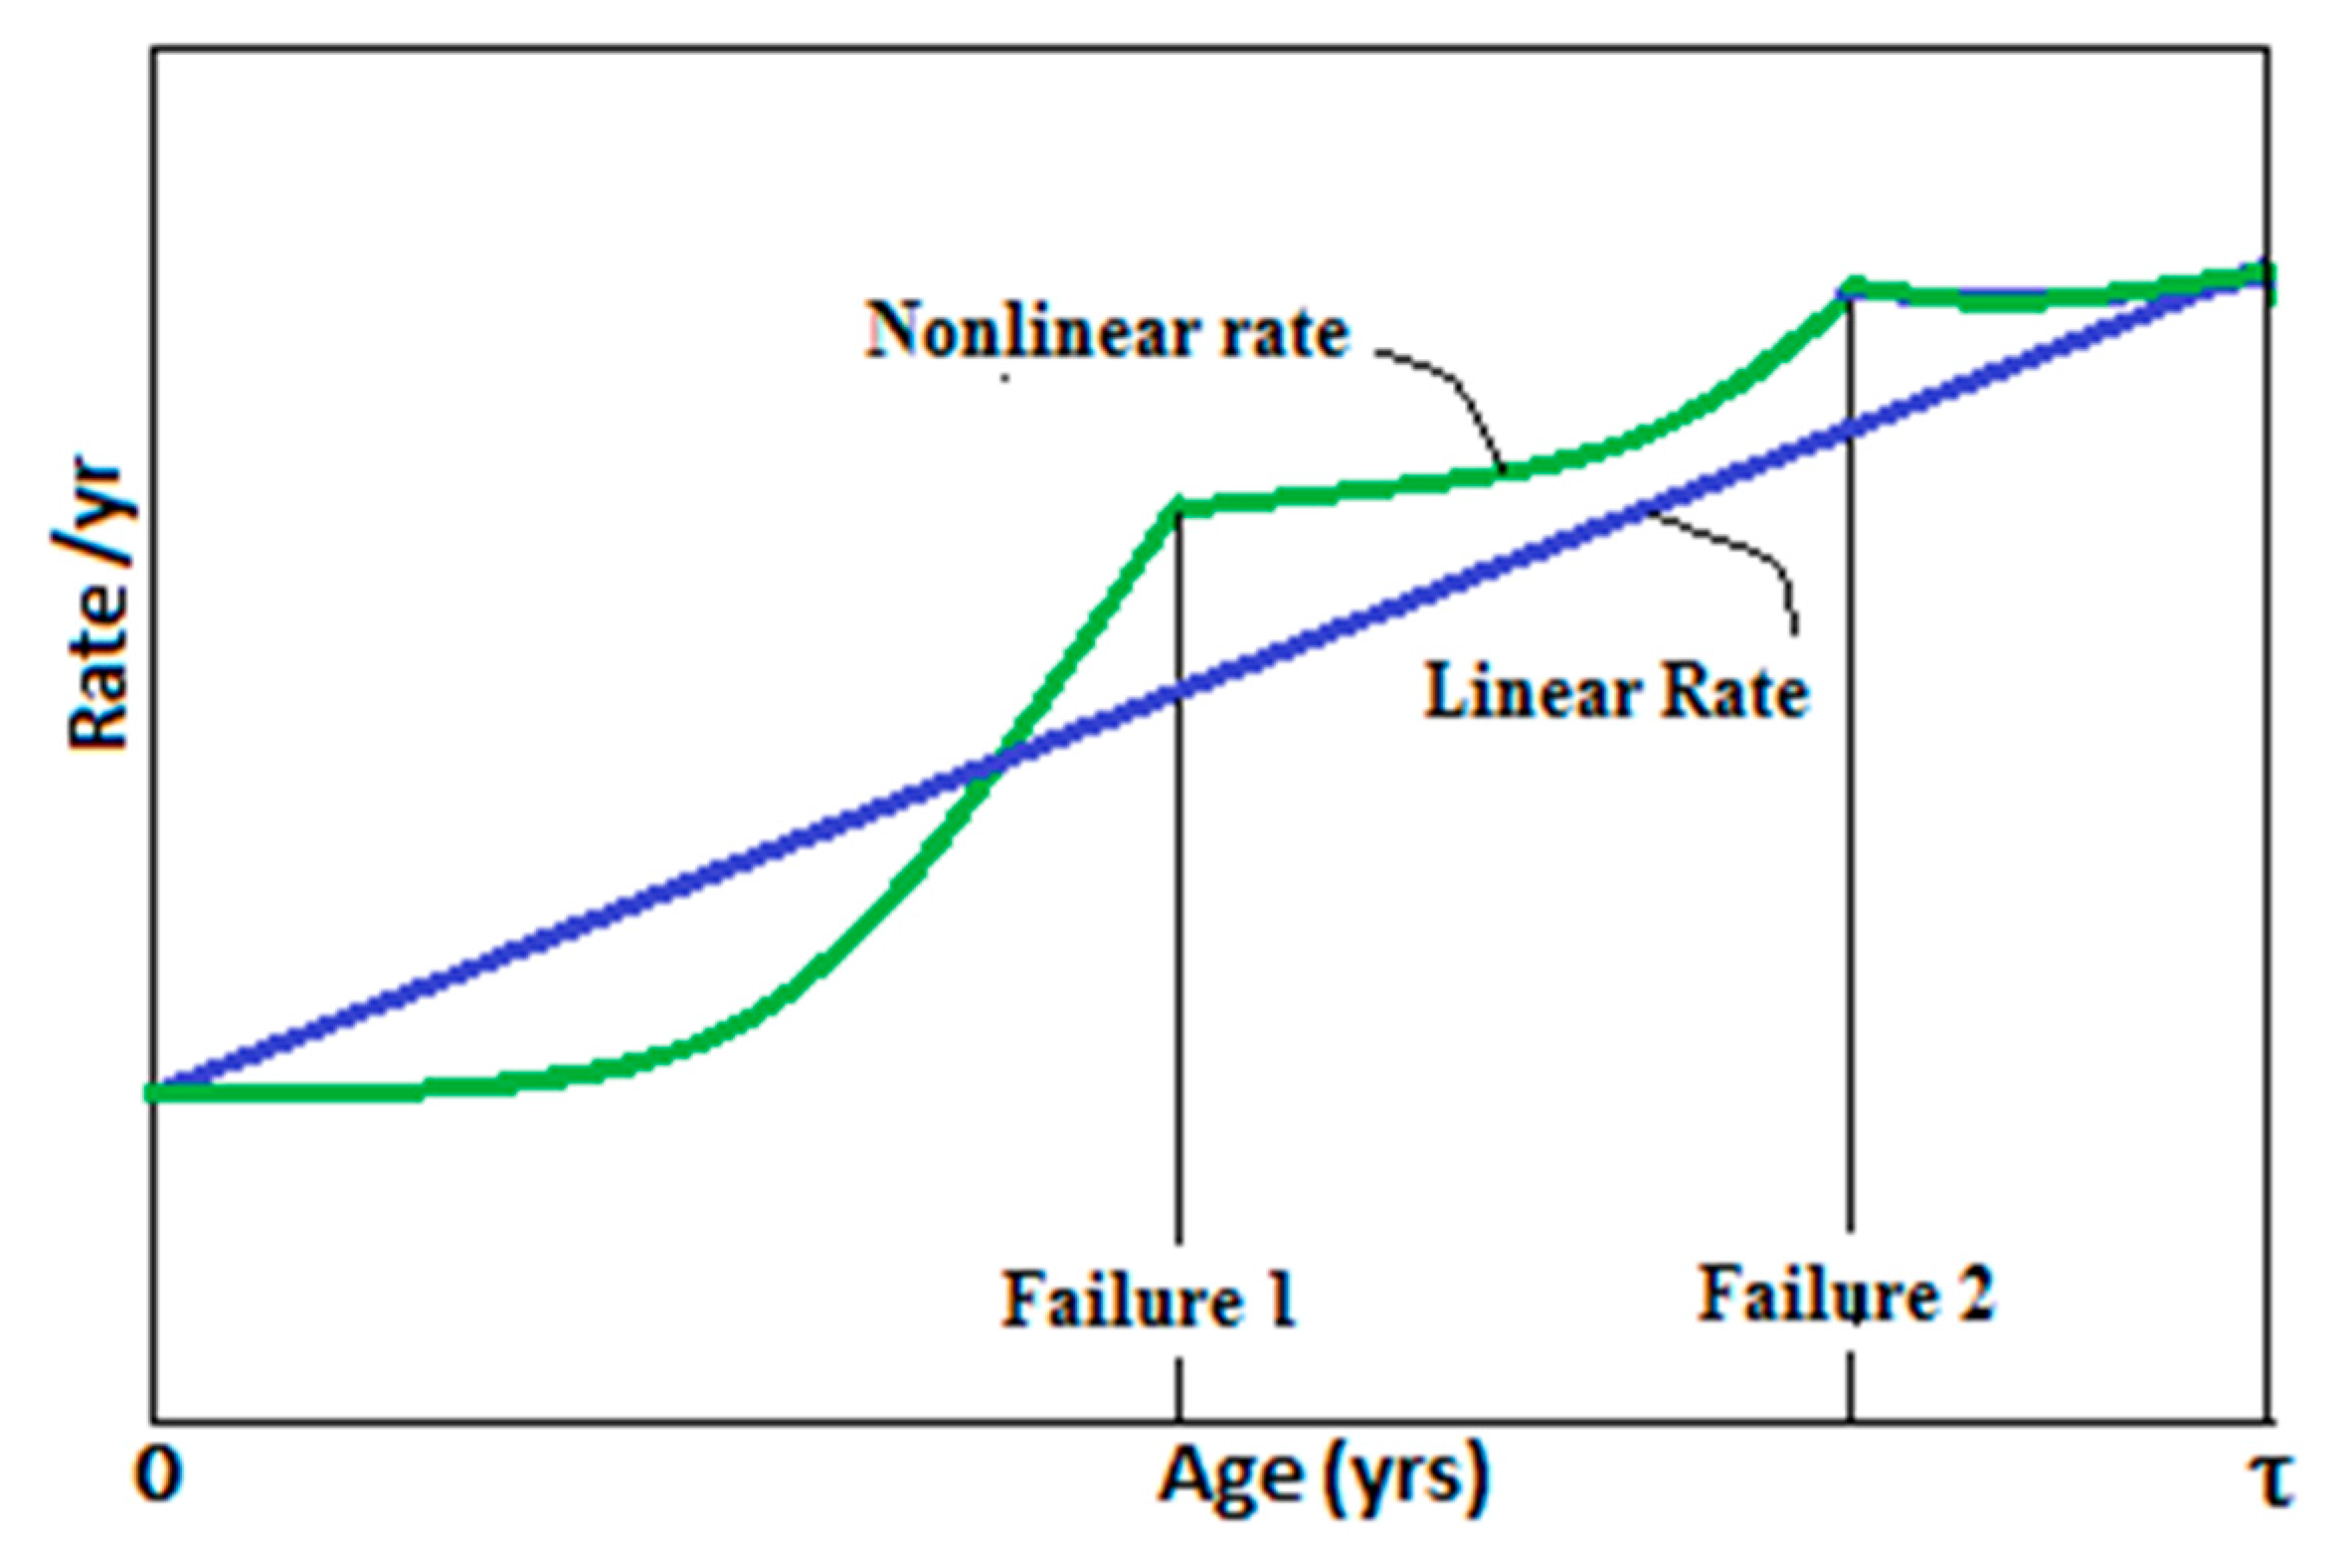
The accumulated number of failures process in (9) is based on the number of failures in a repair cycle. The rate of failure at times within a cycle is integrated out. In this section we will make some simplifying assumptions about the rate to develop hypotheses for aging and repair. The cases we consider are linear rate and power law rate. The power law is a special case of an accelerating rate with age, with the rate depending on failure history within a repair cycle. The contrasting rates are shown in Figure 3.
3.1. Linear Approximation to Failure Rate between Repairs
The link between the latent state model for degradation/repair and the model for number of failures shows how the operating practices of airlines can manifest themselves in mechanical failures, safety problems, and unscheduled maintenance. Historical data on failures and maintenance will have that complex relationship embedded. The information on failures and block repairs is available, but the degradation rate and extent of repair (fraction of good as new) are unknown. The transformation of Equation (9) for expected number of failures, to an expression in terms of the number of block repairs and the time since last block repair, can be achieved by a series approximation. Let the failure rate at time be:
Integrating we get the accumulation within a cycle where Note that the linear rate (10) leads to a quadratic function for the accumulated number of failures in a repair cycle as illustrated in Figure 2. Considering time as composed of repairs and time since last repair with and substituting the approximations into (9), the expected number of failures has the form:
So is the expected number of failures in the first phase. capture the expected number of failures in subsequent phases, and capture the expected number in the last (incomplete) phase.
The approximating equation for expected number of failures is in a form which is very suitable for analysis. Consider an observation window (Interval) where . With and the number of failures in the interval is approximately so that:
This change model relates the number of failures in an observation window to the degeneration and the block repairs in the window. In Equation (12), if the first repair is in the interval, and zero otherwise; if a later repair occurs in the window, and zero otherwise. We will use data on failures and repairs in an observation window to estimate the parameters in (11) and (12).
3.2. Power Law for Failure Rate between Repairs
The linear approximation to the failure rate over a repair phase may yield a close approximation to number of failures within a repair phase but it is likely the chance of failure is more complicated, with previous failures in the phase affecting the rate. Also the evidence that degradation of components is exponential implies that the failure rate accelerates with age.
To incorporate accelerating rates assume that the failures follow a Power Law process [18].
With tj = time between failures (j − 1) and j time between failures (j − 1) and j, the cumulative distribution for tj is given by:
The distribution (13) incorporates the accelerating rate with age and the failure history. Between failures, the failure rate depends on time/age according to the power law. That is, between failures and , the failure rate is:
The parameter captures the age effect. If the failure rate increases with increasing age/use. Analogously, if the failure rate decreases with increasing age.
Transforming the distribution (13) gives the linear relationship:
Equation (15) is the basis of the least squares estimation of the Power Law parameters. Consider a sample of n aircraft, with the set of times between the the (j − 1)th and jth failures, Let and . Ordinary least squares yields the line , which provides estimates:
A test on the hypothesis is based on the statistic.
4. Model Estimation
The methods in Section 3 developed models for the counting process of failures between major repairs/overhauls. A key feature of the models is the implied link between the pattern in accumulated failures and the degradation of aircraft with age. The focus on failures is important since the information on the type and timing of failures is recorded by regulation and is available publicly. We estimated the failure rate models with data from AlgoPlus on operating failures and Avsoft on aircraft use. The AlgoPlus data has detailed records on all unscheduled landings as reported in Service Difficulty Reports for all commercial aircraft in the United States. The Avsoft data has records on departures and flying hours for all commercial aircraft in North America. Both data sets have for each aircraft: serial number, chronological age, model and carrier/operator.
For the purposes of this study an operating failure is defined by an unscheduled landing due to mechanical problems affecting safety. So an unscheduled landing is a record of an operating condition at or below a critical or intervention level. In Figure 1, the unscheduled landings (failures) occur when the health status drops to the critical level, where airworthiness fails. This is a hard definition of failure, since components can fail and not lead to an unscheduled emergency landing. There is a minimum equipment list of components, which may fail and still the flight can continue. In terms of the degradation/repair model, the critical condition line is below the condition for failures on the MEL, so that hitting the critical line implies unsafe operation and a need to interrupt the flight of an aircraft. There are many components and systems which precipitate an unscheduled landing. In Table 1 is a list of frequent sources (taken from the Canadian Civil Aviation Daily Operating Report System—CADORS).
The degradation of the various systems is different, that is it occurs at different rates and has different severity implications. The counting of events assigns equal importance to the varied types. The context for this adding apples and oranges is the evidence for biological aging [13], where the accumulation of deficits is strongly correlated with aging.
4.1. Linear Failure Rate Model
To estimate the linear approximation model, a window of time was taken to observe failures. All model B737-300 aircraft for a single operator were selected for study. For each aircraft the following information was recorded: (i) model; (ii) operator; (iii) age on 30 December 1995; (iv) use (block hours, cycles) by month from January1990 to December 1995: (v) dates out of service for at least one month during 1990–1995; (vi) number of unscheduled landings during 1990–1995 inclusive. The out of service period in the observation window is interpreted as a time when scheduled repair is undertaken. The identification of these periods is within a record of otherwise continuous use. Outside the observation window, the block repair (D check) cycle was set at 10 years for the first block repair, and 8 years for subsequent block repairs. This is based on the recommendations for D-check cycles. Of course in practice the time of block repairs would be variable across aircraft and using a fixed value (outside the window) could reduce the power of fitted models.
The formulation of a change model for the number of failures creates a framework suitable for observation and statistical analysis. Based on the model in Equation (12), consider the regression model:
with the number of failures between ages and ,
- indicator for the first repair in interval,
- indicator for the repair in interval,
- difference between the squared number of repairs,
- the difference in residual times
- the difference in squared residual times
- random error.
In the regression model, it is proposed that the unscheduled landings and item failures from degradation are directly related to the number of block repairs and time since last block repair. There are other factors such as repair skill level, maintenance philosophy, and operational environment involved in unscheduled landings [10]. So the coefficients in the regression model depend on the aircraft model and the aircraft operator.
The coefficients in the regression model are counterparts of coefficients in the failure model (11), and appropriate tests characterize the role of degradation and repair on failures for a particular model, operator combination. The relevant research hypotheses are:
- (1)
- block repair is incomplete
- (2)
- repair fraction is decreasing
- (3)
- failure rate is increasing
- (4)
- an accelerated failure rate.
Because the number of failures is a counting variable, the error variance is likely not constant. Therefore to estimate parameters, an iteratively re-weighted least squares estimation method was used, where the weights were reciprocals of the fitted values [19]. The effect of weighting was minimal, so the un-weighted sums of squares are reported. The results from fitting the degradation model are given in Table 2 and Table 3. The tables use the notation: DF = degrees of freedom in associated sum of squares; = observed effect of , where .
Clearly the overall fit of the change model is strong (F = 96.22). Furthermore, the individual components in the model are highly significant. Each of the hypotheses enumerated above are supported by the evidence in the data. Maintenance in the observation window, and time since maintenance, are important factors in predicting the number of unscheduled landings that occur in the window. Of particular significance is the acceleration in number of failures (increasing failure rate) as time since repair increases (). The estimated model parameters were used in equation 11 to get expected accumulated number of unscheduled landings with age in Figure 4.
The last repair cycle is incomplete so a failure rate within cycles is estimated. This effect is followed up with a separate analysis of the first repair cycle using the Power Law model.
4.2. Power Law Analysis
From the results of the regression model for the change in number of failures in an observation window, it is concluded that accelerated degradation and aging occurs between block repairs. This effect will be considered further for the initial phase: the first 10 years of operating life. A 1992 birth cohort of 20 of the B757-200 aircraft for a single operator were followed from 1992 to 2002. From the record of unscheduled landings in the AlgoPlus data base, the dates and the times between UL’s was recorded. The time is calendar time, and that captures accumulated use since the use of aircraft was very consistent over the 10 year period. Some statistics on the times between failures are presented in Table 4.
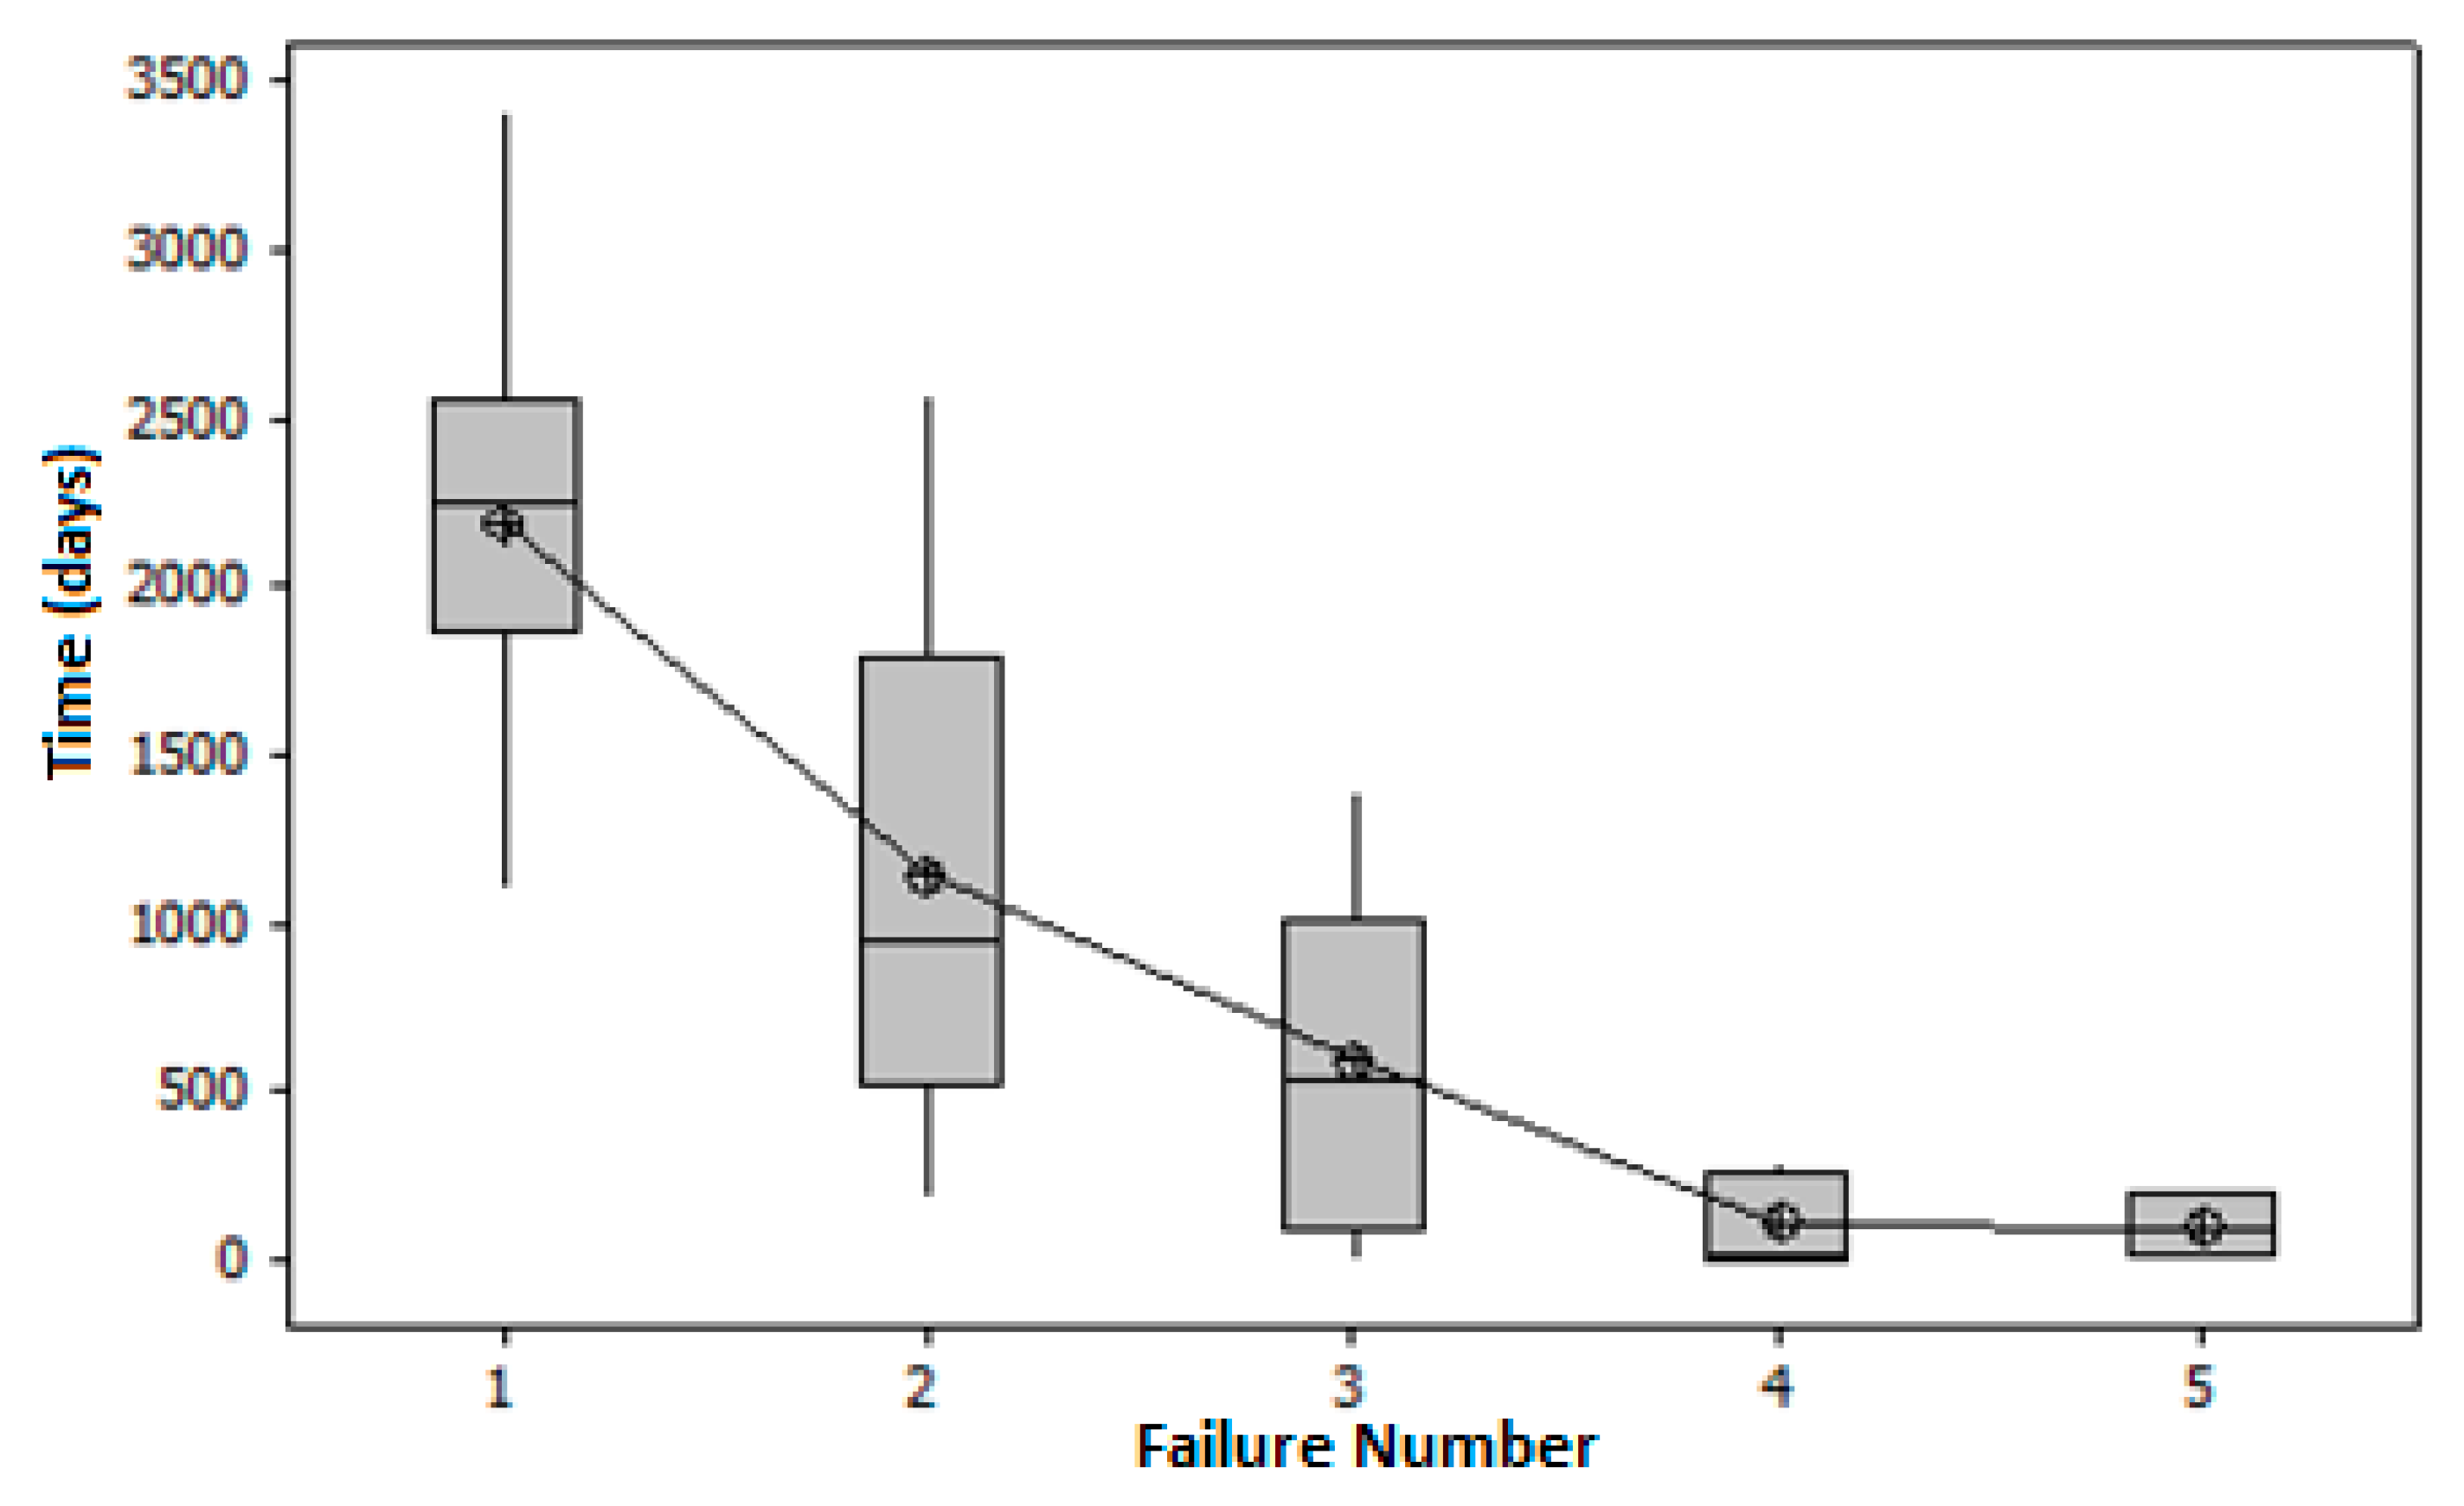
Although the data only covers the initial period of use, there are 53 unscheduled landings. As expected the times between successive unscheduled landings decreases. This observation is consistent with the degradation with age depicted in Figure 1. The pattern of decreasing MTB (and increasing rates) is clearer in the boxplot in Figure 5. The trend is more geometric than linear, suggesting that the health status measure is on a log scale and the growth in structural and other problems is exponential.
With the time between failures depending on age, and in particular the number of previous failures, separate distributions were fit to the failure times classified by failure number. The parameters were estimated from the regression model:
where is the empirical distribution for time to jth failure. The results of that analysis are given in Table 5.
The important statistics in the analysis are the shape estimates. For the time to the first failure the shape estimate is , indicating that the failure rate is increasing in time/age. Both and are statistically significant. At the other end, the estimates are less that 1. So the failure rate is decreasing in time. Of course the estimates for failure time distributions between failures (2,3), (3,4), (4,5) are based on few observations and are not statistically significant. The corresponding mid-interval failure rates are shown.
5. Conclusions
This study has considered the trajectory of health status of an individual aircraft, with emphasis on episodes where flights are interrupted because of unscheduled landings resulting from mechanical failures affecting safety. The interest is in the aging of aircraft with accumulated use as evidenced by an increasing rate of mechanical failure. Two experiments were carried out.
In the first experiment, a single model and carrier was analyzed for the potential impact of aircraft age (accumulated use) and repair on the accumulated number of failures. It is assumed that all the selected aircraft are equivalent except for age, and that the fleet management practices of the carrier are consistent over time. In this setting, the variability in the rate of failures (unscheduled landings) can be partly attributed to aging of aircraft and incomplete repair at preventive maintenance (D checks).
The second experiment involved a cohort of aircraft beginning service in the same year for a single operator. The emphasis in the second experiment was the first 10 years of use to profile the early degradation with use, and in particular the dependence of time to failure on prior failures. The Power Law distribution was fitted to failure times between successive failures.
From the experiments the following conclusions are reached:
- (1)
- The failure rate is increasing with use within a phase between scheduled maintenance D checks.
- (2)
- The failure rate grows with the number of scheduled maintenance phases.
- (3)
- The repair at scheduled maintenance is not to “good as new”.
- (4)
- The failure rate within a repair phase depends on the number of prior failures.
It is expected that aircraft degrade with use as parts and components wear. Periodic maintenance is planned to avoid incidents where failed parts affect the operational condition of an aircraft. The objective of the studies in this paper is to establish that the patterns in the accumulated number failures of aircraft are evidence of degradation with age. This is important since failures are documented in existing large data bases. Combined with specific studies on aging of parts, components and systems in aircraft, the counting processes could be used to define an index of aircraft airworthiness analogous the frailty index for human aging.
Author Contributions
Leonard MacLean and Alex Richman conceived and designed the experiments. Mark Hudak provided the data on aircraft. Leonard MacLean analyzed the data and wrote the paper.
Conflicts of Interest
The authors declare no conflict of interest.
References
- Berens, A.P.; Hovey, P.W.; Skinn, D.A. Risk Analysis for Aging Aircraft Fleets; Springer: Berlin, Germany, 1991. [Google Scholar]
- Molent, L.; Jones, R. A stress versus crack growth rate investigation (aka stress—cubed rule). Int. J. Fatigue 2016, 87, 435–443. [Google Scholar] [CrossRef]
- Lebow, C.; Sarsfield, L.; Stanley, W.; Ettedgui, E.; Henning, G. Safety in the Skies: Personnel and Parties in NTSB Aviation Accident Investigations; Rand Corporation Report 1122/1-ICJ; Rand Publishing: Santa Monica, CA, USA, 2000. [Google Scholar]
- Sampath, S.G. Safety and Service Difficulty Reporting. In Aging Aircraft Fleets: Structural and Other Subsystem Aspects; RTO Lecture Series 218, RTO-EN-015; Defense Technical Information Center: Fort Belvoir, VA, USA, 2000. [Google Scholar]
- Kanafani, A.; Keeler, T.; Sathisan, S. Airline Safety Posture: Evidence from Service Difficulty Reports. J. Transp. Eng. 1993, 119, 655–664. [Google Scholar] [CrossRef]
- AlgoPlus. 2004. Available online: http://www.cislpiloti.org/Technical/GAIN/WGB (accessed on 1 May 2015).
- FlightGlobal. Available online: http://www.avsoft.co.uk/ (accessed on 1 May 2015).
- Gavrilov, L.A.; Gavrilova, N.S. Reliability theory of aging and longevity. In Handbook of Biology of Aging; Masoro, E.J., Austad, S.N., Eds.; Academic Press: SanDeigo, CA, USA, 2005; pp. 1–40. [Google Scholar]
- Aven, T.; Jensen, U. Stochastic Models in Reliability; Springer: New York, NY, USA, 1998. [Google Scholar]
- Phelan, M. Health Check. Flight Int. 2003, 163, 26–27. [Google Scholar]
- Block, H.; Borges, W.; Savits, T. Age-dependent minimal repair. J. Appl. Probab. 1985, 22, 370–385. [Google Scholar] [CrossRef]
- Hansman, H.J. Analysis of Impact of Aircraft Age on Safety for Air Transport Jet Airplanes; International Center for Air Transportation (ICAT), Massachusetts Institute of Technology: Cambridge, MA, USA, 2014. [Google Scholar]
- Mitnitski, A.B.; Mogilner, A.J.; Rockwood, K. Accumulation of deficits as a proxy measure of aging. Sci. World J. 2001, 1, 323–336. [Google Scholar] [CrossRef] [PubMed]
- Caldwell, J.; Mallis, M. Fatigue Countermeasures in Aviation. Aviation Space Environ. Med. 2009, 80, 29–59. [Google Scholar] [CrossRef]
- Eliaz, N.; Latanision, R.M. Preventative Maintenance and Failure Analysis of Aircraft Components. Corros. Rev. 2007, 25. [Google Scholar] [CrossRef]
- Brown, M.; Proschan, F. Imperfect repair. J. Appl. Probab. 1983, 20, 851–859. [Google Scholar] [CrossRef]
- MacLean, L.C.; Richman, A.; Richman, V.; Larsson, S. The dynamics of aircraft degradation and mechanical failure. J. Transp. Stat. 2005, 8, 1–11. [Google Scholar]
- Weibull, W.A. A statistical distribution function with wide applicability. J. Appl. Mech. 1951, 18, 293–297. [Google Scholar]
- McCullagh, P.; Nelder, J. Generalized Linear Models, 2nd ed.; Chapman & Hall: London, UK, 1989. [Google Scholar]
Figure 1.
Aircraft Degradation and Repair.
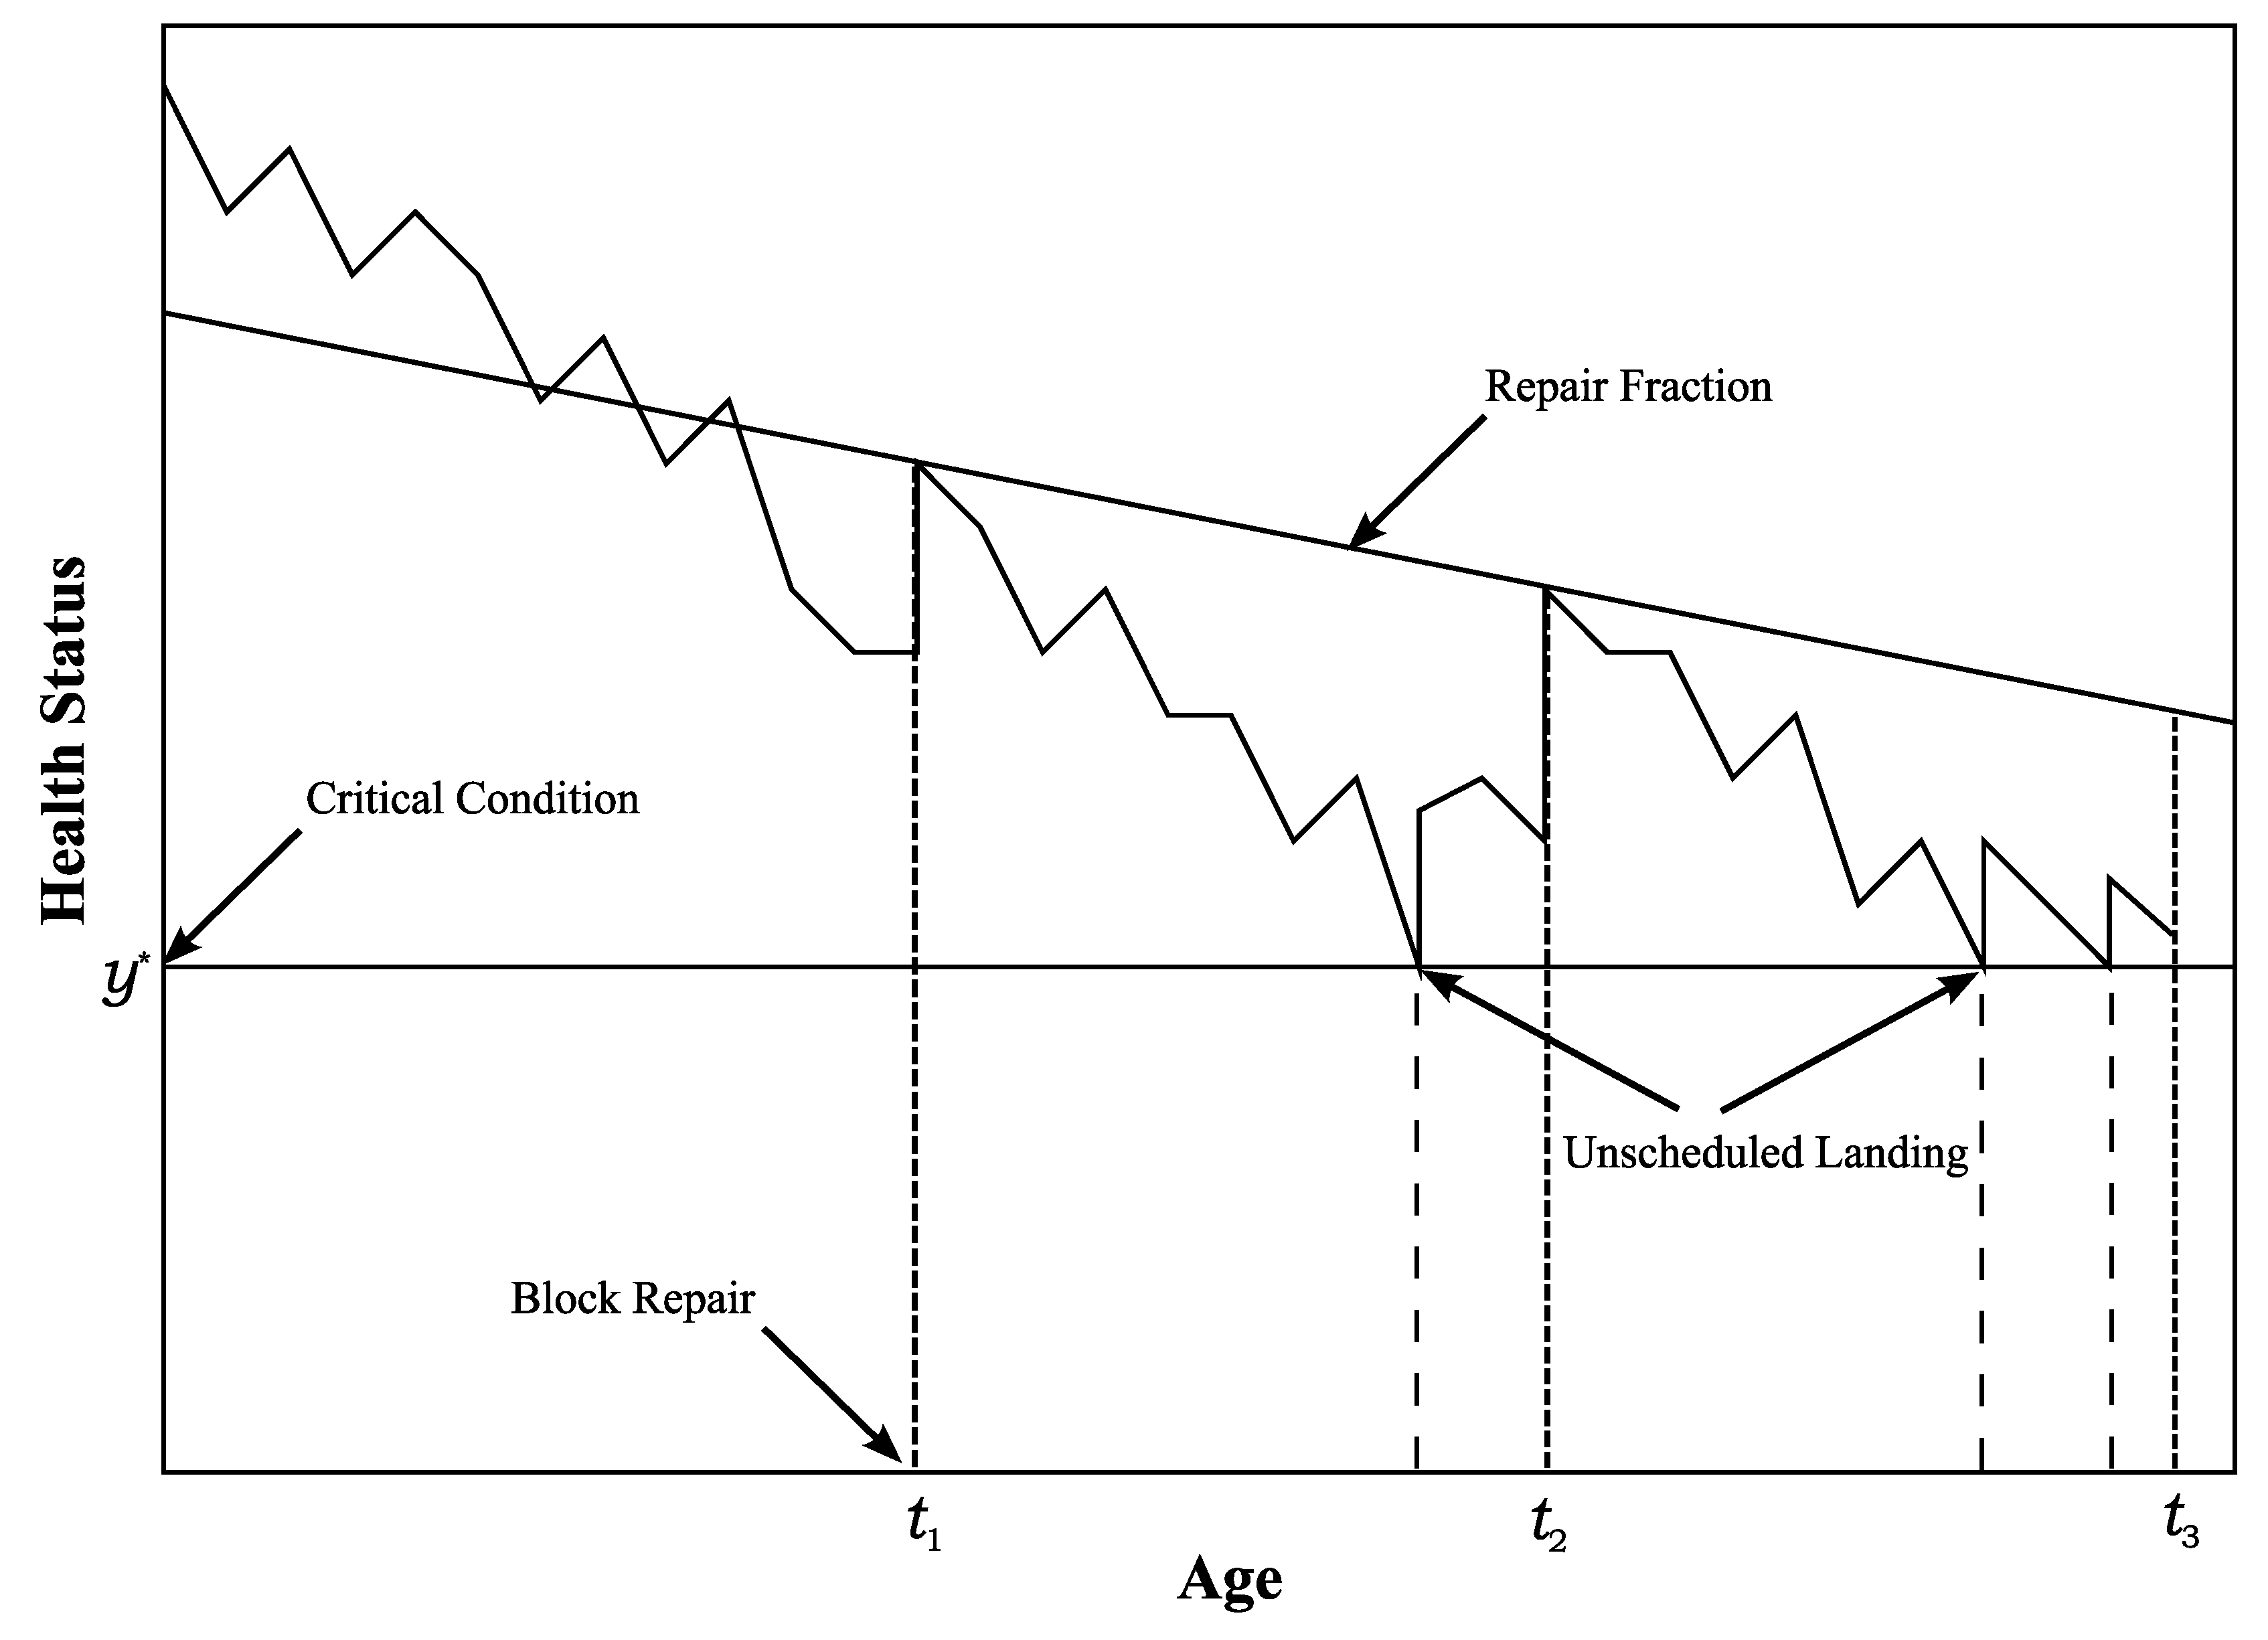
Figure 2.
Accumulated Failures in Repair Cycles.
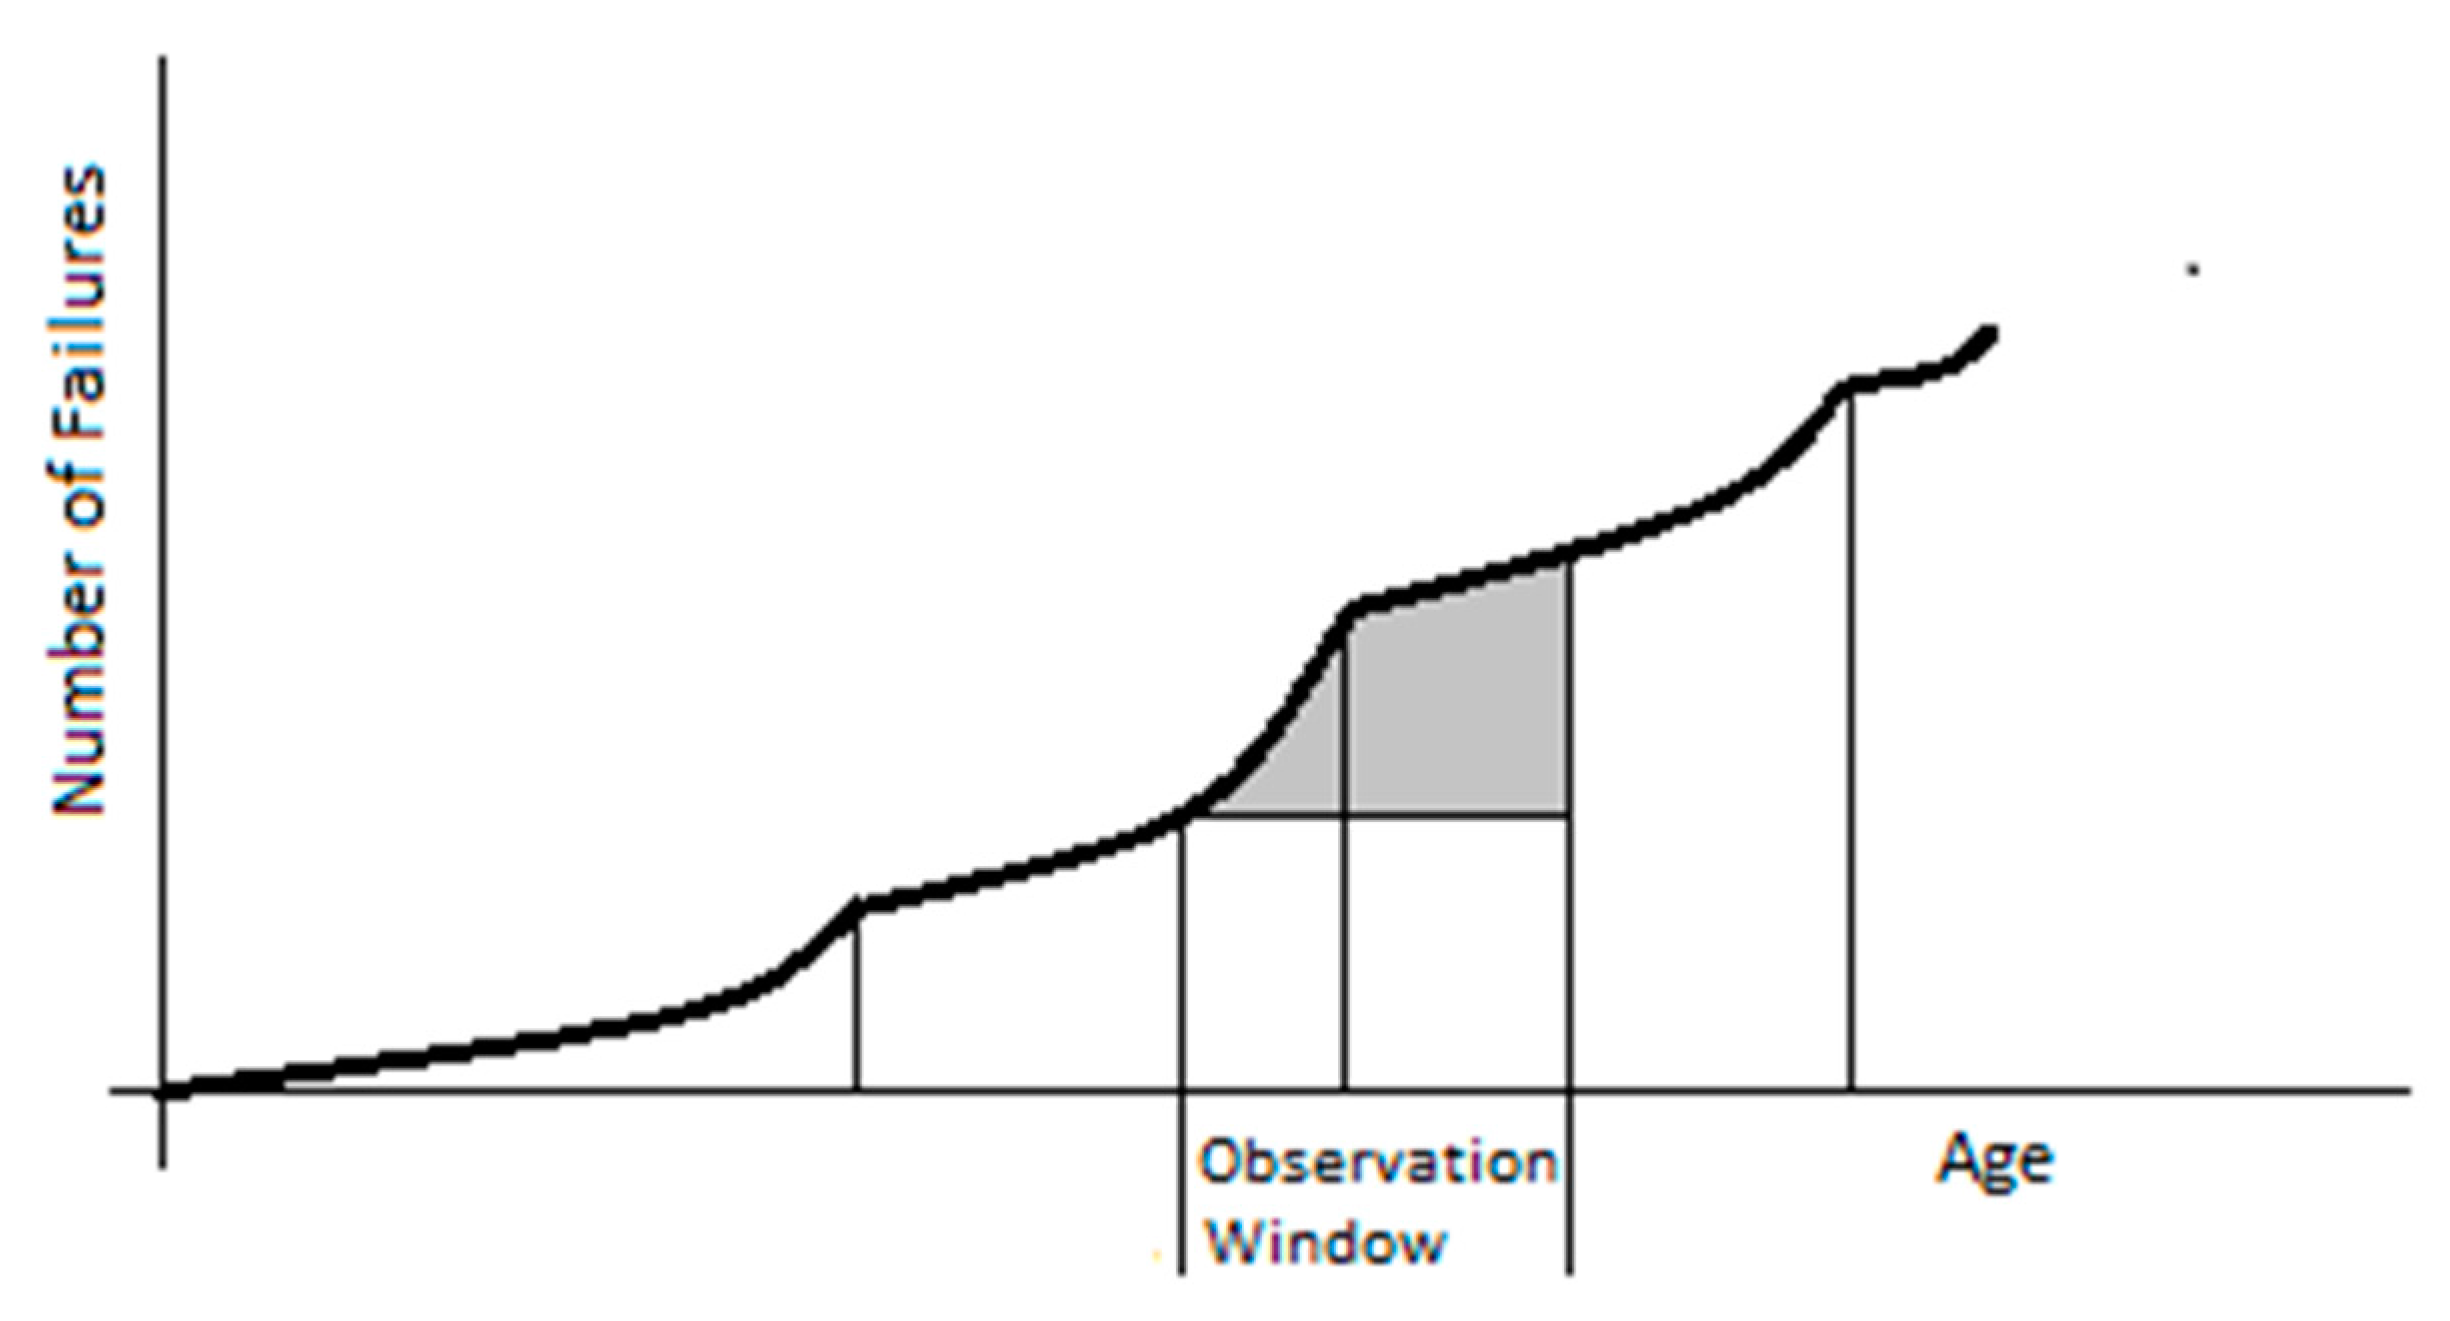
Figure 3.
Failure Rate within Repair Phase.

Figure 4.
Number of UL’s.
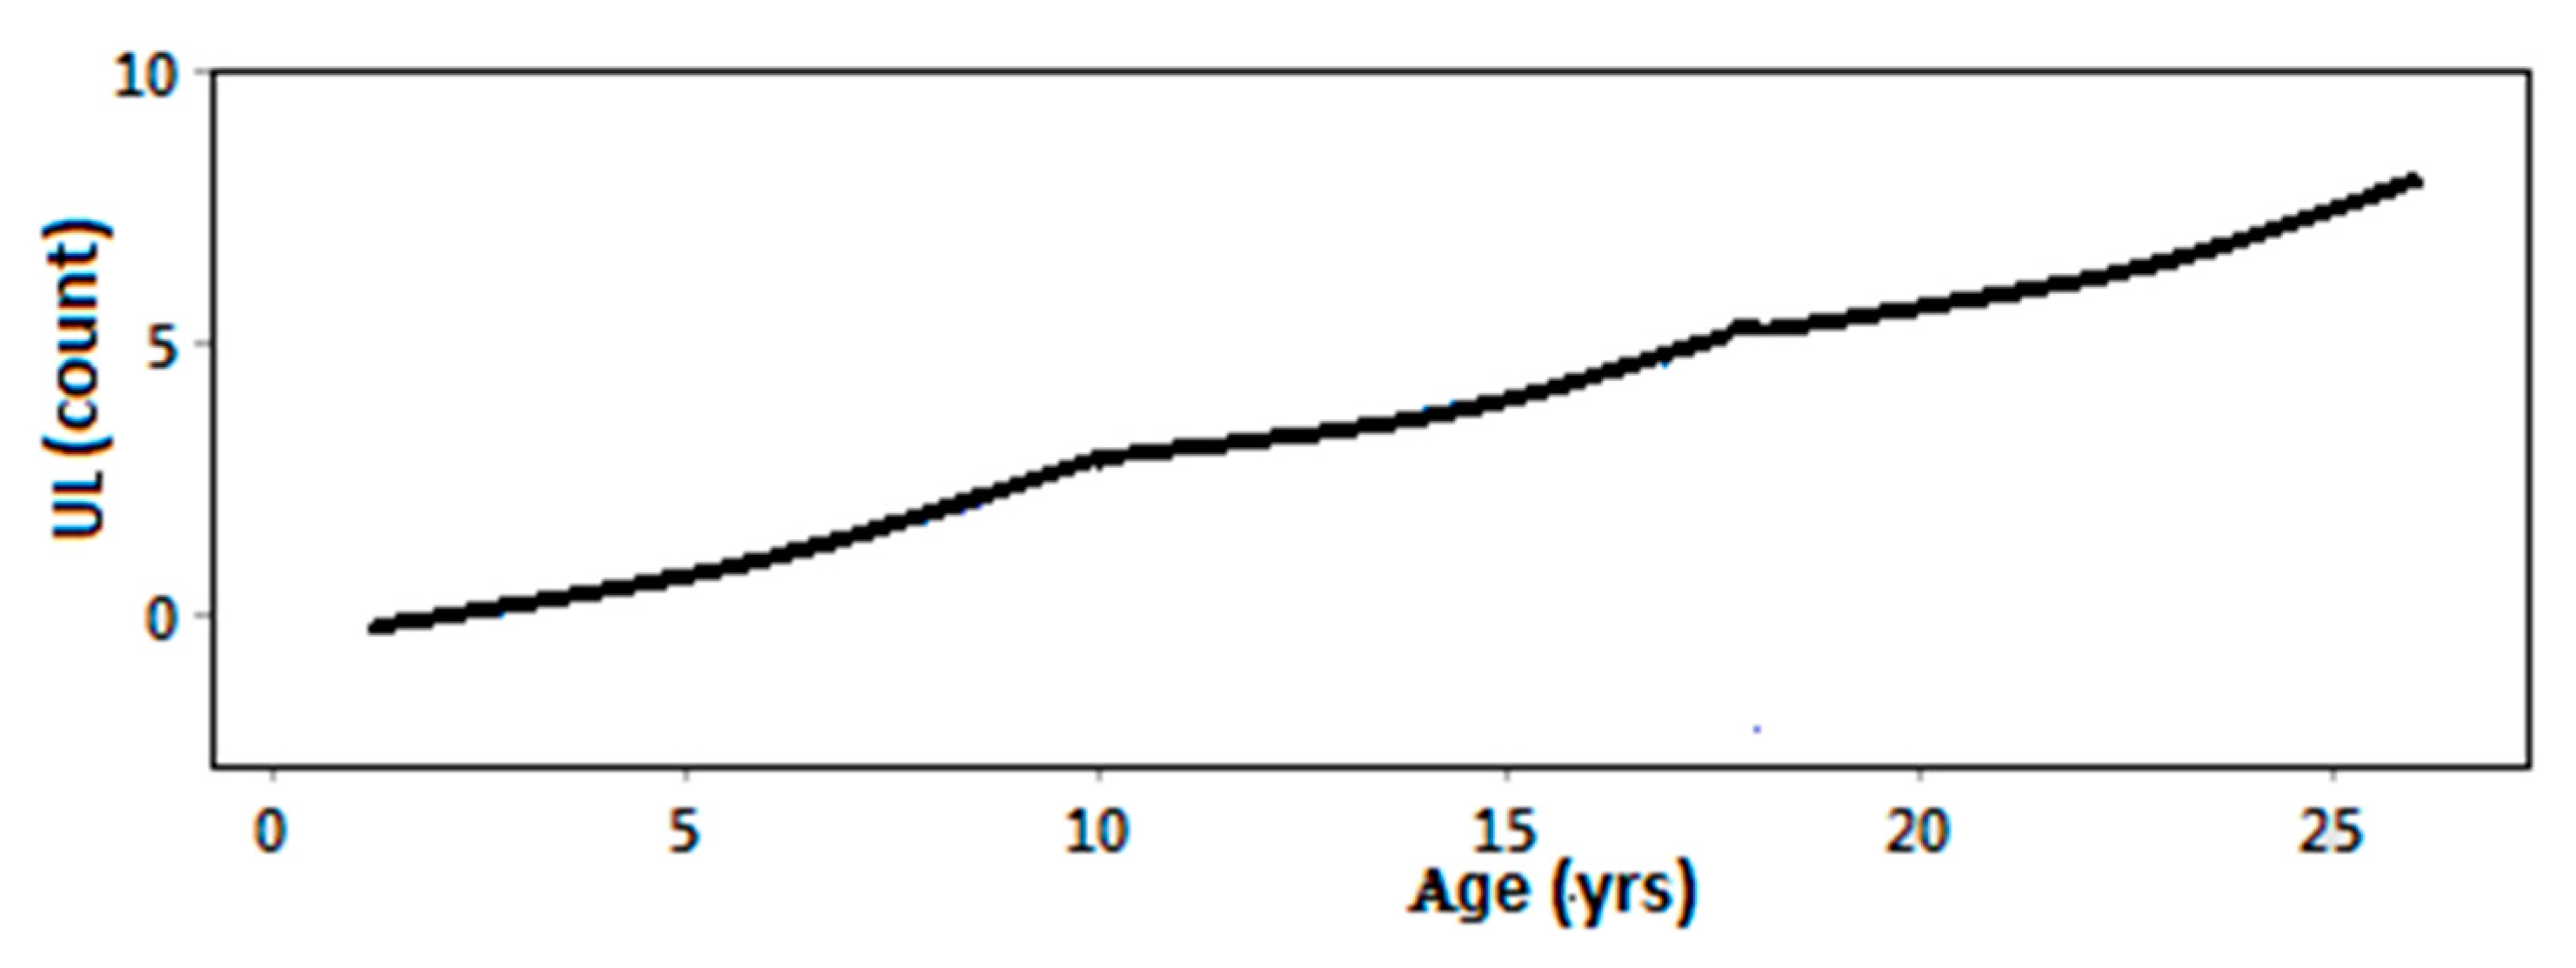
Figure 5.
Boxplots—Pattern in Times Between Failure.

Table 1.
Unscheduled Landings—CADORS 2005.
| Event Name | Frequency |
|---|---|
| Navigation/communication equipment | 30 |
| Declared emergency/priority | 243 |
| Decompression/pressurization | 55 |
| Door/canopy openings indications | 59 |
| Electrical problem | 95 |
| Engine—malfunction | 211 |
| Engine failure | 58 |
| Engine oil problem | 60 |
| Engine shut down | 86 |
| Flight control systems | 44 |
| Flight instrument failure | 22 |
| Fuel | 70 |
| Hydraulic problem | 42 |
| Landing gear | 172 |
| Other operational incident | 117 |
| Precautionary landing | 89 |
| Smoke/fumes—aircraft | 53 |
| Windshield/window (aircraft) | 25 |
Table 2.
Analysis of Variance.
| Source | Sum of Squares | DF | ||
|---|---|---|---|---|
| Regression | 615.79 | 4 | 96.22 | 0.000 |
| Error | 963.00 | 217 | - | - |
Table 3.
Parameter Estimates.
| Variable | Parameter | Estimate | ||
|---|---|---|---|---|
| X1 | b1 | −1.54 | −6.52 | 0.000 |
| X2 | b2 | 6.39 | 5.03 | 0.000 |
| X4 | b4 | 0.12 | 6.02 | 0.000 |
| X5 | b5 | 0.02 | 10.86 | 0.000 |
Table 4.
Statistics on Times between Failures.
| Order of UL | Mean Time between | Standard Deviation of Time | Number of UL’s |
|---|---|---|---|
| 1 | 2186.3 | 653.2 | 19 |
| 2 | 1135.1 | 760.7 | 15 |
| 3 | 582.7 | 485.7 | 12 |
| 4 | 101.0 | 136.2 | 5 |
| 5 | 96.0 | 128.7 | 2 |
Table 5.
Power Law Parameter Estimates.
| Failure | β—Shape | ϕ—Scale | λ—Rate |
|---|---|---|---|
| 1 | 3.65 | 2419.67 | 0.00018 |
| 2 | 1.39 | 1273.36 | 0.00079 |
| 3 | 0.57 | 603.21 | 0.00129 |
| 4 | 0.41 | 40.99 | 0.00884 |
| 5 | 0.35 | 103.28 | 0.00557 |
© 2018 by the authors. Licensee MDPI, Basel, Switzerland. This article is an open access article distributed under the terms and conditions of the Creative Commons Attribution (CC BY) license (http://creativecommons.org/licenses/by/4.0/).
Share and Cite
MDPI and ACS Style
MacLean, L.; Richman, A.; Hudak, M. Failure Rates for Aging Aircraft. Safety 2018, 4, 7. https://doi.org/10.3390/safety4010007
AMA Style
MacLean L, Richman A, Hudak M. Failure Rates for Aging Aircraft. Safety. 2018; 4(1):7. https://doi.org/10.3390/safety4010007
Chicago/Turabian StyleMacLean, Leonard, Alex Richman, and Mark Hudak. 2018. "Failure Rates for Aging Aircraft" Safety 4, no. 1: 7. https://doi.org/10.3390/safety4010007
Note that from the first issue of 2016, this journal uses article numbers instead of page numbers. See further details here.