1. Introduction
Newborn screening (NBS) public health programs are currently used to detect over 50 different conditions that may be present but not immediately evident at birth. Neonatal detection of these conditions allows for early treatment and as a result decreased morbidity and mortality. Severe Combined Immunodeficiency (SCID), a condition with absent cellular and humoral immunity, is associated with nearly 100% mortality if not treated within the first year of life [
1]. Affected infants often appear normal at birth but subsequently develop severe infections due to decreased numbers, or complete absence of naïve T cells. Recurrent respiratory and gut infections and chronic diarrhea lead to failure to thrive. While all forms of SCID manifest with altered cellular immunity, depending upon the genetic cause of the SCID, B cells may also fail to develop or, due to lack of T
h cells, be unable to produce antibodies; natural killer cells may also be deficient. While the genetic basis for SCID is varied, in general, affected genes are involved in T cell receptor development and signaling (e.g., IL2RG, JAK3, CD3D), DNA recombination and repair (e.g., RAG1, RAG2, DCLRE1C), or purine nucleotide metabolism (e.g., ADA, PNP). Hypomorphic mutations in many of the same genes, whereby protein function is not lost entirely, only decreased, leads to “leaky SCID”, or Omenn Syndrome. In addition to immunodeficiency, Omenn Syndrome presents with erythrodema, eosinophilia and lymphadenopathy. Using data from 11 NBS programs in the US, the incidence of SCID has been estimated to be 1 in 58,000 live births. Mutations in the gene for the common γ chain (IL2RG) which is responsible for X-linked SCID, is the common cause of classic SCID, whereas hypomorphic mutations in RAG1 are the most are the most frequent causes of leaky SCID [
2].
As outlined by Wilson and Jungner in 1968, NBS tests should be validated, acceptable to the population, economical, and both sensitive and specific [
3]. Currently, for population-based screening, the T cell receptor excision circle assay (TREC) assay is used to detect SCID or severe forms of T cell lymphopenia. Prior to the TREC assay, an absolute lymphocyte count determined on a CBC with differential was proposed as a screen for SCID, however, this approach would not be sufficiently sensitive. Lymphocyte counts can be normal or near normal in some forms of SCID including SCID complicated by maternal engraftment of T cells, “leaky SCID” or Omenn syndrome, in which autoreactive, autologous T cells expand in the periphery, or in some cases IL-7R deficiency where normal numbers of B cells may be present. Alternative test methods proposed to detect SCID include measurement of circulating IL-7, and immunoassays for CD3 and CD45. To date, these tests have not been fully developed for high throughput, population-based screening for a number of reasons. Sample collection must be convenient and affordable for population-based screening. Currently, NBS tests are performed using a dried blood spot (DBS) on filter paper (NBS cards) so it is highly desirable for any new test to use these cards. Some of the aforementioned assays, however, are not amenable to the use of samples collected via these cards. In addition, some of the tests lack sensitivity and specificity [
4]. The TREC assay, which uses the NBS card, has proved to be 100% sensitive in the detection of SCID with a positive predictive value of roughly 50% for T cell lymphopenia [
5,
6].
2. T–Cell Development and the Production of T-cell Receptor Excision Circles (TRECs)
The TREC assay for NBS of SCID/severe T cell lymphopenia (sTCL) uses real-time quantitative PCR (RT-qPCR) of DNA extracted from the DBS to quantitate a non-replicating episomal excision circle formed during the generation of the αβ T cell receptor in the thymus.
T lymphocytes in the periphery recognize diverse antigens via the T cell receptor (TCR). Similar to immunoglobulins, T cell receptor diversity is generated by germline gene rearrangement during development in the thymus. Two distinct populations of T cells are produced, those bearing the heterodimeric α:β TCRs and those bearing the γ:δ TCRs. The marked diversity of the TCR repertoire occurs by the joining of the different V, D and J segments (V(D)J recombination) within the TCRβ, and TCRδ loci, and V and J regions within the TCRα and TCRγ locus. Only T cells in which the process is successful are able to emigrate to the periphery.
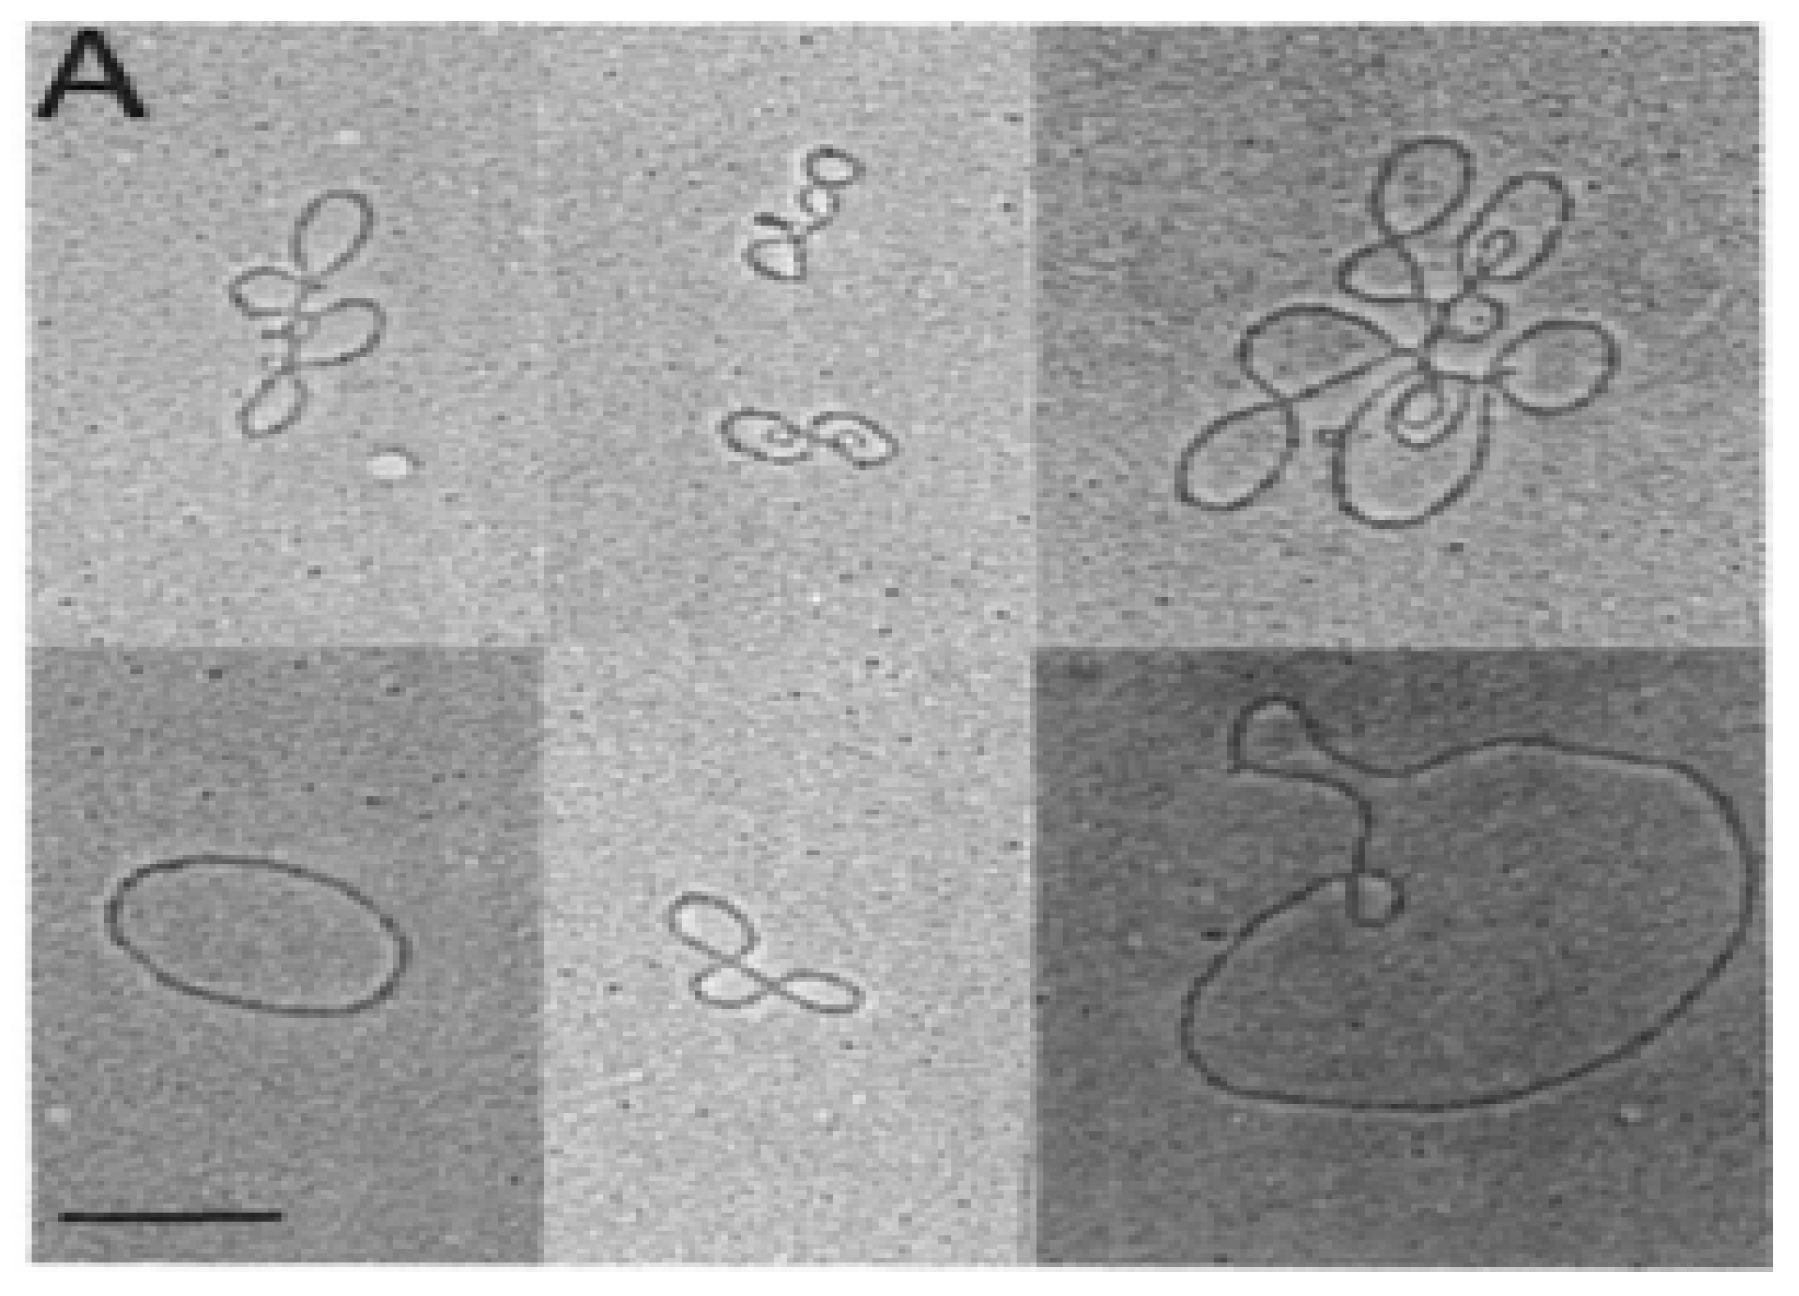
In the early 1980s, electron microscopy detected extrachromosomal circular DNA in developing mouse thymocytes (
Figure 1) [
7]. Subsequent purification and cloning demonstrated these excision circles (TRECs) were the reciprocal product of T cell receptor gene rearrangement at both the TCRα and TCRβ loci in mice [
8,
9,
10]. The process of V(D)J gene rearrangement is tightly controlled in the thymus, and is mediated by recognition of recombination signal sequences (RSSs). The TCRδ sequences lie within the TCRα gene, between
Vα and
Jα. The TCRδ locus is rearranged first, followed by TCRγ and TCRβ rearrangement, both prior to thymocyte expansion [
11]. TCRα gene rearrangement occurs last, deleting the TCRδ locus and results in expression of a functional α:β TCR on the cell surface. Following negative selection, these naïve T-cells undergo very little expansion before moving from the thymus to the periphery.
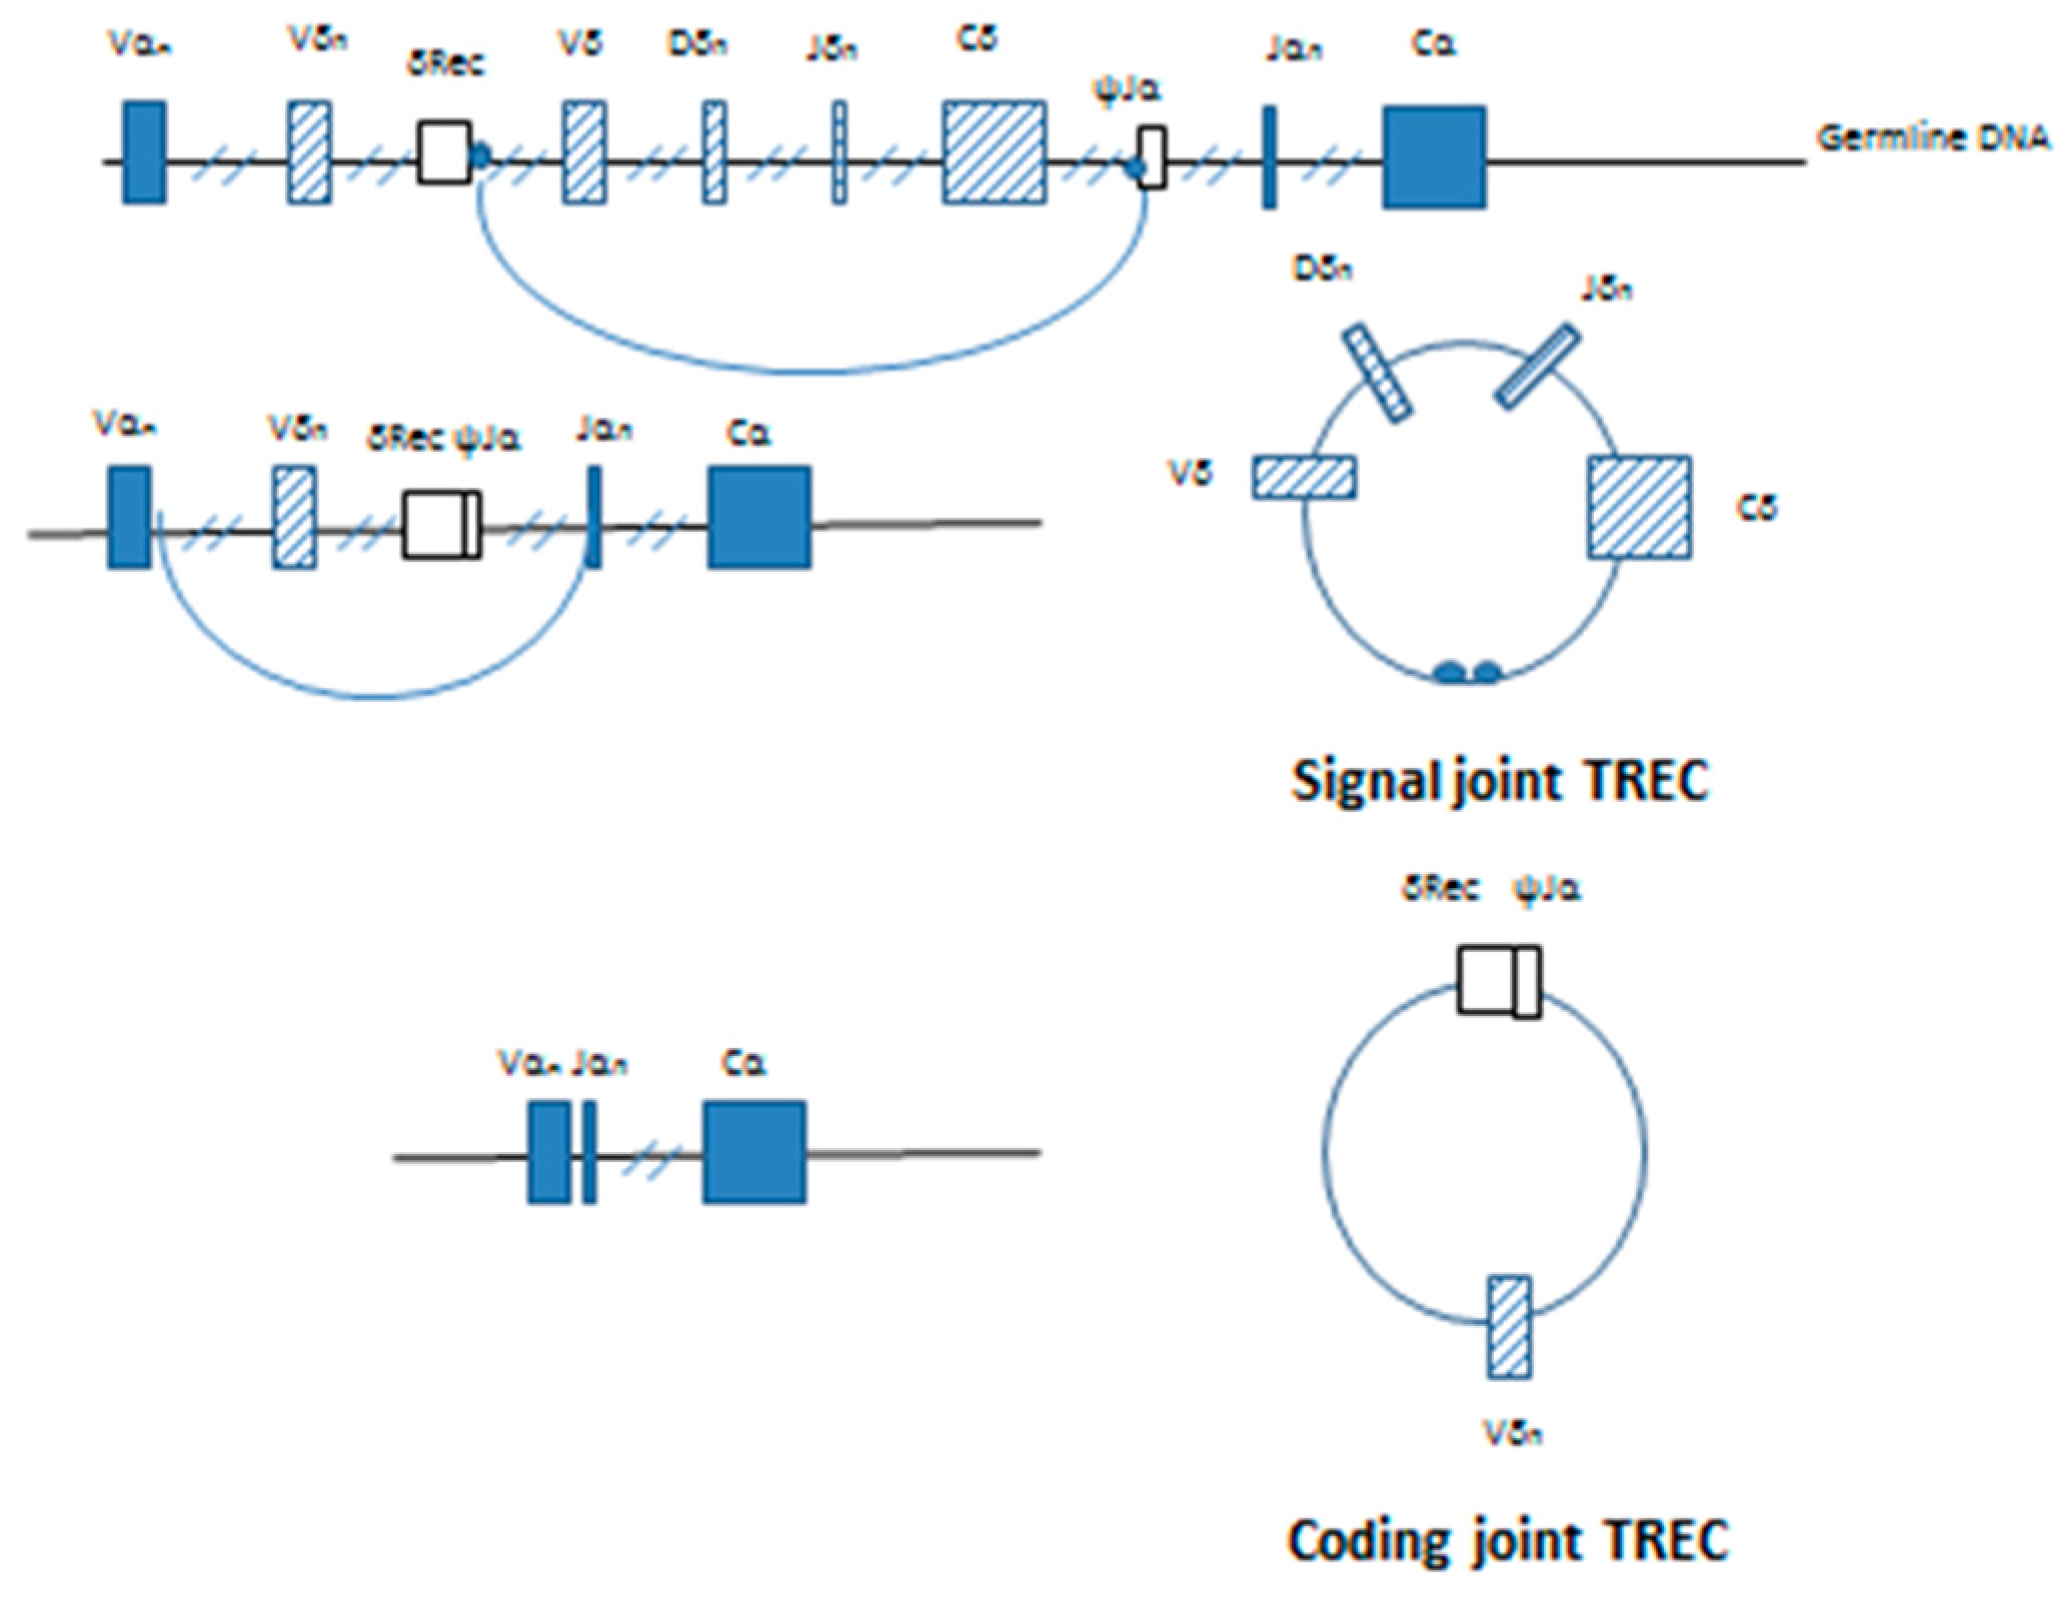
The highly conserved non-coding RSSs are found adjacent to the V, D and J coding segments at the site of recombination. deVillartay et al. (1988) identified the TCRδ deleting elements, δRec and ψJα found within the TCRA locus [
12]. The excision of the δ chain by δRec/ψJα commits the T cell to the α:β TCR lineage. Double stranded cleavage occurs at the exact junction between the RSS and the coding sequence on the germline DNA with excision of the intervening sequence containing most of the δ allele. The resultant coding ends are ligated to producing a δRec/ψJα coding joint on the germline DNA. Ligation of the ends of the excised DNA connects the signal sequences found on each end, forming a signal joint on the reciprocal circular product. This extrachromosomal DNA is the T-cell receptor excision circle (TREC).The first TREC produced is the signal joint or δ TREC (
Figure 2).
Further rearrangement of the TCRA gene to inactivate the δ locus produces a second TREC, and occurs almost immediately [
13]. Removal of the δRec/ψJα coding joint from the germline DNA and subsequent joining
Vα and
Jα segments produces a functional α TCR [
14]. The excised DNA forms the coding joint or δRec/ψJα TREC containing the
Vα-
Jα signal joint (
Figure 2). Quantitative Southern blotting showed that the by-products of the V(D)J recombination were retained both in T cells developing in the thymus and mature T cells found in the periphery. By comparing TRECs found in mice from young adult thymocytes undergoing selection and mature peripheral cells found in the spleen, it was shown that this process is progressive and dilution of the δ containing signal joint TRECs occurs with each subsequent cell division [
13]. The δRec/ψJα is the most common TCRδ deleting rearrangement and represents roughly 70% of the δRec rearrangements leading to a productive human α/β T cell receptor [
13,
15].
This extrachromosomal DNA, however, is not capable of replicating during mitosis and is diluted with each round of cell division [
15,
16]. The TRECS formed as a result of the TCRα rearrangement are found largely in the double positive cells in the thymus and naïve T cells in the periphery, neither population which undergoes significant cell division. TRECs formed as a result of TCRβ rearrangement, however, are only found in very small amounts, as this process occurs early in T cell development prior to double positive expansion [
16]. The relatively low concentration of TRECs contributed from TCRβ rearrangement due to dilution, and the high diversity seen in TCRα rearrangement makes the TCRδ deletion TREC the optimal marker of thymic output.
The correlation made between thymic emigration and quantification of the δRec/ψJα TREC in peripheral T cells was an important step towards the use of TRECs as measurement of the production and emigration of newly formed T cells from the thymus (recent thymic emigrants, RTEs). Chickens transiently express the T-cell surface antigen ChT1 on 90% of thymocytes and RTEs in the periphery [
17]. Using this marker, it was shown that TRECs are stable in the peripheral T cell pool. Moreover, as there was no extra-thymic source of TRECs, the numbers of TREC containing cells in the periphery corresponded roughly to the frequency of RTEs [
18]. Similar results in humans were described using CD31 as a marker to distinguish RTEs from peripherally expanded T cells. CD31 and CD45RA are coexpressed on newly formed, TREC containing naïve T cells. During aging, as thymic output decreases, the naïve T peripheral pool expands, however the newly formed cells neither express CD31 nor contain TRECs [
19].
In summary, the quantification of δRec/ψJα TRECs by RT-PCR in the periphery serves as a biomarker of thymic output, specifically measuring productively rearranged α/β T cells. TRECs are diluted out exponentially with cellular division. Therefore, the measurement of TRECs distinguishes between homeostatic expansion of T cells in the periphery compared to the production of newly formed, naïve T cells.
3. The Use of the TREC Assay in Human Immunology Including NBS for SCID
Studies by Douek et al. using the quantification of δRec/ψJα TRECs by RT-PCR (TREC assay) as a means to measure changes in thymic function in humans as a result of age or disease represented a fundamental advancement in the use of the TREC assay in human immunology [
15]. By purifying T cell populations by fluorescence activated cell sorting (FACS), TRECs were shown to be unique to the naïve T cell subset, and were diluted out during the proliferation that occurs in the switch from naïve to memory phenotype. While TRECs were highest in infants, 1 per 10 cells, they were also present in elderly patient T cells, indicating that productive TCR rearrangements continues to occur in the thymus but declines exponentially with age. TRECs were also significantly lower following thymectomy, and undetectable in patients with complete DiGeorge syndrome. Douek and his colleagues also quantified TRECs following HIV infection, the decline perhaps reflecting inhibition of the thymic function and thymocyte precursor development, or death of naïve CD4+ thymocytes. Importantly, TREC levels increased following highly active antiretroviral therapy (HAART) in patients with severe CD4 lymphopenia due to HIV-1 infection, indicating that the normalization of the number of CD4 T cells in the periphery was due, at least in part, to an increased number of newly formed CD4 T cells (RTEs) and not homeostatic expansion. Not surprisingly, increased number of TRECs were also found following HSCT for the treatment of SCID [
20]. The studies by Doueck et al. illustrated the utility of the TREC assay to answer fundamental questions regarding thymic function in health and disease.
In 2005, Chan and Puck demonstrated that the TREC assay might be useful for the diagnosis of SCID regardless of the genetic cause [
21]. In their study, the TREC assay was performed using DNA isolated from a small punch from the DBS on a NBS card. Because the quality of DNA obtained from such a punch may vary widely, amplification of β-actin was used an internal control. Samples tested included DBS created from blood collected from SCID infants, healthy adults and umbilical cord blood, as well as blood depleted of naïve T cells to simulate SCID cards. The resultant TREC counts confirmed earlier studies indicating a 4.5 times greater number of TRECs in cord blood, as compared to adult blood. Twenty three DBS from previously diagnosed SCID patients all showed <30 TRECs per two 3 mm punches, regardless of the molecular basis for their SCID diagnosis. Normal TREC levels were found in a patient with NEMO deficiency and a patient with undefined lymphopenia. In addition to simulated DBS, testing was also performed on 239 outdated NBS cards collected for NBS in Maryland, 99 of which came from special care nurseries. The assay successfully detected SCID on two of these cards collected from previously diagnosed infants.
While promising, the results of the Chan study were not adequately specific to recommend this assay for wide scale screening. For example, out of the 239 dated cards tested, 7 patients had no TRECs but normal actin was also detected, which the authors attributed to false-positive results. The high false positive rate, due to failure to amplify TRECs in 1.4% of the DBS contributed from standard care nurseries, and 5% of the samples from special care nurseries, was well above the 0.1% needed for the test to be considered for the newborn screening panel. To increase the specificity of SCID newborn screening without decreasing sensitivity, a two-tiered testing strategy was proposed [
22]. Samples testing positive for SCID via the TREC assay would be confirmed by a second test measuring DBS serum or plasma interleukin-7 (IL-7) levels which can be elevated in SCID. The results of study testing this algorithm showed the IL-7 test alone had a specificity of 96.1%. It was suggested that combining the IL-7 assay with the TREC assay (specificity of 92.3% in this study using the Chan protocol) would result in an almost 100% specificity for SCID [
22]. Due to issues with the stability of protein collected from DBS for the IL-7 testing, however, the assay has not yet been optimized for large-scale screening.
4. Improvements in the TREC Assay Lead to NBS for SCID
In the United States, the Department of Health and Human Services (HHS) publishes specific medical conditions recommended for every state NBS program, the Recommended Uniform Screening Panel (RUSP). The Scientific Advisory Committee for Heritable Disorders in Newborns and Children (SACHDNC) is a committee comprised of experts in the field and makes recommendations for disorders to be added to the RUSP, which must be approved by the Secretary of HHS.
In September 2007, SCID, which was to shown to be detected by the TREC assay, was nominated to SACHDNC for addition to the RUSP. While the SACHDNC encouraged NBS for SCID to be added to the RUSP, the TREC assay was not recommended until a population-based field study was performed that demonstrated the cost effectiveness, sensitivity and specificity of the TREC assay.
Against the backdrop of these significant advances, in the fall of 2006 investigators from the Medical College of Wisconsin (MCW; Routes, J, Verbsky, J, Grossman, W) went before the Umbrella Committee of the State of Wisconsin, which is the governmental subcommittee that recommends specific disorders for NBS to the State of Wisconsin, to nominate NBS for SCID. The Umbrella Committee unanimously approved a pilot study for the use of the TREC assay forthis purpose, but only with demonstrable improvements in the sensitivity and specific of the TREC assay and sufficient funding to support the pilot study. In January 2007, through the efforts of the MCW group, the Jeffrey Modell Foundation and Children’s Hospital of Wisconsin each donated $250,000 to optimize the TREC assay and fund a 3 year pilot study on the use of the TREC assay to screen for SCID.
Soon thereafter, the MCW group in collaboration with the Wisconsin State Hygiene Laboratory optimized the TREC assay for NBS for SCID [
23]. Changes in DNA extraction and improvements in the efficiency of the RT-qPCR amplification efficiency lowered the false positive rate to roughly 0.02%, as only one of the 5766 NBS cards tested failed to amplify TRECs and β-actin. The assay was also shown to be linear as the number of TRECs was found to be directly proportional to the naive T cell: memory T cell ratio. More importantly, for the purposes of large scale SCID screening, the variability was low over 76 consecutive runs.
The optimized TREC assay was used by Routes et al. in Wisconsin for the first statewide pilot study in 2008. An algorithm using 25 TRECs/μL as a cutoff was established to screen 71,000 infants for SCID between 1 January and 31 December 2008 [
24]. Infants with TRECs below the cutoff value were retested using the same DBS with co-amplification of β-actin as a control. A second result again indicating TREC levels below the cutoff but successful β-actin amplification warranted further evaluation by flow-cytometry. Inconclusive results also required retesting until a conclusive report could be issued. In this study the rate of repeat testing was 0.168%. A total of 17 infants had an abnormal TREC assay. T cell lymphopenia was identified by flow cytometry in 8 infants and included DiGeorge syndrome, extravascular extravasation of lymphocytes, idiopathic T-cell lymphopenia and a combined immunodeficiency due to a Rac2 mutation [
24]. These data demonstrated that the TREC assay was highly sensitive and specific for the detection of severe T cell lymphopenia.
In January 2010, the Wisconsin group presented their results on statewide NBS for SCID to the SACHDNC. Based on these results, the SACHDNC voted unanimously to recommend the addition of SCID to RUSP, and on 21 May 2010, Secretary Kathleen Sebelius accepted this recommendation. By May of the following year, 6 states and one territory had implemented screening for SCID using the TREC assay [
25].
Following the pilot program in Wisconsin, the TREC assay was subsequently shown to successfully detect various forms of SCID, regardless of the molecular cause [
26]. Perhaps more importantly, the same study showed the presence of maternal T cells, or T cell from either leaky SCID or hypomorphic mutations did not affect the outcome of the assay. For subjects in whom peripheral T cells were found but TRECS were undetectable, fluorescent in-situ hybridization (FISH) analysis showed the cells were contributed from the mother. Because the δRec/ψJα TREC is found primarily in naïve T-cells and not memory cells, maternally engrafted cells will not contribute to the TREC count in infant samples, nor will residual memory cells found in Omenn Syndrome, RAG1 deficiency, or ADA deficiency for the same reason [
26]. Other conditions with absent or low TRECs that would be detected by this assay include syndromic conditions affecting T cell development (e.g., CHARGE syndrome, Jacobsen syndrome, RAC2 defect, Ataxia telangelactasia, Trisomy 21 and 18), secondary T cell lymphopenias (e.g., Chylothorax, gastrointestinal atresia, hypoplastic left heart syndrome, neonatal leukemia, congenital anomalies) and prematurity [
2].
5. Modifications of the TREC Assay
The TREC assay has been modified as subsequent states have adopted SCID screening. The Wisconsin protocol, a single-plex assay, amplified TRECs from the DBS and the internal control, β-actin, in separate reactions, and only if the TREC value fell below the cutoff on initial testing [
6,
27]. Prior to implementation in Massachusetts, the second state to undertake SCID screening, a multiplex assay was developed in which the internal control, the RNAse P RNA component H1 gene
RPPH1, was amplified and measured from the same punch as the initial TREC sample [
28]. Efficiencies of amplification approached 100%, and similar to the single-plex assay, the multiplex assay detected TRECs at low copy number, even in cases of maternal engraftment. While the concomitant amplification of the internal control in a multiplex assay streamlines the testing process, cost becomes a consideration as additional probes and primers are required. During the first three years of testing in Wisconsin, 98.4% of the initial assays did not require repeat testing [
27]. Long term, a single-plex assay may be more cost effective. In addition to β-actin and RNAse P, other internal controls have included the albumin gene, or the TCR-α constant region [
29,
30].
The protocol for TREC amplification and detection has undergone other adaptations subject to the lab performing the assay. Each lab carrying out testing must determine its own cutoff value for the number of TRECs indicative of a positive result. The early assay performed by Douek to illustrate changes in thymic output with age and HIV infection employed quantitative competitive PCR with an internal standard to calculate number of TRECs/μg DNA in sorted cell populations [
15]. As changes in thymic output are irrelevant for the purpose of SCID detection, the assay modified for NBS generally utilizes RT-qPCR to report the absolute number of TRECs per ul blood extracted from the DBS; each 2.8 mm punch is estimated to contain 3 μL blood. Currently, assessment of naïve T-cell (CD3), CD4+ or CD8+ counts by FACS analysis is the gold standard to confirm T cell lymphopenia. Attempts have been made to circumvent the need for flow cytometry, which is expensive and requires a liquid blood sample, by utilizing a qPCR mono-assay in which the TREC: T-cell ratio was measured by amplifying both the albumin gene (ALB) and the un-rearranged TCR-β region in isolated PBMCs. ALB, a housekeeping gene, acts as an indicator of both DNA integrity and total PBMC count, while the TCR-β serves as a marker of total germline cell number [
31]. Subtraction of the two counts provides a measure of the peripheral T cell fraction. If however, only one TCR-β allele is rearranged, the TREC: T-cell ratio may be overestimated [
31,
32]. In addition, the utility of this approach for NBS is less certain and to date, this method has not been implemented. Flow cytometry is reserved for infants whose initial TREC screening is low based on the cutoff values established by the state. Results of NBS programs for SCID have shown that an extremely low percentage of TREC assays are abnormal, therefore, the institution of flow cytometry to confirm T cell lymphopenia has not proved to be overly expensive.
6. Limitations and Shortcomings of the TREC Assay
The TREC copy number has been repeatedly validated as a marker of thymic naïve T-cell production, but the assay is not without its limitations. Aside from technical issues of quantitation or calibration, a number of combined immune deficiencies which manifest after TCR rearrangement will not be detected. ZAP70 and MHC class II deficiencies, rare combined immunodeficiencies, present with normal numbers of non-functional naïve T cells and therefore would be missed by the TREC assay. Conditions resulting from null mutations in classic SCID causing genes will be identified; however certain hypomorphic conditions could be missed. ADA deficiency can be delayed in its presentation due to residual enzyme activity at birth. Measurement of TREC numbers in premature infants less than 37 weeks gestational age have also been problematic with false positive rates reported from roughly 1.5% to 5% [
21,
24]. While standardized values for premature infants have not been established, possible explanations for the low TREC counts could include issues with sample collection and contaminants that affect the downstream assay. Medications, especially immunosuppressive corticosteroids, commonly given for lung maturation in these infants may also cause low T-cell counts. Absent an extrinsic cause, low TRECs could also be the result of developmental immaturity.
Despite these shortcomings, the TREC assay has been shown to be inexpensive (~$5.00/assay) as well as sensitive and specific in detecting multiple forms of T-cell lymphopenia and SCID. The ability to detect infants with SCID before the acquisition of SCID defining illnesses is critical to reduce morbidity and mortality in these infants. The cumulative survival rate for infants identified early by NBS is approximately 87% [
2], compared to 54% for late identified infants [
33]. Early identification allows for treatment prior to the onset of often fatal infections and improves outcomes. HSCT prior to age 3.5 months results in survival rates of 94%, compared to 66–68% when transplanted after 3.5 months [
33].
7. Conclusions
The TREC assay, initially developed by Douek et al. to measure changes in thymic output following HIV infection and treatment, has been optimized for use in NBS for T cell lymphopenias and SCID, being both sensitive and specific. Optimization of the assay and development of screening algorithms have made NBS for SCID life-saving, while cost-benefit analysis has repeatedly illustrated the economic advantage of early diagnosis [
1,
33,
34,
35,
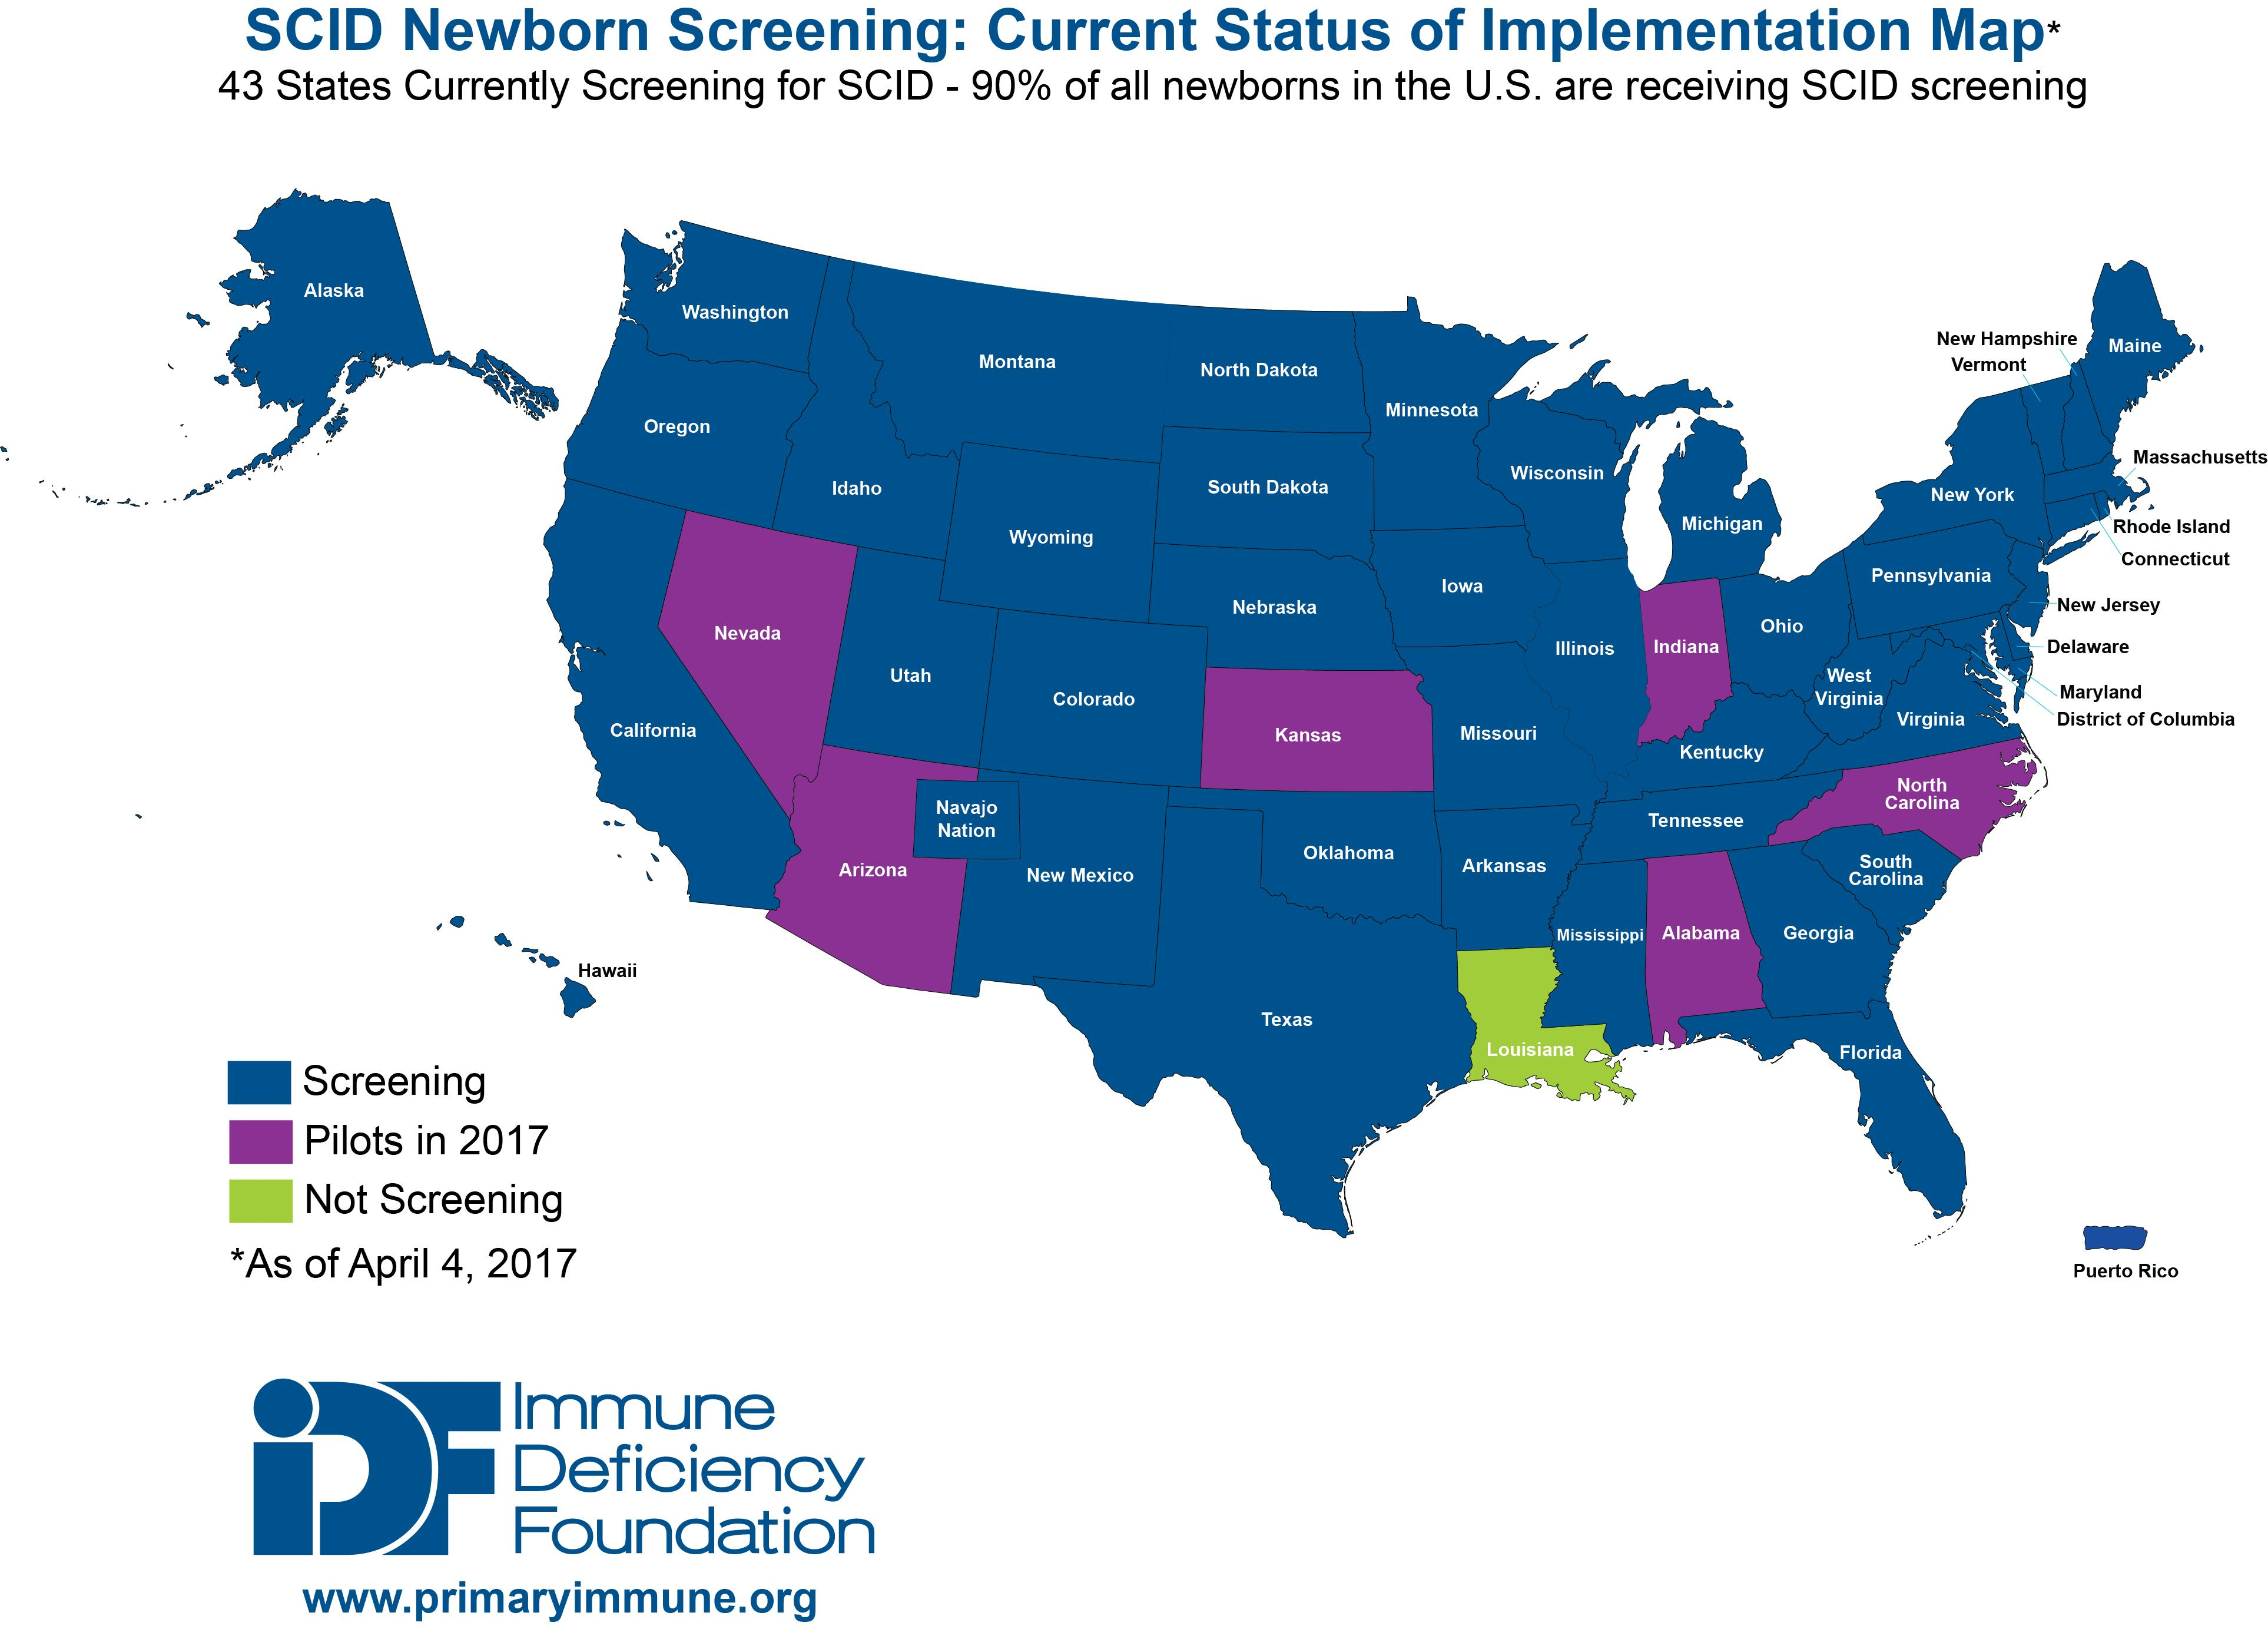
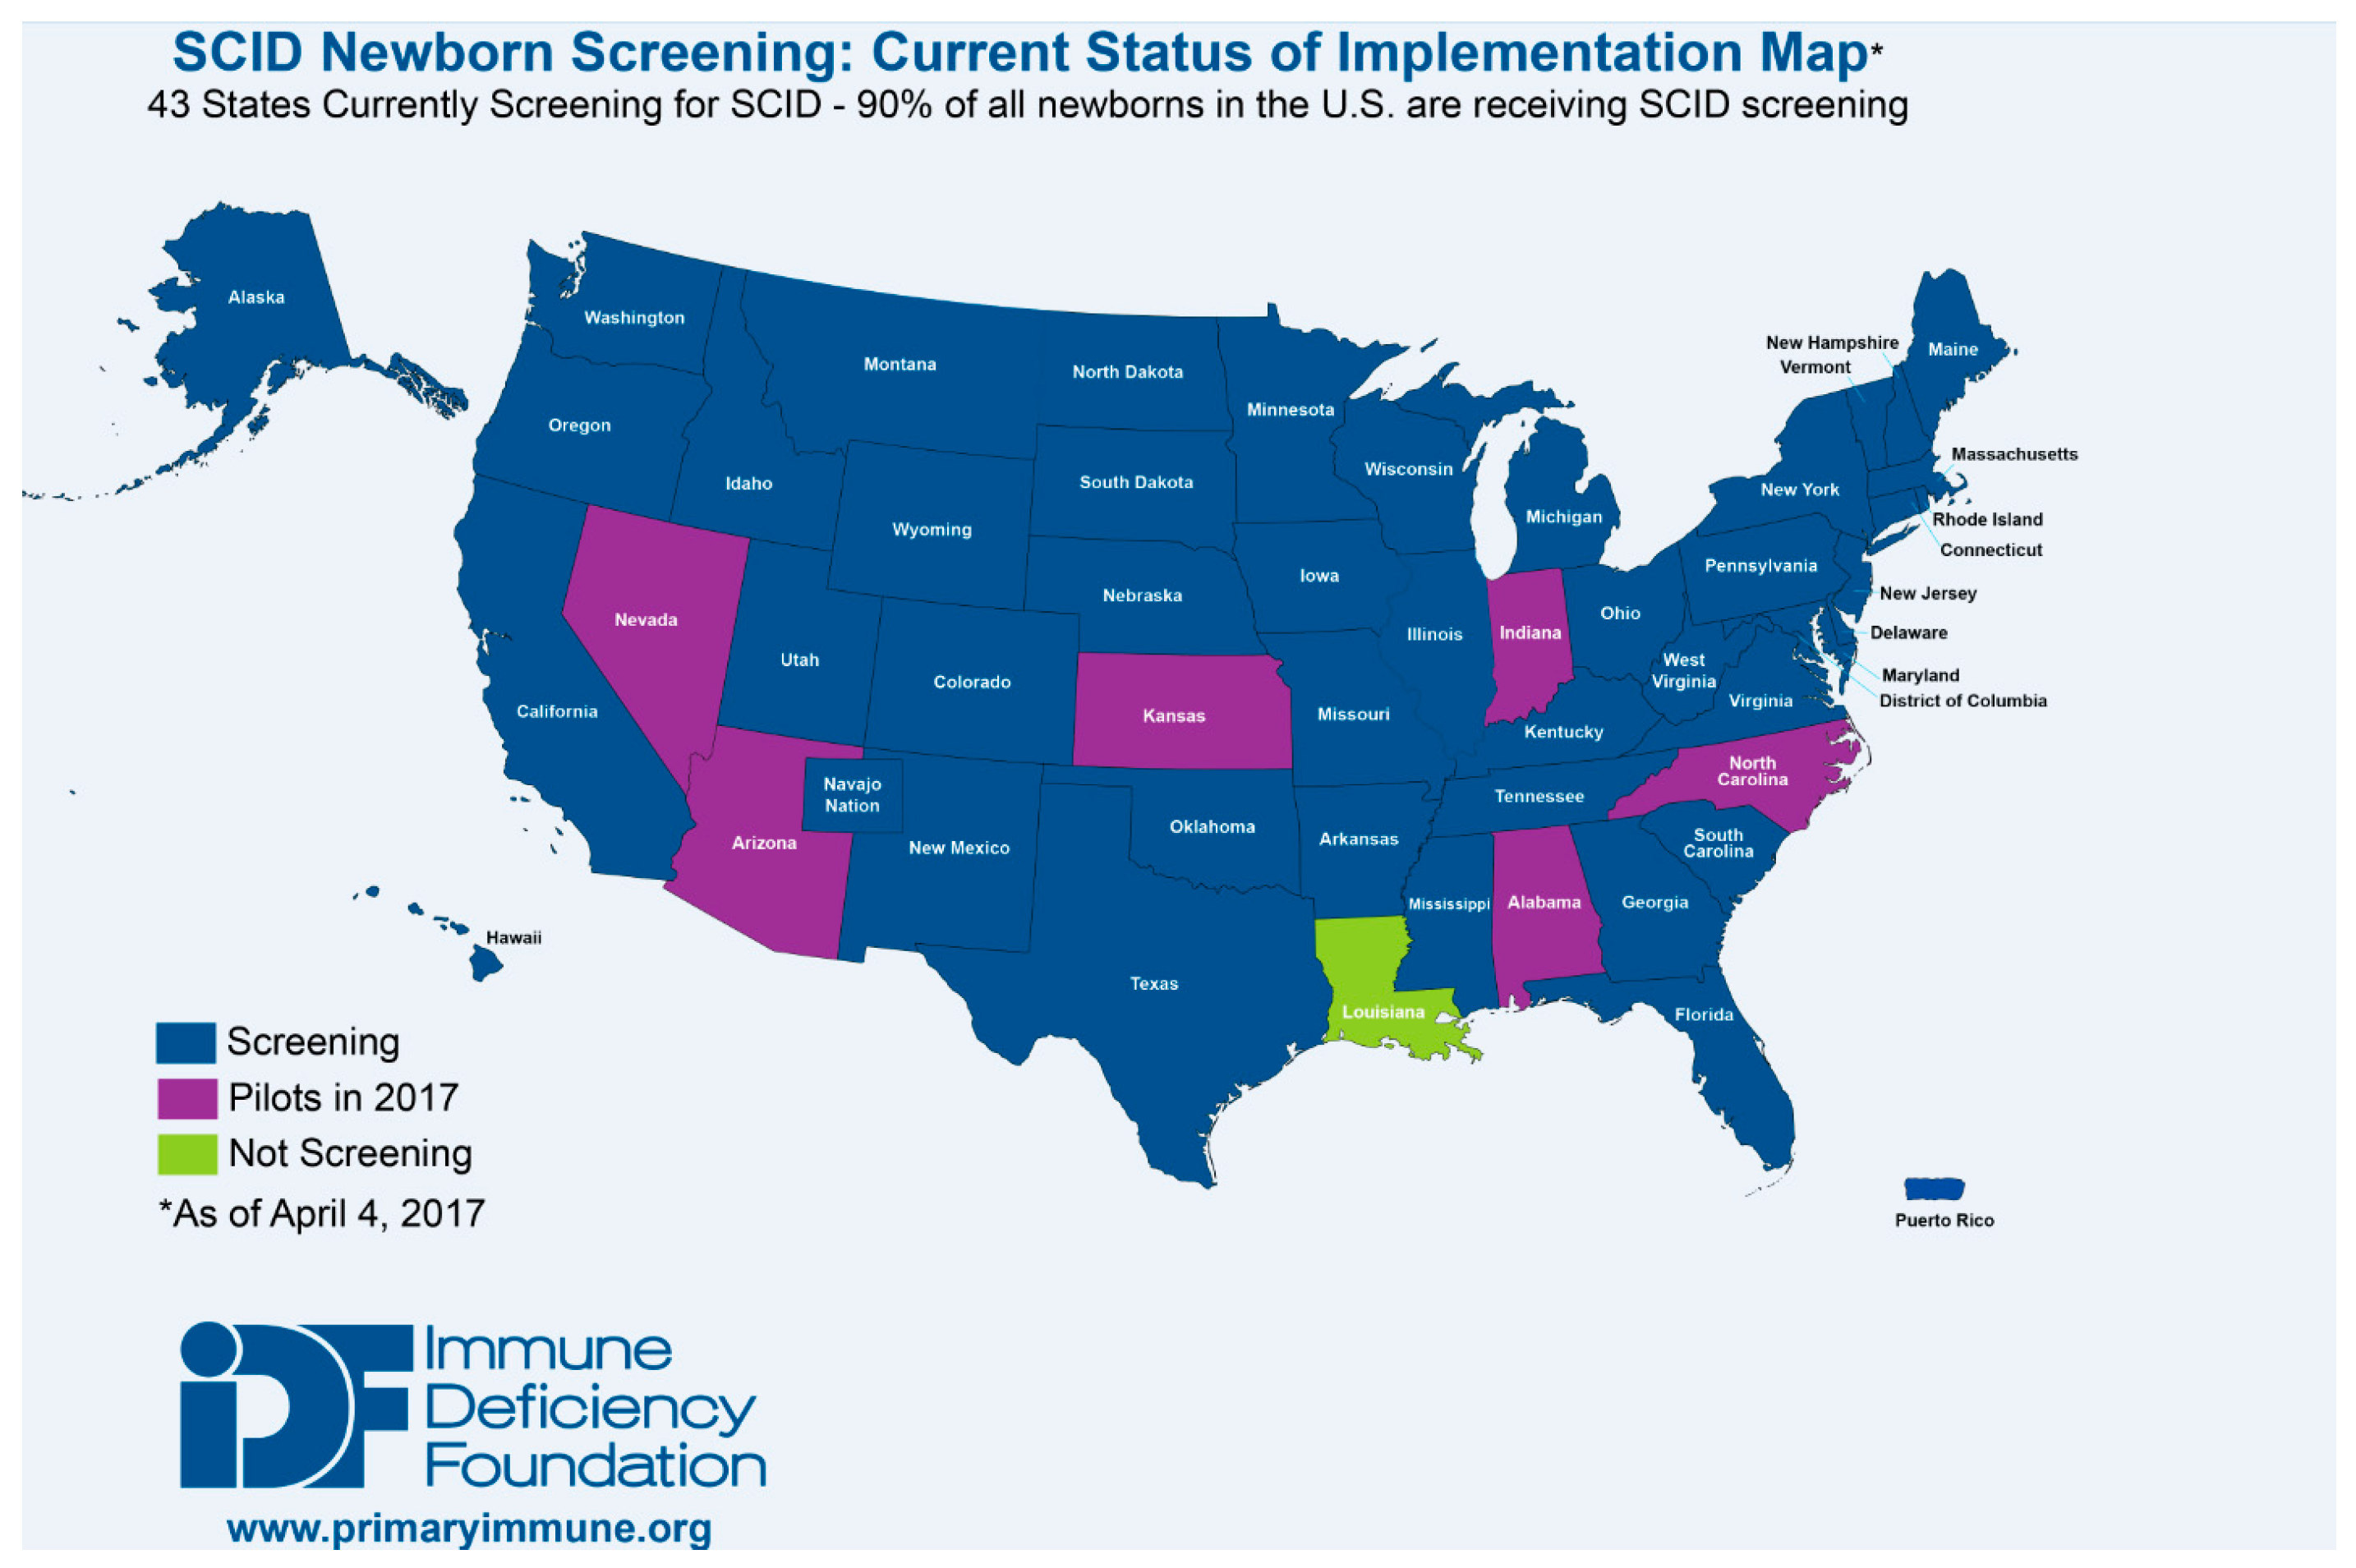
36]. As a result, as of January 2017, the TREC assay is being used to screen for T cell lymphopenias and SCID in all but one state in the US, the District of Columbia, and Puerto Rico (
Figure 3). Testing is also being performed outside of the US in Canada, Israel, Qatar, Taiwan, the Netherlands, Sweden, and is scheduled to begin in New Zealand in 2017. Pilot programs have also been established throughout Europe (Norway, Germany, France, Italy and Spain), the Middle East (Iran, Saudi Arabia), Brazil and Japan [
37,
38].


