
Monitoring Red Sea Bream Scale Fluorescence as a Freshness Indicator
by
 ,
,
Qiuhong Liao
1,*, 
Tetsuhito Suzuki
1,
Kohno Yasushi
2,
Dimas Firmanda Al Riza
1,3,
Makoto Kuramoto
4 and
Naoshi Kondo
1 1
Graduate School of Agriculture, Kyoto University, Kitashirakawa-Oiwakecho, Sakyo-Ku, Kyoto 606-8502, Japan
2
Department of Planning and Environment, Ehime Research Institute of Agriculture, Forestry and Fisheries, Matsuyama, Ehime 799-2405, Japan
3
Agricultural Engineering Department, Faculty of Agricultural Technology, University of Brawijaya, Malang 65145, Indonesia
4
Advanced Research Support Centre, Ehime University, 2-5 Bunkyo-cho, Matsuyama, Ehime 790-8577, Japan
*
Author to whom correspondence should be addressed.
Fishes 2017, 2(3), 10; https://doi.org/10.3390/fishes2030010
Submission received: 26 May 2017
/
Revised: 28 June 2017
/
Accepted: 3 July 2017
/
Published: 10 July 2017
Abstract
:Red sea bream (Pagrus major) scale fluorescence characteristics were identified as a potential rapid and non-destructive means for assessing the fish’s freshness. To investigate this, live red sea breams were purchased, slaughtered, and prior to measurement, stored at 22 ± 2 °C for 27 h. During subsequent storage, the K value of the dorsal meat—as a standard freshness indicator—along with front-face fluorescence spectra of representative dorsal scales, were measured simultaneously at 3 h intervals. Two major fluorescent peaks, A and B, were identified with excitation and emission wavelength pairs of 280/310 nm and 340/420 nm, which were mainly contributed to by tyrosine and collagen, respectively. Subsequent analysis showed that the fluorescence intensity ratio of peak B to A (IB/IA) increased linearly during storage (R2 = 0.95) and is proposed as a potential non-destructive index of fish freshness. Thus, our results suggest that the fluorescence characteristics of fish scales can be used to assess fish carcass freshness during storage.
1. Introduction
Red sea bream is an important commercial marine culture fish species in Japan due to its palatability and being highly valued by Japanese consumers. According to the Ministry of Agriculture, Forestry and Fisheries in Japan, over the last decade, around 90,000 tons/year have been cultured or captured. With ever increasing demands for the delivery of high quality red sea bream, mariculture industry, retailers, consumers, and regulatory officials desire an improved, and preferably non-destructive, method for rapidly determining the quality and freshness of this high-end product.
Freshness is a major determinant in most fish or fishery products, since it is the most relevant attribute that consumers use to evaluate taste and safety [1]. Various traditional methods, such as sensory [2], microbiological [3], and biochemical [4] methods have been investigated to evaluate the freshness of various commercial fish species. Of these, the most used method on a wide variety of fish species is the K value, a freshness index based on the adenosine triphosphate (ATP) degradation product ratio, due to its direct relationship to biochemical changes. The ATP degradation process is usually described as follows: ATP → adenosine diphosphate (ADP) → adenosine monophosphate (AMP) → inosine monophosphate (IMP) → inosine (HxR) → hypoxanthine (Hx). The K value is calculated as the percentage rate of (HxR + Hx) to the sum of ATP and degradation products (ATP + ADP + AMP +IMP + HxR + Hx), and is widely used as a standard fish freshness indicator [5].
Recently, a wide range of new instrumental approaches, such as spectrophotometers [6], image analyzers [7], colorimeters [8] or electronic tongue [9], have been proposed as an alternative to the traditional complex chemical analyses. However, many of these traditional and new techniques still have drawbacks in terms of being time consuming, costly, requiring laboratory facilities, or are difficult to interpret. Given the potential rapid losses in fish freshness after capture and death, a simple, rapid and convenient means of freshness assessment is sought.
In the last several decades, fluorescence spectroscopy has received particular attention due to its nondestructive nature, short sampling time, high sensitivity, and selectivity [10]. Fluorescence spectroscopy provides important information on the presence of fluorophores which change in response to the physical–chemical environment and provide a window into the freshness state of the sample. These fluorophores can be directly monitored and changes in fluorescence intensity of a given fluorophore can be directly correlated with fluorophore concentration [11]. Previous studies carried out by our research group have shown that fluorescence properties of fish eye fluid are closely related to freshness changes. Therefore, fluorescence spectroscopy offers the potential for fast and convenient assessment of fish freshness. Among fluorescence spectroscopy techniques, front-face fluorescence spectroscopy reduces the optical path for illumination, ensuring only the surface of the material is sampled, providing a potentially rapid, non-destructive and quantitative investigation of fluorophores of turbid or solid intact samples [12,13]. Scales attached to the surface of the fish body contain significant fluorescent organic substances and their changes during storage could be tracked using their fluorescence signals [14], making the scales a potential indicator of freshness decline. In the near future, these fluorescence data from scales with specific excitation and emission wavelength bands will be expected to be assessed with a device such as a multiplex sensor [15] or fluorescence imaging [16], making a simpler, faster and convenient method for intact fish freshness assessment based on the fish surface fluorescence.
Therefore, the aim of this study is to identify and demonstrate the relationship between major fluorescence signal changes in red sea bream scales and freshness during storage using front-face fluorescence spectroscopy.
2. Materials and Methods
2.1. Red Sea Bream
Red sea breams (Figure 1) were purchased from Taisei Suisan, Ltd. (Ehime prefecture, Japan), from 17 August 2016 to 11 January 2017 with an average fork length of 42.6 ± 1.6 cm, weight of 1072 ± 106 g and age of 19–24 months. At the commencement of the storage experiment, fish were killed by puncturing the brains and spinal cord, cleaned, wrapped in a plastic bag to maintain humidity, and then stored at 22 ± 2 °C for 27 h. During this storage, samples (meat and scales) were collected every 3 h from the beginning of storage. Meat from the dorsal part of the fish was used for K value measurement (a standard freshness evaluation parameter). So-called “key scale” (short diameter: 0.71 ± 0.064 cm, long diameter: 0.92 ± 0.057 cm, thickness: 0.17 ± 0.055 mm) between the dorsal fin and the lateral line, which are representative of the features of the fish scales [17], were collected for fluorescence spectra measurement. K value measurement of meat was performed on 3 replicates and fluorescence spectra measurement of scales was performed on 9 replicates at each sampling time. In addition, scales collected at the beginning of storage were used for a water loss experiment (3 replicates) and scanning electron micrograph (SEM) observations.
2.2. K Value Measurement
In this study, the K value was measured using a Freshness Checker (QS 3201, QS solution, Miyagi, Japan), which is based on a paper electrophoresis method. Approximately 200 mg meat from the dorsal part of the fish was cut into small pieces and placed in 0.6 mL of extraction reagent A (supplied by QS solution), then neutralized using reagent 5.61% potassium hydroxide. Next, the supernatant was dropped in the electrophoresis buffer solution sprayed electrophoresis paper to conduct at 800 V for 7 min. After completion of electrophoresis, the paper was dried at 100 °C using a forced air convection dryer (Paper dryer QS 4201, QS solution, Miyagi, Japan). The developed spots on the dried electrophoresis paper were then illuminated at 254 nm and recorded by a digital camera (Canon EOS M3, Tokyo, Japan). Finally, the recorded spots were digitized and the K value for each spot calculated by a Spot Analyzer (QS solution).
2.3. Scales Spectra Acquisition
2.3.1. Front-Face Fluorescence Spectra Measurement
Front-face fluorescence spectra of scales were measured using an F-4500 fluorescence spectrophotometer (Hitachi, Tokyo, Japan). Scales without prior preparation were measured at room temperature using a quartz-windowed standard surface fluorescence cell with a single-position cell holder, which was set at a 30° incidence angle to minimize the reflected light, scattered radiation, and depolarization phenomena from the sample [18]. The scales were stacked up into a cell for front-face fluorescence spectra measurement immediately after removal from the fish body. A photomultiplier voltage of 700 V was used to reduce detector saturation. The instrumental settings were: slit width 5 nm (for both excitation and emission), excitation wavelengths 200–600 nm (every 10 nm) and emission wavelengths 210–700 nm (every 10 nm), and a scan speed of 12,000 nm/min.
2.3.2. Infrared Spectra Measurement for Compound Identification
Ikoma et al. [19] found that the infrared (IR) spectrum has characteristic peaks corresponding to the organic and inorganic components of the fish scale, which is a nanocomposite consisting of type I collagen and calcium-deficient apatite containing carbonate ions. Thus, infrared spectroscopy was used to identify the main compounds of the red sea bream scale in the current study.
Infrared spectra of the internal side (closest to skin) and the external side (exposed to air) of the raw scales were obtained with a Thermo Scientific Nicolet iS5 FTIR (Fourier Transform Infrared) spectrometer (Thermo Fisher Scientific, Kanagawa, Japan) equipped with an iD5 attenuated total reflectance (ATR) accessory. The scale sample was placed on a prism (ZnSe) and compressed lightly using a pressure clamp. Spectra were measured from a wave number of 4000–500 cm−1 with a resolution of 4 cm−1 with 32 scans for each spectrum. Spectra were collected and peaks detected using Omnic software (Thermo Fisher Scientific).
2.4. Scanning Electron Micrograph Image Acquisition
In order to observe the morphology of the scales, the scales were cleaned with distilled water, dried, and then were coated with platinum (JEOL JFC 1600 Auto Fine Coater, Tokyo, Japan) for 2 min at 10 mA, before being examined with a scanning electron microscope (SM-200, Topcon, Japan) at an accelerating voltage of 20 kV.
3. Results and Discussion
3.1. Time-Dependent Changes of K Value
The K value of red sea bream increased exponentially after 27 h storage at 22 ± 2 °C (Figure 2), which is in agreement with the K value observed in Dasyatis brevis muscle when stored at 0 °C for 18 days [4]. The K value began from 12.2% at the start of storage to 83.2% after 27 h storage. According to Kato et al. [20], fish with a K value of less than 20% are classed as food suitable for raw consumption; with a K value less than 40% are suitable to be boiled or stewed; with a K value of over 40% are classed as spoiled fish. Thus, the K value results indicate that the red sea bream could still be used for “Sashimi” grade (raw consumption) up until 9 h storage (a K value under 20%), and for cooking grade up until 18 h storage (a K value under 40%). For our research purposes, we term fish as being in the “fresh stage” when the K value is below 40%, and those in the “spoiled stage” when the K value is over 40%. Thus, the red sea bream monitored during this storage experiment remained in the “fresh stage” for 18 h, while fish stored for more than 18 h at room temperature (22 ± 2 °C) were found to be in the “spoiled stage”.
3.2. Fluorescence Spectroscopic Properties of Red Sea Bream Scales
For the red sea bream scales, three visible peaks were identified from the corrected fluorescence landscape (Figure 3); the highest fluorescence intensity was observed at peak A with an excitation (Ex) wavelength of 280 nm and emission (Em) wavelength of 310 nm, with a weaker signal at a same excitation and emission wavelength of 620 nm. Moreover, a relatively strong fluorescence signal was detected at peak B with an excitation wavelength of 340 nm and emission of about 420 nm.
3.2.1. Identification of the Major Compound Contributing to Peak A (Ex/Em: 280/310 nm)
A number of reports have noted that the fluorescence signal at peak A is caused by free tyrosine or proteins containing tyrosine residuals [21]. Analyses of fish scales reveal a 41% to 81% organic protein content, including 24% of ichthylepidin and 76% of collagen [22]; scale ichthylepidin contains about 5% tyrosine residuals (rare tryptophan residuals) [23], while scale collagen contains 2–3 tyrosine residuals (tryptophan not detected) in 1000 total residuals [24]. These organic proteins containing tyrosine residuals contribute, to some extent, to the fluorescence signal at peak A. However, for the untreated scales, we also need to consider the mucus (and epidermis) that covers the surface of the scales, since it reaches a considerable thickness on the surface of the scales [25]. The mucus of fish, which is a complex jelly-like fluid predominantly formed by macromolecules (proteins) [26], plays a critical role in their defense by acting as a biological barrier [27]. The mucus shows strong absorption in the protein region due to the tyrosine residuals which are confirmed to exist in mucus proteins [28], and free tyrosine—an essential content in fish mucus fluid [29]. Thus, the free tyrosine and its residual proteins in the mucus were also deemed to contribute to the fluorescence signal at peak A.
Additionally, a weak signal was observed in the scale fluorescence spectra at an excitation wavelength of 280 nm and emission wavelength of 620 nm; this is an artificial peak due to a second-order transmission of the diffraction grating monochromators from peak A. However, this artificial peak could be used to show the similar fluorescence behavior and to maintain a fixed fraction of peak A intensity [30]. Here, we use the intensities of the peak at Ex/Em of 280/620 nm rather than that at peak A to represent the change in fluorescence intensities during storage because the intensities at peak A were partly saturated.
3.2.2. Identification of the Major Compound Contributing to Peak B (Ex/Em: 340/420 nm)
Previous research has indicated that a fluorescence signal at peak B with an Ex/Em wavelength pair of 340/420 nm can be assigned to collagen (Type I), reduced form of nicotinamide adenine dinucleotide (NADH) or vitamins [31,32].
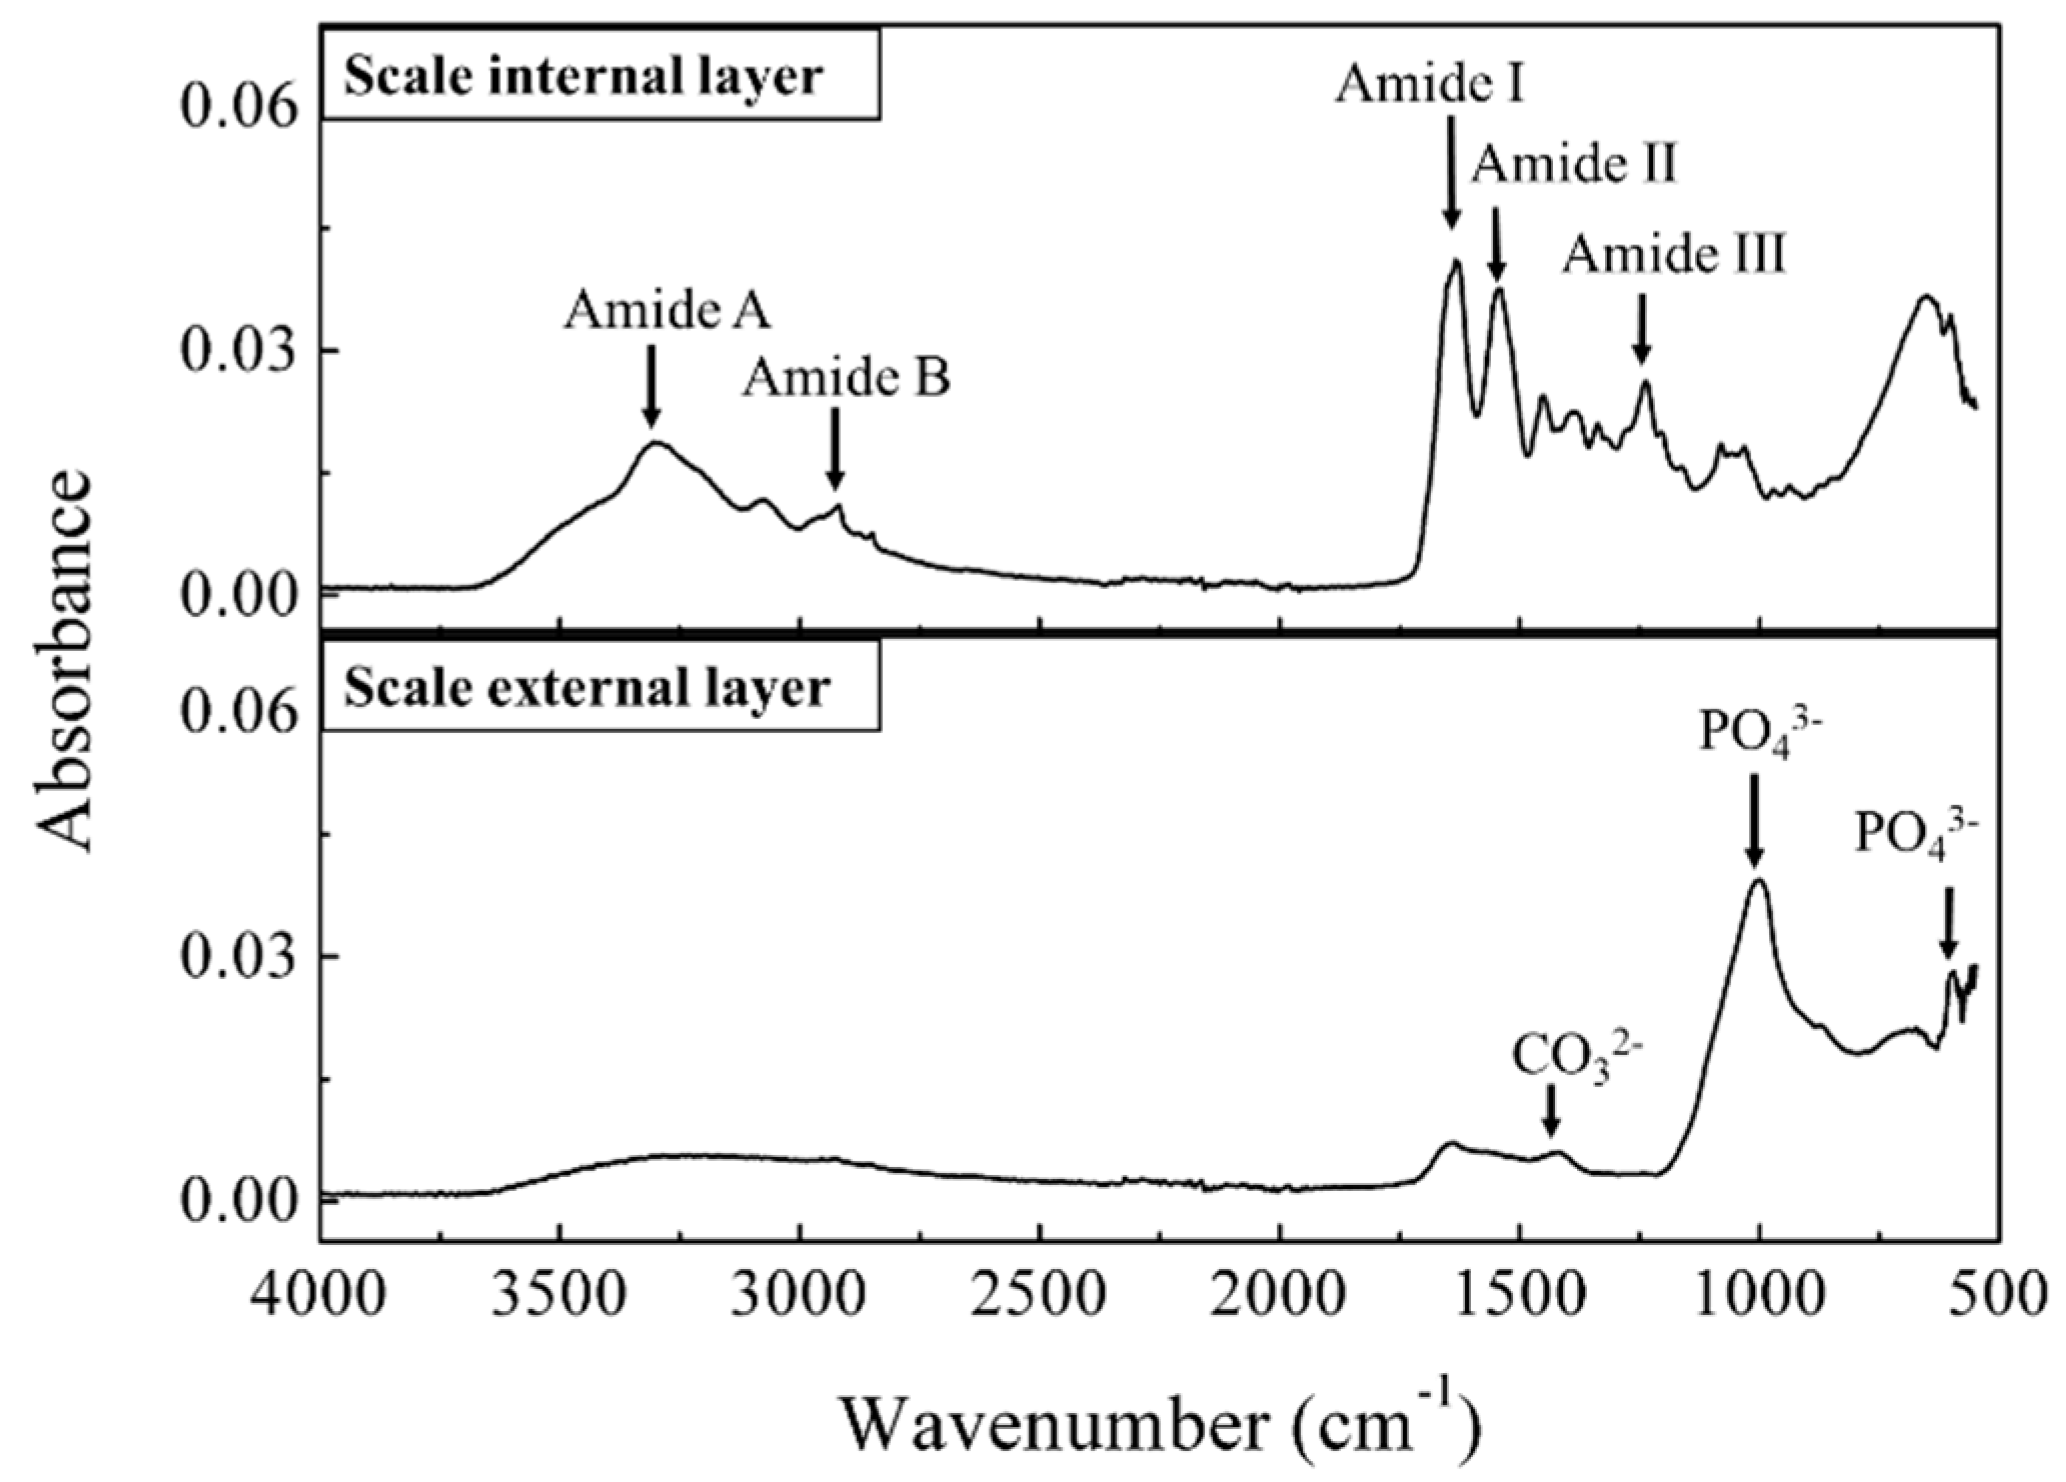
Generally, the elasmoid scales of teleost fish consist of collagen fiber, which forms a highly ordered three-dimensional structure together with calcium-deficient hydroxyapatite [33]. The internal and external layers of the red sea bream scale were measured with a Fourier Transform Infrared (FTIR) in ATR mode (Figure 4). The FTIR spectrum of the internal side of the scale showed a characteristic peak at 3292 cm−1, which corresponds to the amide A arising from the N-H stretching, and the absorption peak at 3081 cm−1 is assigned to the amide B band of collagen; peaks at 1628, 1544 and 1238 cm−1 are characteristic of C=O stretching vibrations, N-H bending vibrations and the C-N stretching vibrations, as well as C-N stretching and N-H in-plane bending corresponding to amide I, II and III bands of collagen, respectively [34]. The amide III band demonstrates the existence of a helical structure [35]. The FTIR spectra of the external layer showed strong absorption bands around 600 and 1000 cm−1, corresponding to phosphate groups in the apatite lattice, and a peak at 1420 cm−1 corresponding to carbonate anions substituted for phosphate ions in the apatite lattice [33]. The FTIR spectra results on the internal and external sides of the red sea bream scale are in close agreement with the results of Ikoma et al. [19] which suggest that the fish scale consists of mainly type I collagen fibrils with a partially calcified internal layer and a well-calcified external layer. Importantly, the IR spectra of this collagen layer (internal side) is in agreement with the IR spectra of collagen isolated from the scales of other fish species [36], confirming that collagen actually largely exists on red sea bream scales. The current fluorescence spectroscopy device has a sufficient intensity of excitation light which could penetrate into the scale. Therefore, collagen undeniably contributes to the fluorescence signal of peak B in the red sea bream scale, in agreement with the results from Santana et al. [37]. Moreover, for the untreated scales, traces of NADH or vitamins may be present in the mucus or epidermis, also contributing slightly to this peak [32].
3.3. Time-Dependent Changes in Fluorescence Intensity of Scales
3.3.1. Time-Dependent Changes in Fluorescence Intensity of Peak A (Ex/Em: 280/310 nm)
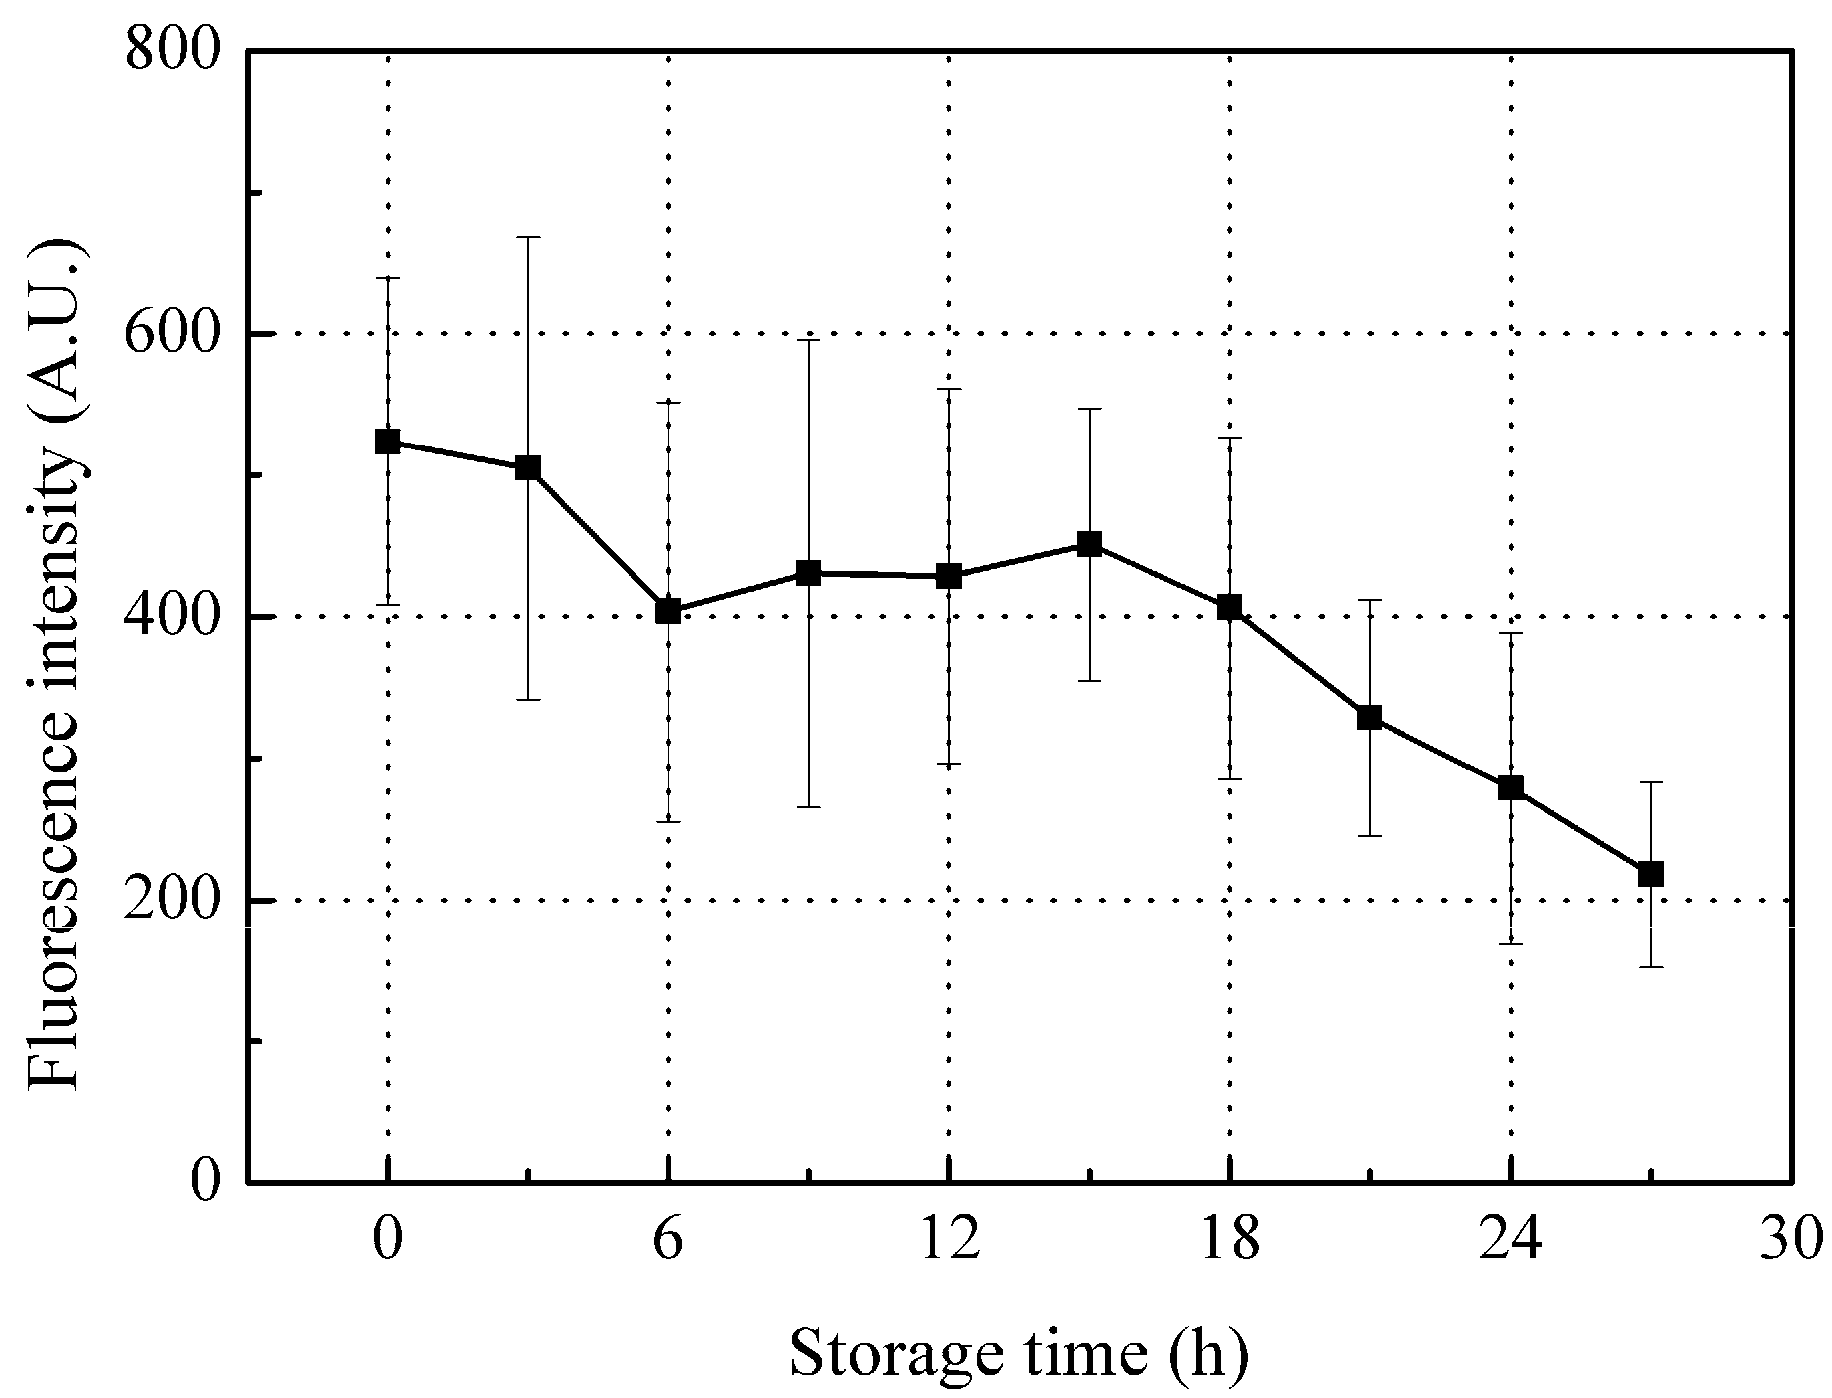
Although there was a relatively consistent decrease in peak A fluorescence intensity with storage, there was a large error bar mainly associated with individual differences between fish samples (Figure 5). Since the peak A fluorescence intensity consists of internal fluorescence of organic compounds (from ichthylepidin and collagen) and surface fluorescence (from the mucus layer), changes in these compounds will be reflected in the peak A intensity changes during storage.
Ichthylepidin belongs to scleroprotein, which is insoluble in most solvents, is hardly digested by enzymes [38], and is expected to be quite stable during storage, resulting in minimal changes in tyrosine residuals. Since collagen contains traces of tyrosine residual, the change in collagen tyrosine residual is not expected to significantly affect peak A fluorescence intensity levels.
On the other hand, the outer mucus plays a critical role in live fish defense by trapping and immobilizing most bacteria and pathogens before they can contact epithelial surfaces; continuous secretion and replacement of mucus prevents the stable colonization of potential infectious microorganisms [39]. However, once the fish body dies, the replacement metabolism stops, and the microorganisms invade the mucus on the scales with decreasing defensive capabilities (secretion of new mucus). Thus, these microorganisms are expected to multiply rapidly and consume the free tyrosine and proteins in the mucus, which will significantly impact total tyrosine (i.e., peak A) fluorescence intensity levels. That is, the free tyrosine in mucus is readily utilized by the fast-multiplying microorganisms, decreasing peak A intensity during storage. However, the complex degradation of proteins and generation of free tyrosine result in the peak A intensity fluctuating during storage [40].
3.3.2. Time-Dependent Changes in Fluorescence Intensity of Peak B (Ex/Em: 340/420 nm)
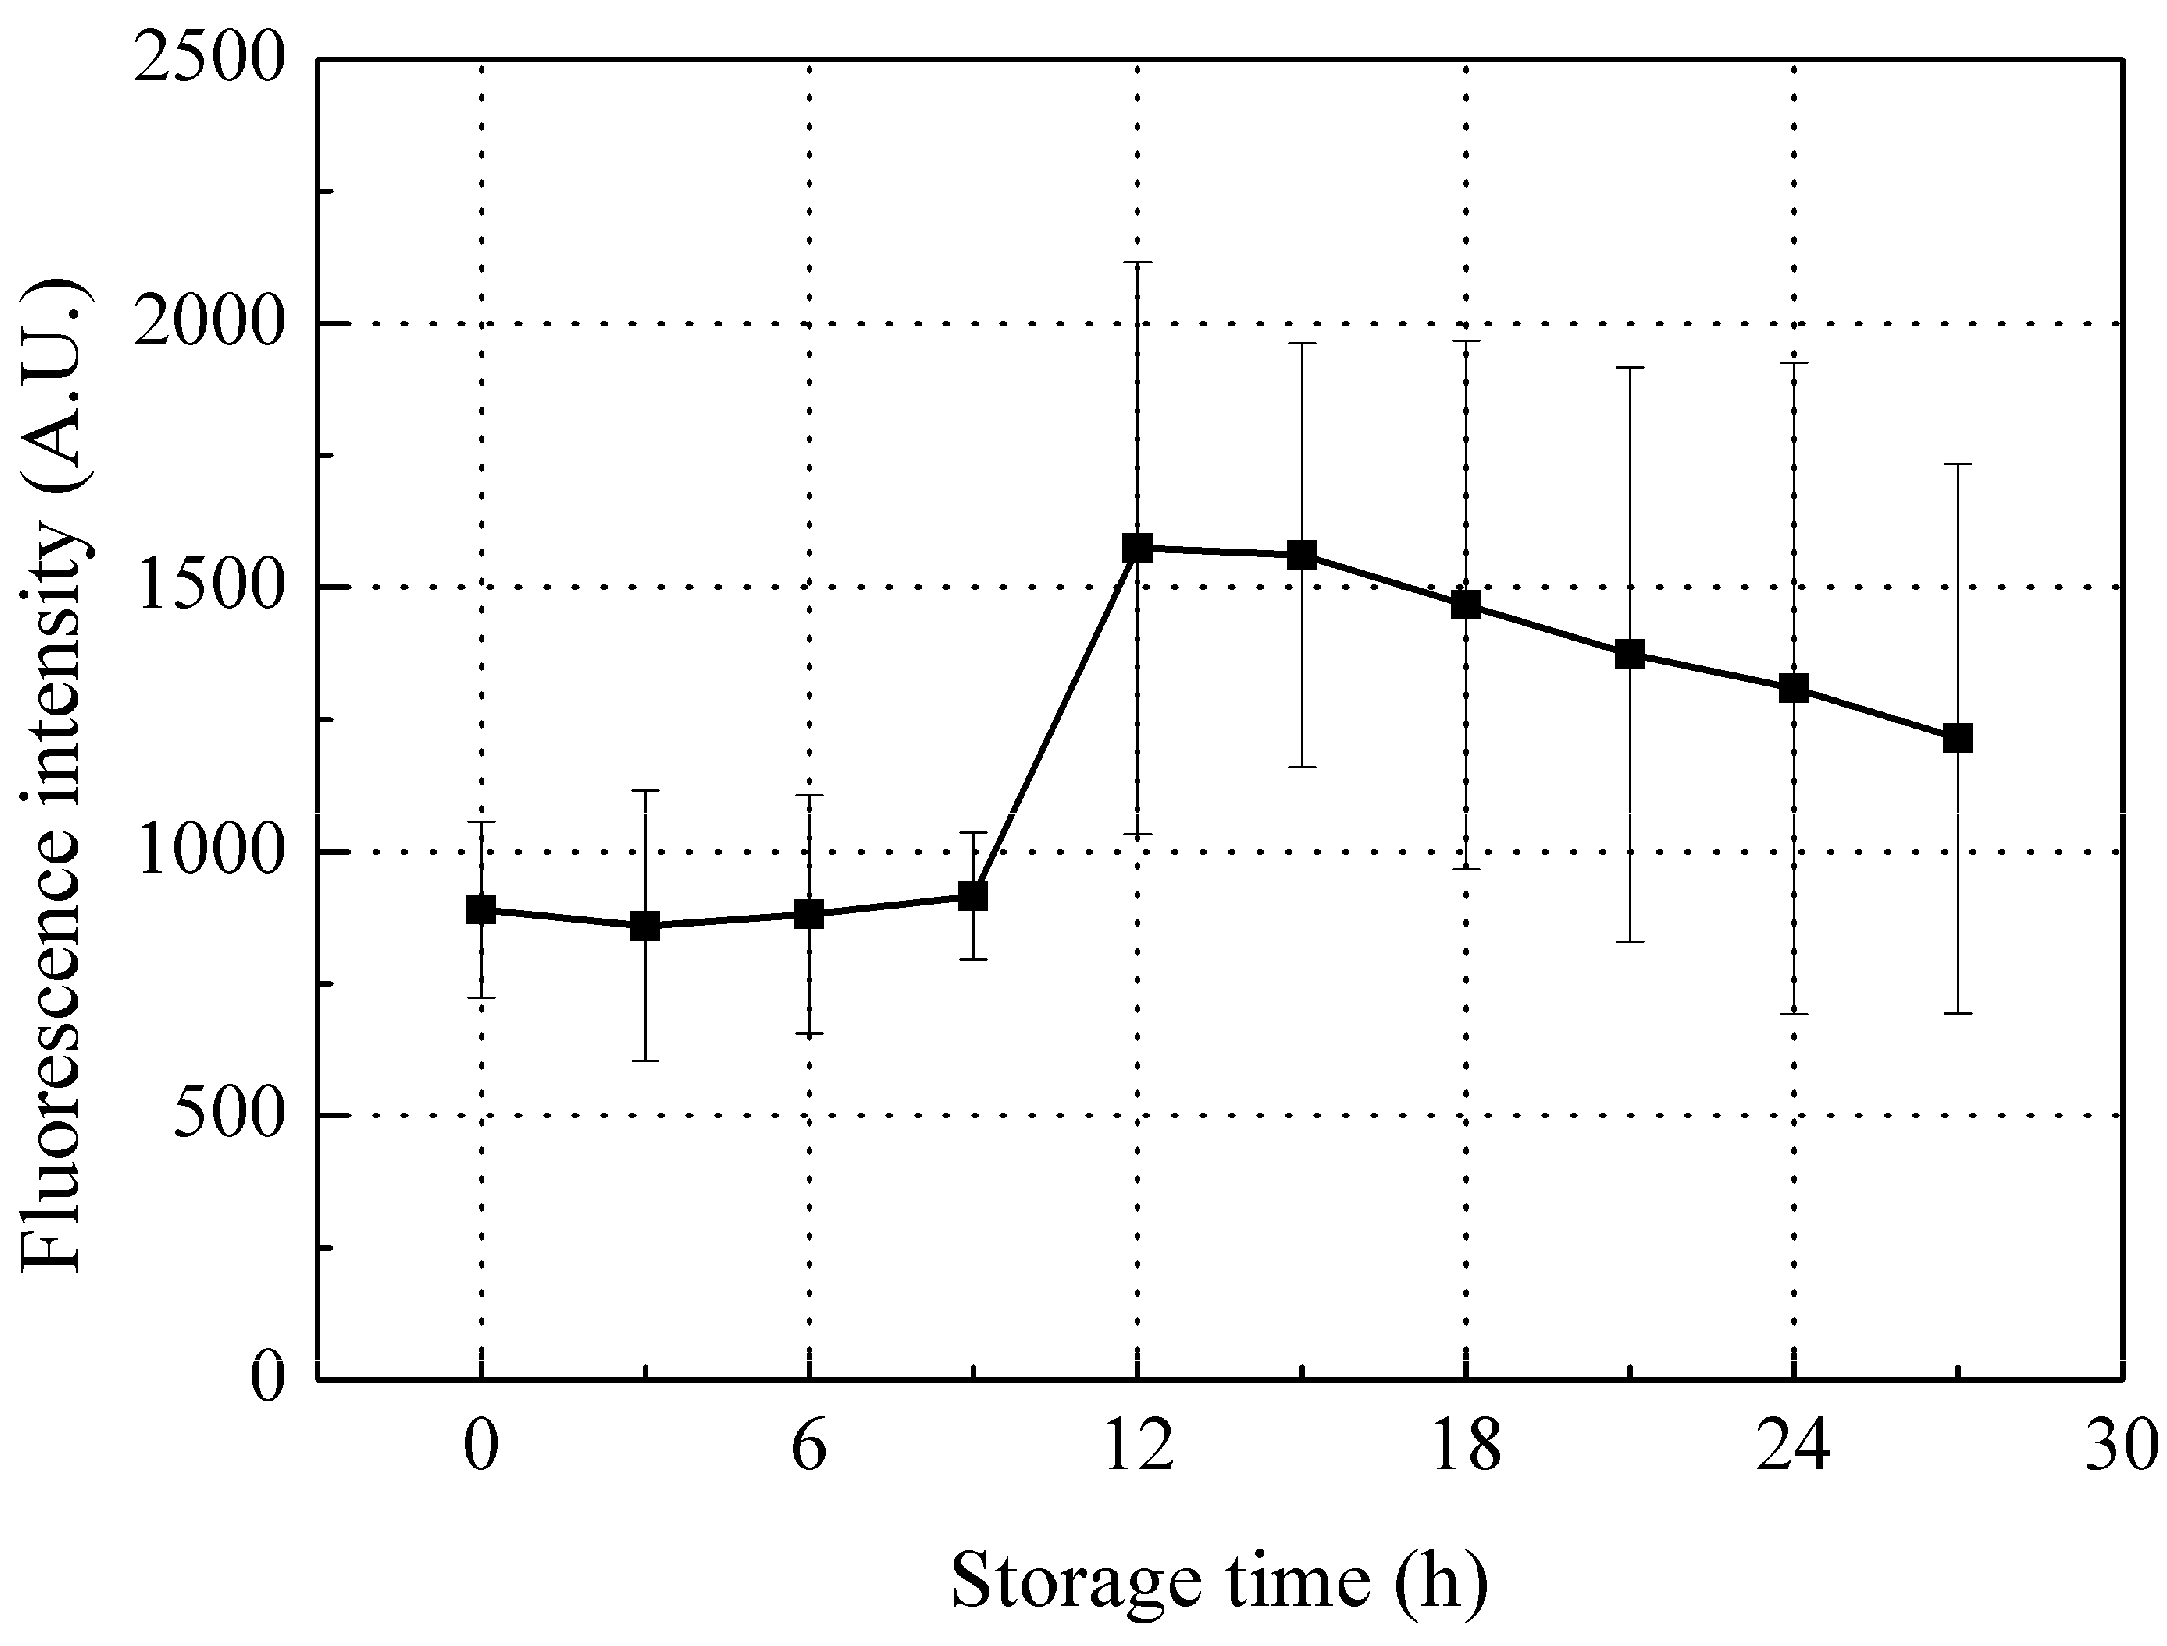
The changes in peak B fluorescence intensity of red sea bream scales during storage is shown in Figure 6. Intensity tended to increase during the initial stage of storage (first 12 h storage), while a higher value was apparent after 12 h storage, but with a slow downward decline thereafter.
Since collagen was the biggest contributor to peak B, changes in collagen would essentially lead to the changes in peak B during storage. As the water holding capacity of fish decreases, in company with moisture evaporation on the fish surface during storage [41], the scales on the fish surface will also lose moisture, which may be the main contributor to the increase in peak B fluorescence intensity during this initial stage of storage (the first 12 h storage). In vitro scales lose water very fast; most of the scale water content (23% by weight) was lost within 10 min of drying at room temperature of 22 ± 2 °C and humidity of 45%. The peak B fluorescence intensity was observed to linearly increase with the scale water loss (Figure 7), that is, the dryer the scale, the higher the peak B fluorescence intensity observed. Thus, fish scales can confidently be assumed to be losing moisture during storage which leads to increased peak B fluorescence from the scales at this initial stage of storage. In addition, scale moisture loss could slightly increase the peak A fluorescence intensity but not significantly; thus, this may not be the key factor causing the variation in peak A fluorescence intensity during storage (Figure 5).
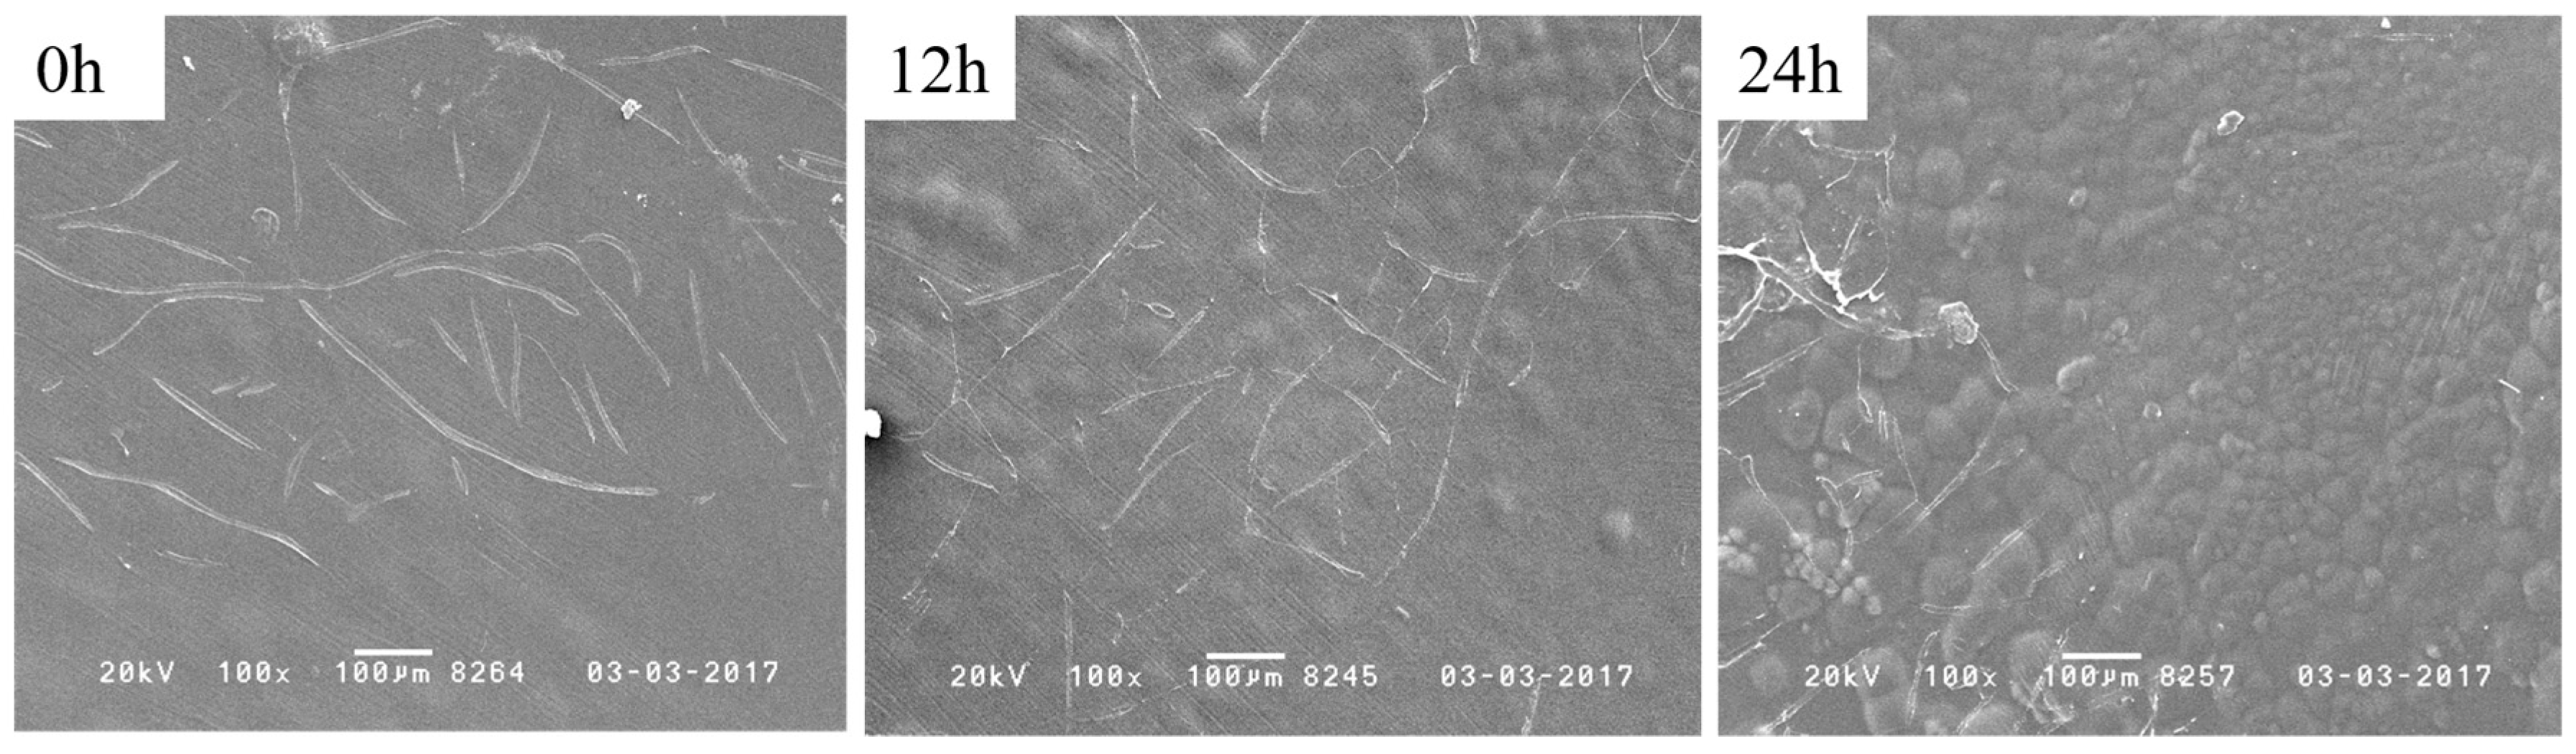
The observed peak B fluorescence decrease later in storage (after 12 h storage) may be mainly due to aggravated bacteria activity on fish scales collagen. SEM images of the scale collagen layer (Figure 8) clearly show that at the spoiled stage (24 h storage), the collagen layer was much rougher and damaged than at the fresh stage (0 h or 12 h storage), due mainly to the bacterial collagenase that are produced by the accelerated colonialization and multiplication of bacteria entrapped in the mucus of the fish, while it was still alive, gradually digesting the scale collagen [42]. Therefore, the peak B intensity which was mainly due to the changes in collagen tends to decrease later in storage.
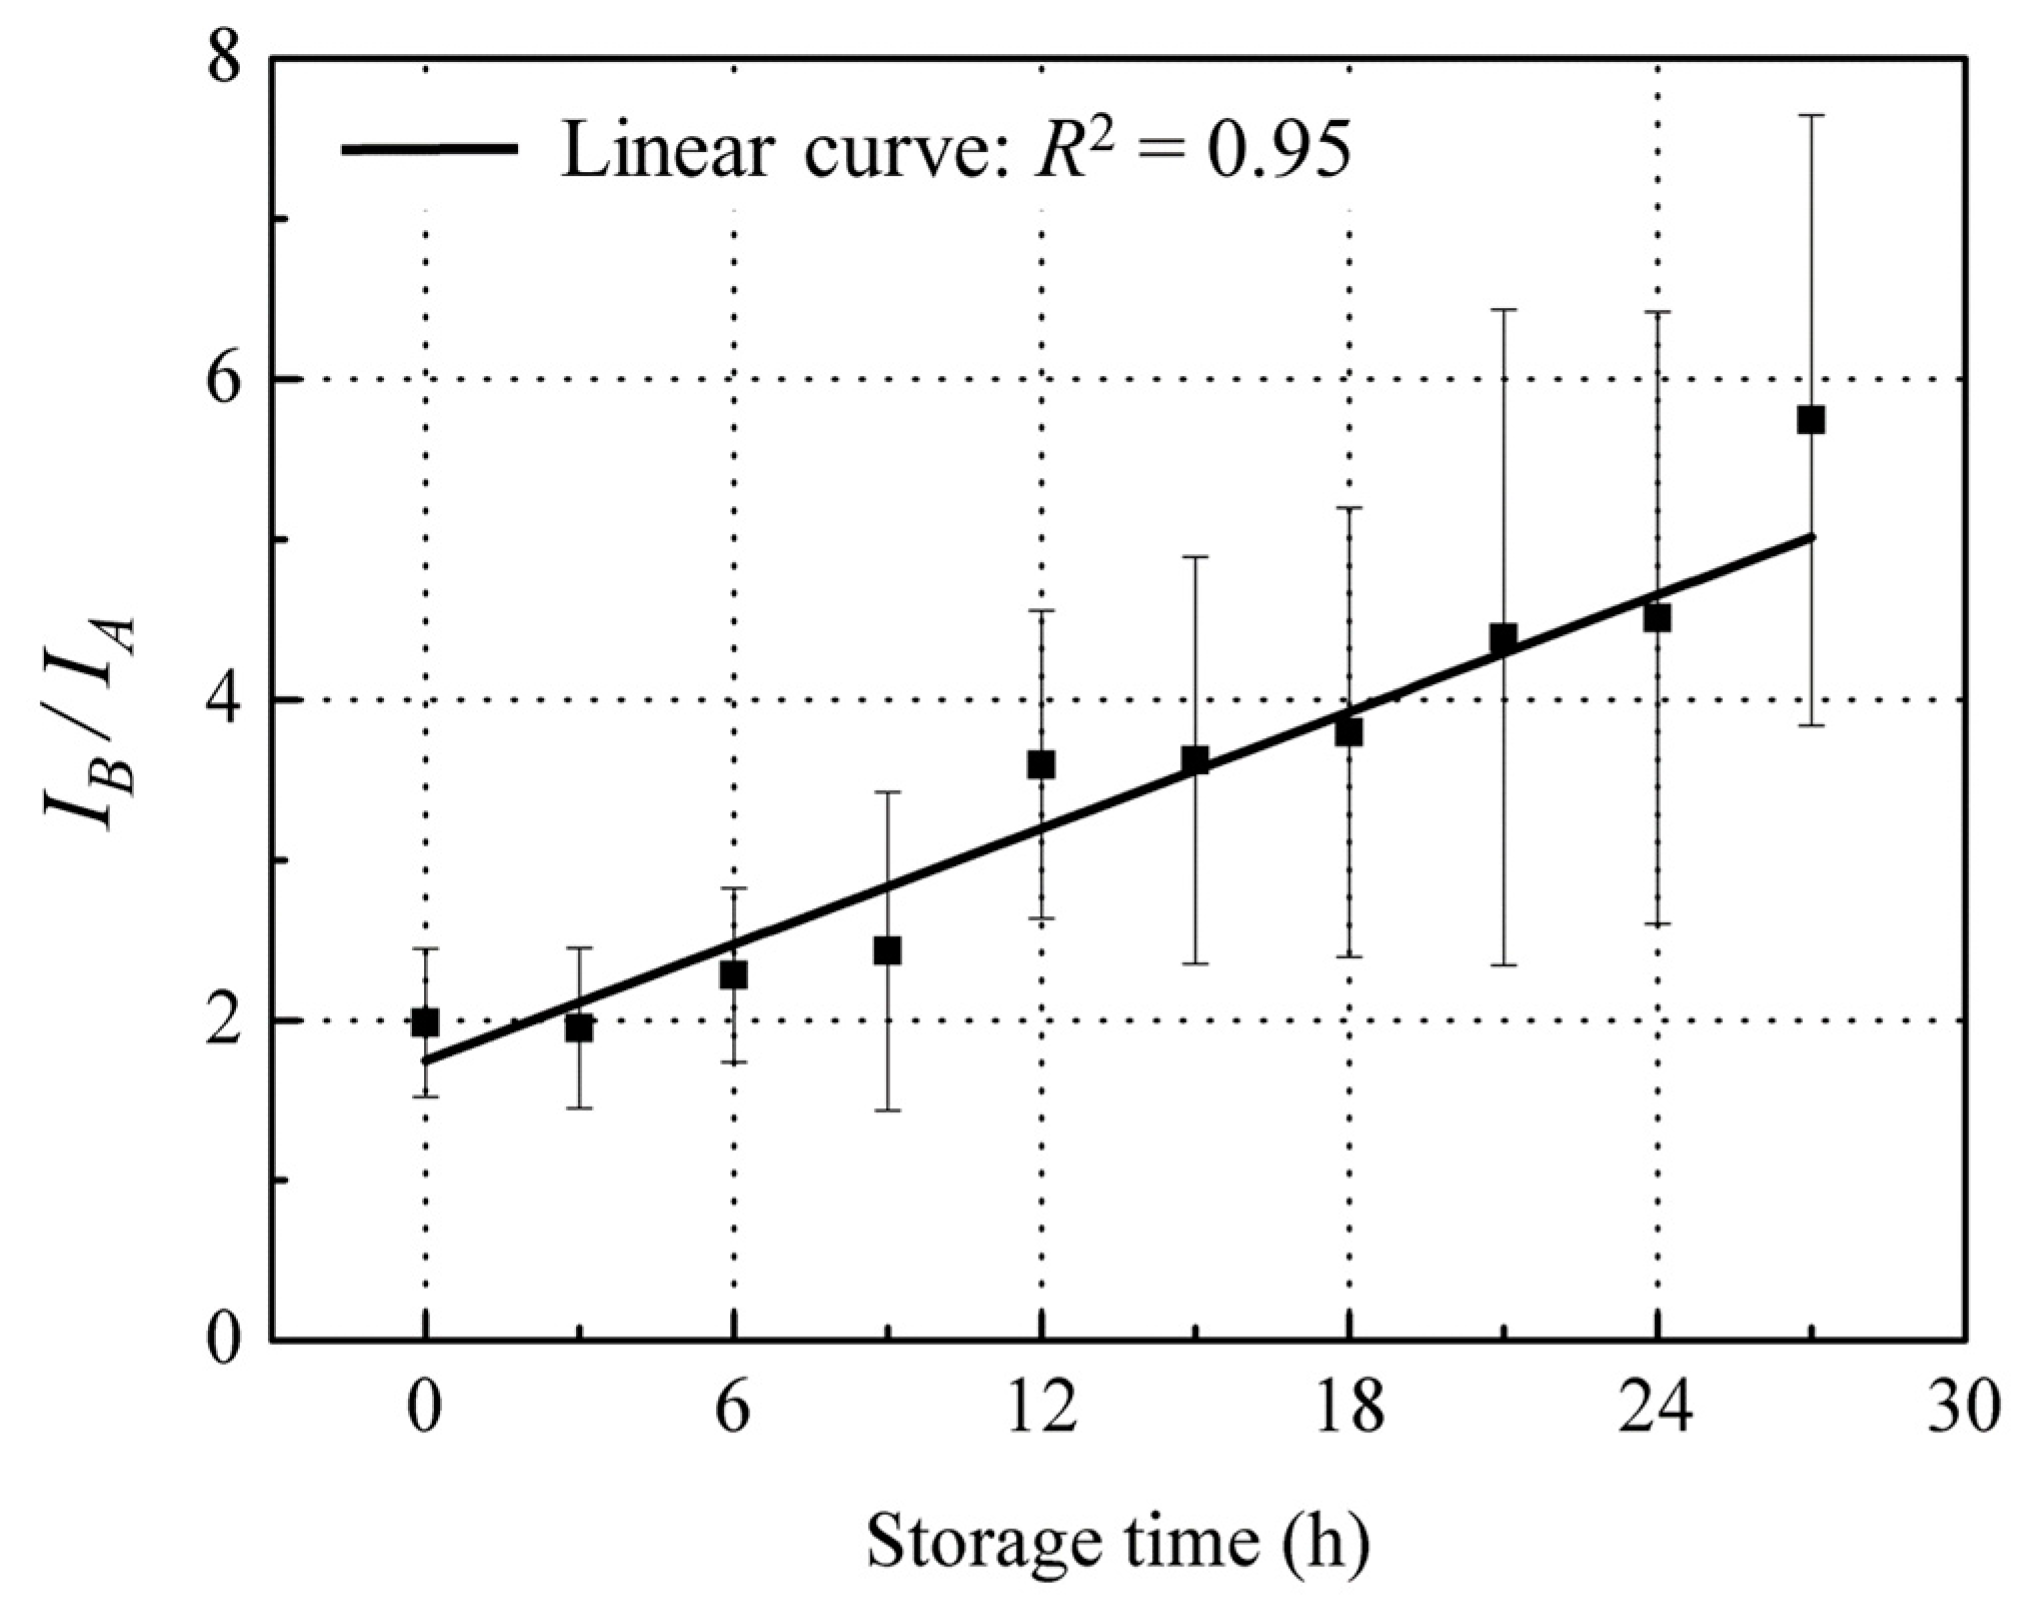
3.3.3. Ratio of IB/IA Related with Freshness
The above observations point to the conclusion that red sea bream scale fluorescence changes in peak A and peak B which is mainly due to changes in tyrosine and collagen content in opposite directions during fish storage, suggesting that the mean ratios of these two peaks may provide a sensitive correlation with fish freshness decline during storage. Moreover, baseline fluctuations due to experimental conditions affect both peaks similarly, thereby canceling each other out; the ratio of the two peaks is calculated. When IB/IA was plotted against storage time, there was a linear increase (black line) with R2 = 0.95 (Figure 9), suggesting a fluorescence technique based on this ratio for quantitative detection of the fish freshness status that is more intuitive and responsive to fish freshness than the exponentially increasing K value (Figure 2).
4. Conclusions
The results have demonstrated that a fish freshness index, based on front-face fluorescence spectroscopy of fish scales, is a potentially rapid, sensitive and non-destructive means for assessing fish freshness. Two major fluorescence signals at peak A and B from the scales of red sea bream with an Ex/Em of 280/310 nm and 340/420 nm, respectively, were observed. Peak A was assigned to tyrosine containing tyrosine residuals in proteins and free tyrosine from the skeleton and mucus of the scale. Peak B was thought to be caused by collagen (mainly Type I collagen), which forms the basic skeleton of the scale. When the intensity ratio of these fluorescence peaks (IB/IA) was plotted against storage time, a linear increase (R2 = 0.95) was found. Thus, this ratio offers a novel analytical means for quantitative measurement of fish freshness status. In addition, this methodology potentially offers valuable information to build a further preparation-free, direct, and non-destructive technique such as a fluorescence multiplex sensor or imaging for assessing fish freshness, which is currently not offered by other assessment methods.
Acknowledgments
Financial support was provided by Supporting Program for Interaction-based Initiative Team Studies (SPIRITS) in Kyoto University. We are grateful to Katsuhiro Kanamori from Panasonic Corporation (Kyoto, Japan) and Professor Takahashi Ryoji (Department of Chemistry, Graduate School of Science and Engineering, Ehime University) for supplying equipment, Xu Kebing, Motomu Sakamoto and Matsui Tomoya for help to gather experimental data. We are thankful to Garry John Piller (Graduate School of Agriculture, Kyoto University, Japan) for proof reading of the manuscript.
Author Contributions
N.K. was the project supervisor. Q.L. designed the experiments presented in this paper, and performed the experiments and analysis with the assistance of M.K. Q.L. wrote and edited the manuscript with the assistance of M.K, T.S. and D.F.A.R.
Conflicts of Interest
The authors declare no conflict of interest.
References
- Özogul, Y.; Özyurt, G.; Özogul, F.; Kuley, E.; Polat, A. Freshness assessment of European eel (Anguilla anguilla) by sensory, chemical and microbiological methods. Food Chem. 2005, 92, 745–751. [Google Scholar] [CrossRef]
- Arulkumar, A.; Paramasivam, S. Sensory quality and biochemical changes in deep queen fish (Scomberoides tala) during ice storage. Asian J. Microbiol. Biotechnol. Environ. Sci. 2015, 17, 117–125. [Google Scholar]
- Chytiri, S.; Chouliara, I.; Savvaidis, I.N.; Kontominas, M.G. Microbiological, chemical and sensory assessment of iced whole and filleted aquacultured rainbow trout. Food Microbiol. 2004, 21, 157–165. [Google Scholar] [CrossRef]
- Ocaño-Higuera, V.M.; Maeda-Martínez, A.N.; Marquez-Ríos, E.; Canizales-Rodríguez, D.F.; Castillo-Yáñez, F.J.; Ruíz-Bustos, E.; Graciano-Erdugo, A.Z.; Plascencia-Jatomea, M. Freshness assessment of ray fish stored in ice by biochemical, chemical and physical methods. Food Chem. 2011, 125, 49–54. [Google Scholar] [CrossRef]
- Itoh, D.; Koyachi, E.; Yokokawa, M.; Murata, Y.; Murata, M.; Suzuki, H. Microdevice for on-site fish freshness checking based on K-value measurement. Anal. Chem. 2013, 85, 10962–10968. [Google Scholar] [CrossRef] [PubMed]
- Cheng, J.H.; Dai, Q.; Sun, D.W.; Zeng, X.A.; Liu, D.; Pu, H.B. Applications of non-destructive spectroscopic techniques for fish quality and safety evaluation and inspection. Trends Food Sci. Technol. 2013, 34, 18–31. [Google Scholar] [CrossRef]
- Murakoshi, T.; Masuda, T.; Utsumi, K.; Tsubota, K.; Wada, Y. Glossiness and Perishable Food Quality: Visual Freshness Judgment of Fish Eyes Based on Luminance Distribution. PLoS ONE 2013, 8, e58994. [Google Scholar] [CrossRef] [PubMed]
- Huang, X.; Xin, J.; Zhao, J. A novel technique for rapid evaluation of fish freshness using colorimetric sensor array. J. Food Eng. 2011, 105, 632–637. [Google Scholar] [CrossRef]
- Han, F.; Huang, X.; Teye, E.; Gu, H.; Dai, H.; Yao, L. A nondestructive method for fish freshness determination with electronic tongue combined with linear and non-linear multivariate algorithms. Czech J. Food Sci. 2014, 32, 532–537. [Google Scholar]
- Karoui, R.; Blecker, C. Fluorescence spectroscopy measurement for quality assessment of food systems—A review. Food Bioprocess Technol. 2011, 4, 364–386. [Google Scholar] [CrossRef]
- Airado-Rodríguez, D.; Skaret, J.; Wold, J.P. Assessment of the quality attributes of cod caviar paste by means of front-face fluorescence spectroscopy. J. Agric. Food Chem. 2010, 58, 5276–5285. [Google Scholar] [CrossRef] [PubMed]
- Lakhal, L.; Acha, V.; Aussenac, T. PARAFAC analysis of front-face fluorescence data: Absorption and scattering effects assessed by means of Monte Carlo simulations. Chemom. Intell. Lab. Syst. 2012, 116, 112–122. [Google Scholar] [CrossRef]
- Christensen, J.; Nørgaard, L.; Bro, R.; Engelsen, S.B. Multivariate autofluorescence of intact food systems. Chem. Rev. 2006, 106, 1979–1994. [Google Scholar] [CrossRef] [PubMed]
- Mondal, S.; Mahata, S.; Kundu, S.; Mondal, B. Processing of natural resourced hydroxyapatite ceramics from fish scale. Adv. Appl. Ceram. 2010, 109, 234–239. [Google Scholar] [CrossRef]
- Ghozlen, N.B.; Cerovic, Z.G.; Germain, C.; Toutain, S.; Latouche, G. Non-destructive optical monitoring of grape maturation by proximal sensing. Sensors 2010, 10, 10040–10068. [Google Scholar] [CrossRef] [PubMed]
- Nishino, K.; Nakamura, K.; Tsuta, M.; Yoshimura, M.; Sugiyama, J.; Nakauchi, S. Optimization of excitation–emission band-pass filter for visualization of viable bacteria distribution on the surface of pork meat. Opt. Express 2013, 21, 12579–12591. [Google Scholar] [CrossRef] [PubMed]
- Johal, M.S.; Esmaeili, H.R.; Sharma, M.L. Scale structure of a cobitid fish, Cobitis linea (Heckel, 1849) using different modes of SEM. Curr. Sci. 2006, 91, 1464–1466. [Google Scholar]
- Schamberger, G.P.; Labuza, T.P. Evaluation of Front-face Fluorescence for Assessing Thermal Processing of Milk. J. Food Sci. 2006, 71, 69–74. [Google Scholar] [CrossRef]
- Ikoma, T.; Kobayashi, H.; Tanaka, J.; Walsh, D.; Mann, S. Microstructure, mechanical, and biomimetic properties of fish scales from Pagrus major. J. Struct. Biol. 2003, 142, 327–333. [Google Scholar] [CrossRef]
- Kato, N.; Kunimoto, M.; Koseki, S.; Kitakami, S.; Arai, K. Freshness and Quality of Fish and Shellfish (Supplementary Edition). J. Sch. Mar. Sci. Technol. 2009, 7, 87–99. [Google Scholar]
- Lakowicz, J.R. Principles of Fluorescence Spectroscopy: Protein Fluorescence; Springer Science + Business Media LLC: New York, NY, US, 2006; pp. 63–95. [Google Scholar]
- Masood, Z.; Yasmeen, R.; Haider, M.S.; Tarar, O.M. Evaluations of crude protein and amino acid contents from the scales of four mullet species (Mugilidae) collected from Karachi fish harbor, Pakistan. Indian J. Geo-Mar. Sci. 2015, 44, 724–731. [Google Scholar]
- Tsuchiya, Y. Chemical of Supporting Tissue on Fishery Animals. Nippon Suisan Gakkaishi 1959, 24, 865–874. [Google Scholar] [CrossRef]
- Pati, F.; Adhikari, B.; Dhara, S. Isolation and characterization of fish scale collagen of higher thermal stability. Bioresour. Technol. 2010, 101, 3737–3742. [Google Scholar] [CrossRef] [PubMed]
- Wainwright, D.K.; Lauder, G.V. Three-dimensional analysis of scale morphology in bluegill sunfish, Lepomis macrochirus. Zoology 2016, 119, 182–195. [Google Scholar] [CrossRef] [PubMed]
- Ángeles, E.M. An Overview of the Immunological Defenses in Fish Skin. ISRN Immunol. 2012, 2012, 1–29. [Google Scholar] [CrossRef]
- Park, S.B.; Jang, H.B.; Fagutao, F.F.; Kim, Y.K.; Nho, S.W.; Cha, I.S.; Jung, T.S. Combination treatment against scuticociliatosis by reducing the inhibitor effect of mucus in olive flounder, Paralichthys olivaceus. Fish Shellfish Immunol. 2014, 38, 282–286. [Google Scholar] [CrossRef] [PubMed]
- Oda, Y.; Ichida, S.; Mimura, T.; Maeda, K.; Tsujikawa, K.; Aonuma, S. Purification and characterization of a fish lectin from the external mucous of Ophidiidae, Genypterus blacodes. J. Pharmacobio-Dyn. 1984, 7, 614–623. [Google Scholar] [CrossRef] [PubMed]
- Chong, K.; Tham, S.Y.; Foo, J.; Lam, T.J.; Chong, A. Characterisation of proteins in epidermal mucus of discus fish (Symphysodon spp.) during parental phase. Aqua 2005, 249, 469–476. [Google Scholar] [CrossRef]
- Stella, L.; Capodilupo, A.L.; Bietti, M. A reassessment of the association between azulene and fullerene. Possible pitfalls in the determination of binding constants through fluorescence spectroscopy. Chem. Commun. 2008, 39, 4744–4746. [Google Scholar] [CrossRef] [PubMed]
- Rouissi, H.; Dridi, S.; Kammoun, M.; De, B.J.; Karoui, R. Front face fluorescence spectroscopy: A rapid tool for determining the effect of replacing soybean meal with scotch bean in the ration on the quality of Sicilo-Sarde ewe’s milk during lactation period. Eur. Food Res. Technol. 2008, 226, 1021–1030. [Google Scholar] [CrossRef]
- Georgakoudi, I.; Jacobson, B.C.; Müller, M.G.; Sheets, E.E.; Badizadegan, K.; Carr-Locke, D.L.; Feld, M.S. NADPH and collagen as in vivo quantitative fluorescent biomarkers of epithelial precancerous changes. Cancer Res. 2002, 62, 682–687. [Google Scholar] [PubMed]
- Liu, W.T.; Zhang, Y.; Li, G.Y.; Miao, Y.Q.; Wu, X.H. Structure and composition of teleost scales from snakehead Channa argus (Cantor) (Perciformes: Channidae). J. Fish Biol. 2008, 72, 1055–1067. [Google Scholar] [CrossRef]
- Heu, M.S.; Lee, J.H.; Kim, H.J.; Jee, S.J.; Lee, J.S.; Jeon, Y.; Kim, J.S. Characterization of acid- and pepsin-soluble collagens from flatfish skin. Food Sci. Biotechnol. 2010, 19, 27–33. [Google Scholar] [CrossRef]
- Muyonga, J.H.; Cole, C.G.B.; Duodu, K.G. Fourier transform infrared (FTIR) spectroscopic study of acid soluble collagen and gelatin from skins and bones of young and adult Nile perch (Lates niloticus). Food Chem. 2004, 86, 325–332. [Google Scholar] [CrossRef]
- Mori, H.; Tone, Y.; Shimizu, K.; Zikihara, K.; Tokutomi, S.; Ida, T.; Hara, M. Studies on fish scale collagen of Pacific saury (Cololabis saira). Mater. Sci. Eng. C 2013, 33, 174–181. [Google Scholar] [CrossRef] [PubMed]
- Santana, C.Á.; Lima, D.M.V.; da Cunha Andrade, L.H.; Súarez, Y.R.; Lima, S.M. Laser-induced fluorescence in fish scales to evaluate the environmental integrity of ecosystems. J. Photochem. Photobiol. B Biol. 2016, 165, 80–86. [Google Scholar] [CrossRef] [PubMed]
- Sánchez, H.H.; Fidel, G.; López, G. Protein-Based Nanoparticles. In Food Nanoscience and Nanotechnology; Springer: New York, NY, USA, 2015; pp. 69–79. [Google Scholar]
- Guardiola, F.A.; Cuesta, A.; Arizcun, M.; Meseguer, J.; Esteban, M.A. Comparative skin mucus and serum humoral defense mechanisms in the teleost gilthead sea bream (Sparus aurata). Fish Shellfish Immunol. 2014, 36, 545–551. [Google Scholar] [CrossRef] [PubMed]
- Lakshmanan, P.T. Fish spoilage and quality assessment. In Quality assurance in seafood processing; Lyre, T.S.G., Kandoran, M.K., Thomas, M., Mathew, P.T., Eds.; Society of Fisheries Technologists: Cochin, India, 2000; pp. 26–40. [Google Scholar]
- Rørå, A.M.B.; Regost, C.; Lampe, J. Liquid holding capacity, texture and fatty acid profile of smoked fillets of Atlantic salmon fed diets containing fish oil or soybean oil. Food Res. Int. 2003, 36, 231–239. [Google Scholar] [CrossRef]
- Yi, E.; Sato, S.; Takahashi, A.; Parameswaran, H.; Blute, T.A.; Bartolák-Suki, E.; Suki, B. Mechanical forces accelerate collagen digestion by bacterial collagenase in lung tissue strips. Front. Physiol. 2016, 7, 1–12. [Google Scholar] [CrossRef] [PubMed]
Figure 1.
Body of red sea bream (a) and “key scale” from fish body white border (b).
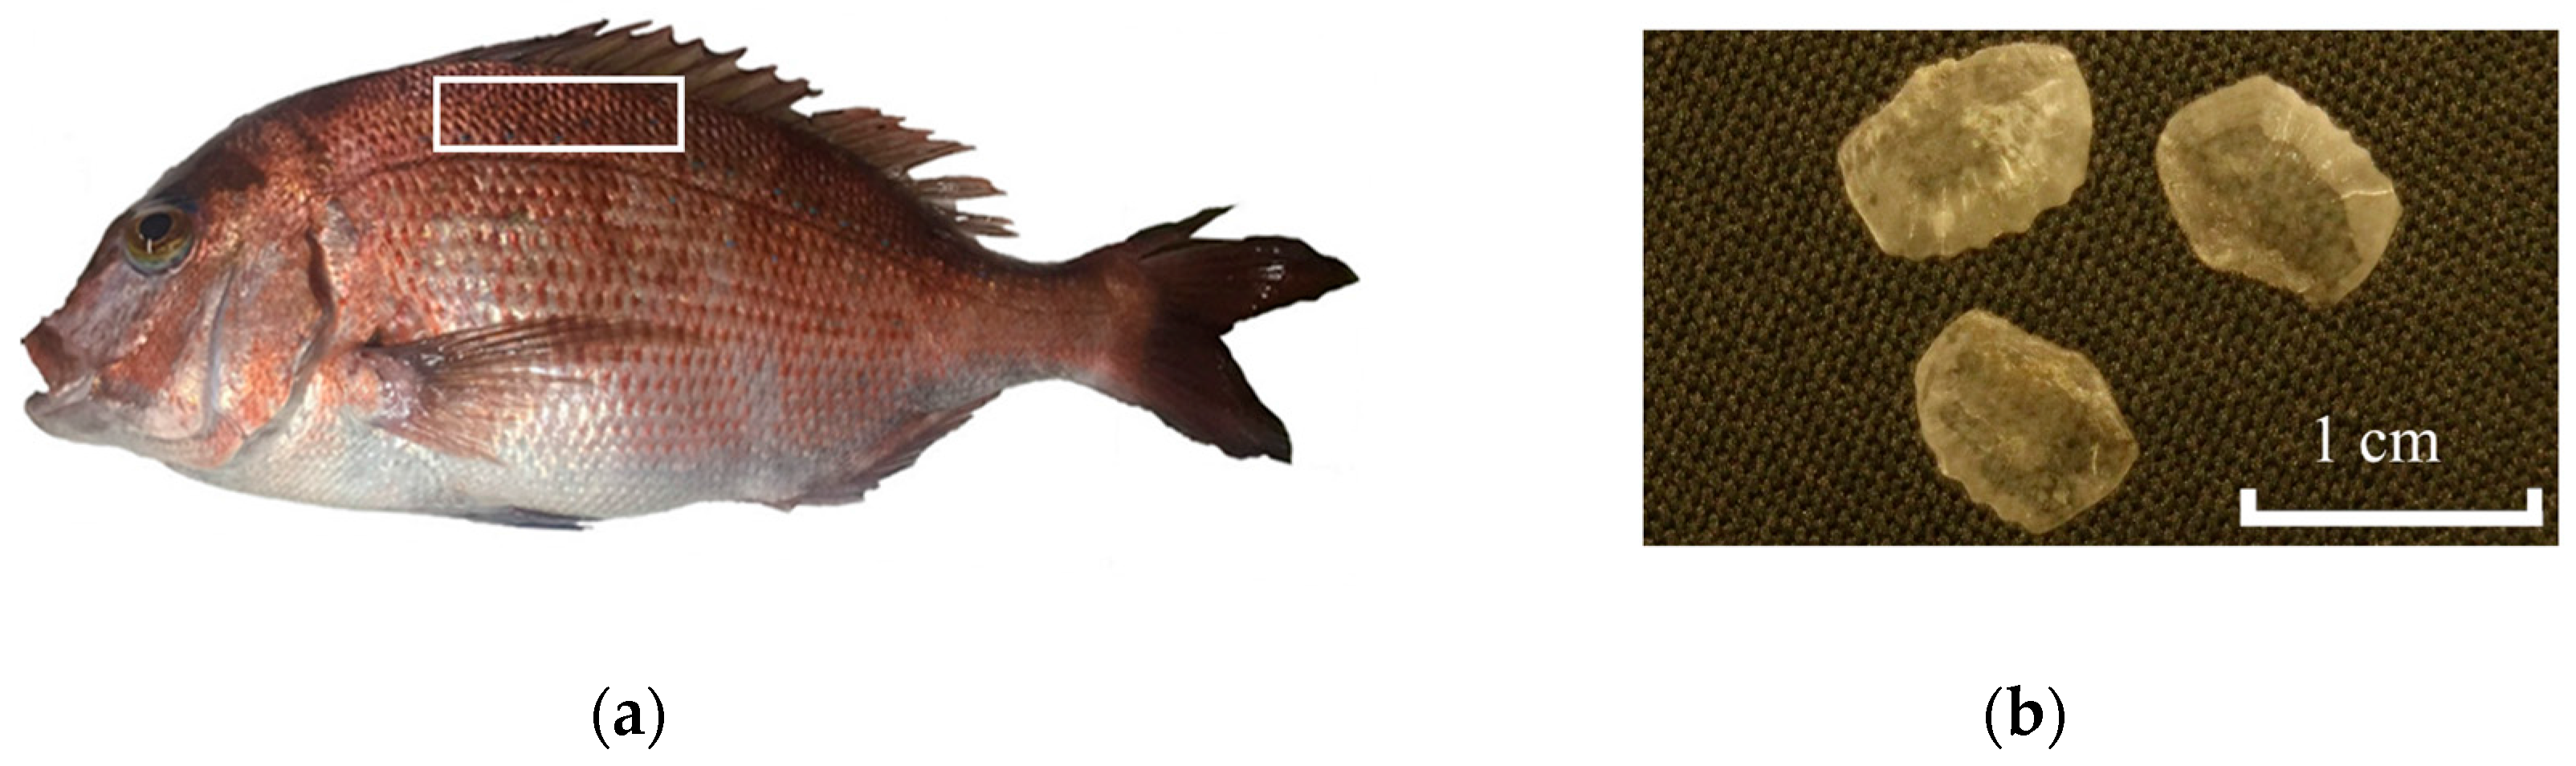
Figure 2.
Changes in K value of red sea bream during storage at 22 ± 2 °C. Values shown are the means of three replicates with standard deviation bars.
Figure 2.
Changes in K value of red sea bream during storage at 22 ± 2 °C. Values shown are the means of three replicates with standard deviation bars.
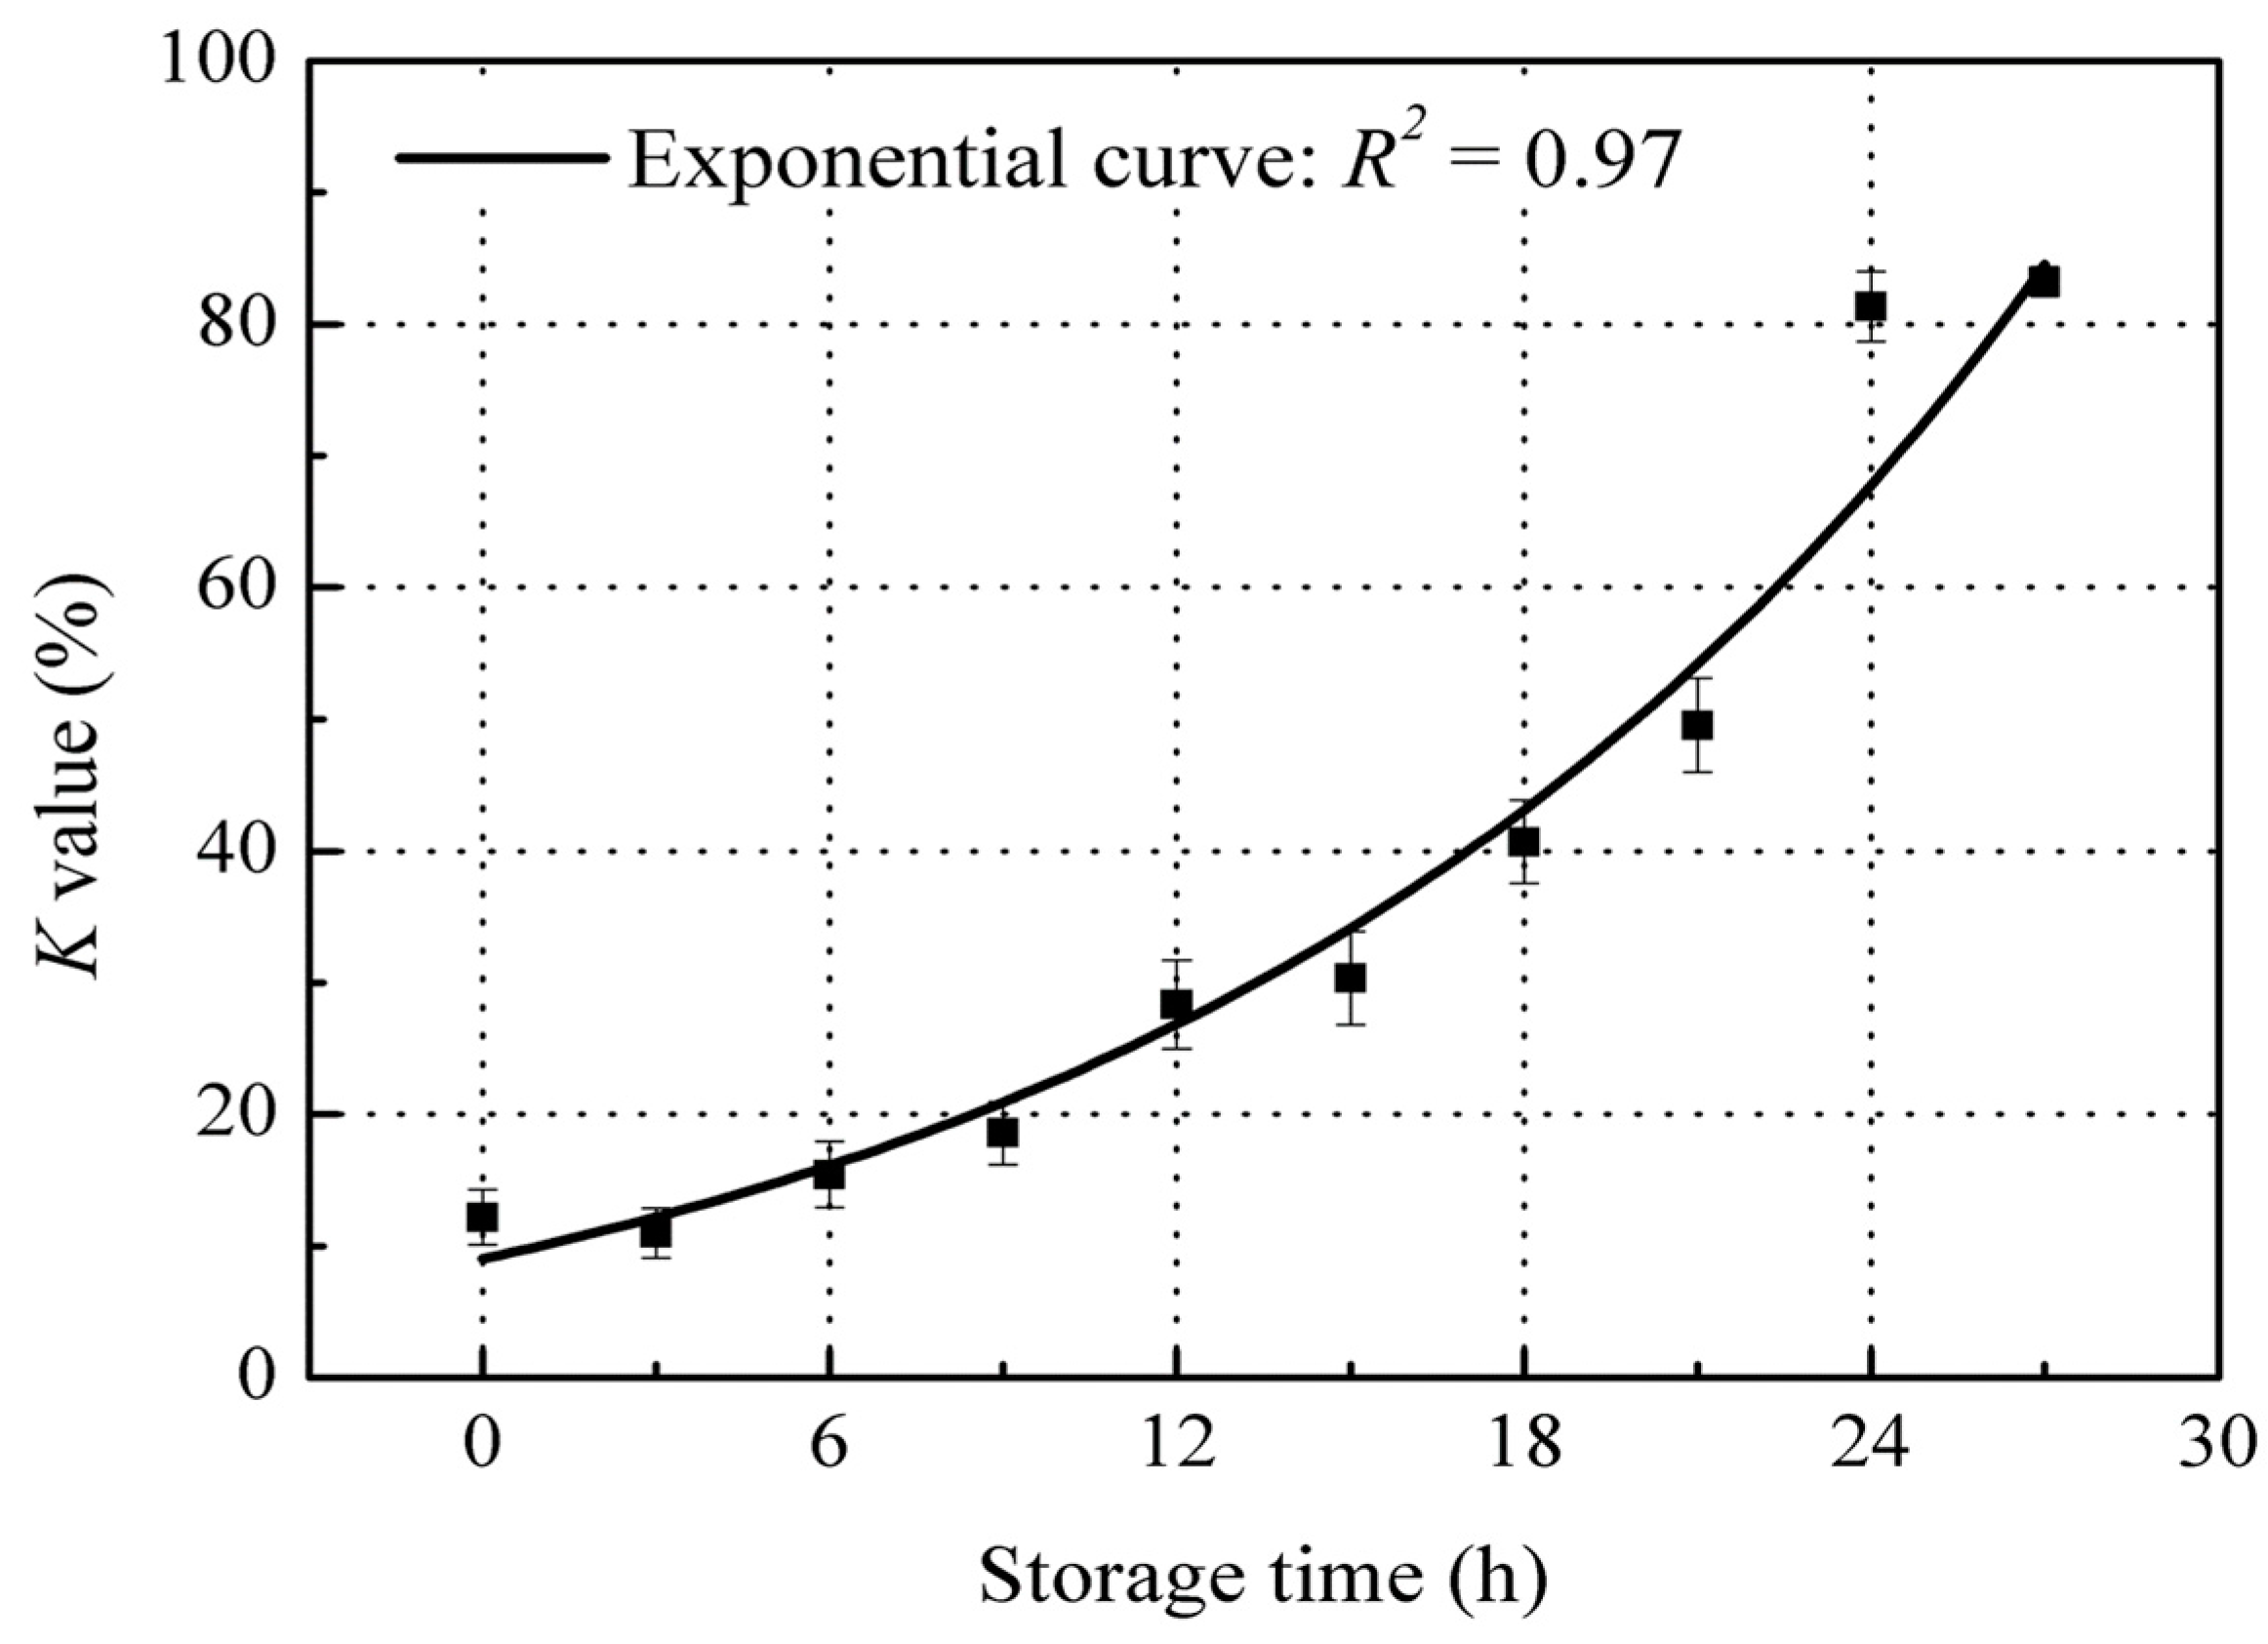
Figure 3.
Typical front-face fluorescence landscape of the red sea bream scale.
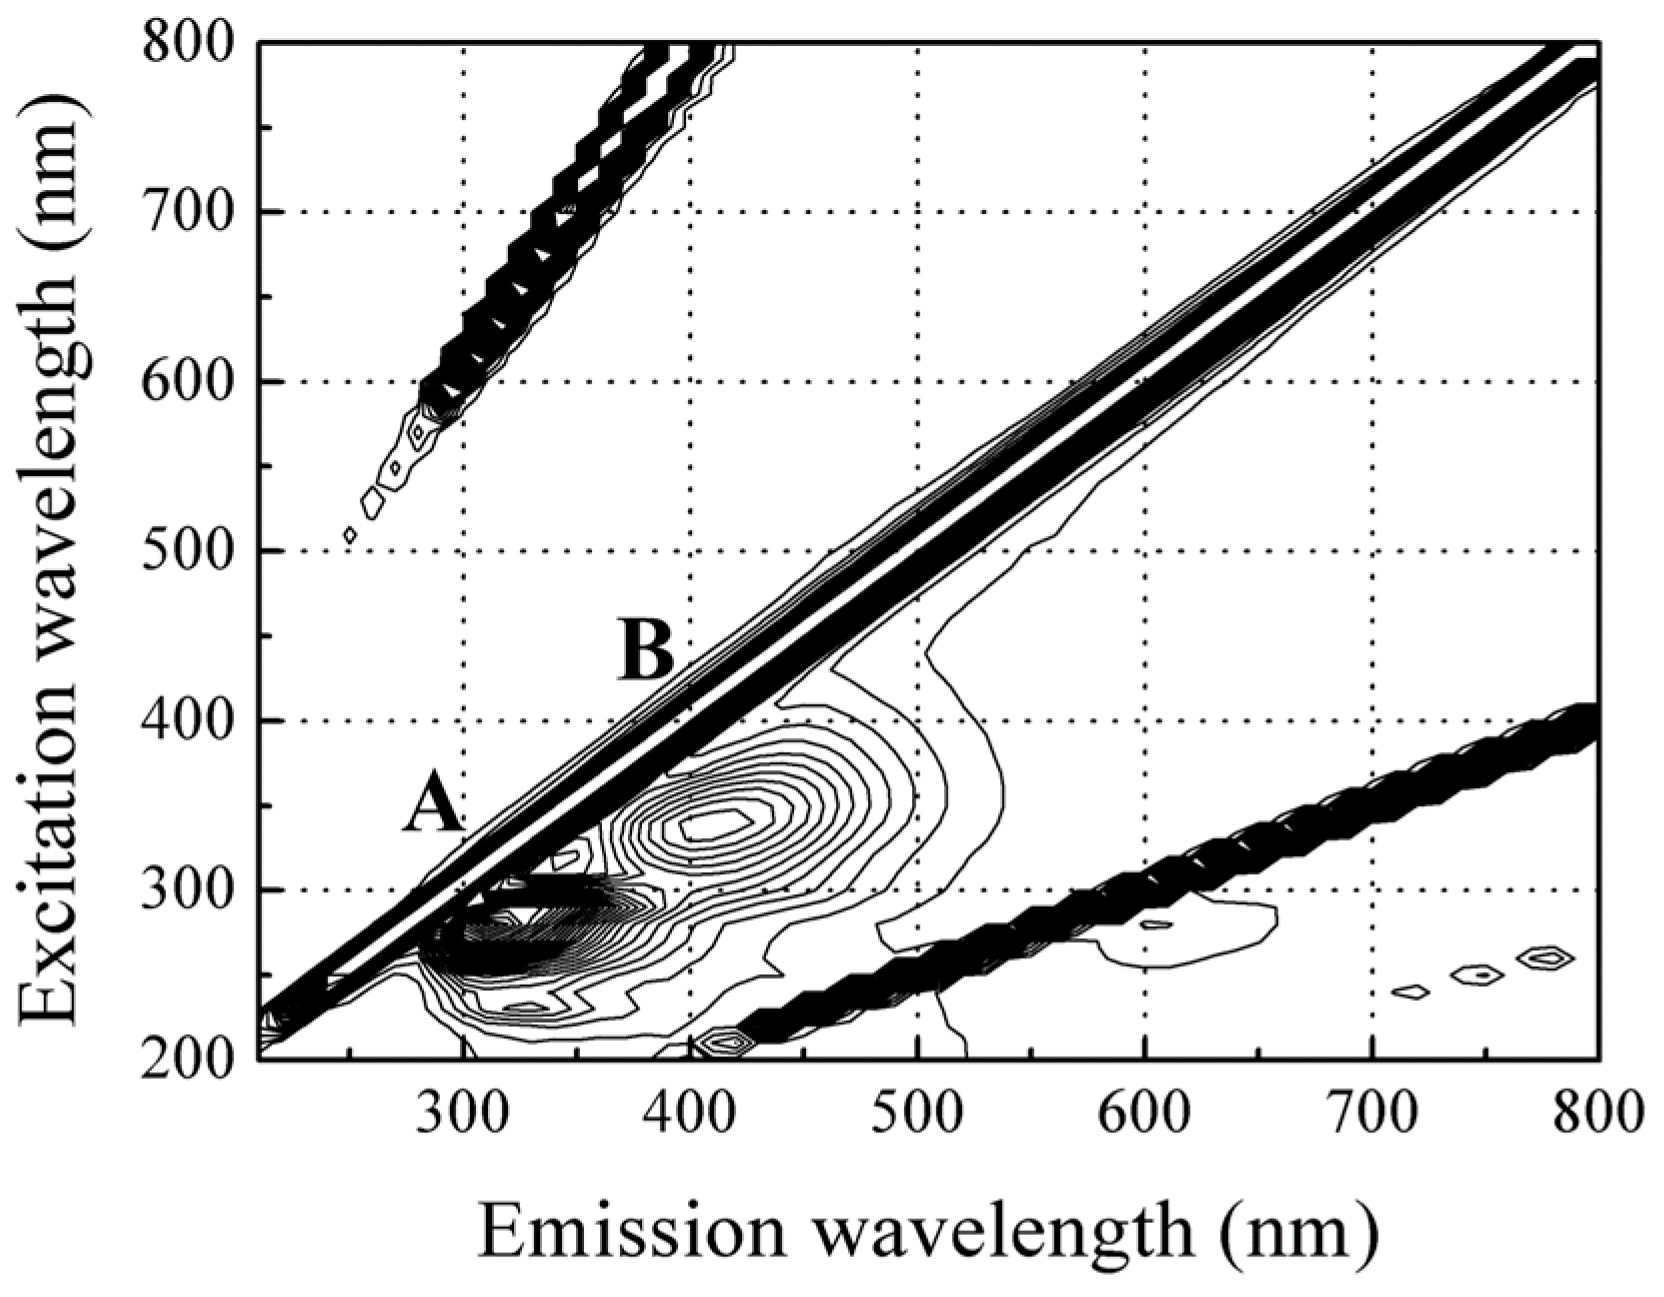
Figure 4.
Fourier Transform Infrared (FTIR) spectra of the red sea bream scale: the upper part is the internal layer, and the lower part is the external layer of the scale.
Figure 4.
Fourier Transform Infrared (FTIR) spectra of the red sea bream scale: the upper part is the internal layer, and the lower part is the external layer of the scale.

Figure 5.
Changes in peak A fluorescence intensity during the storage time. Values shown are the means of 9 replicates with standard deviation bars.
Figure 5.
Changes in peak A fluorescence intensity during the storage time. Values shown are the means of 9 replicates with standard deviation bars.

Figure 6.
Changes in peak B fluorescence intensity during storage. Values shown are the means of 9 replicates with standard deviation bars.
Figure 6.
Changes in peak B fluorescence intensity during storage. Values shown are the means of 9 replicates with standard deviation bars.

Figure 7.
Change in Peak B and A fluorescence intensities with water loss. Values shown are the means of 3 replicates with standard deviation bars.
Figure 7.
Change in Peak B and A fluorescence intensities with water loss. Values shown are the means of 3 replicates with standard deviation bars.
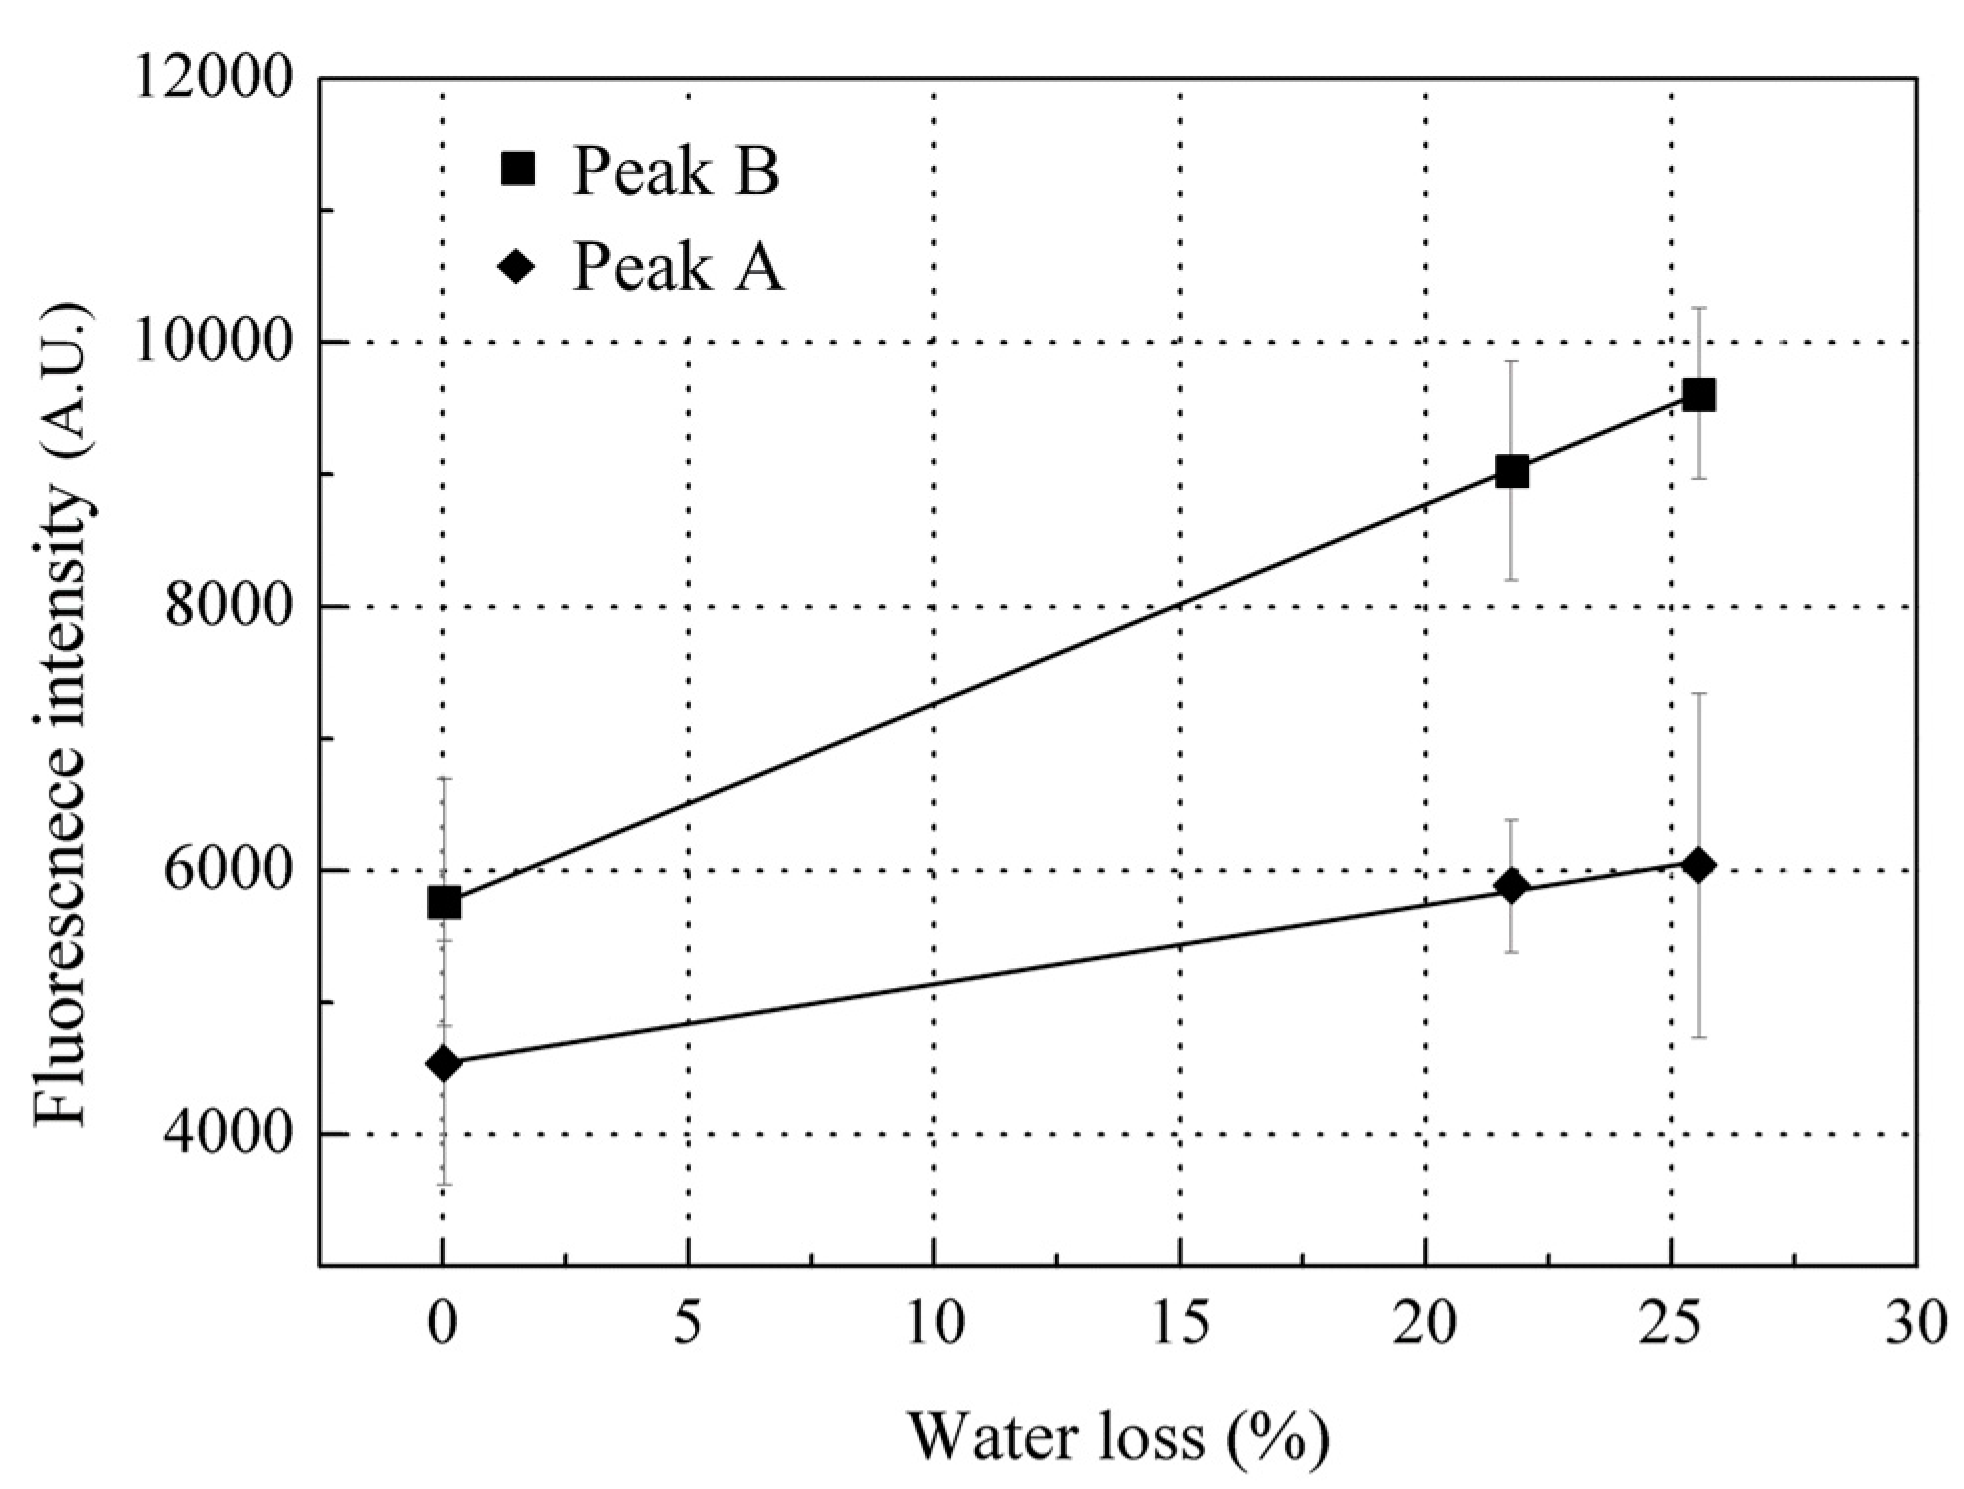
Figure 8.
Scanning electron micrograph (SEM) of the internal (collagen) layer of scales at different storage times.
Figure 8.
Scanning electron micrograph (SEM) of the internal (collagen) layer of scales at different storage times.

Figure 9.
Changes of IB/IA during the storage time. Values shown are the means of 9 replicates with standard deviation bars.
Figure 9.
Changes of IB/IA during the storage time. Values shown are the means of 9 replicates with standard deviation bars.

© 2017 by the authors. Licensee MDPI, Basel, Switzerland. This article is an open access article distributed under the terms and conditions of the Creative Commons Attribution (CC BY) license (http://creativecommons.org/licenses/by/4.0/).
Share and Cite
MDPI and ACS Style
Liao, Q.; Suzuki, T.; Yasushi, K.; Al Riza, D.F.; Kuramoto, M.; Kondo, N. Monitoring Red Sea Bream Scale Fluorescence as a Freshness Indicator. Fishes 2017, 2, 10. https://doi.org/10.3390/fishes2030010
AMA Style
Liao Q, Suzuki T, Yasushi K, Al Riza DF, Kuramoto M, Kondo N. Monitoring Red Sea Bream Scale Fluorescence as a Freshness Indicator. Fishes. 2017; 2(3):10. https://doi.org/10.3390/fishes2030010
Chicago/Turabian StyleLiao, Qiuhong, Tetsuhito Suzuki, Kohno Yasushi, Dimas Firmanda Al Riza, Makoto Kuramoto, and Naoshi Kondo. 2017. "Monitoring Red Sea Bream Scale Fluorescence as a Freshness Indicator" Fishes 2, no. 3: 10. https://doi.org/10.3390/fishes2030010