
Water Oxygen Content Affects Distribution of T and B Lymphocytes in Lymphoid Tissues of Farmed Sea Bass (Dicentrarchus Labrax)

1
Department of Ecological and Biological Sciences, Tuscia University, Viterbo 01100, Italy
2
Department of Biological System, Agrofood and Forestry Innovation, Tuscia University, Viterbo 01100, Italy
3
Department Biology and Evolution, Section of Comparative Anatomy, University of Ferrara, Ferrara 44100, Italy
*
Author to whom correspondence should be addressed.
Fishes 2017, 2(3), 16; https://doi.org/10.3390/fishes2030016
Submission received: 9 August 2017
/
Revised: 3 September 2017
/
Accepted: 11 September 2017
/
Published: 14 September 2017
Abstract
:Intensive aquaculture systems have stimulated proper management in order to limit stressful stocking conditions and environmental impact. This should improve fish wellness and counteract adverse water characteristics such as high concentrations of carbon. The oxygen can be considered a key factor since critical conditions leading to chronic rise of blood catecholamines can depress the number and Oxygen-carrying capacity of erythrocytes. In this research, we evaluated the effects of variation in water oxygen (from 6 ± 1 to 13 ± 1 mg/L) on lymphocytes density in sea bass by using flow cytometry and immunohistochemistry. Gut, gill, and thymus T-cells were significantly enhanced in percentage in hyperoxygenated fish compared with normo-oxygenated group, while Peripheral Blood Leukocytes (PBL), head kidney, and spleen T-cells were not significantly different. Contrarily, in PBL, head kidney and spleen hyper-oxygenation treatment provoked an enhancement of B lymphocyte percentages. The distribution of positive T-cells in hyper-oxygenated fish varied in the organs and followed the relative increments/decrements observed in flow cytometry. This study remarks the sensitivity of sea bass adaptive immunocytes to oxygen concentration, evidenced by the modification of parameters. Sea bass culture under high-flow water recycling and at around 12–13 mg/L oxygen concentrations is therefore suggested to enhance the immune response capacity.
1. Introduction
The European sea bass, Dicentrarchus labrax (L.), is a highly cultured fish species in Mediterranean mariculture [1,2], which had a decisive impulse from the rapid decline of natural fisheries stocks. However, the intensive aquaculture farming can generate problems to fish health such as immuno-depression [3]. Oxygen is a key factor in monitoring for the wellness of fishes under intensive rearing. Hypoxia and hypercapnia, generated during fish maintenance, can influence the adrenal reaction as an “adaptive-syndrome” by raising stress hormones cortisol and catecholamines [4,5,6]. Moreover, it can delay larval development [7] and ultimately could provoke fish death, depressing severely the metabolism of brain and skeletal muscles [8]. Water oxygen levels below 6 mg/L can be stressful for sea bass, while levels below 2.85 mg/L can be lethal for all fishes [9]. Again, the unbalance of blood gas, as it occurs during hypoxia or hyperoxia, can affect the erythrocyte physiology [10] and enhance the blood glucose [11] and acidity [12,13], respectively. Although numerous reports dealt with the physiological role of oxygen in aquaculture, only sparse information is available on the effects of water oxygenation on the fish immune system. The serum content of immunoglobulins was shown to be higher in sea bass reared in hyper-oxygenated water [14]. In the present paper, we used two antibodies produced in our laboratories: (1) DLT15 [15], which reacts with 96% of T lymphocytes population [16], and (2) DLIg3, which reacts with 70% of the B lymphocyte population [14,17]. These antibodies were used as markers to detect the effects of water oxygen variation (from 6 to 13 mg/L) on lymphocyte percentages and their distribution in different organs of the sea bass.
2. Results
2.1. Flow Cytometry
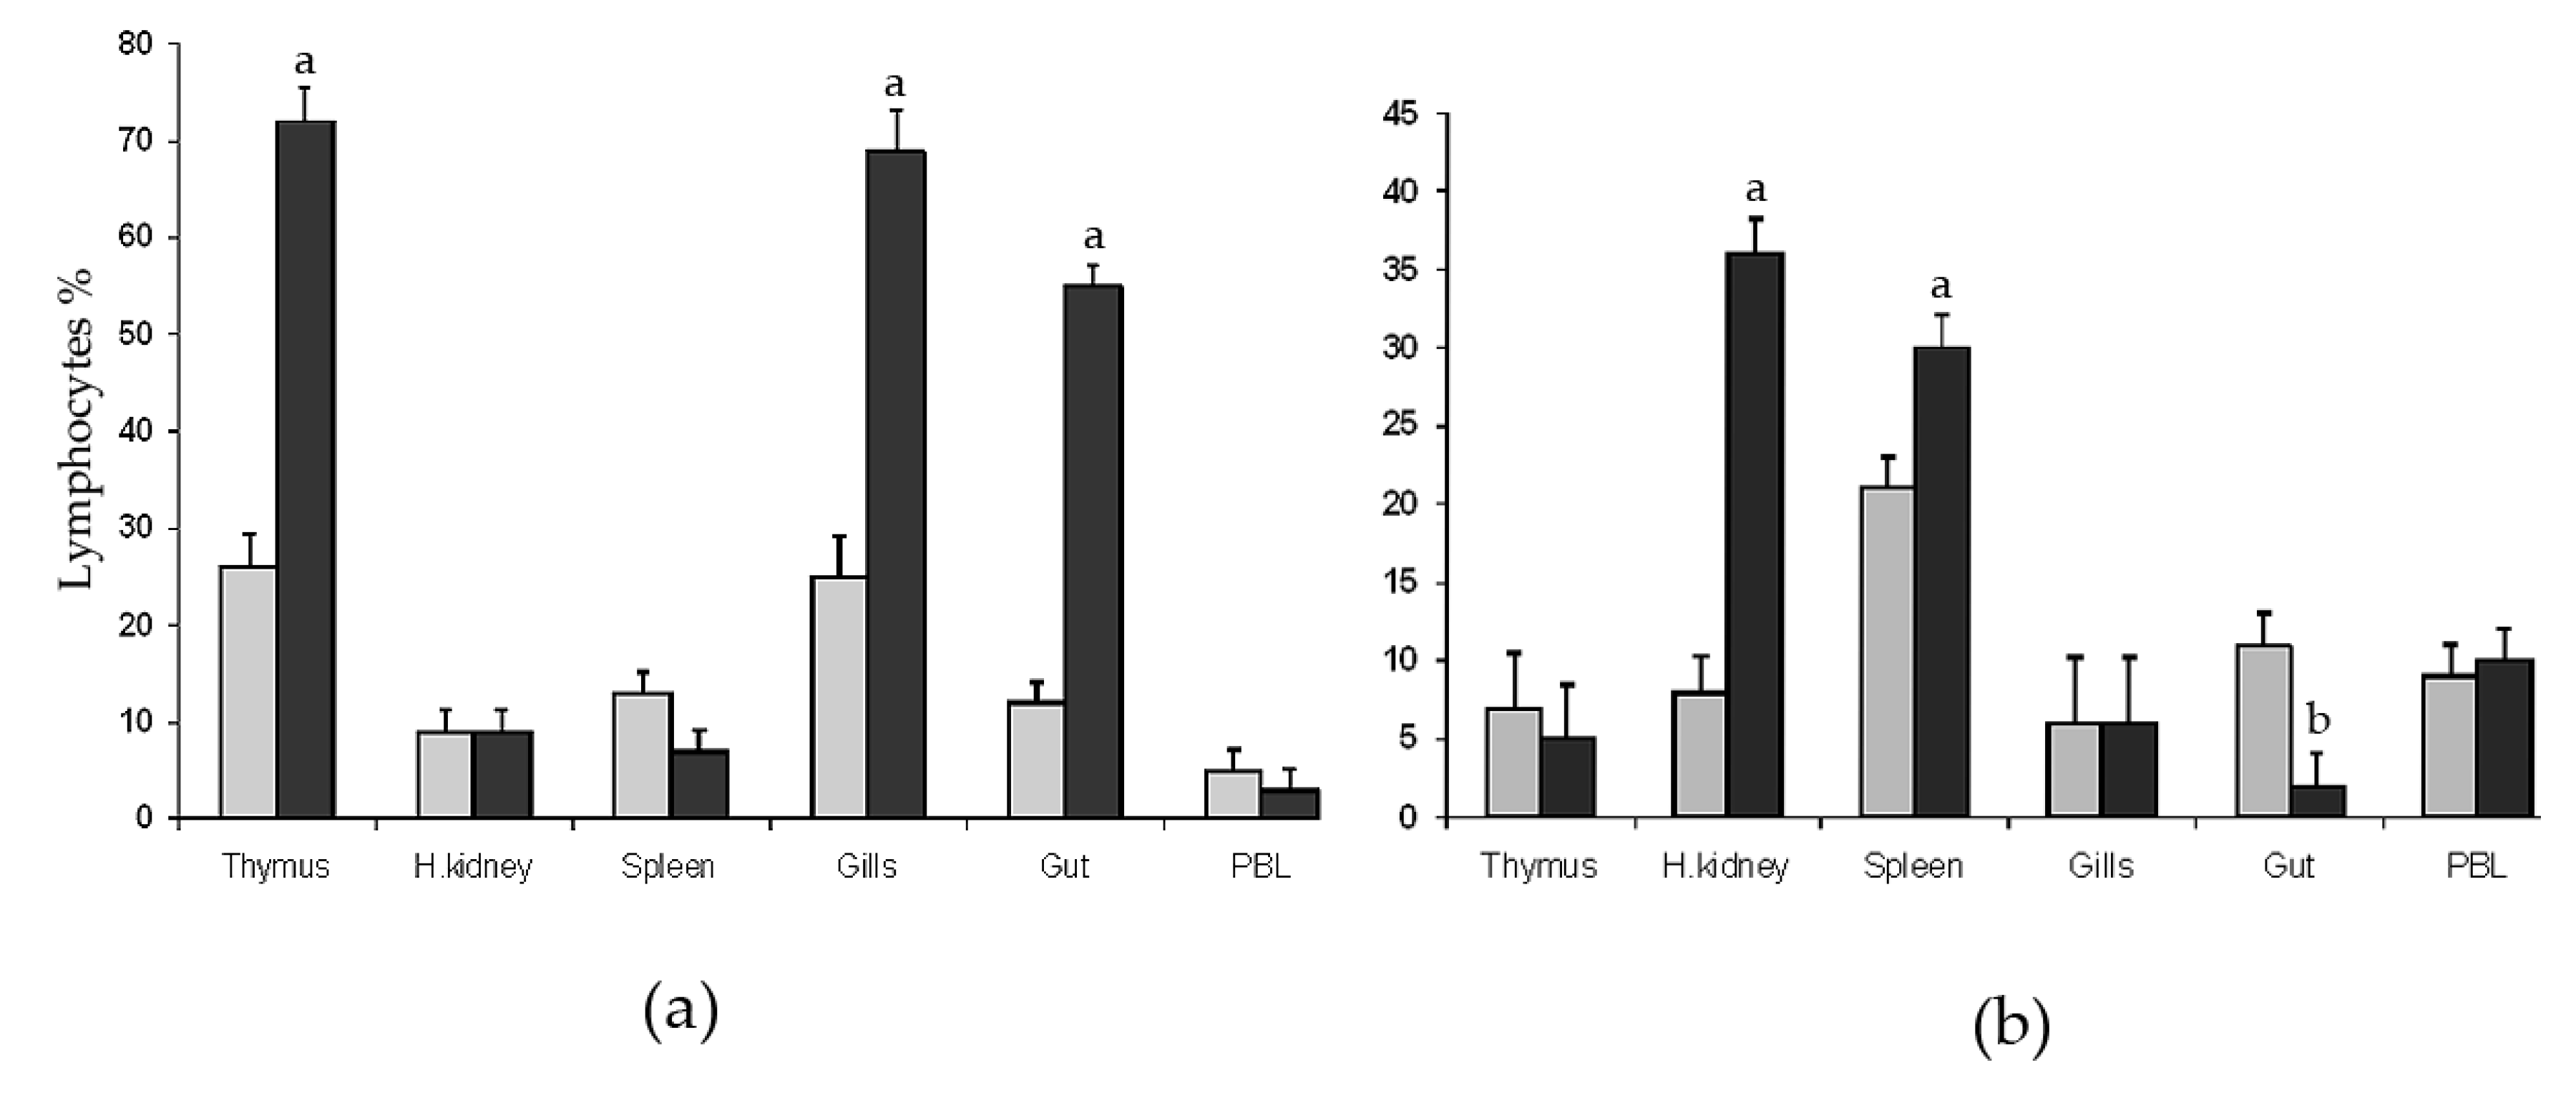
The forward scatter (FSC) and 90° side scatter (SSC) profiles allowed for the selection of the gate for quantitative analysis (not shown). Cells with low side scatter within the gate were considered as lymphoid cells, whereas cells with high side scatter were excluded from calculation because these were mainly non-lymphoid cells as proven by electron microscopy of sorted cells [18]. Flow cytometry analysis of DLT15+ and DLIg3+ cells from thymus, spleen, head kidney, gills, intestine (gut), and Peripheral Blood Leukocytes (PBL) (Figure 1) showed differences in percentages between the group normo-oxygenated (5 ± 1 mg/L, NO) and the group hyper-oxygenated (13 ± 1 mg/L, HO).
The percentages of DLT15+ cells (T lymphocytes) in the thymus, head kidney, spleen, intestine, gills, and PBL of experimental groups are shown in Figure 1a. In both groups, sharp peaks of DLT15+ cells were observed in thymus, gut, and gills compared with spleen, head kidney, and blood. DLT15+ cells were significantly higher in percentage in HO group in thymus, gills, and intestine compared with NO. The percentages of DLT15+ cells in spleen, head kidney, and PBL were comparable between the two groups.
DLIg3+ cells (Ig+ lymphocytes) in thymus, head kidney, spleen, gills, intestine, and PBL are shown in Figure 1b. Higher percentages of DLIg3+ cells were observed in head kidney and spleen of HO compared with NO group (p < 0.001). A slight decrement was observed in the gut in the HO group as compared the NO group. The percentages of Ig+ lymphocytes in thymus, gills, and PBL did not differ significantly between groups.
2.2. Immuno-Histochemistry
Immuno-histochemistry was performed in NO and HO groups using DLT15 and DLIg3 antibodies on tissue sections from thymus, spleen, head kidney, gills, and intestines. No qualitative differences were observed in the histology and localization of the positive cells between groups. However, differences in numbers were detected (Table 1).
In the thymus, the DLT15+ thymocytes localized mainly in the cortical portion of lobuli, while stromal cells did not show any reaction. The mean diameter of the positive cells was 3.4 ± 0.1 µm (range 2 to 5.5 µm; N = 100). DLIg3 antibody stained in the thymus a few lymphoid cells mainly localized in the medullar region, significantly less numerous than T-cells (p < 0.001). In the HO group, a 36% rise in number of DLT15+ cells was seen compared with the NO group, while no differences were revealed regarding DLIg3+ cells.
In the head kidney, DLT15+ cells were isolated or in small groups from 2 to 4 cells (7.5 ± 0.3 µm, range 4.4 to 13 ± m; N = 60) concentrated in the lymphoid areas of inter-tubular tissue. DLIg3 recognized cells widely distributed in the hematopoietic parenchyma (5.7 ± 0.2 µm, range 3.9 to 7.2 µm; N = 200). In HO samples, T- and B-cells did not vary, as opposed to the NO group.
In the spleen, leucopoiesis and erythropoiesis areas are intermingled. In areas prevalently lymphoid, cells positive for DLT15 antibodies (8.1 ± 0.3 µm in diameter, range 2.9 to 11.4 µm; N = 40) were observed isolated or in small groups of 2–4 cells. DLIg3-positive cells (5.8 ± 0.3 µm in diameter, range 3.9 to 9.1 µm; N = 200) were evidenced isolated or in small groups from 2 to 4 cells in poorly developed lymphoid areas, nearby or close to melano-macrophage centers and arteries. A rise of Ig+ cells (around +39%) has been evidenced, whereas T-cells did not show a variation in HO samples compared with the NO group.
The middle portion of intestine was moderately folded and housed free leucocytes (lymphocytes, granulocytes, and macrophages) scattered in the mucosa, with a prevalence of lymphoid cells. Lymphocytes positive for DLT15 antibodies (3.1 ± 0.1 µm in diameter, range 2.7 to 3.9 µm; N = 100) were abundant in the basolateral epithelium and in the lamina propria, while less numerous scattered in the sub-mucosa, around blood vessels, and in muscular layers (very sparse). Sparse DLIg3-positive cells (5.6 ± 0.2 µm in diameter, range 4.2 to 7.5 µm; N = 200) were evidenced in the mucosa, among epithelial cells, and in the lamina propria. Quantitative analysis revealed in both groups the highly significant predominance of T lymphocytes compared with Ig-positive cells (4.2 and 2.9 times more numerous in HO and NO, respectively). A rise of T cells (+75%) was found in the mucosa of HO samples compared with the NO group.
In gills, the positive cells to DLT15 have been isolated and mainly localized in the sub-mucosa, just in correspondence to the lamellae bottom (10.7 ± 0.3 µm in diameter, range 8.4 to 13.2 µm; N = 50). Sparse and isolated DLIg3-positive cells were localized in the blood vessels and sub-mucosa, just in correspondence to the lamellae bottom (6.9 ± 0.2 µm in diameter, range 5.6 to 9.3 µm; N = 100). Similar to those observed in the intestinal tract, the quantitative analysis revealed in both groups the majority of percentage of T-cells (p < 0.001) compared with Ig-positive cells. In the HO group of fish, the quantitative analysis revealed a density increase of T- (+92%, p < 0.001) and B- (+237%, p < 0.05) cells with respect to the NO group.
3. Discussion
Oxygen in its molecular state O2 is essential for many metabolic processes that are vital to aerobic life, and aerobic organisms cannot exist without oxygen, which nevertheless is inherently dangerous to their lives [19]. The oxygen concentration is one of the most important limiting factors in the intensive culture of fish [20]. Low concentrations of oxygen have revealed severe physiological problems in sea bass (Dicentranchus labrax) [21]. Aquaculture facilities produce fish at high densities, and, since oxygen consumption is way higher than normal, the oxygen provided to the system may not be enough to supply all of the fish with oxygen, so they will start suffering from hypoxia. If this is left unchanged high mortalities will naturally ensue [21,22,23]. Conversely, a high concentration of water oxygen, when fish are cultured at high density (60 kg/m3), can potentially enhance the immunological performance as suggested by the higher serum Ig content [14]. In agreement with Scapigliati et al. [14], in the present study, we have observed in fish reared with 13 mg/L of oxygen, an increment in B lymphocyte percentages in PBL, head kidney, and spleen. The latter organs/tissue are normally more enriched with B-cells than T-cells [17,24]. In particular, the head kidney and spleen represent the main organs where are placed the lymphopoietic foci of B-cells [16,24]. Contrarily, in our analysis by flow cytometry and immuno-histochemistry, the B-cells seemed to diminish in thymus (just a trend, not statistically significant) and gut (p < 0.05) in the HO group as compared to the NO group. Recently, a study in aquaculture has revealed that the oxygen treatment of ≥70% of saturation improves the quantity and the performance of the oxygen-releasing of red blood cells; however, contrary to our findings, no histological differences were revealed in lymphocyte number [25]. In the present research, we evidenced both in flow cytometry analysis and immuno-histochemistry, a significant increment of T-cells in the organs normally enriched of lymphocytes of type “T” [18], such as thymus, gut, and gills. In particular, DLT15+ cells were strongly distributed in the cortical (outer) portion of thymic lobuli, whereas in gut and gills they are localized mainly in the sub-epithelium and sparsely intra-mucosa. Previous data defined the distribution T lymphocytes in sea bass intestinal mucosa using the combination of DLT15 and anti-sense RNA probe for the TcRβ chain [16]. The study evidenced numerous T-cells in the sub-mucosa with a positive gradient from the middle to the posterior tract. Moreover, TcRβ+ cells seemed to be distributed mainly in the middle tract [16] in small positive foci. In head kidney and spleen, the DLT15+ cells were distributed in lymphopoietic foci close to melano-macrophage centers. It was observed a relevant increment of density in hyperoxygenated fish compared with the NO group. Similar observations occurred previously in normal oxygenated sea bass by immune-histochemistry and flow cytometry [18,26,27]. Taking together the data of distribution of lymphocytes evidenced that hyperoxia treatment (oxygenation of 13 mg/L) induces selective increments of T- and B-cells among hematopoietic tissues.
It is generally known that oxygen treatment can determine a secretion of steroids [28]. The concentration of cortisol is known to increase in hypoxya situations, but there is some indication that physiological parameters also change in extensive hyperoxygenation [6]. In leukocytes isolated from the head kidney and the spleen of fish, the receptor numbers for cortisol increase in number following chronic stress or in vivo cortisol treatment [29,30,31] and the redistribution of leukocytes, caused by the cortisol treatment, was suggested to have contributed to this effect. Estrogens affect different stages of B-cell development and modify the humoral response [27], while estrogen modulators have been found to regulate B development and function [28]. Conversely, effects of glucocorticoids in the immune system of fish include the reduction of antibody titers [29] and leukocyte redistribution [30]. Cortisol, as one of the most responsible of physiological changement, has widespread effects on the osmolar regulation of cellular energy metabolism, the general activation of stress-related genes, as well as the immune system [31,32,33].
In conclusion, this study remarks the sensitivity of sea bass to water oxygen concentration as evidenced by the treatment with 12–13 mg/L of oxygen. This oxygen concentration has induced a modification of the distribution of T- and B-cells, which undergo an increment in specific myelopoietic sites, possibly with an improved immune response performance.
4. Materials and Methods
4.1. Fish Experimental Groups
Sea bass 12 months old (400 gr) were bred and reared in seawater inland aquaculture farms, which have their own hatchery and permanent brood-stock (“La Rosa”, Orbetello, Italy). Experiments were done during the spring and during the autumn, and environmental parameters were maintained throughout the trial as reported below. Fishes (N = 50 per group at 60 kg/m3, Temperature: 22 ± 2) were kept in running filtered sea water containing 6–7 mg/L oxygen, a standard concentration for sea bass aquaculture (NO group = normo-oxygenated), or in filtered seawater containing 11–13 mg/L oxygen (HO group = hyper-oxygenated), through the addition of liquid oxygen. Both groups were maintained in the experimental condition for 25 days.
The experimental procedures were done in accordance to ethical procedures and the permission for this work was provided by the Italian local authorities (Italian Minister Patent for animal farm N.103/2004)
4.2. Cell Suspensions
Cell suspensions from thymus, head kidney, spleen, intestine (middle segment 2-cm long, taken 3 cm caudally to opening of bile duct), gills (portion of mucosae adherent to the branchial arch, cromphensive of primary and secondary lamellae), and blood were prepared as previously described [17]. Briefly, cells were obtained by teasing the tissues in HBSS (Hank’s Balanced Salt Solution, Sigma) and were layered over a discontinuous gradient of Percoll (Pharmacia AB, Uppsala, Sweden) diluted in iso-osmolar HBSS to yield densities of 1.020 and 1.070 gr mL−1. After centrifugation (30 min at 840 g) at 4 °C, cells layered between these densities were collected and washed twice (10 min at 680 g) at 4 °C. The pellet (the leucocyte-enriched fraction) was re-suspended in HBSS containing 1% BSA and 0.1% sodium azide. Peripheral blood leucocytes (PBL) were prepared from heparinized blood (5 mL) collected by the caudal vein, diluted 1:1 in HBSS, and centrifuged (15 min at 100 g) at 4 °C. The buffy coat was collected, resuspended in HBSS, and layered on Percoll as described above. The cells were kept alive in melting ice during all sample preparation steps prior to analysis by flow cytometry.
4.3. Indirect Immunofluorescence and Flow Cytometry
The cell suspensions (107 cells mL−1) from the different tissues were incubated in 250 µL of undiluted DLT15 or DLIg3 hybrydoma culture supernatants for 45 min at 4 °C. The production and characterization of monoclonal antibodies (mAbs) DLT15 and DLIg3 have been previously described [14]. Labeled cells were then washed (10 min at 680 g, at 4 °C) and incubated for 30 min with Fluorescein isothiocyanate (FITC)-conjugated rabbit anti-mouse Ig serum (Dako, Denmark) diluted 1:100 in HBSS. Ten thousand cells mL−1 were measured with a flow cytometer (FACScalibur, Becton Dickinson Immuno-cytometry System, Mountain View, CA, USA). The percentage of positive cells was calculated subtracting results obtained in negative controls (primary antibody omitted). Numerical results were expressed as the mean ± SD. Homogeneity of variances was tested before data processing, and numerical results were analyzed by a Student’s t-test for unpaired data.
4.4. Immuno-Histochemistry
Immuno-histochemistry was performed as previously described [25]. Tissues were sampled from thymus, head kidney, spleen, intestine (middle segment 2-cm long, taken 3 cm caudally to opening of bile duct), and gills (portion of mucosae adherent to the gill arch, comprehensive of primary and secondary lamellae) and were fixed in Bouin’s fluid for 7 h at 4 °C, dehydrated in graded alcohols at 4 °C, cleared in toluene and embedded in paraffin wax. Serial transverse sections of a 7 µm thickness were dried at 37 °C and placed on glycerin/albumin-coated slides. Dewaxed sections were rehydrated and washed in PBS (0.1 M, pH 7.3), followed by 20 min of incubation with PBS containing 0.5% hydrogen peroxide to quench endogenous peroxidase activity. The mAbs DLT15 and DLIg3 were used undiluted or diluted (1:10 to 1:200) in Phosphate Buffered Solution (PBS) containing 5% normal horse serum and 0.1% sodium azide and incubated for 18 h at room temperature in a humid chamber. Normal mouse serum (1:10) or the myeloma culture medium substituted for primary antibody in control sections. Following rinses in PBS, sections were incubated for 1 h at 25 °C with biotinylated horse anti-mouse IgG serum (Vector Labs., Burlingame, CA, USA) diluted 1:1000 with PBS containing 0.1% sodium azide and 1% bovine serum albumin, followed by incubation for 1 h with avidin-biotinylated peroxidase complex (ABC, Vectastain® Elite, Vector Labs., Burlingame, CA, USA) with the avidin and biotinylated horseradish peroxidase solutions diluted 1:2000 in Tris-buffered saline (TBS: 0.05 M, pH 7.6). Following rinses in TBS, sections were incubated in 0.05 M Tris buffer containing 0.4% nickel ammonium sulfate, 0.02% diaminobenzidine and 0.015% hydrogen peroxide. After rinsing in Tris buffer, sections were dehydrated, mounted, and examined under bright-field illumination.
In each animal, five non-consecutive sections of each sample were immuno-stained with DLT15 or DLIg3. Counts of immuno-reactive cells (nucleated only) were performed with a computer-assisted image analysis system (Axioscope/KS300, Zeiss, Germany) by an observer unaware of treatments. Estimates of the number of immuno-reactive cells present in the various tissues were then calculated by averaging the cell numbers from 8 to 12 animals per group, and expressed as the mean ± SD. Cell measurements were obtained from three animals per group and pooled. Homogeneity of variances was tested before data processing and numerical results were analyzed by a Student’s t-test for unpaired data.
Acknowledgments
This research was partially supported by funds of Italian Ministry of Agricultural, food and Forestall Politics, contract N. 4C047. We are indebted to Sig. Brasola, of the fish farm “la Rosa”, Orbetello (GR)-Italy, for generously providing experimental fishes.
Author Contributions
Nicla Romano was responsible for flow cytometry analysis, coordinated the experiments, and wrote the manuscript; Luigi Abelli was responsible for the immuno-histochemistry and analyzed the data; Giuseppe Scapigliati contributed to the experimental procedure and provided the monoclonal antibodies.
Conflicts of Interest
The authors declare no conflict of interest.
References
- Nehr, O.; Blancheton, I.P.; Alliot, E. Development of an intensive culture system for sea bass (Dicentrarchus labrax) larvae in sea enclosures. Aquaculture 1996, 143, 43–58. [Google Scholar] [CrossRef]
- Scapigliati, G.; Romano, N.; Buonocore, F.; Picchietti, S.; Baldassini, M.R.; Prugnoli, D.; Galice, A.; Meloni, S.; Secombes, C.J.; Mazzini, M.; et al. The immune system of sea bass, Dicentrarchus labrax, reared in aquaculture. Dev. Comp. Immunol. 2002, 26, 151–160. [Google Scholar] [CrossRef]
- Faggio, C.; Piccione, G.; Marafioti, S.; Arfuso, F.; Trischitta, F.; Fortino, G.; Fazio, F. Monthly variations of haematological parameters of Sparus aurata and Dicentrarchus labrax reared in Mediterranean land off-shore tanks. Cah. Biol. Mar. 2014, 55, 437–443. [Google Scholar]
- Hughes, G.M.; Kikuchi, Y.; Barrington, J. Physiological salines and the mechanical proprieties of trout red blood cells. J. Fish Biol. 1986, 29, 393–402. [Google Scholar] [CrossRef]
- Wells, R.M.G.; Weber, R.E. The spleen in hypoxic and exercised rainbow trout. J. Exp. Biol. 1990, 150, 461–466. [Google Scholar]
- Sørensen, B.; Weber, R.E. Effect of oxygenation and the stress hormones adrenaline and cortisol on the viscosity of blood from the trout Oncorhyncus mykiss. J. Exp. Biol. 1995, 198, 953–959. [Google Scholar]
- Shang, E.H.; Wu, R.S. Aquatic hypoxia is a teratogen and affects fish embryonic development. Environ. Sci. Technol. 2004, 38, 4763–4767. [Google Scholar] [CrossRef] [PubMed]
- Van Raaij, M.T.M.; Bakker, E.; Nieveen, M.C.; Zirkzee, H.; van den Thillart, G.E. Energy status and free fatty acid patterns in tissues of common carp (Cyprinus carpio, L.) and rainbow trout (Oncorhynchus mykiss, L) during severe oxygen restriction. Comp. Biochem. Physiol. 1994, 109, 755–767. [Google Scholar] [CrossRef]
- Claireaux, G.; Lagardeáre, J.P. Influence of temperature, oxygen and salinity on the metabolism of the European sea bass. J. Sea Res. 1999, 42, 157–168. [Google Scholar] [CrossRef]
- Caldwell, C.A.; Hinshaw, J. Physiological and haematological response in rainbow trout subjected to supplemental dissolved oxygen in fish culture. Aquaculture 1994, 126, 183–193. [Google Scholar] [CrossRef]
- Smith, G.L.; Hattingh, J. The effect of respiratory stress on carp haemoglobin. Comp. Biochem. Physiol. 1978, 59, 369–374. [Google Scholar] [CrossRef]
- Wood, C.M. Branchial ion and acid base transfer in freshwater teleost fish: Environmental hyperoxia as a probe. Physiol. Zool. 1991, 64, 68–102. [Google Scholar] [CrossRef]
- Soncini, R.; Glass, M.L. The effects of temperature and hydroxia on arterial PO2 and acid-base status in Piaractus mesopotamicus. J. Fish Biol. 1997, 51, 225–233. [Google Scholar]
- Scapigliati, G.; Scalia, D.; Marras, A.; Meloni, S.; Mazzini, M. Immunoglobulin levels in sea bass Dicentrarchus labrax (L.) in relation to age, season and water oxygenation. Aquaculture 1999, 174, 207–212. [Google Scholar] [CrossRef]
- Scapigliati, G.; Romano, N.; Abelli, L. Monoclonal antibodies in teleost fish immunology: Identification, ontogeny and activity of T- and B-lymphocytes. Aquaculture 1999, 172, 3–28. [Google Scholar] [CrossRef]
- Romano, N.; Caccia, E.; Piergentili, R.; Rossi, F.; Ficca, A.G.; Ceccariglia, S.; Mastrolia, L. Antigen-dependent T lymphocytes (TcR β) are primarily differentiated in the thymus rather than in other lymphoid tissues in sea bass (Dicentrarchus Labrax, L.). Fish Shellfish Immunol. 2011, 30, 773–782. [Google Scholar] [CrossRef] [PubMed]
- Scapigliati, G.; Meloni, S.; Buonocore, F.; Bossù, P.; Prugnoli, D.; Secombes, C.J. Immunopurification of B lymphocytes from sea bass Dicentrarchus labrax (L.). Mar. Biotechnol. 2003, 5, 214–221. [Google Scholar] [CrossRef] [PubMed]
- Romano, N.; Abelli, L.; Mastrolia, L.; Scapigliati, G. Immunocytochemical detection and cytomorphology of lymphocyte subpopulations in a teleost fish Dicentrarchus labrax (L.). Cell Tissue Res. 1997, 289, 163–171. [Google Scholar] [CrossRef] [PubMed]
- EL-Khaldi, A.T.F. Effect of different stress factors on some physiological parameters of Nile tilapia (Oreochromis niloticus). Saudi J. Biol. Sci. 2010, 17, 241–246. [Google Scholar] [CrossRef] [PubMed]
- Dalla Via, G.J.; Villani, P.; Gasteiger, E.; Niederstätter, H. Oxygen consumption in sea bass fingerling Dicentrarchus labrax exposed to acute salinity and temperature changes: Metabolic basis for maximum stocking density estimations. Aquaculture 1998, 169, 303–313. [Google Scholar] [CrossRef]
- Bergheim, A.; Gausen, M.; Næss, A.; Hølland, P.M.; Krogedal, P.; Crampton, V. A newly developed oxygen injection system for cage farms. Aquac. Eng. 2006, 34, 40–46. [Google Scholar] [CrossRef]
- Bunch, E.C.; Bejerano, I. The effects of environmental factors on the susceptibility of hybrid tilapia Oreochromis niloticus × Oreochromis aureus to Stertococcosis. Isr. J. Aquac. 1997, 49, 67–76. [Google Scholar]
- Fazio, F.; Marafioti, S.; Filiciotto, F.; Buscaino, G.; Panzera, M.; Faggio, C. Blood Hemogram Profiles of Farmed Onshore and Offshore Gilthead Sea Bream (Sparus aurata) from Sicily, Italy. Turk. J. Fish. Aquat. Sci. 2013, 13, 415–422. [Google Scholar] [CrossRef]
- Esteban, M.A.; Meseguer, J.; Ayala, A.G.; Agulleiro, B. Erythropoiesis and thrombopoiesis in the head-kidney of the sea bass (Dicentrarchus labrax L.): An ultrastructural study. Arch. Histol. Cytol. 1989, 52, 407–419. [Google Scholar] [CrossRef] [PubMed]
- Berillis, P.; Mente, E.; Nikouli, E.; Makridis, P.; Grundvig, H.; Bergheim, A.; Gausen, M. Improving aeration for efficient oxygenation in sea bass sea cages. Blood, brain and gill histology. Open Life Sci. 2016, 11, 270–279. [Google Scholar] [CrossRef]
- Romano, N.; Rossi, F.; Caccia, E.; Abelli, L.; Piergentili, R.; Mastrolia, L.; Randelli, E.; Buonocore, F. Majority of TcRβ+ T-lymphocytes located in thymus and midgut of the bony fish Dicentrarchus labrax (L.). Cell Tissue Res. 2007, 329, 479–489. [Google Scholar] [CrossRef] [PubMed] [Green Version]
- Abelli, L.; Pichietti, S.; Romano, N.; Mastrolia, L.; Scapigliati, G. Immunocytochemical detection of thymocyte antigenic determinant in developing lymphoid organs of sea bass, Dicentrarchus labrax L. Fish Shellfish Immunol. 1996, 6, 493–509. [Google Scholar] [CrossRef]
- Khan, D.; Ansar Ahmed, S. The immune system is a natural target for estrogen action: Opposing effects of estrogen in two prototypical autoimmune diseases. Front. Immunol. 2015, 6, 635–639. [Google Scholar] [CrossRef] [PubMed]
- Cabas, I.; Liarte, S.; García-Alcázar, A.; Meseguer, J.; Mulero, V.; Garciía-Ayala, A. 17α-ethynylestradiol alters the immune response of the teleost gilthead seabream (Sparus aurata L.) both in vivo and in vitro. Dev. Comp. Immunol. 2012, 36, 547–556. [Google Scholar] [CrossRef] [PubMed]
- Wechsler, S.J.; McAllister, P.E.; Hetrick, F.M.; Anderson, D.P. Effect of exogenous corticosteroids on circulating virus and neutralizing antibodies in striped bass (Morone saxalis) infected with infectious pancreatic necrosis virus. Vet. Immunol. Immunopathol. 1986, 12, 305–311. [Google Scholar] [CrossRef]
- Maule, A.G.; Schreck, C.B. Glucocorticoids receptors in leukocytes and gill of juvenile Coho salmon (Oncorhynchus kisutch). Gen. Comp. Endocrinol. 1990, 77, 448–455. [Google Scholar] [CrossRef]
- Wendelaar Bonga, S.E. The stress response in fish. Physiol. Rev. 1997, 77, 591–625. [Google Scholar] [PubMed]
- Weyts, F.A.A.; Verburg-van Kemenade, B.M.L.; Flik, G. Characterisation of Glucocorticoid Receptors in Peripheral Blood Leukocytes of Carp, Cyprinus carpio L. Gen. Comp. Endocrinol. 1998, 111, 1–8. [Google Scholar] [CrossRef] [PubMed]
Figure 1.
Flow cytometry analysis of (a) T-cells (DLT15+) and (b) B-cells (DLIg3+) in different tissues (thymus, head kidney, spleen, gills, gut, and peripheral blood) of sea bass specimens exposed to two different levels of water oxygenation: 6 ± 1 mg L−1 (sub-optimal; light grey columns) and 13 ± 1 mg L−1 (hyper-oxygenated; black columns). Significantly different from the normal oxygenated group a p < 0.01; b p < 0.05.


Table 1.
Immuno-histochemistry results. Cellular density (N cells/mm2) of DLT15+ and DLIg3+ lymphocytes (T- and B-cells, respectively) in lymphoid tissues of sea bass reared under sub-optimal water oxygen (6 mg/L, NO group) or hyper-oxygenation (13 mg/L, HO group).
Table 1.
Immuno-histochemistry results. Cellular density (N cells/mm2) of DLT15+ and DLIg3+ lymphocytes (T- and B-cells, respectively) in lymphoid tissues of sea bass reared under sub-optimal water oxygen (6 mg/L, NO group) or hyper-oxygenation (13 mg/L, HO group).
| Groups | NO | HO | ||
|---|---|---|---|---|
| DLT15 | DLIg3 | DLT15 | DLIg3 | |
| H. kidney | 675 ± 274 | 480 ± 187 | 316 ± 118 ** | 305 ± 118 * |
| Spleen | 206 ± 159 | 232 ± 112 | 363 ± 260 | 275 ± 55 |
| Gut | 802 ± 431 | 281 ± 158 a | 1401 ± 280 ** | 434 ± 151 b |
| Thymus | 51233 ± 18485 | 6 ± 2.3 | 69477 ± 14745 ** | 15 ± 5 * |
| Gills | 520 ± 70 | 12 ± 5 b | 1178 ± 97 ** | 45 ± 36 b |
Mean values Standard Deviation (SD) of 8–12 specimens per group; significantly different from the NO group ** p > 0.01, * p < 0.05; Significantly different from the number of DLT15+ cells a p > 0.01, b p < 0.001.
© 2017 by the authors. Licensee MDPI, Basel, Switzerland. This article is an open access article distributed under the terms and conditions of the Creative Commons Attribution (CC BY) license (http://creativecommons.org/licenses/by/4.0/).
Share and Cite
MDPI and ACS Style
Romano, N.; Scapigliati, G.; Abelli, L. Water Oxygen Content Affects Distribution of T and B Lymphocytes in Lymphoid Tissues of Farmed Sea Bass (Dicentrarchus Labrax). Fishes 2017, 2, 16. https://doi.org/10.3390/fishes2030016
AMA Style
Romano N, Scapigliati G, Abelli L. Water Oxygen Content Affects Distribution of T and B Lymphocytes in Lymphoid Tissues of Farmed Sea Bass (Dicentrarchus Labrax). Fishes. 2017; 2(3):16. https://doi.org/10.3390/fishes2030016
Chicago/Turabian StyleRomano, Nicla, Giuseppe Scapigliati, and Luigi Abelli. 2017. "Water Oxygen Content Affects Distribution of T and B Lymphocytes in Lymphoid Tissues of Farmed Sea Bass (Dicentrarchus Labrax)" Fishes 2, no. 3: 16. https://doi.org/10.3390/fishes2030016