Effects of Harmful Algal Blooms on Fish: Insights from Prymnesium parvum
by
Morten Bo Søndergaard Svendsen
1,*, 
Nikolaj Reducha Andersen
2,
Per Juel Hansen
1 and
John Fleng Steffensen
1 1
Marine Biological Section, Department of Biology University of Copenhagen, Strandpromenaden 5, 3000 Helsingør, Denmark
2
National Veterinary Institute, Technical University of Denmark, Kemitorvet bld. 202, 2800 Kgs. Lyngby, Denmark
*
Author to whom correspondence should be addressed.
Fishes 2018, 3(1), 11; https://doi.org/10.3390/fishes3010011
Submission received: 29 October 2017
/
Revised: 29 January 2018
/
Accepted: 5 February 2018
/
Published: 14 February 2018
(This article belongs to the Special Issue Aquatic Organisms for Environmental Monitoring)
Abstract
:Blooms of the planktonic alga Prymnesium parvum pose a global threat, causing fish kills worldwide. Early studies on the exposure of fish to P. parvum indicate that toxic effects are related to gill damage. The more strictly defined concept of adverse outcome pathways has been suggested as a replacement for the mode of action in toxicology studies. In this study, rainbow trout (Onchorhyncus mykiss) were exposed to P. parvum. During exposure, oxygen consumption was determined by respirometry, and ventilation and coughing rate were determined via video surveillance. Per breath oxygen consumption was calculated to assess the ventilation effort to obtain a unit of oxygen. A second experiment monitored fish behavior to assess recovery. The results indicated that oxygen consumption initially increased, but on average fell below the standard oxygen consumption at 70% relative exposure. Being a function of ventilation frequency and oxygen consumption, the per breath oxygen consumption decreased throughout exposure. Behavioral results determined that short-term P. parvum exposure subsequently caused the exposed fish to seek flow refuge immediately and to a greater extent than unexposed fish. The adverse outcome pathway of P. parvum on rainbow trout is that P. parvum acts as a gill irritant resulting in non-recoverable respiratory failure.
1. Introduction
Harmful algal blooms (HABs) caused by a variety of planktonic algae are associated with fish kills in nature [1,2,3]. One of the main fish killers is the haptophyte Prymnesium parvum. This species is currently a major problem in Texas (USA) [4,5], but it has caused fish killing blooms worldwide since the first recorded bloom in Danish waters in the 1930s [1,6,7,8]. The specific physiological mechanisms behind the effects of HABs on fish are often lacking [9]. The few studies on the effects of HABs on the physiology of fish that have been completed indicated a respiratory effect [10,11,12]. These studies included the raphidophyte Chattonella marina [10,11,12], and reports on other relevant algal groups are lacking, even though natural blooms of several other HAB species often lead to fish kills. The existing knowledge on the mechanistic effects of P. parvum exposure indicates that an increase in gill permeability is causing sensitivity to subsequent secondary toxicity as the primary mode of action [6,7,8], but other mechanisms of action, such as hemolysis and anti-coagulant properties, have been proposed [13,14,15,16,17]. However, none of these hypotheses have been confirmed by a physiological study of P. parvum on the whole fish. The initial phase of P. parvum toxicity has been reported to be reversible, as damaged gill was observed to be repaired within hours of P. parvum removal [7].
Acute toxicity of different substances to fish has been studied in the context of fish acute toxicity syndrome (FATS), where cardiorespiratory responses of fish were used to distinguish the modes of action of a substance [18,19,20]. The FATS approach determines whether a fish is experiencing gill irritation and damage, and determines the type of the effect, e.g., narcotics, that leads to anesthesia in the fish. However, the FATS method is immensely invasive to the fish, requiring a level of instrumentation [18,19,20] that is time-consuming and a high degree of technical skill. Notably, the level of technical skill influences the physiological measurements [21]. Lastly, depending on the country of residence, FATS is on the borderline of what present animal experimentation ethics committees will allow (e.g., FELASA), such as paralysis while conscious. The methods suggested here are focused on being less intrusive to the fish, potentially allowing the fish to express a whole organism regulatory response to P. parvum exposure. Thus, FATS is a method that is not readily applied to investigate the physiological effects of HAB exposure to fish. These issues complicate the investigation into the mode of action behind the toxicology of HABs for physiologists and toxicologists alike. Some measurements from FATS can be obtained without detrimentally affecting the fish. Initial measurements for separating gill irritants, indicative of coughing and ventilatory decoupling, from other toxicants, where ventilatory volume is theoretically associated with oxygen consumption, can be measured by observing the fish. These cough and ventilation rate measurements [18,19,20], together with total animal oxygen consumption (MO2) [22,23,24], it is hypothesized that determining whether the mode of action of an HAB is caused by gill damage or occlusion, or by something else, is possible.
This study aimed to measure (1) respiration of whole fish using intermittent flow respirometry, (2) ventilation frequency, and (3) loss of equilibrium in rainbow trout as a response to a high cell concentration of P. parvum, strain UTEX-2797.
2. Materials and Methods
2.1. Fish and Husbandry
For the experiments, 12 rainbow trout (Onchorhyncus mykiss) with a mass of 163.1 ± 31.9 g (mean ± standard deviation (SD)) were used. All trout were farmed at the same farm, acquired via a scientific fish supplier (Fishlab, Højbjerg, Denmark). The fish were received in freshwater and acclimated to full strength seawater (32 psu (practical salinity units)) at 10 °C in the fish holding facility at the Marine Biological Section, University of Copenhagen, Denmark. The water facilities at the laboratory are kept at 10 °C, where a steady supply of filtered and otherwise clean seawater is maintained with little effort at this temperature. The temperature is well within the tolerance of both P. parvum and rainbow trout.
2.2. Respirometry
Mass-specific oxygen consumption (mgO2 kg−1 h−1) (MO2) was determined by intermittent flow respirometry [24,25], using one respirometer with a total water volume of 1.51 L. The pump control scheme used for intermittently closing the fish chamber involved flush/wait/measure periods (240:60:300 s) that were controlled using AquaResp (v. 2, University of Copenhagen, aquaresp.com). For an in-depth description of the method, see Svendsen et al. [25]. Oxygen levels in the respirometer were measured using a Pyroscience Firesting oxygen sensor (Pyroscience GmBH, Aachen, Germany). Oxygen consumption determinations were based on a linear regression of the oxygen level during the closed (measure) part of the pump control scheme, calculated by the following formula:
where MO2 is the oxygen consumption in mg O2 per hour per kilogram of fish (wet) (mgO2·kg−1·h−1), β is the oxygen solubility (mgO2·L−1), and Ve is the effective respirometer volume, which is the water volume with the fish in the respirometer. Assuming that the fish are neutrally buoyant, their volume was equaled to their mass, mf. The term is the slope of the oxygen in the respirometer (% air saturation) based on the linear regression during the measurement period [24,25]. To ensure the overall precision of the measurements, any MO2 determination with a coefficient of determination (r2) below 0.95 were discarded prior to analysis [26]. The standard metabolic rate (SMR), defined as the MO2 of a resting and non-digesting fish [22,27], was determined for all pre-exposure measurements by fitting a double normal distribution to the measurements [28,29], obtaining the average of the lower distribution as a measure of SMR. The other, higher distribution represents a measure of unwanted routine metabolic rate [27] caused by spontaneous activity in MO2 measurements [29], and thus discarded. The fish were allowed to settle in the respirometer overnight (>12 h) to allow the fish to acclimate before exposing the fish to P. parvum (see Section 2.6.). Measurements were recorded from when the fish were introduced to the respirometer (pre-exposure) until the end of exposure. Temperature was maintained at 10 ± 0.1 °C using a programmable temperature controller (PR 5714, PR electronics, Rønde, Denmark). For a detailed review of aquatic respirometry, see Svendsen et al. [25].
2.3. Background Oxygen Consumption
Oxygen consumption of the chamber containing the P. parvum culture was assessed using a measurement period of 1800 s [25].
2.4. Ventilation Frequency
Determination of the ventilation frequency was completed by monitoring the P. parvum-exposed fish using a submerged webcam (PE-157A, USB endoscope camera, ETView Ltd., Isgav, Israel) for the duration of the experiment. The frequency was established by timing the duration of 10 ventilatory movements in seconds and dividing that time by 10 to obtain the frequency in hertz (Hz). Instead of using the ventilatory volume (L) used in the FATS approach [18,19,20], the ventilatory frequency per hour was used to calculate a proxy, per breath oxygen uptake (mgO2·kg−1) (R), by dividing MO2 (mgO2·kg−1·h−1) by the frequency (h−1):
R provides an average measure of how much oxygen is retained in one ventilatory movement. If the gills are destroyed, or the oxygen uptake efficiency is otherwise changed [30,31,32], this measure should change. Gill clearance rate (coughing) was counted using the same method as the ventilatory frequency, observed as reverse ventilation movements. During the pre-exposure period, the coughing frequency was very low, and if 10 events did not occur within 120 s, the frequency was set to zero.
2.5. Loss of Equilibrium and Time to the Point of No Return
To minimize human disturbance, the respirometer was monitored from above using a webcam (HD c920, Logitech, Lausanne, Switzerland). Humane endpoints of the experiment were set to when the fish lost balance (loss of equilibrium (LOE)), i.e., the fish turned upside down, or when the MO2 determinations dropped 20% below SMR, as the latter was seen by the authors as a clear sign that the fish cannot sustain their required oxygen consumption [33,34]. Time from the start of exposure to LOE was noted and, for the fish where the data allowed, i.e., LOE occurred after the drop of MO2 below SMR, a point of no return (PNR) was calculated as the time post-exposure where MO2 fell below SMR. PNR was calculated using a stick regression similar to that of Yeager and Ultsch [35] (Figure 1). The measure was calculated in Python 2.7 using the Numpy and Scipy libraries. The time from the start of exposure to the PNR should be seen as a critical exposure time; its determination is similar to that of critical oxygen levels [34,35,36], using exposure time as a variable instead of oxygen level. As such, the PNR provides an average measure of the duration for which the fish can maintain their required oxygen consumption when continuously exposed to P. parvum. The experimental design was set up to report continuous measurements on the fish, including before and during exposure. In presenting the results, the time from exposure to PNR is defined, and the term “percent exposure time” is used to adhere to the FATS terminology.
2.6. Algae Culture and Exposure
P. parvum (UTEX-2797) was cultured in a f/2 medium based on natural seawater with a salinity of 30 psu and temperature of 10 °C in 10 L glass flasks, kept lightly aerated with atmospheric air. Algal cultures were grown at an irradiance of ~120 µmol photons m−2s−1 with a 12:12 h dark/light cycle. Algal cultures were grown to a cell density of approximately 400,000 cells·mL−1 before use, and cultures were only used for experiments during their exponential growth phase, in an attempt to normalize the amount of toxin available in the cultures [37,38]. The time to reach the 400,000 cells·mL−1 was approximately 2 weeks.
At the time of the experiment, the proposed toxins (the prymnesins [38]), were unquantifiable [39,40]. Whether prymnesins are the sole toxins in a P. parvum bloom is debatable, so controlling for prymnesin content might confound the effects of other unknown toxins [7,8,40,41,42,43]. Significant variations in toxicity have been reported when exposing fish externally to P. parvum culture [8,40]. The P. parvum toxicity has been reported to vary with pH [7,43], temperature, adsorbents, oxidizing agents [43], and mechanical disturbance [44]. All of the above contribute to our choice to normalize the exposure to culture cell count and regulate environmental factors such as temperature and oxygen levels. Before exposing the fish to the algal culture, pH was measured (WTW pH meter, WTW, Weilheim, Germany) in the fish tank and in the culture bottle, and 10–15 min after mixing the algae culture into the fish tank, pH was measured again in the fish tank. The fish were exposed to a concentration of P. parvum of 4.32 ± 0.32 × 10⁴ cells·mL−1 (pH 8.04 ± 0.12), with a P. parvum culture cell count of 40.4 ± 7.91 × 10⁴ cells·mL−1 (pH 8.83 ± 0.41). The exposure concentration was established under pilot experiments, aiming for an exposure concentration leading to a PNR time of hours, allowing for physiological measurements.
2.7. Hemolysis
Much of the research on HABs use ex vivo hemolytic activity as a measure of toxicity [15,16,17,45,46], and P. parvum is known to induce hemolysis ex vivo [15,16,17]. To assess whether hemolysis occurs in vivo during P. parvum exposure, blood samples were collected from six of the exposed fish immediately after euthanization. The blood samples were transferred to hematocrit tubes and centrifuged at 559 g for 120 s for the blood to separate into serum and red and white blood cells. The hematocrit tubes were inspected for hemolysis, by observing the color of the serum, where positive hemolysis was noted if the serum was red-colored. Positive controls were completed with the addition of a drop of hypotonic water to blood samples during pilot studies, causing the red blood cells to hemolyze by osmosis.
2.8. Effects on Swimming
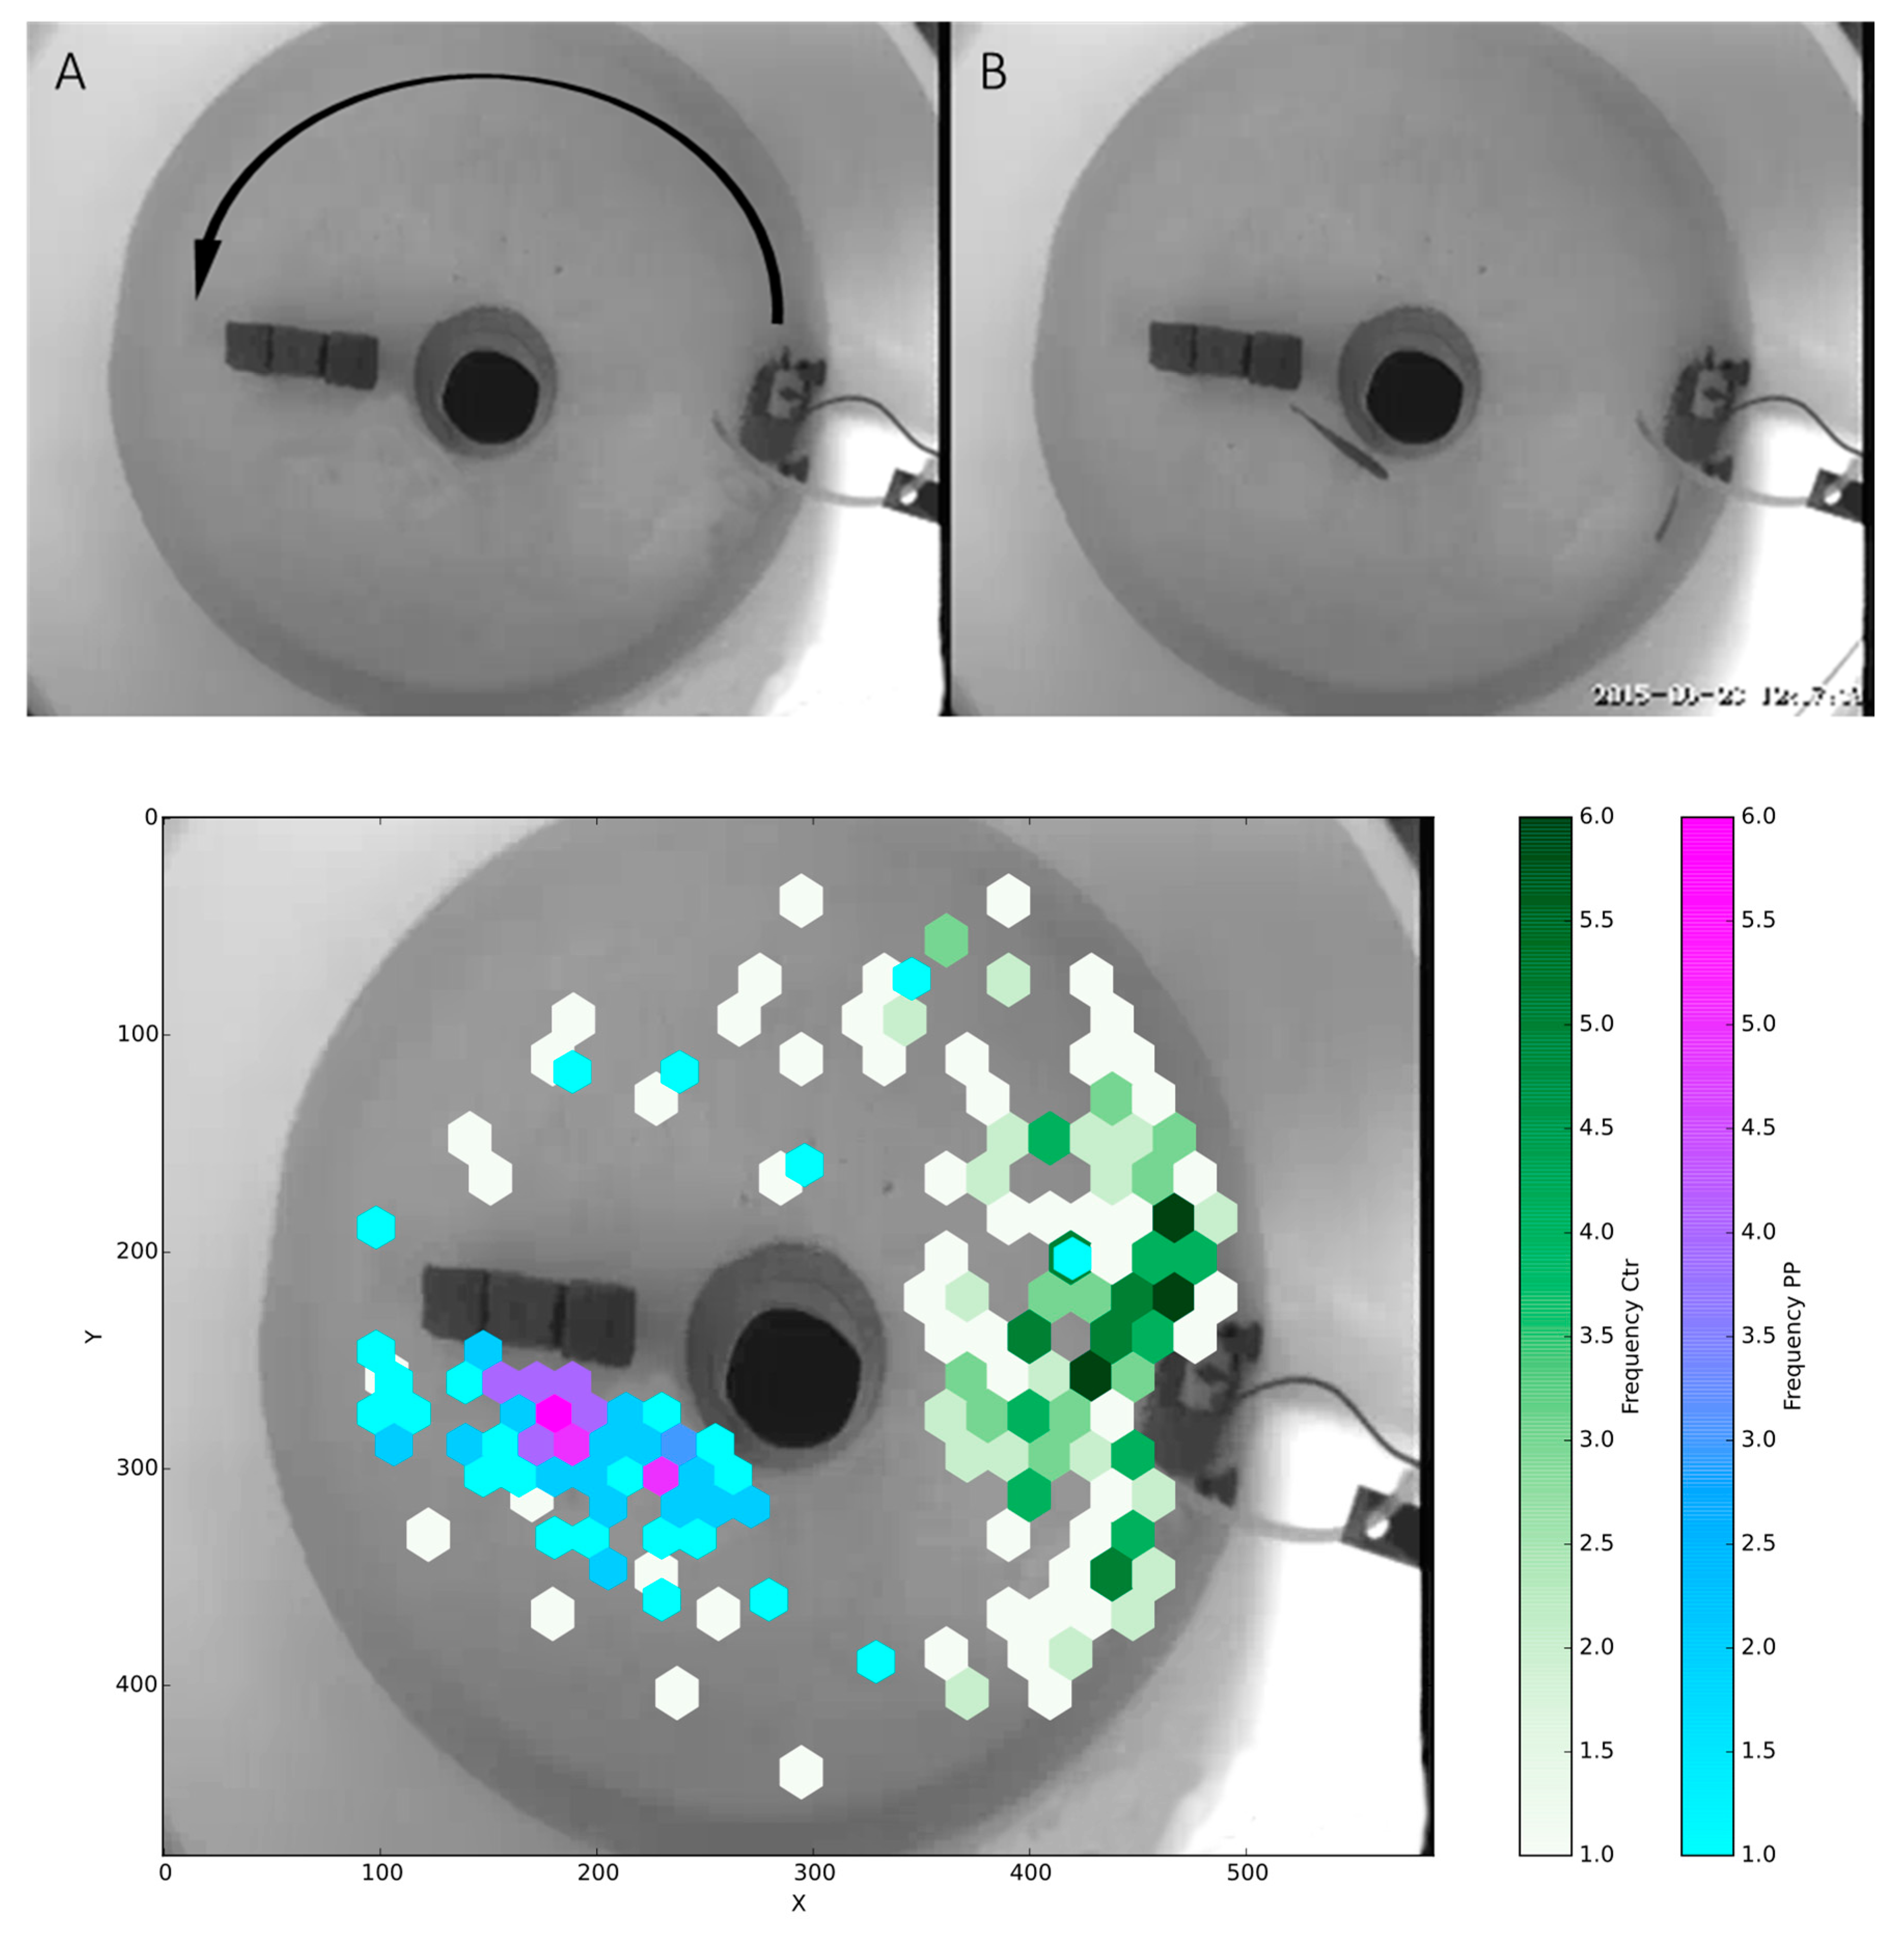
We attempted to use swimming respirometry [47,48] on fish that were exposed short-term (60–90 s) to P. parvum at the concentrations mentioned above. However, the fish were not able to swim in a swim tunnel. Instead, we set up a circular tank with a pump creating a water flow gradient. The water depth was 35 cm, and six square stones were put in the reservoir to create a flow refuge for the fish. This allowed the investigation, by video tracking the position of the fish using idTracker [49] or manually in ImageJ (imagej.nih.gov/ij/) in case of idTracker not tracking the fish, of the duration for which the fish were affected post-P. parvum exposure. The control fish were subject to the same handling, but in water without P. parvum.
2.9. Mode of Action
To illustrate the mode of action of P. parvum exposure on fish physiology, an adverse outcome pathway [50,51,52,53] was created based on the existing knowledge in the literature and results from this study.
Experiments were conducted in adherence with Danish Law, under the animal experimentation permit number (Dyreforsøgstilsynet, Ministry of Environment and Food of Denmark: 2012-15-2934-00657)
2.10. Statistics
Pre-exposure baselines of the continuous measurements (SMR, ventilation frequency (Vf), and R) were compared with average exposure levels using a two-tailed paired Student’s t-test. Linear regressions were performed on SMR, Vf, and R for culture cell count and pH, and exposure cell count and pH. All values reported in the result section are average ± SD.
3. Results
The SMR for the fish was established as 81.2 ± 15.7 mgO2·kg−1·h−1, whereas average oxygen consumption during algal exposure, until the point of no return, was found to be 98.2 ± 13.9 mgO2·kg−1·h−1. The paired samples t-test revealed a significant difference between pre-exposure and exposure levels in terms of oxygen consumption (t = −6.204, df = 11, p < 0.0001). After exposure to the algal suspension, MO2 increased and rose to a peak, and subsequently declined below SMR (Figure 1 and Figure 2).
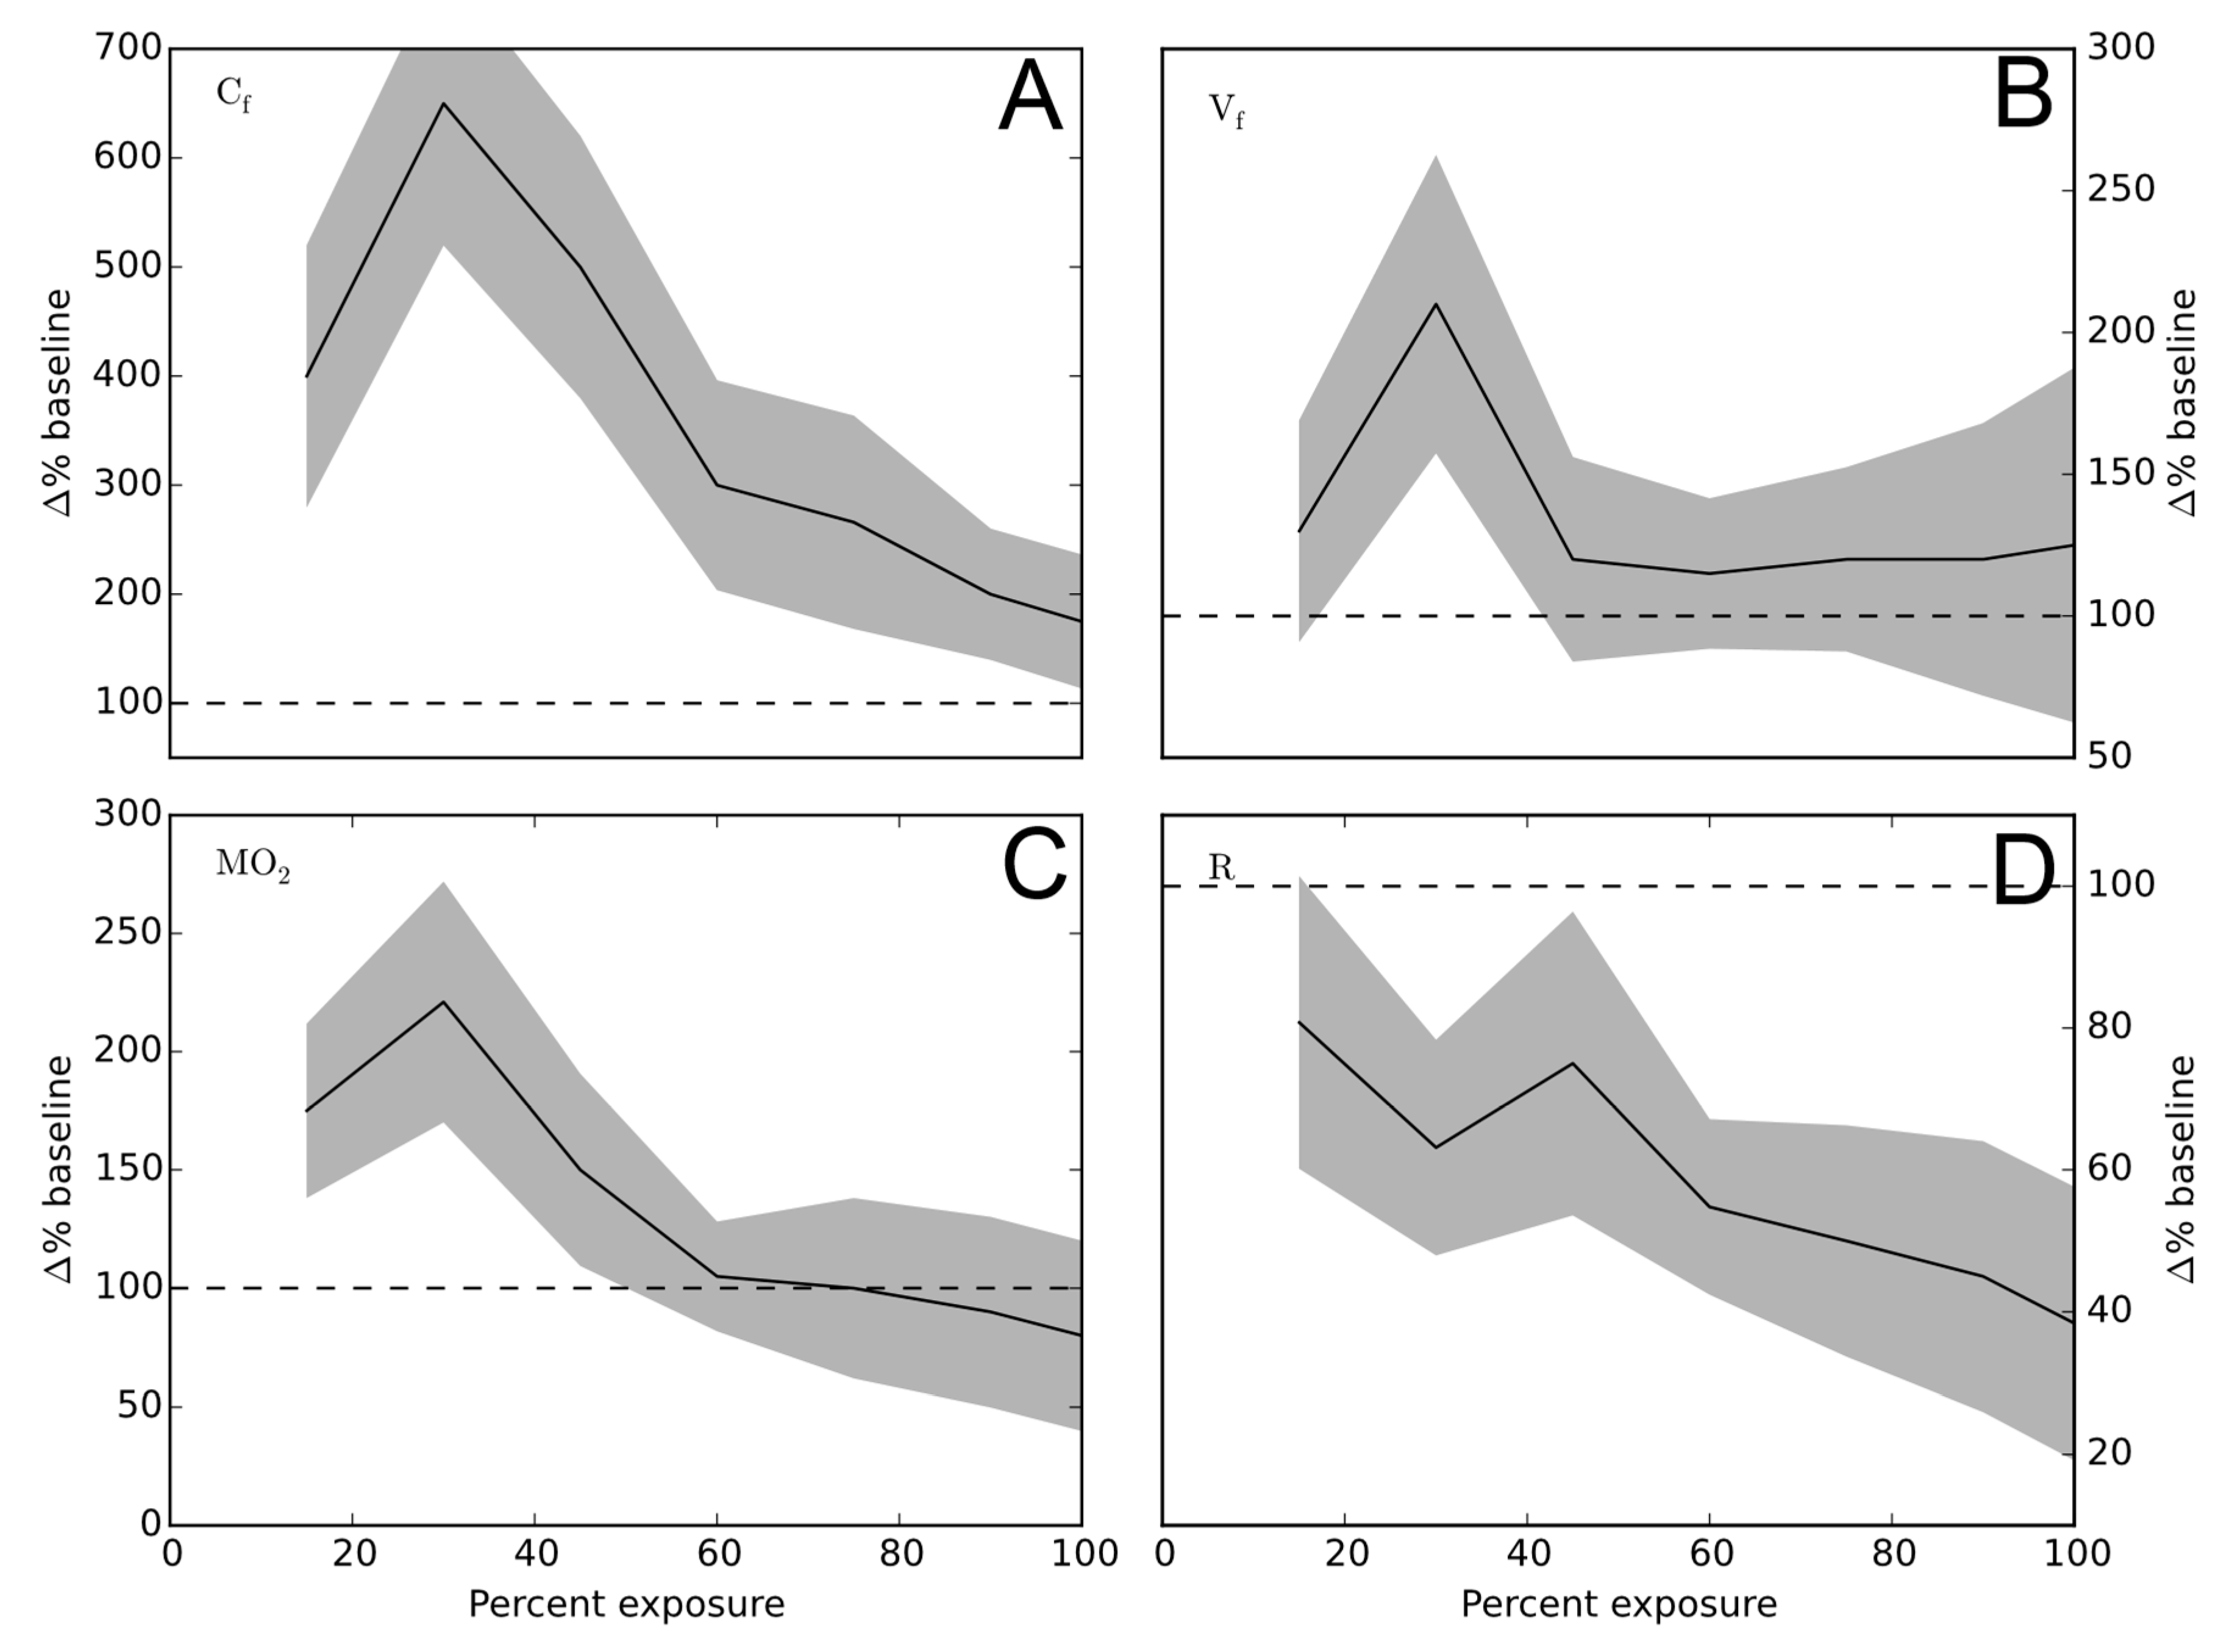
The average ventilation rate for the fish pre-exposure was established as 0.17 ± 0.03 Hz (10.0 ± 1.51 min−1). The average ventilation rate for the fish during algal exposure until PNR was 0.22 ± 0.06 Hz (13.4 ± 3.4 min−1) (t = 2.357, df = 10, p < 0.05). Maximum observed ventilation frequency occurred on average at 30% of the exposure time with a mean frequency of 0.35 ± 0.1 Hz (21.4 ± 6.4 min−1), being significantly different from Vf pre-exposure (t = 5.452, df = 11, p < 0.0001). Figure 2 shows the progression of the Vf during exposure.
The R (per breath oxygen consumption) for the pre-exposure fish was 0.14 ± 0.24 mgO2·kg−1 and was constant before exposure and during SMR determination. During the exposure of the fish to P. parvum, R showed a significant linear decrease (a: −0.46, b: 85.7, r2: 0.87, p: 0.002) (Figure 2). Before exposure of the fish to P. parvum, coughing was occurring in some fish, so the ratio of coughing to ventilation started at a value 0.31 at 20% exposure and finished at 0.14 at 100% exposure.
The critical survival time for continuous exposure (the beginning of exposure to PNR) was 6.9 ± 7.2 h for all fish, ranging from 1.3 to 24.8 h (n = 11). One fish LOE before oxygen consumption fell below SMR, explaining the lower sample size compared to the total. On average, LOE occurred 30.1 ± 9.5 min after PNR. Of the six fish investigated for hemolysis, one showed red coloration of the serum; the remaining five had clear serum.
Of fishes from the tracking experiment, all fish in the control group preferred habitats with higher flow than the exposed fish (Figure 3). Likewise, four of the six trout from the group exposed to P. parvum started to lose equilibrium within a day after reintroduction to clean water in the circular tank; the control group all maintained equilibrium for 48 h.
4. Discussion
The standard metabolic rate determined in this study (81.17 ± 15.7 mgO2 kg−1·h−1; the baseline pre-exposure level of MO2) was slightly higher than previously reported values using intermittent flow respirometry for a rainbow trout of the same size (150 g) and the same temperature of 10 °C (68.7 mgO2·kg−1·h−1 [54]). The determined value was closer to SMR values determined for rainbow trout in a swimming trial (82.5 mgO2·kg−1·h−1 at 15 °C, [55]), and those for brown trout (Salmo trutta) at 12 °C (90.7 mgO2·kg−1·h−1 [56]).
The telltale response of a gill irritant from the FATS literature is a sharp increase in coughing frequency co-occurring with an increase in ventilatory volume (Figure 2a,b). The observed drop and decoupling explain why the MO2 falls below pre-exposure levels to approximately 75% (Figure 2), indicating that the fish can no longer maintain the required oxygen uptake to maintain SMR. As the fish cannot maintain SMR, the fish must rely partly on anaerobic metabolism to survive [33], and it is only a matter of time before the fish will die [23].
The ventilatory volume is an effect of both decreasing oxygen uptake efficiency and an increased MO2, both acting together to create a requirement for a larger amount of water passing over the gills [18,19,20,57]. When the gills become increasingly insufficient, the positive trends in MO2, Vf, and coughing frequency (Cf) have negative trends, as the fish can no longer sustain a high metabolism due to the deterioration of the gills. Other toxicants (narcosis, decouplers, and Acetylcholinesterase inhibitors) have different responses, such as respiratory-decouplers that have MO2 as their primary determinants [20]. Exposing rainbow trout to P. parvum showed the same gill irritant telltale signs: a sharp increase in Cf (Figure 2), and a high MO2 (Figure 1 and Figure 2) and Vf (Figure 2) that subsequently decrease. Though not part of FATS, the average per breath oxygen uptake yielded results that are similar to the oxygen uptake efficiency [58,59]. The change indicates a small decrease in overall efficiency caused by the increasing volume ventilation due to high MO2 (Figure 2, 0–40% exposure). Then, as the gills become more insufficient (approximately 50% onward in Figure 2), R starts to decrease, likely because of the decreasing efficiency of the destroyed or clogged gills. Decoupling of ventilation frequency and oxygen consumption occurs, which no longer follow the same path.
Previously reported “survival time” values of fish exposed to P. parvum ranged from 38 to 180 min [8] and 120 to 140 min [41], under experimental conditions of P. parvum exposure with supernatant and diluted toxin, respectively. Thus, in contrast to the results obtained in this study that ranged from 1.28 to 24.80 h). In the case of P. parvum, studies showed that each strain of P. parvum likely produces slightly different types and amounts of prymnesins (A-, B-, and C-types), which are the substances suspected to be responsible for the ichthyotoxicity of P. parvum blooms [40]. This could explain why different strains of P. parvum express different toxicities [9] and could be the reason for the discrepancy between the results reported in this study (strain: UTEX-2797) and those previously reported by Bergmann et al. [41] for an unknown strain. Furthermore, observed P. parvum toxicity is sensitive to handling [44] and the composition of the aquatic environment [43]. Lastly, the material used in the experimental setup affects observed toxicity as well, as prymnesins readily bind to polymeric surfaces (log d = 3.4–5.2) [60]. Furthermore, contrary to what is suggested in the literature [7], short-term exposure of rainbow trout to P. parvum for the algal concentration used in the present study could not be considered reversible, as four of six exposed trout lost, and did not regain, equilibrium after short-term exposure to P. parvum.
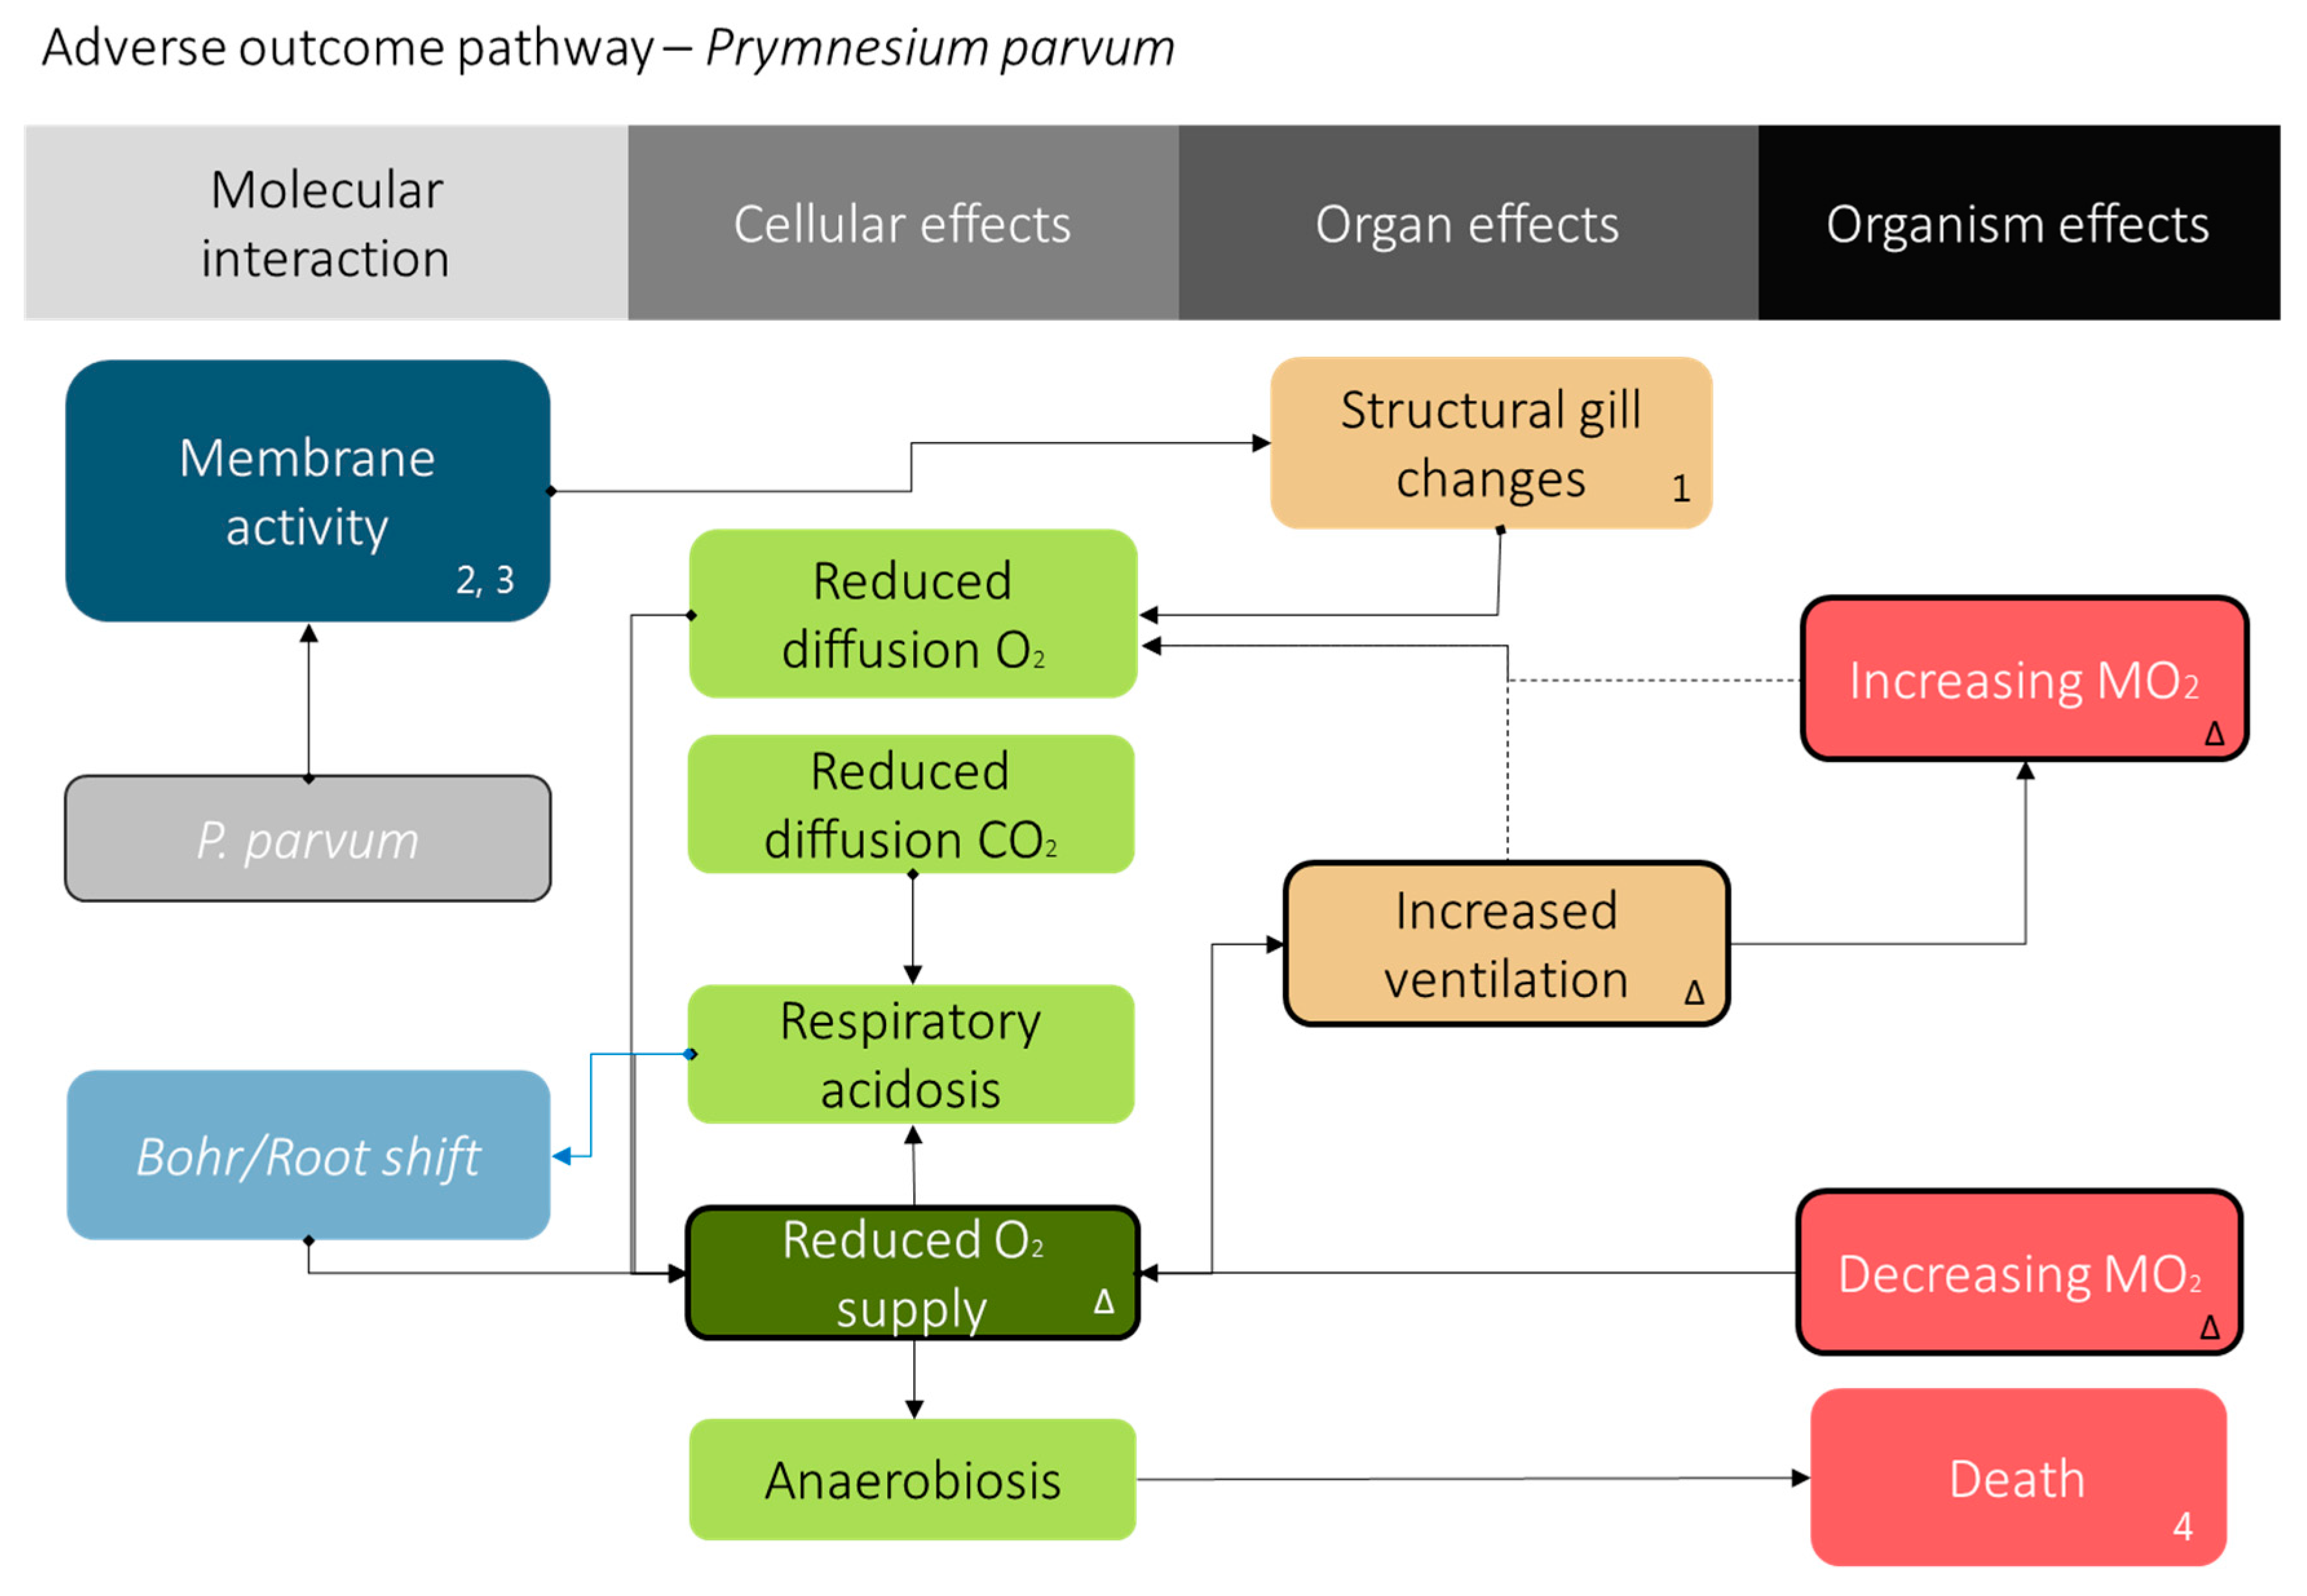
The measurements based on respiratory physiology reported here support the suggestion that the P. parvum toxins act on the gills of the fish [7,37,61]. This suggestion is otherwise only supported by investigating visible tissue damage. The assumption that prymnesins are membrane reactive substances [62] seems appropriate. The fact that the respiratory response observed on rainbow trout corresponds to that of gill irritants using the FATS approach [20] suggests that the toxin is not likely to have any direct action on the inner physiology of the fish. Lastly, both the damaged gill epithelia, in connection with the increased ventilatory volume, will provide the fish with a severe osmotic challenge [63]. This osmotic challenge and its associated costs to the fish remains undetermined. HAB species could, by convergent evolution, have potentially developed different substances or strategies, such as micropredation [64], to target the respiratory system of their larger predators by means of gill destruction or occlusion. Without its gills, any gill-breathing animal will have to rely on anaerobiosis and will have a limited capacity for survival and activity in such situations. However, whether all HABs that are ichthyotoxic act on the gills as their primary site of action (Figure 4) remains a hypothesis that is open for future investigations using the proposed method.
Acknowledgments
The study was financed by the HABFISH project from the Danish Council for Strategic Research. Funding for covering publishing costs in open access journals was not provided.
Author Contributions
M.B.S.S., N.R.A., P.J.H., and J.F.S. conceived and designed the experiments; M.B.S.S. and N.R.A. performed the experiments; M.B.S.S. analyzed the data; M.B.S.S. wrote the first draft of the paper; M.B.S.S., N.R.A., P.J.H., and J.F.S. contributed to finishing the paper.
Conflicts of Interest
The authors declare no conflict of interest.
References
- Otterstorm, C.V.; Steemann-Nielsen, E. Two Cases of Extensive Mortality in Fishes Caused by the Flagellate Prymnesium Parvum Carter; Report Danish Biology Statistics: Copenhagen, Denmark, 1939; Volume 44, (non vidi). [Google Scholar]
- Hallegraeff, G.M. A review of harmful algal blooms and their apparent global increase. Phycologia 1993, 32, 79–99. [Google Scholar] [CrossRef]
- Nazeer, M.; Wong, M.S.; Nichol, J.E. A new approach for the estimation of phytoplankton cell counts associated with algal blooms. Sci. Total Environ. 2017, 590, 125–138. [Google Scholar] [CrossRef] [PubMed]
- Roelke, D.L.; Grover, J.P.; Brooks, B.W.; Glass, J.; Buzan, D.; Southard, G.M.; Fries, L.; Gable, G.M.; Schwierzke-Wade, L.; Byrd, M.; et al. A decade of fish-killing Prymnesium parvum blooms in Texas: Roles of inflow and salinity. J. Plankton Res. 2011, 33, 243–253. [Google Scholar] [CrossRef]
- Roelke, D.L.; Barkoh, A.; Brooks, B.W.; Grover, J.P.; David Hambright, K.; LaClaireII, J.W.; Moeller, P.D.R.; Patino, R. A chronicle of a killer alga in the west: Ecology, assessment, and management of Prymnesium parvum blooms. Hydrobiologia 2016, 764, 29–50. [Google Scholar] [CrossRef]
- Ulitzur, S. The amphiphatic nature of Prymnesium parvum hemolysin. Biochim. Biophys. Acta Biomembr. 1973, 298, 673–679. [Google Scholar] [CrossRef]
- Ulitzur, S.; Shilo, M. Mode of action of Prymnesium parvum ichthyotoxin. J. Protozool. 1966, 13, 332–336. [Google Scholar] [CrossRef]
- Yariv, J.; Hestrin, S. Toxicity of the extracellular phase of Prymnesium parvum cultures. Microbiology 1961, 24, 165–175. [Google Scholar] [CrossRef] [PubMed]
- Blossom, H.E.; Rasmussen, S.A.; Andersen, N.G.; Larsen, T.O.; Nielsen, K.F.; Hansen, P.J. Prymnesium parvum revisited: Relationship between allelopathy, ichthyotoxicity, and chemical profiles in 5 strains. Aquat. Toxicol. 2014, 157, 159–166. [Google Scholar] [CrossRef] [PubMed]
- Hishida, H.; Ishimatsu, I.; Oda, T. Effect of environmental hyperoxia on respiration of yellowtail exposed to Chattonella marina. Fish. Sci. 1999, 65, 84–90. [Google Scholar] [CrossRef]
- Ishimatsu, A.; Maruta, H.; Oda, T.; Ozaki, M. A Comparison of physiological responses in yellowtail to fatal environmental hypoxia and exposure to Chattonella marina. Fish. Sci. 1997, 63, 557–562. [Google Scholar] [CrossRef]
- Lee, K.; Ishimatsu, A.; Sakaguchi, H.; Oda, T. Cardiac output during exposure to Chattonella marina and environmental hypoxia in yellowtail (Seriola quinqueradiata). Mar. Biol. 2003, 142, 391–397. [Google Scholar] [CrossRef]
- Binford, J.S., Jr.; Martin, D.F.; Padilla, G.M. Hemolysis induced by Prymnesium parvum toxin calorimetric studies. Biochim. Biophys. Acta 1973, 291, 156–164. [Google Scholar] [CrossRef]
- Doig, M.T.; Martin, D.F. Anticoagulant properties of a red tide toxin. Toxicon 1973, 11, 351–355. [Google Scholar] [CrossRef]
- Martin, D.F.; Padilla, G.M. Hemolysis induced by Prymnesium parvum toxin kinetics and binding. Biochim. Biophys. Acta 1971, 241, 213–225. [Google Scholar] [CrossRef]
- Martin, D.F.; Padilla, G.M.; Brown, P.A. Hemolysis induced by Prymnesium parvum toxin effect of primaquine treatment. Biochim. Biophys. Acta 1971, 249, 69–80. [Google Scholar] [CrossRef]
- Martin, D.F.; Padilla, G.M.; Heyl, M.G.; Brown, P.A. Effect of Gymnodinium breve toxin on hemolysis induced by Prymnesium parvum toxin. Toxicon 1972, 10, 285–290. [Google Scholar] [CrossRef]
- Bradbury, S.P.; Henry, T.R.; Niemi, G.J.; Carlson, R.W.; Snarski, V.M. Use of respiratory-cardiovascular responses of rainbow trout (Salmo gairdneri) in identifying acute toxicity syndromes in fish: Part 3. Polar narcotics. Environ. Toxicol. Chem. 1989, 8, 247–261. [Google Scholar] [CrossRef]
- Bradbury, S.P.; Carlson, R.W.; Niemi, G.J.; Henry, T.R. Use of respiratory-cardiovascular responses of rainbow trout (Oncorhynchus mykiss) in identifying acute toxicity syndromes in fish: Part 4. Central nervous system seizure agents. Environ. Toxicol. Chem. 1991, 10, 115–131. [Google Scholar] [CrossRef]
- McKim, J.M.; Bradbury, S.P.; Niemi, G.J. Fish acute toxicity syndromes and their use in the QSAR approach to hazard assessment. Environ. Health Perspect. 1987, 71, 171–186. [Google Scholar] [CrossRef] [PubMed]
- Cooke, S.J.; Graeb, B.D.S.; Suski, C.D.; Ostrand, K.G. Effects of suture material on incision healing, growth and survival of juvenile largemouth bass implanted with miniature radio transmitters: Case study of a novice and experienced fish surgeon. J. Fish Biol. 2003, 62, 1366–1380. [Google Scholar] [CrossRef]
- Beamish, F.W.H. Respiration of fishes with special emphasis on standard oxygen consumption: II. Influence of weight and temperature on respiration of several species. Can. J. Zool. 1964, 42, 177–188. [Google Scholar] [CrossRef]
- Fry, F.E.J. Effects of the environment on animal activity. In University of Toronto Studies; The University of Toronto Press: Toronto, ON, Canada, 1947. [Google Scholar]
- Steffensen, J.F. Some errors in respirometry of aquatic breathers: How to avoid and correct for them. Fish Physiol. Biochem. 1989, 6, 49–59. [Google Scholar] [CrossRef] [PubMed]
- Svendsen, M.B.S.; Bushnell, P.G.; Steffensen, J.F. Design and setup of intermittent-flow respirometry system for aquatic organisms. J. Fish Biol. 2016, 88, 26–50. [Google Scholar] [CrossRef] [PubMed]
- Svendsen, M.B.S.; Bushnell, P.G.; Christensen, E.A.F.; Steffensen, J.F. Sources of variation in oxygen consumption of aquatic animals demonstrated by simulated constant oxygen consumption and respirometers of different sizes. J. Fish Biol. 2016, 88, 51–64. [Google Scholar] [CrossRef] [PubMed]
- Beamish, F.W.H. Influence of starvation on standard and routine oxygen consumption. Trans. Am. Fish. Soc. 1964, 93, 103–107. [Google Scholar] [CrossRef]
- Chabot, D.; Steffensen, J.F.; Farrell, A.P. The determination of standard metabolic rate in fishes. J. Fish Biol. 2016, 88, 81–121. [Google Scholar] [CrossRef] [PubMed]
- Steffensen, J.F.; Bushnell, P.G.; Schurmann, H. Oxygen consumption in four species of teleosts from Greenland: No evidence of metabolic cold adaptation. Polar Biol. 1994, 14, 49–54. [Google Scholar] [CrossRef]
- Piiper, J.; Scheid, P. Maximum gas transfer efficacy of models for fish gills, avian lungs and mammalian lungs. Respir. Physiol. 1972, 14, 115–124. [Google Scholar] [CrossRef]
- Piiper, J.; Scheid, P. 4 Model analysis of gas transfer in fish gills. In Fish Physiology; Hoar, W.S., Randall, D.J., Eds.; Academic Press: Orlando, FL, USA, 1984. [Google Scholar]
- Piiper, J.; Dejours, P.; Haab, P.; Rahn, H. Concepts and basic quantities in gas exchange physiology. Respir. Physiol. 1971, 13, 292–304. [Google Scholar] [CrossRef]
- Pörtner, H.O.; Grieshaber, M.K. Critical Po2(s) in oxyconforming and oxyregulating animals: Gas exchange, metabolic rate and the mode of energy production. In The Vertebrate Gas Transport Cascade Adaptations to Environment and Mode of Life; Bicudo, J.E.P.W., Ed.; CRC Press: Boca Raton, FL, USA, 1993. [Google Scholar]
- Tang, P.-S. On the rate of oxygen consumption by tissues and lower organisms as a function of oxygen tension. Q. Rev. Biol. 1933, 8, 260–274. [Google Scholar] [CrossRef]
- Yeager, D.P.; Ultsch, G.R. Physiological regulation and conformation: A BASIC program for the determination of critical points. Physiol. Zool. 1989, 62, 888–907. [Google Scholar] [CrossRef]
- Claireaux, G.; Chabot, D. Responses by fishes to environmental hypoxia: Integration through Fry’s concept of aerobic metabolic scope. J. Fish Biol. 2016, 88, 232–251. [Google Scholar] [CrossRef] [PubMed]
- Shilo, M. The Toxic Principles of Prymnesium Parvum. In The Water Environment; Carmichael, W.W., Ed.; Springer: New York, NY, USA, 1981; pp. 37–47. [Google Scholar]
- Moran, A.; Ilani, A. The effect of prymnesin on the electric conductivity of thin lipid membranes. J. Membr. Biol. 1974, 16, 237–256. [Google Scholar] [CrossRef] [PubMed]
- Igarashi, T.; Satake, M. Yasumoto, T. Structures and partial stereochemical assignments for prymnesin-1 and prymnesin-2: Potent hemolytic and ichthyotoxic glycosides isolated from the red tide alga Prymnesium parvum. J. Am. Chem. Soc. 1999, 118, 479–480. [Google Scholar] [CrossRef]
- Rasmussen, S.A.; Meier, S.; Andersen, N.G.; Blossom, H.E.; Duus, J.Ø.; Nielsen, K.F.; Hansen, P.J.; Larsen, T.O. Chemodiversity of ladder-frame prymnesin polyethers in Prymnesium parvum. J. Nat. Prod. 2016, 79, 2250–2256. [Google Scholar] [CrossRef] [PubMed]
- Bergmann, F.; Parnas, I.; Reich, K. The action of the toxin of Prymnesium parvum carter on the guinea-pig ileum. Br. J. Pharmacol. Chemother. 1964, 22, 47–55. [Google Scholar] [CrossRef] [PubMed]
- Henrikson, J.C.; Gharfeh, M.S.; Easton, A.C.; Easton, J.D.; Glenn, K.L.; Shadfan, M.; Mooberry, S.L.; Hambright, K.D.; Cichewicz, R.H. Reassessing the ichthyotoxin profile of cultured Prymnesium parvum (golden algae) and comparing it to samples collected from recent freshwater bloom and fish kill events in North America. Toxicon 2010, 55, 1396–1404. [Google Scholar] [CrossRef] [PubMed]
- Shilo, M.; Aschner, M. Factors governing the toxicity of cultures containing the phytoflagellate Prymnesium parvum Carter. Microbiology 1953, 8, 333–343. [Google Scholar] [CrossRef] [PubMed]
- Blossom, H.E.; Andersen, N.G.; Rasmussen, S.A.; Hansen, P.J. Stability of the intra- and extracellular toxins of Prymnesium parvum using a microalgal bioassay. Harmful Algae 2014, 32, 11–21. [Google Scholar] [CrossRef]
- Clemons, G.P.; Pinion, J.P.; Bass, E.; Pham, D.V.; Sharif, M.; Wutoh, J.G. A hemolytic principle associated with the red-tide dinoflagellate Gonyaulax monilata. Toxicon 1980, 18, 323–326. [Google Scholar] [CrossRef]
- Dorantes-Aranda, J.J.; Parra, L.M.G.; Alonso-Rodríguez, R.; Morquecho, L. Hemolytic activity and fatty acids composition in the ichthyotoxic dinoflagellate Cochlodinium polykrikoides isolated from Bahía de La Paz, Gulf of California. Mar. Pollut. Bull. 2009, 58, 1401–1405. [Google Scholar] [CrossRef] [PubMed]
- Brett, J.R. The Relation of size to rate of oxygen consumption and sustained swimming speed of Sockeye salmon (Oncorhynchus nerka). J. Fish. Res. Can. 1965, 22, 1491–1501. [Google Scholar] [CrossRef]
- Steffensen, J.F.; Johansen, K.; Bushnell, P.G. An automated swimming respirometer. Comp. Biochem. Physiol. A Mol. Integr. Physiol. 1984, 79, 437–440. [Google Scholar] [CrossRef]
- Pérez-Escudero, A.; Vicente-Page, J.; Hinz, R.C.; Arganda, S.; de Polavieja, G.G. idTracker: Tracking individuals in a group by automatic identification of unmarked animals. Nat. Methods 2014, 11, 743–748. [Google Scholar] [CrossRef]
- Ankley, G.T.; Bennett, R.S.; Erickson, R.J.; Hoff, D.J.; Hornung, M.W.; Johnson, R.D.; Mount, D.R.; Nichols, J.W.; Russom, C.L.; Schmieder, P.K.; et al. Adverse outcome pathways: A conceptual framework to support ecotoxicology research and risk assessment. Environ. Toxicol. Chem. 2010, 29, 730–741. [Google Scholar] [CrossRef] [PubMed]
- Hutchinson, T.H.; Lyons, B.P.; Thain, J.E.; Law, R.J. Evaluating legacy contaminants and emerging chemicals in marine environments using adverse outcome pathways and biological effects-directed analysis. Mar. Pollut. Bull. 2013, 74, 517–525. [Google Scholar] [CrossRef] [PubMed]
- Kramer, V.J.; Etterson, M.A.; Hecker, M.; Murphy, C.A.; Roesijadi, G.; Spade, D.J.; Spromberg, J.A.; Wang, M.; Ankley, G.T. Adverse outcome pathways and ecological risk assessment: Bridging to population-level effects. Environ. Toxicol. Chem. 2011, 30, 64–76. [Google Scholar] [CrossRef] [PubMed]
- Vinken, M. The adverse outcome pathway concept: A pragmatic tool in toxicology. Toxicology 2013, 312, 158–165. [Google Scholar] [CrossRef] [PubMed]
- Svendsen, J.C.; Steffensen, J.F.; Aarestrup, K.; Frisk, M.; Etzerodt, A.; Jyde, M. Excess posthypoxic oxygen consumption in rainbow trout (Oncorhynchus mykiss): Recovery in normoxia and hypoxia. Can. J. Zool. 2011, 90, 1–11. [Google Scholar] [CrossRef]
- Bushnell, P.G.; Steffensen, J.F.; Johansen, K. Oxygen consumption and swimming performance in hypoxia-acclimated rainbow trout Salmo gairdneri. J. Exp. Biol. 1984, 113, 225–235. [Google Scholar] [CrossRef]
- Sloman, K.A.; Motherwell, G.; O’connor, K.; Taylor, A.C. The effect of social stress on the standard metabolic rate (SMR) of brown trout, Salmo trutta. Fish Physiol. Biochem. 2000, 23, 49–53. [Google Scholar] [CrossRef]
- Davis, J.C. Circulatory and Ventilatory Responses of Rainbow Trout (Salmo gairdneri) to Artificial Manipulation of Gill Surface Area. J. Fish. Res. Can. 1971, 28, 1609–1614. [Google Scholar] [CrossRef]
- Hughes, G.M. Respiratory Responses to Hypoxia in Fish. Am. Zool. 1973, 13, 475–489. [Google Scholar] [CrossRef]
- Lomholt, J.P.; Johansen, K. Hypoxia Acclimation in Carp: How It Affects O2 Uptake, Ventilation, and O2 Extraction from Water. Physiol. Zool. 1979, 52, 38–49. [Google Scholar] [CrossRef]
- Valenti, T.W., Jr.; James, S.V.; Lahousse, M.J.; Schug, K.A.; Roelke, D.L.; Grover, J.P.; Brooks, B.W. A mechanistic explanation for pH-dependent ambient aquatic toxicity of Prymnesium parvum carter. Toxicon 2010, 55, 990–998. [Google Scholar] [CrossRef] [PubMed]
- Dafni, Z.; Shilo, M. The Cytotoxic Principle of the Phytoflagellate Prymnesium Parvum. J. Cell Biol. 1966, 28, 461–471. [Google Scholar] [CrossRef] [PubMed]
- Imai, M.; Inoue, K. The mechanism of the action of prymnesium toxin on membranes. Biochim. Biophys. Acta 1974, 352, 344–348. [Google Scholar] [CrossRef]
- Christensen, E.A.F.; Svendsen, M.B.S.; Steffensen, J.F. Plasma osmolality and oxygen consumption of perch Perca fluviatilis in response to different salinities and temperatures. J. Fish Biol. 2016, 90, 819–833. [Google Scholar] [CrossRef] [PubMed]
- Vogelbein, W.K.; Lovko, V.J.; Shields, J.D.; Reece, K.S.; Mason, P.L.; Haas, L.W.; Walker, C.C. Pfiesteria shumwayae kills fish by micropredation not exotoxin secretion. Nature 2002, 418, 967–970. [Google Scholar] [CrossRef] [PubMed]
Figure 1.
Oxygen consumption. (A) The progression of oxygen consumption (MO2) of one experimental exposure of rainbow trout (Oncorhynchus mykiss) to Prymnesium parvum. Open circles represent MO2 pre-exposure and filled circles are MO2 during exposure. In this figure, all MO2 determinations are illustrated using only determinations with an r2 > 0.95 for standard metabolic rate (SMR) and point of no return (PNR). The hatched area to the left highlights the acclimation period, where the fish recovers from handling and air exposure [22]). The grey shaded area is the determined critical exposure time, which was defined as being from the start of exposure to the PNR. Determining PNR as the breakpoint for best stick regression fit (sum of squares fit) of MO2 over time, the regression is illustrated as the intersection of the two solid lines (-). SMR is the broken line (--), and post-exposure MO2 is the dot-dash line (-). (B) Histograms of MO2 from the top part of the figure. White bars represent pre-exposure, and grey is exposure to P. parvum(s). The lines illustrate the fitted Gaussian distributions used for the determination of SMR (-) and mean exposure to P. parvum (--).
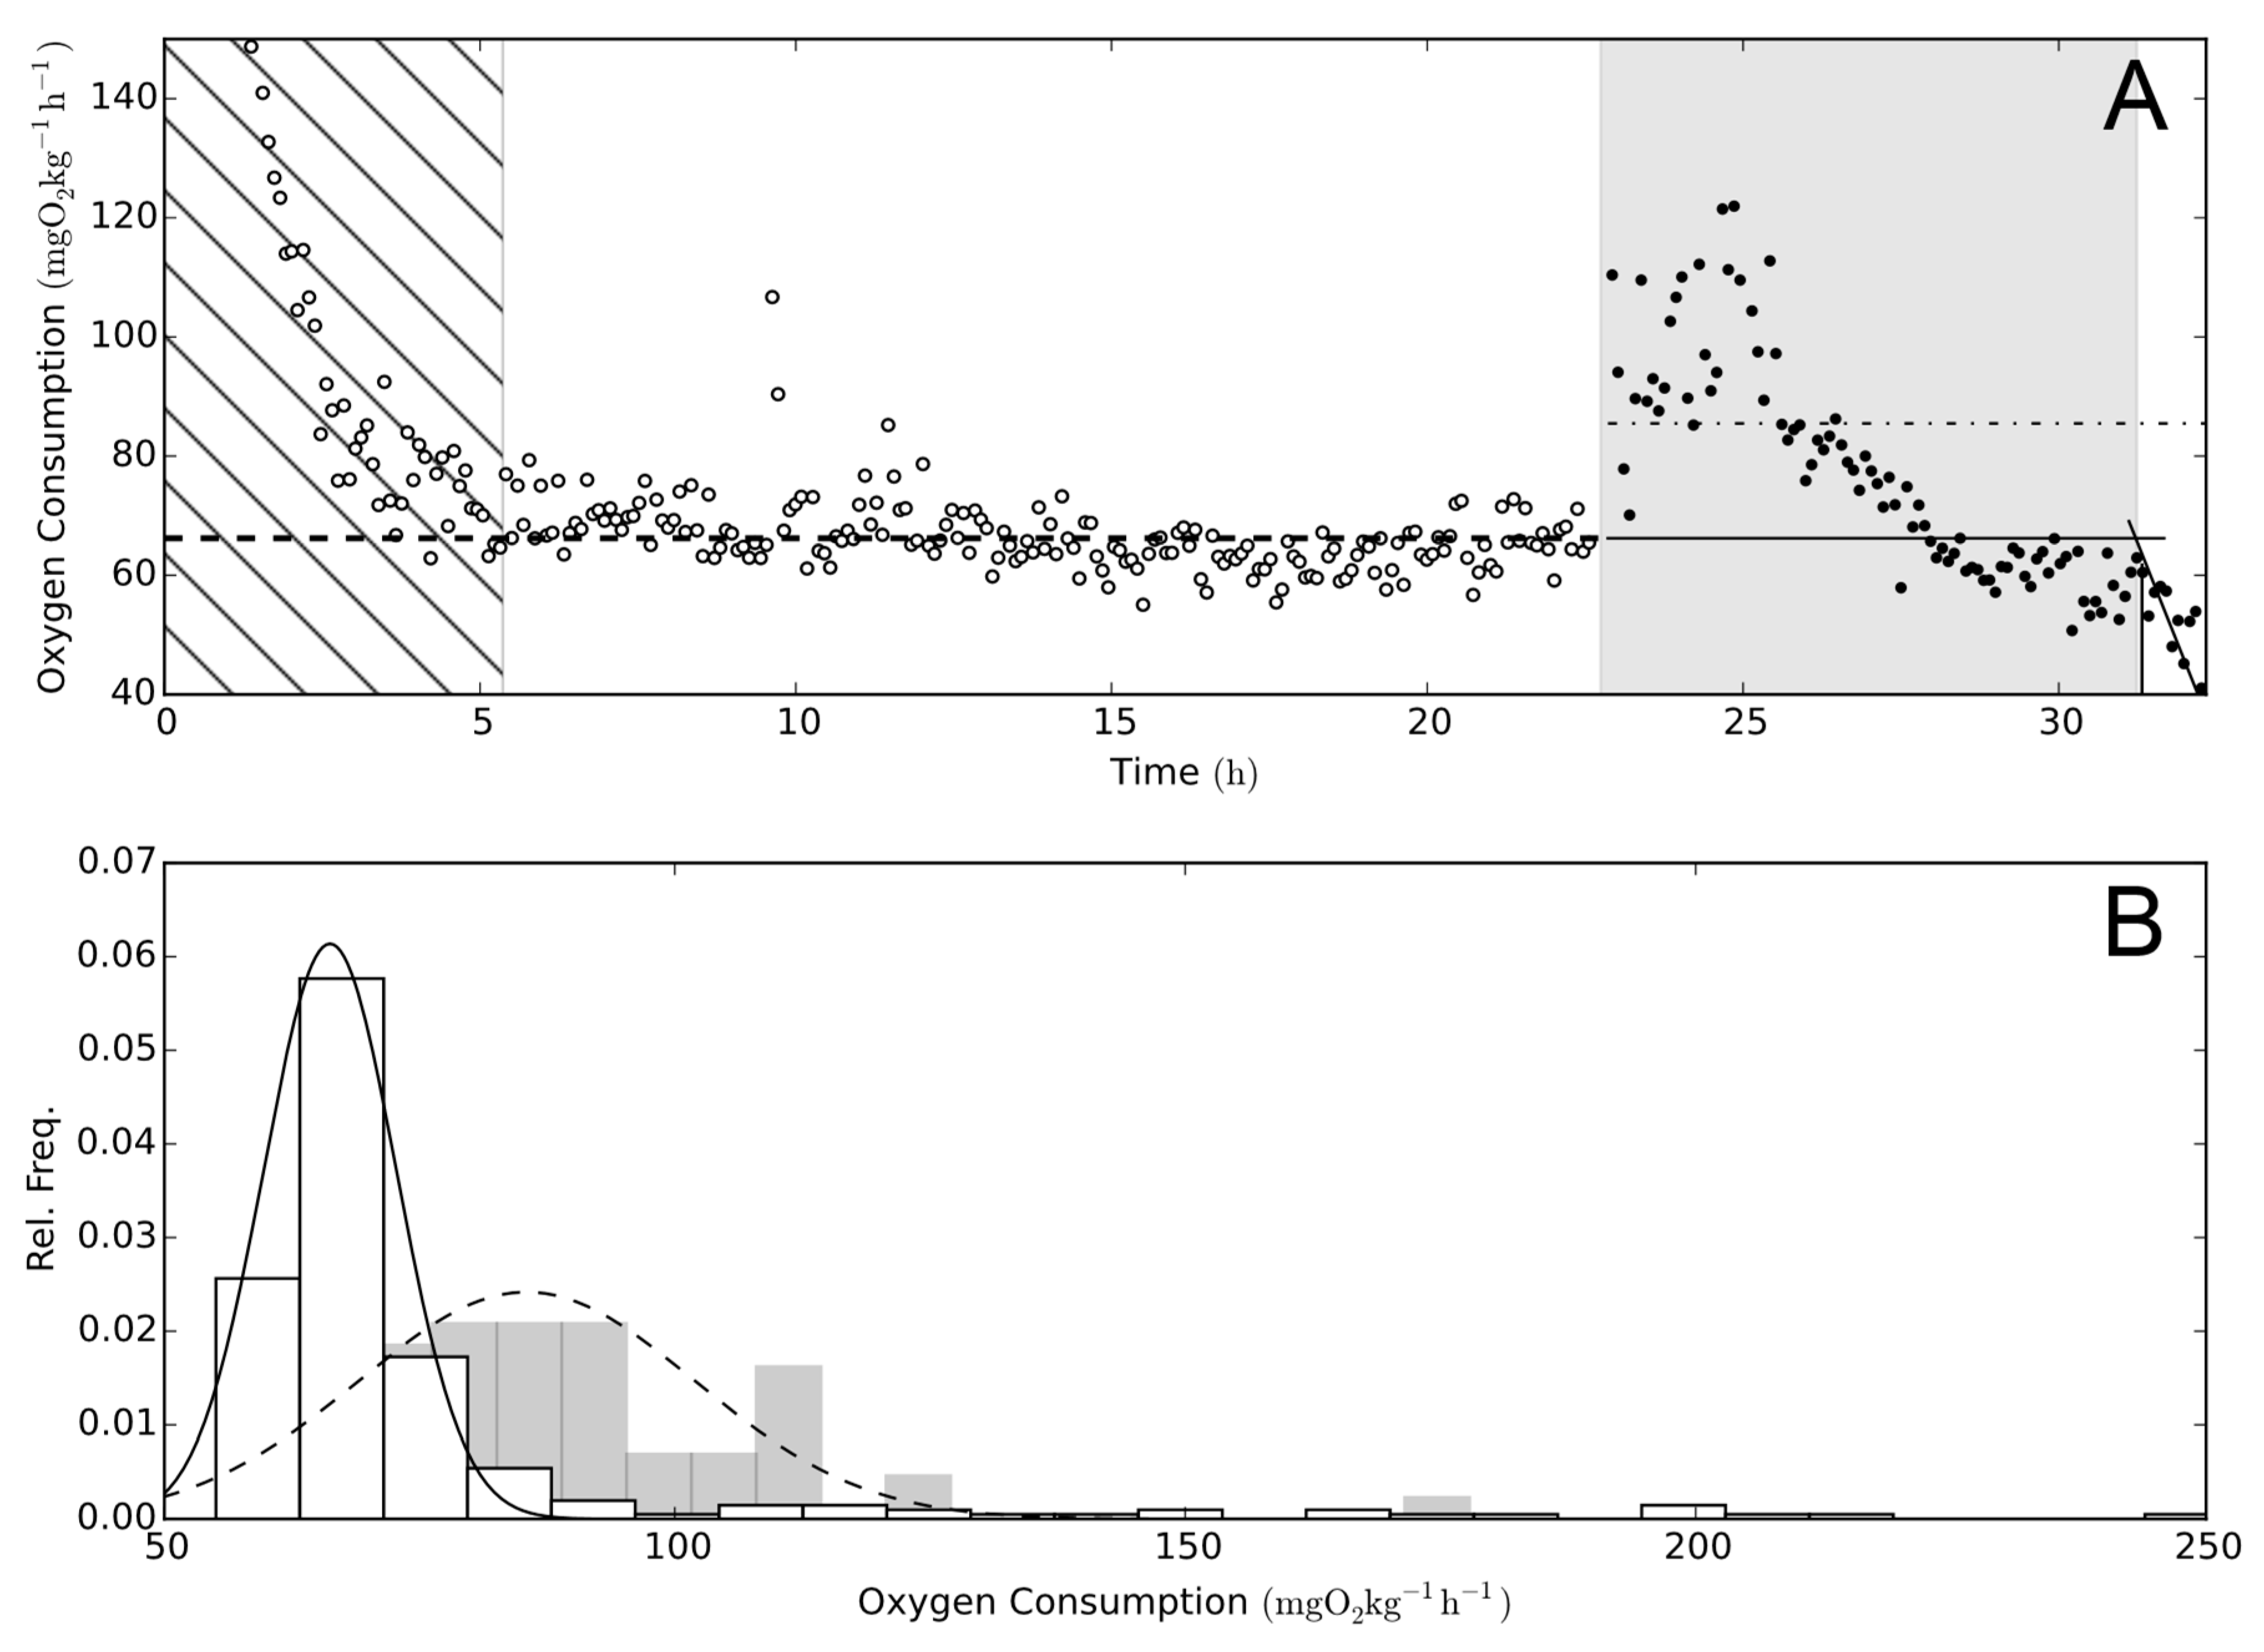
Figure 2.
Respiratory parameters. The mean (-) and standard deviation (shaded area) of the four measurements discussed in connection to P. parvum exposure of rainbow trout: (A) Cf: Coughing frequency; (B) Vf: ventilatory frequency; (C) MO2; (D) R: per breath oxygen consumption. The dashed line (--) represents the average pre-exposure level for each measure. The numbers of measurements were 15, 30, 45, 60, 75, and 90 with a 100% percent exposure time and were linearly interpolated to create the graphs.

Figure 3.
Behavioral tracking of rainbow trout in a circular flow tank. (A) A background image used for tracking the fish, with the arrow indicating the direction of flow. (B) One frame from one of the recorded videos. (C) Time-weighted average positions of tracked fish from each group (control, n = 6, white to green; P.parvum exposure, n = 6, blue to purple) for the first 12 h post-exposure. Control fish showed a clear preference for the area around the pump, characterized by a high flow rate, compared to positioning toward the center of the flow obstructing rocks as observed by the PP group.

Figure 4.
Adverse outcome pathway for P. parvum exposure. The proposed adverse outcome pathway [50,51,52,53] for fish exposed to P. parvum. The numbers indicate evidence from literature (1: [6], 2: [13], 3: [8], and 4: [7]), and Δ indicates results from this study. The prymnesins excreted [40] by P. parvum possess some membrane activity that causes gill damage [6,7,8,13]. The gill damage elicits the FATS gill irritant syndrome observed via oxygen consumption and ventilation rate shown here.

© 2018 by the authors. Licensee MDPI, Basel, Switzerland. This article is an open access article distributed under the terms and conditions of the Creative Commons Attribution (CC BY) license (http://creativecommons.org/licenses/by/4.0/).
Share and Cite
MDPI and ACS Style
Svendsen, M.B.S.; Andersen, N.R.; Hansen, P.J.; Steffensen, J.F. Effects of Harmful Algal Blooms on Fish: Insights from Prymnesium parvum. Fishes 2018, 3, 11. https://doi.org/10.3390/fishes3010011
AMA Style
Svendsen MBS, Andersen NR, Hansen PJ, Steffensen JF. Effects of Harmful Algal Blooms on Fish: Insights from Prymnesium parvum. Fishes. 2018; 3(1):11. https://doi.org/10.3390/fishes3010011
Chicago/Turabian StyleSvendsen, Morten Bo Søndergaard, Nikolaj Reducha Andersen, Per Juel Hansen, and John Fleng Steffensen. 2018. "Effects of Harmful Algal Blooms on Fish: Insights from Prymnesium parvum" Fishes 3, no. 1: 11. https://doi.org/10.3390/fishes3010011