
Calculated Effects of Disorder on the Mo Core Levels in Purple Bronze Li2Mo12O34 †


Department of Quantum Matter Physics, University of Geneva, 24 Quai Ernest-Ansermet, CH-1211 Geneva 4, Switzerland
†
This work was presented at the ACSIN2016 Conference in Frascati, Italy, 9–13 October 2016, “Atomically Controlled Surfaces, Interfaces and Nanostructures” edited by Antonio Bianconi and Augusto Marcelli (Superstripes Press, Rome, Italy) 2016 ISBN 9788866830597.
Condens. Matter 2016, 1(1), 5; https://doi.org/10.3390/condmat1010005
Submission received: 23 September 2016
/
Revised: 31 October 2016
/
Accepted: 4 November 2016
/
Published: 14 November 2016
(This article belongs to the Special Issue Selected Papers from The 13th Conference on Atomically Controlled Surfaces, Interfaces and Nanostructures (ACSIN 2016))
Abstract
:The band structures of ordered and thermally disordered LiMoO are calculated by use of ab initio density functional theory (DFT)–Linear Muffin-Tin Method (LMTO) with a focus on the behavior of the Mo 3d -core levels. It is shown that thermal disorder and zero-point motion lead to substantial core level broadening, and the broadening at room temperature is predicted to be sufficiently larger than at zero degrees to allow for a detection by X-ray photoelectron spectroscopy (XPS) measurements. However, real purple bronze has 10% Li vacancies, and static disorder will attenuate the T-dependent broadening. It is argued that core level spectroscopies could be a useful tool for the measurement of thermal disorders in many materials, especially for those with minor static disorder. Studies of core levels in magnetic materials will be helpful for an understanding of T-dependent spin moments.
1. Introduction
Lithium Purple Bronze (LiMoO) is an unusual material which has drawn the attention of researchers for nearly three decades [1,2]. It is a compound with a rather complicated layered structure [3], and it exhibits highly 1-dimensional (1D) electronic properties [4,5,6]. For example, characteristic 1D features have been seen in scanning tunneling spectroscopy [7,9], from magnetoresistance [8], but also dimensional crossover from thermal expansion [10], and even the role of disorder has been invoked for a low-T transition [11]. Superconductivity below 2K has also been reported [10,11]. Indeed, band calculations starting with 3D electronic interactions reveal an electronic structure with 1D character [5,6], with large band dispersion in only one of the directions within the layers. The band structure shows that two bands are very close together near the crossing of the Fermi energy, , with a moderately large density-of-states (DOS). Thermal disorder and possible spin fluctuations on the valence bands lead to band broadening and partial gaps at [12].
Several band calculations have been made for the ordered lattice of stoichiometric purple bronze [5,6,13,14]. Band structure calculations rarely take into account thermal distortions of the lattice positions. However, structural disorder due to thermal vibrations are detectable through spectroscopic methods [12,15,16,17,18], and it is recognized as being important for T-dependent physical properties in materials with particular fine structures in the DOS near [12,19,20,21,22,23,24,25,26]. Here, for purple bronze, effects of thermal fluctuations at large T and zero-point motion (ZPM) at might be pertinent for the degree of dimensionality and the band overlap between the two bands at [12]. The present work shows that core level broadening from thermal disorder can be large, and therefore it is important to recognize core level spectroscopy as a useful tool for the determination of the effects of disorder on valence states and material properties.
2. Calculations
2.1. Thermal Disorder and Zero-Point Motion
The band structure is sensitive to disorder (and ZPM) because of the fluctuations of the potential in a vibrating disordered lattice. The Coulomb potential at a point r within a site i is
where are the nuclear charges on sites j, is the electron charge density, and the sum and integral cover all space. The contribution to from its own site (with radius ) can be separated from the contribution from the surrounding lattice through the technique of Ewald lattice summation [27]:
Thus, the Coulomb interaction with the outside lattice is condensed into a Madelung shift, [28]
where is the geometric structure factor, is the electron charge on site j, and ρ is the interstitial charge density.
This shift is identical for equivalent sites if the lattice is perfectly ordered, but all sites have different in a disordered lattice—partly because of the local differences in atomic positions, and partly because of the charge transfers induced by the disorder. Thus, the potentials at different sites are slightly different, and they vary in time. Phonons are very slow compared to the electronic time scale, and the electronic structure can relax adiabatically.
Phonons are thermally excited following the Bose–Einstein occupation of the phonon DOS, . The averaged atomic displacement amplitude, σ, can be calculated as function of T [27,29]. The result is approximately that at low T due to ZPM and at high T (“thermal excitations”), where is a weighted average of . The force constant K, (where , where is an atomic mass; here the mass of Mo is used because of its dominant role in the electronic DOS) can be calculated as (E is the total energy), or it can be determined experimentally. We use the measurements of the phonon DOS of the related blue bronze KMoO[30] to estimate K and the average displacements of Mo atoms, as is explained in [12].
The individual displacements u follow a Gaussian distribution function
where σ, the standard deviation of u, will be a parameter in the different sets of calculations. In order to estimate the effect of such atomic displacements on the band structure, each atomic site in the unit cell is assigned a random displacement (u) along and z, following the Gaussian distribution function. Our calculations are made for supercells that contain such (T-dependent) distortions. The disorder makes the potentials different on different sites in the fully self-consistent calculations, and the core levels on different sites are no longer degenerate, as in an ordered supercell. The average spread of the core level values defines the energy broadenings, , shown in Table 1.
The parameter σ depends on T and the properties of the material. From the experimental data in blue bronze [30], we estimate the T-dependence of σ for purple bronze, so that ( is the y-axis lattice constant) is of the order 0.7% for Mo, and thermal vibrations become larger than from about 120 K (we adopt the same conventions as in [3,6] for the structure, site-notation and k-space, so that and are parallel and perpendicular to the planes). Band calculations are made for a total of nine different disordered configurations. Four of these configurations have a %, and the remaining have larger σ to represent disorder just below room temperature (RT).
The electronic structure of LiMoO (two formula units of stoichiometric purple bronze) has been calculated using the Linear Muffin-Tin Method (LMTO) [28,31,32], in the local density approximation (LDA) [33], with or without disorder [12]. The lattice dimension and atomic positions of the structure have been taken from Onoda et al. [3]. The lattice constant, , in the conducting y-direction is 5.52 Å, and along the least conducting x-direction, it is Å. In order to adapt the LMTO basis for an open structure as in purple bronze, we inserted 56 empty spheres in the most open parts of the structure. This makes a total of 104 sites within the unit cell. The basis consists of s-, p-, and d-waves for Mo, and s- and p-states for Li and O, and empty spheres, with one ℓ higher for the 3-center terms. Corrections for the overlapping atomic spheres are included. All atomic sites are assumed to be fully occupied (except for the case with a vacant Li atom, see Section 2.3), and they are all considered as inequivalent in the calculations. Self-consistency is made using 125 k-points. Other details can be found in [12]. Valence energies converge more rapidly than core levels and the total energy. It was necessary to continue the iterations for some of the disordered configurations in [12] in order to have stable core levels, even though the valence states were already converged.
2.2. Static Disorder
In addition to the thermal effects, on which we concentrated in the previous section, disorder can come from a variety of other sources. In particular, imperfections of the crystal (from non-stoichiometry, vacancies, site exchange, and twins in single crystals) should contribute to a T-independent disorder. In particular, one can worry about the fact that one out of ten Li atoms are missing in the real material. The unit cell considered here contains two Li, and the influence on the electronic bands from the replacement of one of these with an empty sphere (without taking structural distortion into account) is moderately large [12]. The additional 1.5 eV Gaussian broadening in Figure 1 is an effort to account for such static disorders, but it is a free parameter that has to be refined when results are to be compared with experiment.
In order to get an idea of the effects of Li vacancies, we also calculate the electronic structure of LiMoO (one missing Li in two formula units of the normal undistorted cell). All other details of the calculation are unchanged.
2.3. Calculated Results
The band dispersion along the conducting (or ) direction agrees well with the measured results obtained by Angle-resolved photoemission spectroscopy (ARPES) [34], showing a flattening of the two dispersive bands at about 0.4–0.5 eV below . One important result of [12] was the suggestion that thermal disorder makes a broadening of the valence band, with an amplitude comparable to the separation of the two bands near . Thus, the broadening explains why only one band is observed in APRES. The overall agreement between different band results and photoemission is reassuring for this complicated structure. Here, we will focus on the Mo 3d-core levels and their dependence on disorder.
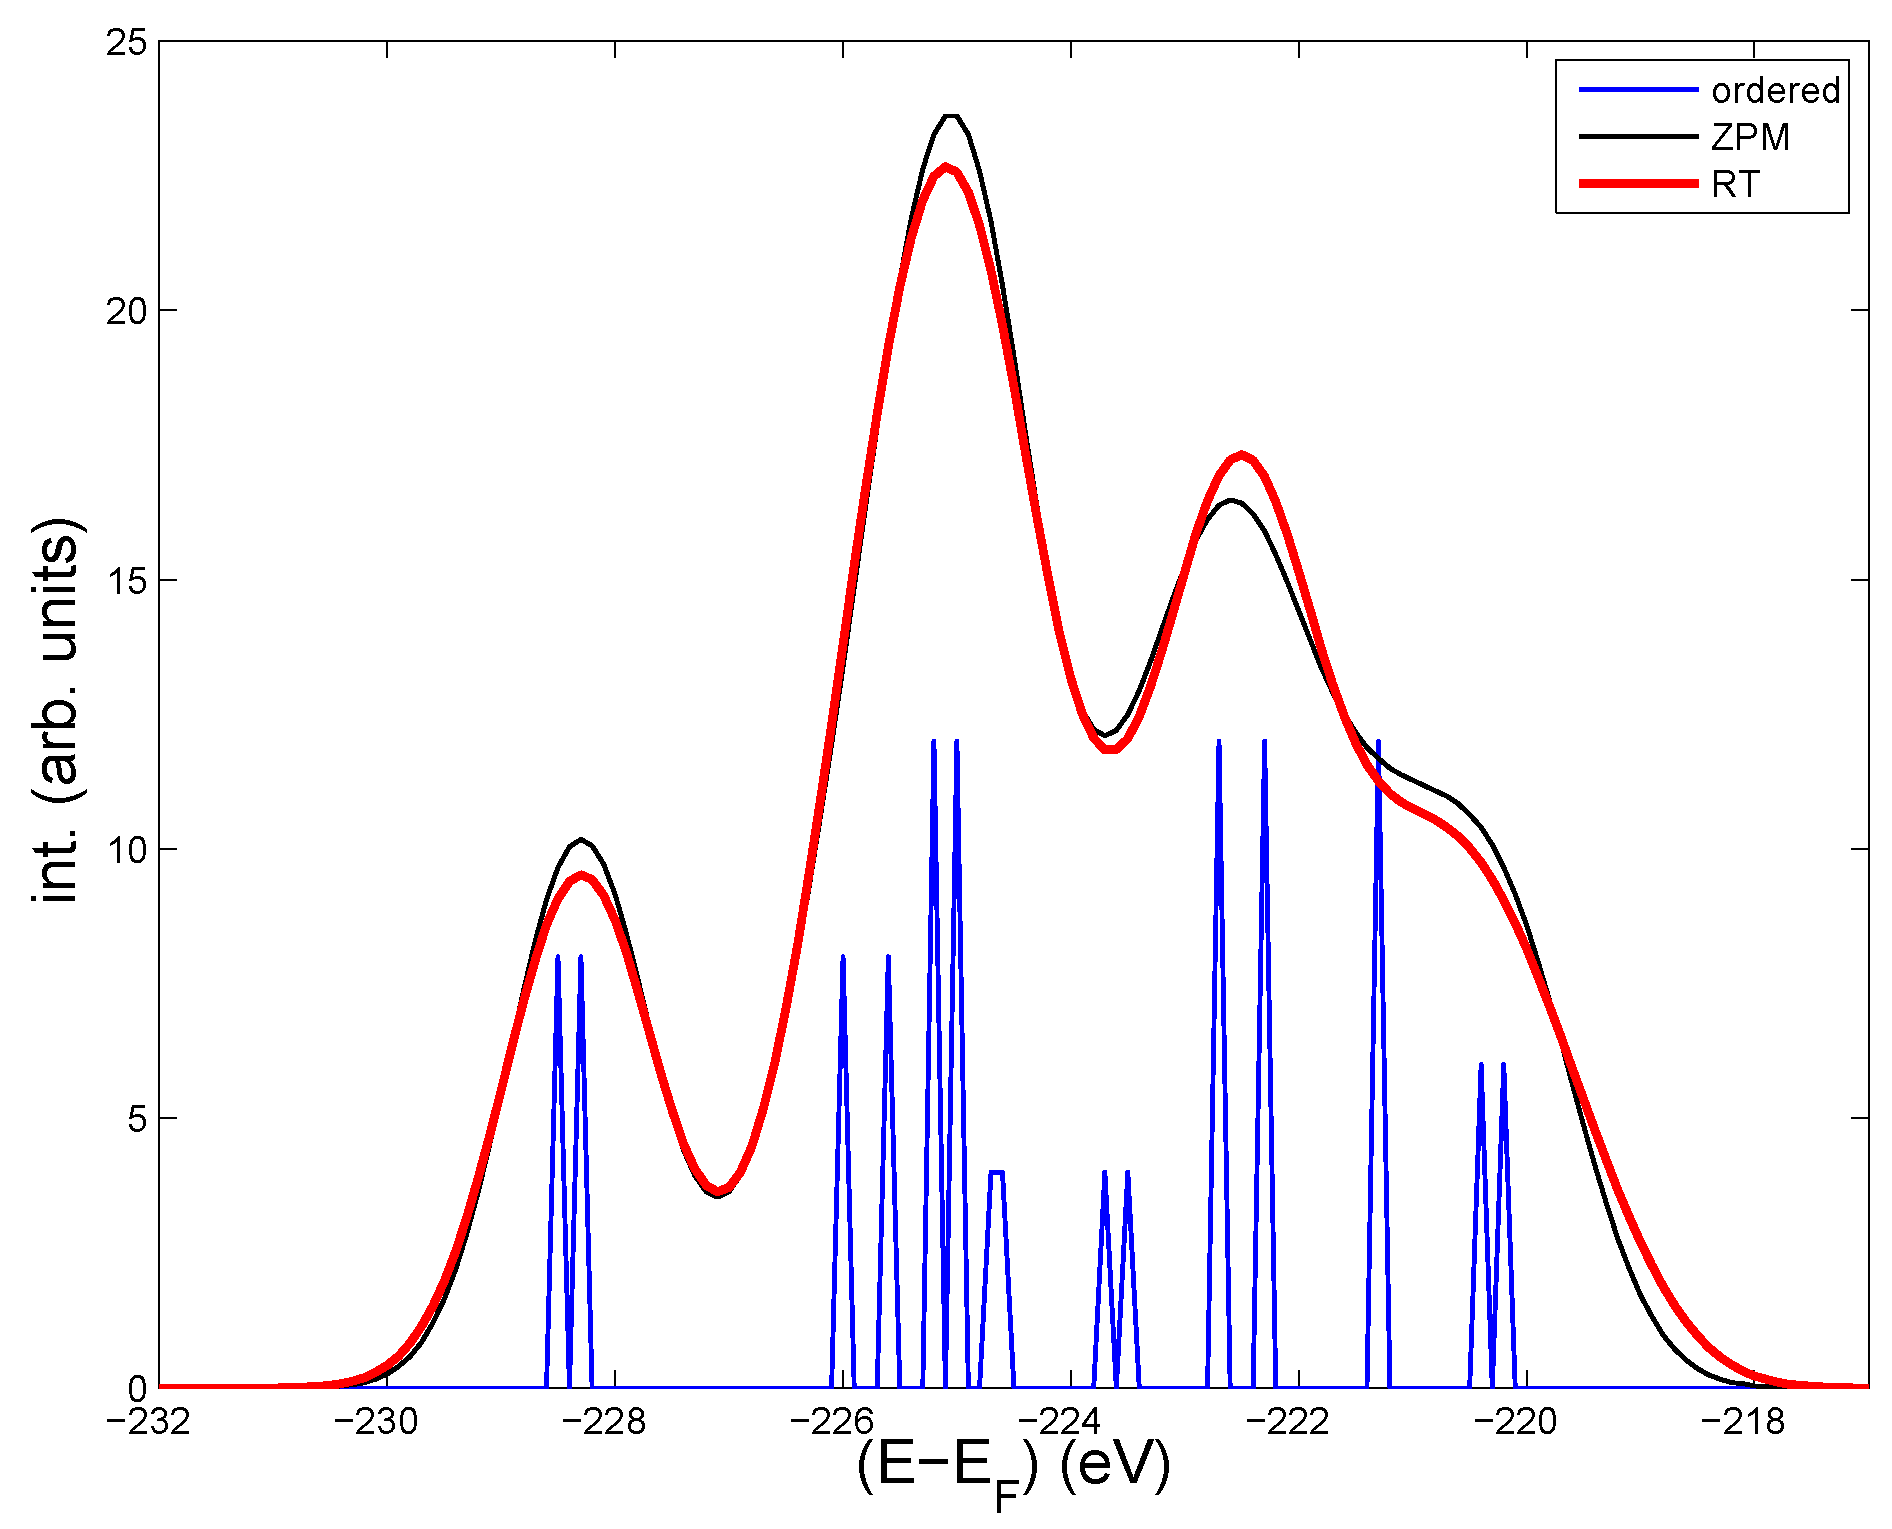
The Mo sites can be divided into three groups according to their local (the DOS at )and proximity to Li. The first group contains the four most distant Mo from Li, see [3]. They have a large local DOS at and determine the two bands that cross [12]. The second group has intermediate distances to the Li-atoms, and their DOS are quite low. Each Mo in these two groups are surrounded by octahedrons of oxygens, as can be seen in [3]. The last group contains the four Mo closest to Li, with practically no local DOS at , and each Mo is surrounded by a tetrahedron of oxygens. Within each group there are slight differences in the core levels(see Table 1), because the local differences in the structure make the Madelung potential different among the groups of Mo sites. The spread in core levels and in Table 1 is based on the variations of core levels on the different sites among the four disordered “ZPM” and five “RT” configurations, respectively. The statistics is limited, but it appears clear that the Mo near Li are most sensitive to disorder. This is coherent, because the screening is weakened by the low local DOS. Oppositely, on the high-DOS Mo’s in the first group, the spread of core levels is lowest. The core levels in the last group—those closest to Li—are least bound, and they make up the rightmost peak of the calculated intensities in Figure 1 from the ordered structure, the ZPM- and the RT-configurations, respectively. Thus, the three groups of Mo sites have quite separate 3d-core levels, and the peak to the right due to Mo’s near Li is most affected by disorder. Measurements at low and high T should therefore be most likely seen on the right hand side of the spectrum.
The intensities in Figure 1 contain all the spin-orbit split 3d-levels, and a Gaussian broadening of 1.5 eV to account for static disorder. Purple bronze has 10% Li vacancies, which most likely induce structural deformations around the vacancies. Other lattice defects and non-stoichiometric conditions will also deform the structure locally. Altogether, this adds up to a static disorder, which will modify the core levels by an unknown amount.
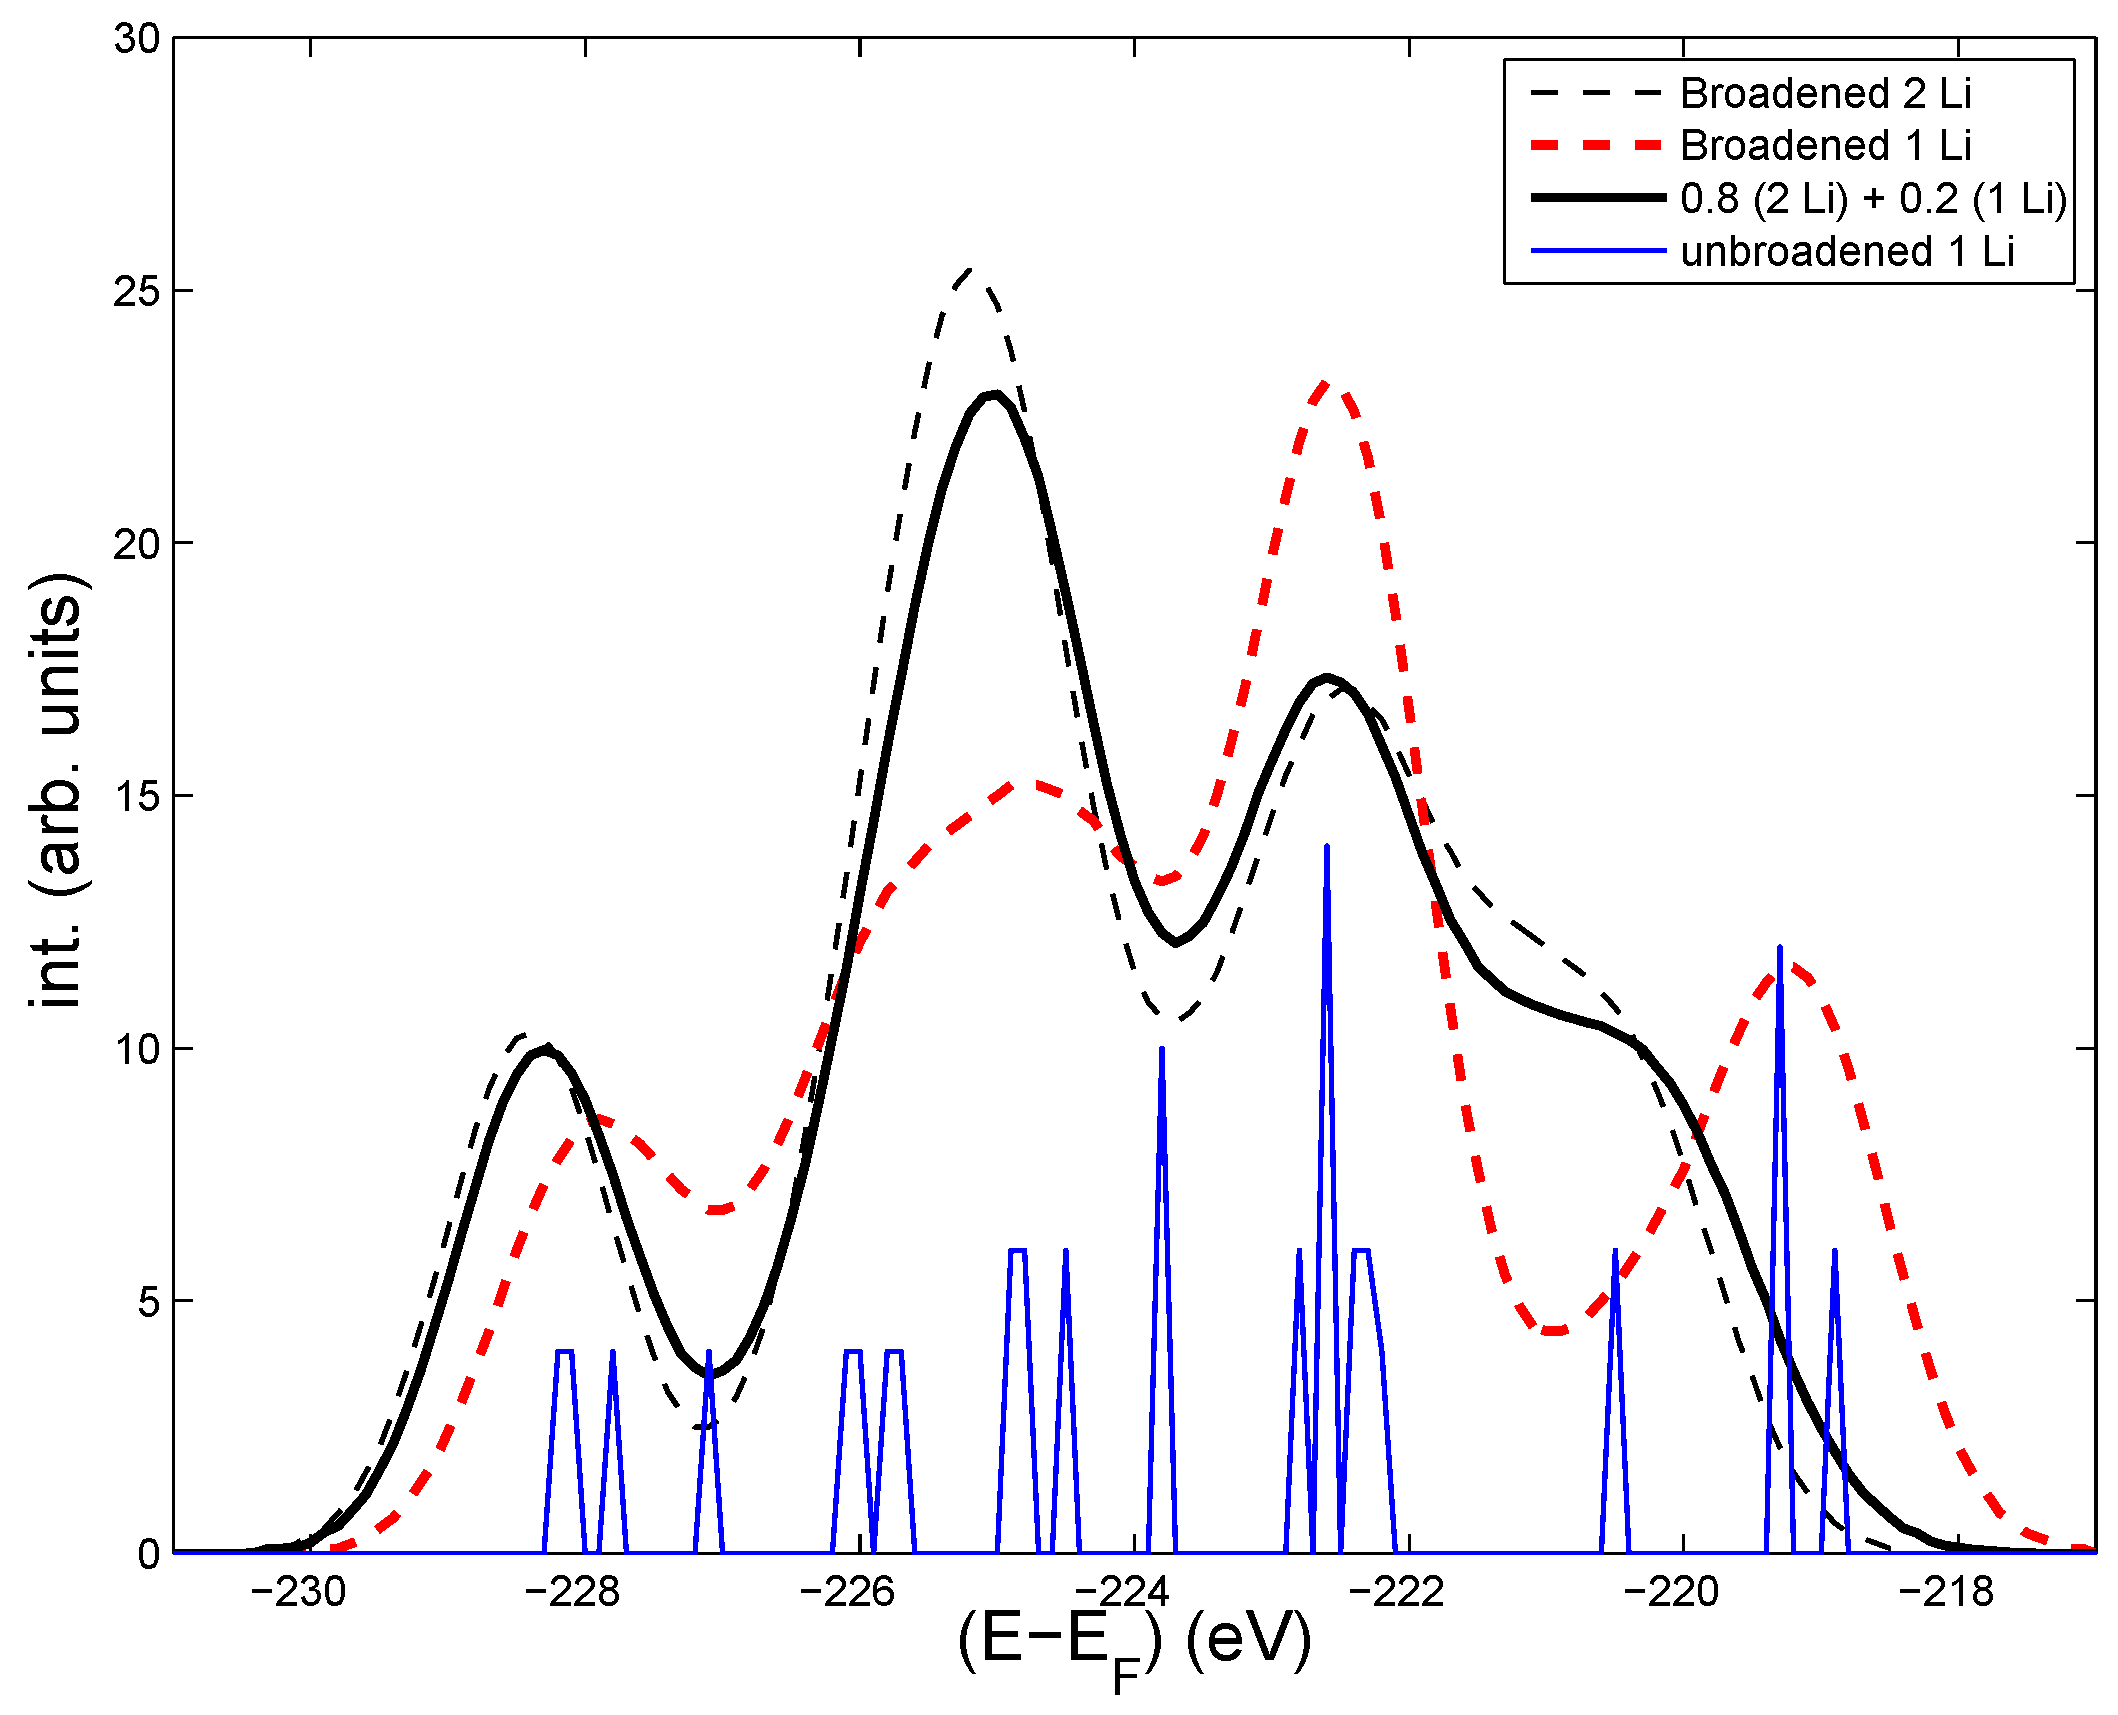
In order to get an idea of the sensitivity of the electronic structure to Li-vacancies, we made a calculation where one of the Li is missing, but where the structure is undistorted compared to the ideal structure. The resulting core level intensities are shown in Figure 2. As seen, the general shape of the Mo 3d-levels is different from the one for the stoichiometric case in Figure 1. The least bound 4s levels on Mo near Li are changing most, which is normal, since one Li is missing. Those Mo levels tend to be more isolated (increasing their energies) from the other levels. There are also some changes for the relative intensities at intermediate binding (Mo far from Li). A simple weighting of the two distributions (with adjustment of the Fermi levels to account for one less electron in the Li deficient case) is shown by the bold, red line. The core levels could also be modified by lattice relaxation around the missing Li. The sensitivity of the core level energies to a single Li vacancy indicates that some differences between the calculated and the measured shapes of the intensities can come from static disorders, but the strength of the T-independent broadening, in addition to that of ZPM, is not known. A Gaussian broadening of more than 1 eV is probably needed to account for the static disorder. However, an analysis of the relative T-dependent variations of calculated and measured intensities can still be made independently of the initial shape of the spectrum.
3. Conclusions
The calculations show T-dependent broadening of the 3d-core levels on Mo. However, static disorder due to Li vacancies interfere with the T-dependent effects. The degree of disorders differ at inequivalent Mo-sites and lead to larger broadening for sites near the Li. Note that the assumed structural data for the stoichiometric perfect unit cell in the calculations are coming from measurements on real purple bronze with defects, and that the measured Mo anisotropy parameter is largest for the Mo near Li [3]. Another source for discrepancy between experimental and theoretical T-dependences could come from different distortion amplitudes u, since σ is extrapolated from measurements in blue bronze [30]. These results on core level broadening give support to the conclusion [12] that it is difficult to observe the band separation in high precision ARPES [34,35,36], and the broadening from static and vibrational disorder might also mask the signature of Luttinger behavior near [34,35,37].
With all these precautions for purple bronze, it is suggested that T-dependent studies of core levels would be more revealing for other materials where static imperfections are unlikely. It can also be interesting to study magnetic T-dependent or pressure (P)-dependent transitions through studies of core levels. It has been shown theoretically that the spin-splitting of core levels in face-centered cubic (fcc) Cerium will change drastically at the -dependent α-γ transition [22,38]. The magnetic phase has a wide spread of individual spin-polarized core levels, because of local thermally-induced lattice distortions.
Acknowledgments
I am grateful to J.D. Denlinger for useful discussions about preliminary experimental results.
Conflicts of Interest
The author declares no conflict of interest.
References
- McCarroll, W.H.; Greenblatt, M. Preparation of lithium molybdenum oxide bronzes by a temperature gradient flux growth technique. J. Solid State Chem. 1984, 54, 282. [Google Scholar] [CrossRef]
- Schlenker, C.; Schwenk, H.; Escribe-Filippini, C.; Marcus, J. Superconducting properties of the low dimensional purple bronze Li0.9Mo6O17. Physica B 1985, 135, 511. [Google Scholar] [CrossRef]
- Onoda, M.; Toriumi, K.; Matsuda, Y.; Sato, M. Crystal structure of lithium molybdenum purple bronze Li0.9Mo6O17. J. Solid State Chem. 1987, 66, 163. [Google Scholar] [CrossRef]
- Greenblatt, M.; McCarroll, W.H.; Neifeld, R.; Croft, M.; Waszczak, J.V. Quasi two-dimensional electronic properties of the lithium molybdenum bronze, Li0.9Mo6O17. Solid State Commun. 1984, 51, 671. [Google Scholar] [CrossRef]
- Whangbo, M.-H.; Canadell, E. Band electronic structure of the lithium molybdenum purple bronze Li0.9Mo6O17. J. Am. Chem. Soc. 1988, 110, 358. [Google Scholar] [CrossRef]
- Popović, Z.S.; Satpathy, S. Density-functional study of the Luttinger liquid behavior of the lithium molybdenum purple bronze Li0.9Mo6O17. Phys. Rev. B 2006, 74, 045117. [Google Scholar] [CrossRef]
- Hager, J.; Matzdorf, R.; He, J.; Jin, R.; Mandrus, D.; Cazalilla, M.A.; Plummer, E.W. Non-Fermi-Liquid Behavior in Quasi-One-Dimensional Li0.9Mo6O17. Phys. Rev. Lett. 2005, 95, 186402. [Google Scholar] [CrossRef] [PubMed]
- Xu, X.; Bangura, A.F.; Analytis, J.G.; Fletcher, J.D.; French, M.M.J.; Shannon, N.; He, J.; Zhang, S.; Mandrus, D.; Jin, R.; et al. Directional Field-Induced Metallization of Quasi-One-Dimensional Li0.9Mo6O17. Phys. Rev. Lett. 2009, 102, 206602. [Google Scholar] [CrossRef] [PubMed]
- Podlich, T.; Klinke, M.; Nansseu, B.; Waelsch, M.; Bienert, R.; He, J.; Jin, R.; Mandrus, D.; Matzdorf, R. Luttinger liquid behaviour of Li0.9Mo6O17 studied by scanning tunnelling microscopy. J. Phys. Condens. Matter 2013, 25, 014008. [Google Scholar] [CrossRef] [PubMed]
- Dos Santos, C.A.M.; White, B.D.; Yu, Y.-K.; Neumeier, J.J.; Souza, J.A. Dimensional Crossover in the Purple Bronze Li0.9Mo6O17. Phys. Rev. Lett. 2007, 98, 266405. [Google Scholar] [CrossRef] [PubMed]
- Chakhalian, J.; Salman, Z.; Brewer, J.; Froese, A.; He, J.; Mandrus, D.; Jin, R. Magnetism in purple bronze Li0.9Mo6O17. Physica B 2005, 359–361, 1333. [Google Scholar] [CrossRef]
- Jarlborg, T.; Chudzinski, P.; Giamarchi, T. Effects of thermal and spin fluctuations on the band structure of purple bronze Li2Mo12O34. Phys. Rev. B 2012, 85, 235108. [Google Scholar] [CrossRef]
- Merino, J.; McKenzie, R.H. Effective Hamiltonian for the electronic properties of the quasi-one-dimensional material Li0.9Mo6O17. Phys. Rev. B 2012, 85, 235128. [Google Scholar] [CrossRef]
- Nuss, M.; Aichhorn, M. Effective model for the electronic properties of quasi-one-dimensional purple bronze Li09Mo6O17 based on ab initio calculations. Phys. Rev. B 2014, 89, 045125. [Google Scholar]
- Hedin, L.; Rosengren, A. On temperature broadening in X-ray spectra of metals. J. Phys. F: Metal Phys. 1977, 7, 1339. [Google Scholar] [CrossRef]
- McKenzie, R.H.; Wilkins, J.W. Effect of lattice zero-point motion on electronic properties of the Peierls-Fröhlich state. Phys. Rev. Lett. 1992, 69, 1085. [Google Scholar] [CrossRef] [PubMed]
- Dugdale, S.B.; Jarlborg, T. Thermal disorder versus correlation in Compton profiles from alkali metals. Solid State Commun. 1998, 105, 283. [Google Scholar] [CrossRef]
- Jarlborg, T. Importance of thermal disorder and electronic occupation for temperature dependence of optical conductivity in FeSi and MnSi. Phys. Rev. B 2007, 76, 205105. [Google Scholar] [CrossRef]
- Jarlborg, T. Electronic structure and properties of pure and doped ϵ-FeSi from ab initio local-density theory. Phys. Rev. B 1999, 59, 15002. [Google Scholar] [CrossRef]
- Pedrazzini, P.; Wilhelm, H.; Jaccard, D.; Jarlborg, T.; Schmidt, M.; Helfland, M.; Akselrud, L.; Yuan, H.Q.; Schwarz, U.; Grin, Y.; et al. Metallic State in Cubic FeGe Beyond Its Quantum Phase Transition. Phys. Rev. Lett. 2007, 98, 047204. [Google Scholar] [CrossRef] [PubMed]
- Delaire, O.; Marty, K.; Stone, M.B.; Kent, P.R.C.; Lucas, M.S.; Abernathy, D.L.; Mandrus, D.; Sales, B.C. Phonon softening and metallization of a narrow-gap semiconductor by thermal disorder. Proc. Narl. Acad. Sci. USA 2011, 108, 4725. [Google Scholar] [CrossRef]
- Jarlborg, T. Role of thermal disorder for magnetism and the α-γ transition in cerium: Results from density-functional theory. Phys. Rev. B 2014, 89, 184426. [Google Scholar] [CrossRef]
- Giustino, F.; Louie, S.G.; Cohen, M.L. Electron-Phonon Renormalization of the Direct Band Gap of Diamond. Phys. Rev. Lett. 2010, 105, 265501. [Google Scholar] [CrossRef] [PubMed]
- Jarlborg, T.; Bianconi, A. Breakdown of the Migdal approximation at Lifshitz transitions with giant zero-point motion in the H3S superconductor. Sci. Rep. 2016, 6, 24816. [Google Scholar] [CrossRef] [PubMed]
- Bianconi, A.; Jarlborg, T. Superconductivity above the lowest Earth temperature in pressurized sulfur hydride. Europhys. Lett. 2015, 112, 37001. [Google Scholar] [CrossRef]
- Cannuccia, E.; Marini, A. Effect of the quantum zero-point atomic motion on the optical and electronic properties of diamond and trans-polyacetylene. Phys. Rev. Lett. 2011, 107, 255501. [Google Scholar] [CrossRef] [PubMed]
- Ziman, J.M. Principles of the Theory of Solids; Cambridge University Press: New York, NY, USA, 1971. [Google Scholar]
- Jarlborg, T.; Arbman, G. The electronic structure of some A15 compounds by semiself-consistent band calculations. J. Phys. F: Metal Phys. 1977, 7, 1635. [Google Scholar] [CrossRef]
- Grimvall, G. Thermophysical Properties of Materials; North-Holland: Amsterdam, The Netherlands, 1986. [Google Scholar]
- Requardt, H.; Currat, R.; Monceau, P.; Lorenzo, J.E.; Dianoux, A.J.; Lasjaunias, J.C.; Marcus, J. The phonon density of states and low-temperature specific heat: The blue bronze K0.3MoO3 and the platinum chain compound KCP. J. Phys. Condens. Matter 1997, 9, 8639. [Google Scholar] [CrossRef]
- Andersen, O.K. Linear methods in band theory. Phys. Rev. B 1975, 12, 3060. [Google Scholar] [CrossRef] [Green Version]
- Barbiellini, B.; Dugdale, S.B.; Jarlborg, T. The EPMD-LMTO program for electron–positron momentum density calculations in solids. Comput. Mater. Sci. 2003, 28, 287. [Google Scholar] [CrossRef]
- Kohn, W.; Sham, L.J. Self-consistent equations including exchange and correlation effects. Phys. Rev. 1965, 140, A1133. [Google Scholar] [CrossRef]
- Wang, F.; Alvarez, J.V.; Allen, J.W.; Mo, S.-K.; He, J.; Jin, R.; Mandrus, D.; Höchst, H. Quantum critical scaling in the single-particle spectrum of a novel anisotropic metal. Phys. Rev. Lett. 2009, 103, 136401. [Google Scholar] [CrossRef] [PubMed]
- Wang, F.; Alvarez, J.V.; Mo, S.-K.; Allen, J.W.; Gweon, G.H.; He, J.; Jin, R.; Mandrus, D.; Höchst, H. New Luttinger-Liquid Physics from Photoemission on Li0.9Mo6O17. Phys. Rev. Lett. 2006, 96, 196403. [Google Scholar] [CrossRef] [PubMed]
- Dudy, L.; Denlinger, J.D.; Allen, J.W.; Wang, F.; He, J.; Hitchcock, D.; Sekiyama, A.; Suga, S. Photoemission spectroscopy and the unusually robust one-dimensional physics of lithium purple bronze. J. Phys. Condens. Matter 2013, 25, 014007. [Google Scholar] [CrossRef] [PubMed]
- Gweon, G.H.; Denlinger, J.D.; Allen, J.W.; Olson, C.G.; Hoechst, H.; Marcus, J.; Schlenker, C. Non-Fermi Liquid Angle Resolved Photoemission Line Shapes of Li0.9Mo6O17. Phys. Rev. Lett. 2000, 85, 3985. [Google Scholar] [CrossRef] [PubMed]
- Jarlborg, T.; Moroni, E.G.; Grimvall, G. α-γ transition in Ce from temperature-dependent band-structure calculations Phys. Rev. B 1997, 55, 1288. [Google Scholar] [CrossRef]
Figure 1.
Calculated core Mo- 3d levels in the undistorted cell of LiMoO (blue thin lines). Intensities from all Mo -3d levels for four disordered structures at low T “zero-point motion” (ZPM) (thin black line), and for five disordered structures corresponding to room temperature (RT) (bold red line). A Gaussian broadening of 1.5 eV is added in the ZPM and RT cases to account for static disorder. The effect from the same broadening on the core levels in the ordered cell is shown in Figure 2.

Figure 2.
Energy distribution of the Mo-3d core levels (including a Gaussian broadening of about 1.5 eV) in LiMoO (black dashed, thin line), for LiMoO (red dashed, bold line), and a superposition of the two previous curves with weights 0.8 and 0.2, respectively. The core levels in LiMoO without Gaussian broadening is shown by the thin (blue) line.


Table 1.
Energies relative to the Fermi energy, , of the upper spin-orbit split Mo 3d-core levels and the average energy shifts and from zero-point motion (ZPM) and thermal disorder at room temperature (RT), respectively. The lower of the spin-orbit split levels are 3.3 eV more bound. All energies are in eV. The surrounding O-coordinations are octahedron (oct.) or tetrahedron (tet.).
| Level | ϵ | ||
|---|---|---|---|
| Mo far from Li (oct. O) | 0.14 | 0.23 | |
| Mo far from Li (oct. O) | 0.10 | 0.12 | |
| Mo intermed. (oct. O) | 0.13 | 0.27 | |
| Mo intermed. (oct. O) | 0.17 | 0.34 | |
| Mo near Li (tet. O) | 0.23 | 0.44 | |
| Mo near Li (tet. O) | 0.25 | 0.66 |
© 2016 by the author; licensee MDPI, Basel, Switzerland. This article is an open access article distributed under the terms and conditions of the Creative Commons Attribution (CC-BY) license ( http://creativecommons.org/licenses/by/4.0/).
Share and Cite
MDPI and ACS Style
Jarlborg, T. Calculated Effects of Disorder on the Mo Core Levels in Purple Bronze Li2Mo12O34. Condens. Matter 2016, 1, 5. https://doi.org/10.3390/condmat1010005
AMA Style
Jarlborg T. Calculated Effects of Disorder on the Mo Core Levels in Purple Bronze Li2Mo12O34. Condensed Matter. 2016; 1(1):5. https://doi.org/10.3390/condmat1010005
Chicago/Turabian StyleJarlborg, Thomas. 2016. "Calculated Effects of Disorder on the Mo Core Levels in Purple Bronze Li2Mo12O34" Condensed Matter 1, no. 1: 5. https://doi.org/10.3390/condmat1010005