Correlated Disorder in Myelinated Axons Orientational Geometry and Structure


1
Institute of Crystallography, CNR, Via Salaria Km 29.300, Monterotondo, I-00015 Roma, Italy
2
Rome International Center of Materials Science (RICMASS), Via dei Sabelli 119A, 00185 Roma, Italy
3
Department of Physics, Harvard University, Cambridge, 02138 MA, USA
*
Author to whom correspondence should be addressed.
Condens. Matter 2017, 2(3), 29; https://doi.org/10.3390/condmat2030029
Submission received: 3 August 2017
/
Revised: 4 September 2017
/
Accepted: 6 September 2017
/
Published: 11 September 2017
(This article belongs to the Special Issue Complex Nanoscale Geometry and Dynamics at the Frontier between Biology and Material Science)
Abstract
:While the ultrastructure of myelin is considered a quasi-crystalline stable system, nowadays its multiscale complex dynamics appear to play a key role in its functionality, degeneration and repair processes following neurological diseases and trauma. In this work, we investigated the fluctuation of the myelin supramolecular assembly by measuring the spatial distribution of orientation fluctuations of axons in a Xenopus Laevis sciatic nerve associated with nerve functionality. To this end, we used scanning micro X-ray diffraction (SμXRD), a non-invasive technique that has already been applied to other heterogeneous systems presenting complex geometries from microscale to nanoscale. We found that the orientation of the spatial fluctuations of fresh axons show a Levy flight distribution, which is a clear indication of correlated disorder. We found that the Levy flight distribution was missing in the aged nerve prepared in an unfresh state. This result shows that the spatial distribution of axon orientation fluctuations in unfresh nerve state loses the correlated disorder and assumes a random disorder behavior. This work provides a deeper understanding of the ultrastructure-function nerve relation and paves the way for the study of other materials and biomaterials using the SμXRD technique to detect fluctuations in their supramolecular structure.
1. Introduction
Myelin is a multilamellar insulating structure that wraps axons of some vertebrate neurons, both in the central and peripheral nervous system (CNS, PNS). It has as its main functions the protection, nourishment and enhancement of the transmission of nerve impulses through saltatory conduction [1,2].
We focus our attention on the myelin of a sciatic nerve—a member of the PNS—of a frog Xenopus Leavis. In the PNS, the myelin sheath is formed by the spiral winding of the Schwann cells around the axon. It has a periodic multi-lamellar structure, whose unit is made up of the repetition of four layers: cytoplasmic apposition of Schwann cells (cyt), lipidic membrane (lpg) extracellular apposition of Schwann cells (ext) and another lipidic membrane (lpg). The available information about the myelin layers has been extracted from measurements performed by space averaged laboratory X-Ray Diffraction (XRD) [3,4,5,6], electron microscopy (EM) [6,7] and neutron diffraction [8].
The study of myelin, using its diffractive nature, has a long history of experiments from the early 1950s to today. These measurements have allowed researchers to determine the structure of myelin layers under various experimental conditions; however, experimental methods probing the reciprocal k-space at high resolutions, like X-ray or neutron diffraction, have no spatial resolution, and therefore have provided the myelin lattice structure information averaged over sections of the sample as large as the incident beam size. These experimental structural probes provide a description of the assembly of myelin supramolecular structure, resulting in a highly ordered liquid crystal structure. However, this picture of a homogeneous structure for myelin is in contrast with the emerging picture of the supra-molecular assembly of biomaterials, which is a spontaneous process occurring widely in medicine [9], photosynthetic processes [10], and in nanotechnology [11]. In fact, the common feature of the resulting supramolecular self-assembled structures is the coexistence, in different spaces, spots of partially crystalline and disordered nanoscale regions. In fact, supramolecular self-assembly involves very weak intermolecular interactions and results in quasi stationary states out-of-equilibrium. This fundamental biological process is poorly understood, and myelin self-assembled supramolecular structures provide one of the simplest biological cases in which basic aspects of statistical physics can be investigated.
It has recently been proposed that quantum criticality plays a key role in the origin of life [12]; therefore, spatial compositional heterogeneity is expected in the assembly of lipid membranes [13]. The most significant indicator for proximity to a critical point is critical opalescence, due to the fact that, as the critical point is approached, the sizes of the regions of the two competing phases (ordered and disordered regions) begin to fluctuate over increasingly large length scales [14]. In order to experimentally probe spatial fluctuations in the myelin ultrastructure, there is a need for unique probes that probe the spatial distribution in the real space of the order in the k-space.
Here, we have investigated the spatial distribution of the myelin orientation order in a nerve using the novel technique scanning micro X-ray diffraction (SμXRD) [15,16,17,18,19,20,21,22], which allows us to probe both the real space and the k-space with high resolution.
Non-invasive SμXRD has been used to study the spatial fluctuations of the myelin ultrastructure period [15,17] or the single axon structure [20,21], but as yet, no quantitative measurement of the spatial fluctuations of the orientation of axons within the nerve has been reported.
Thanks to the ability to focus synchrotron radiation X-ray beams to micron size on biological samples, this method paves the way for a new field of statistical spatial fluctuations of biological systems (tissues, fibers, etc.), which can be investigated from microscale down to nanoscale, beyond the known averaged structures seen at larger scales. Moreover, in the case of myelin, there is great interest around the study of its structural fluctuations, and their relation to myelin proteins [8]. In this context, this new approach can provide unique information on the damage and degeneration of the myelin sheath, like demyelization.
In this work, we have focused our attention on the fluctuations in the orientation of myelinated axons in the sciatic nerve, which is associated with nerve functionality, measuring the spatial distribution of the orientation fluctuations of axons.
Here we have evaluated the axon orientations and their fluctuations in the nerve, using a statistical physics interpretation of SμXRD on the sciatic nerve myelin of a frog Xenopus Laevis. We measured axon myelin orientation point by point, using a synchrotron radiation X-ray beam focused to micrometric dimensions at the ID 13 beamline at the European synchrotron radiation facility, ESRF, in Grenoble [15,16,17,18,19,20,21]. Afterwards, we applied statistical physics tools to the big data set of diffraction patterns collected to unveil the “statistical distributions of the fluctuating myelin angular order”.
Our results indicate that (i) the distribution of the orientation fluctuations of the axons in the fresh functional sciatic nerve shows a Levy probability distribution, with large fluctuations typical of quantum matter and complex systems [22,23,24,25,26,27]; and (ii) the axons’ angular distribution becomes randomly distributed in the early stages of degeneration of myelin following 18 h ageing in a culture, at room temperature without oxygenation and insertion of Adenosine Tri-Phosphate (ATP). This loss of structurally correlated disorder is accompanied by an increased rigidity in the system. The results show that our statistical analysis of SμXRD appears to be a powerful tool to determine spatial fluctuations of different functional states of biological matter.
2. Results and Discussion
2.1. Axon Orientation Fluctuations
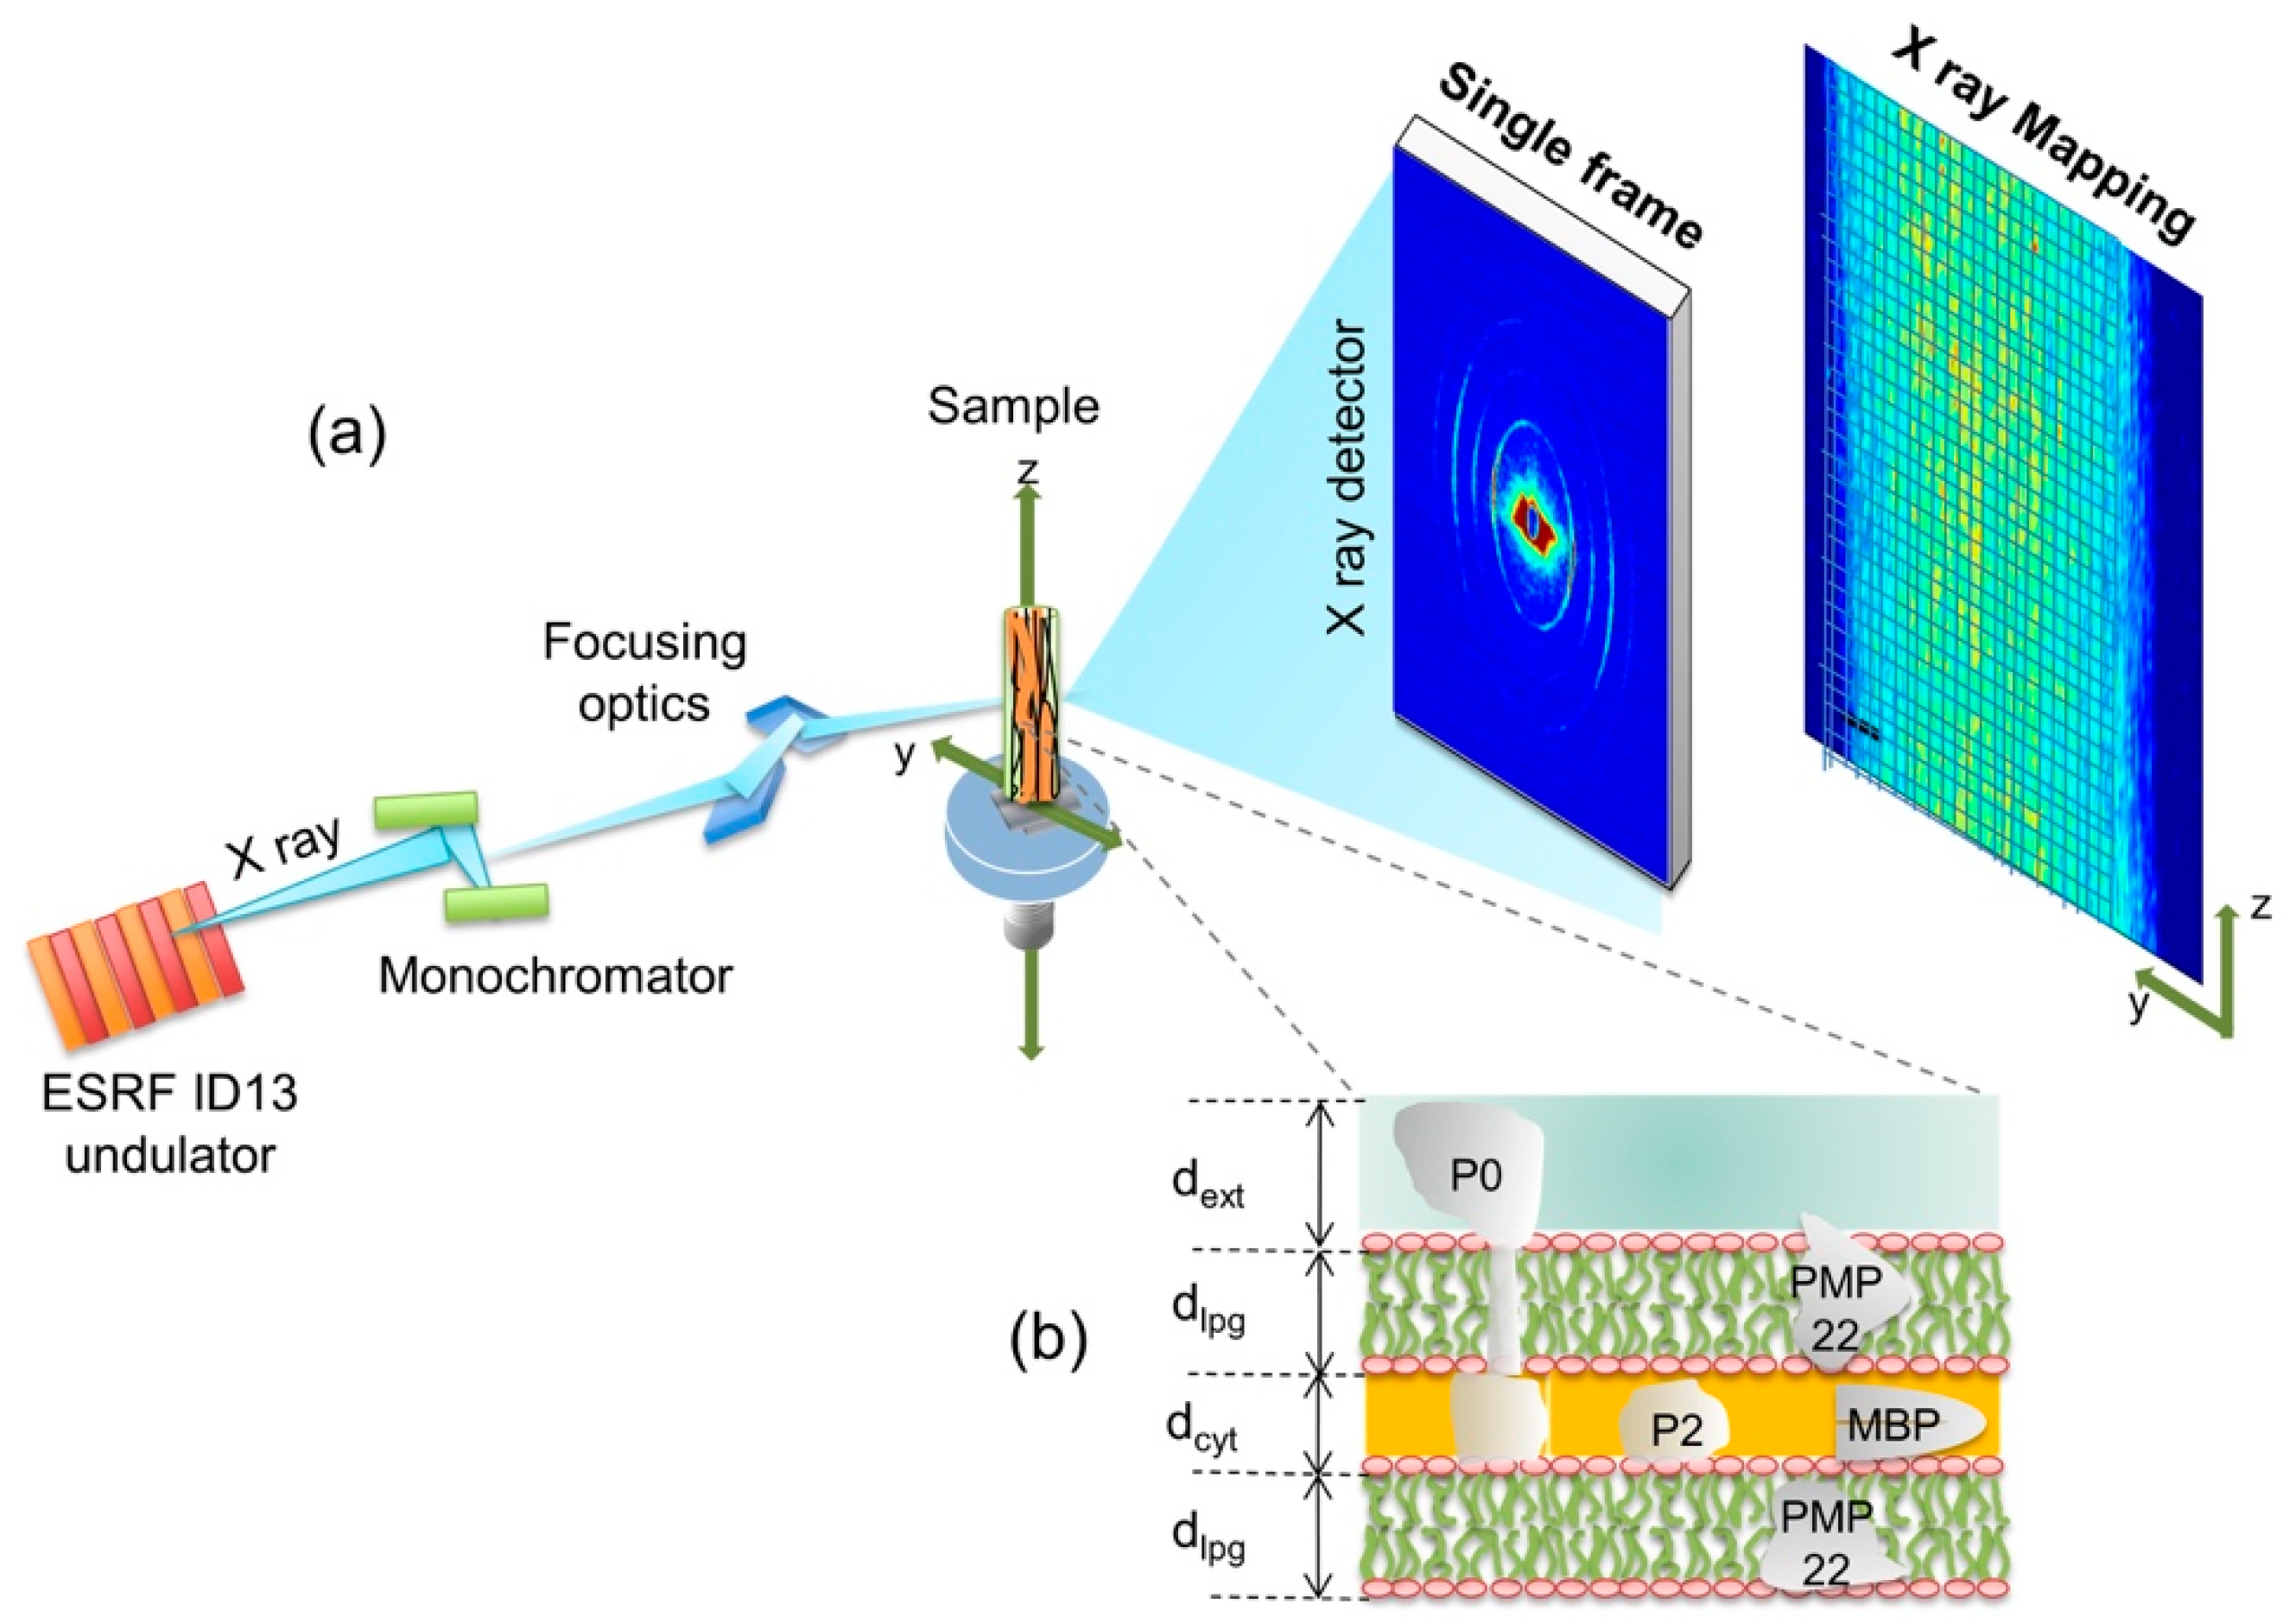
The experimental apparatus for the SμXRD is shown schematically in Figure 1a. A single nerve of frog, inserted in a capillary, is placed on the sample motorized holder. The investigated nerves have a thickness of 0.81 ± 0.01 mm, composed of myelinated axons running vertically almost parallel to the nerve walls and perpendicular to the X-ray beam. The unit of the myelin multi-lamellar ultrastructure is shown in Figure 1b. It is made of the stacking of (i) one cytoplasmatic apposition (cyt), (ii) one lipidic membrane (lpg), (iii) one extracellular apposition (ext), and (iv) another lipidic mambrane (lpg) [3,4,5]. The thickness of the period sublayers, ext, lpg and cyt are named dext, dlpg and dcyt as indicated in Figure 1b.
The quasi-crystalline character of its ultrastructure gives rise to a diffraction pattern made of 4 centrosymmetric rings, shown in the single frame picture of Figure 1a and Figure 2a.
The investigated samples, sciatic nerves, contain several hundred axons, often myelinated. The axons in the nerve could assume different orientations, changing from one illuminated spot of the sample to another. Therefore, by using SμXRD it is possible to map the orientation of the myelin packing.
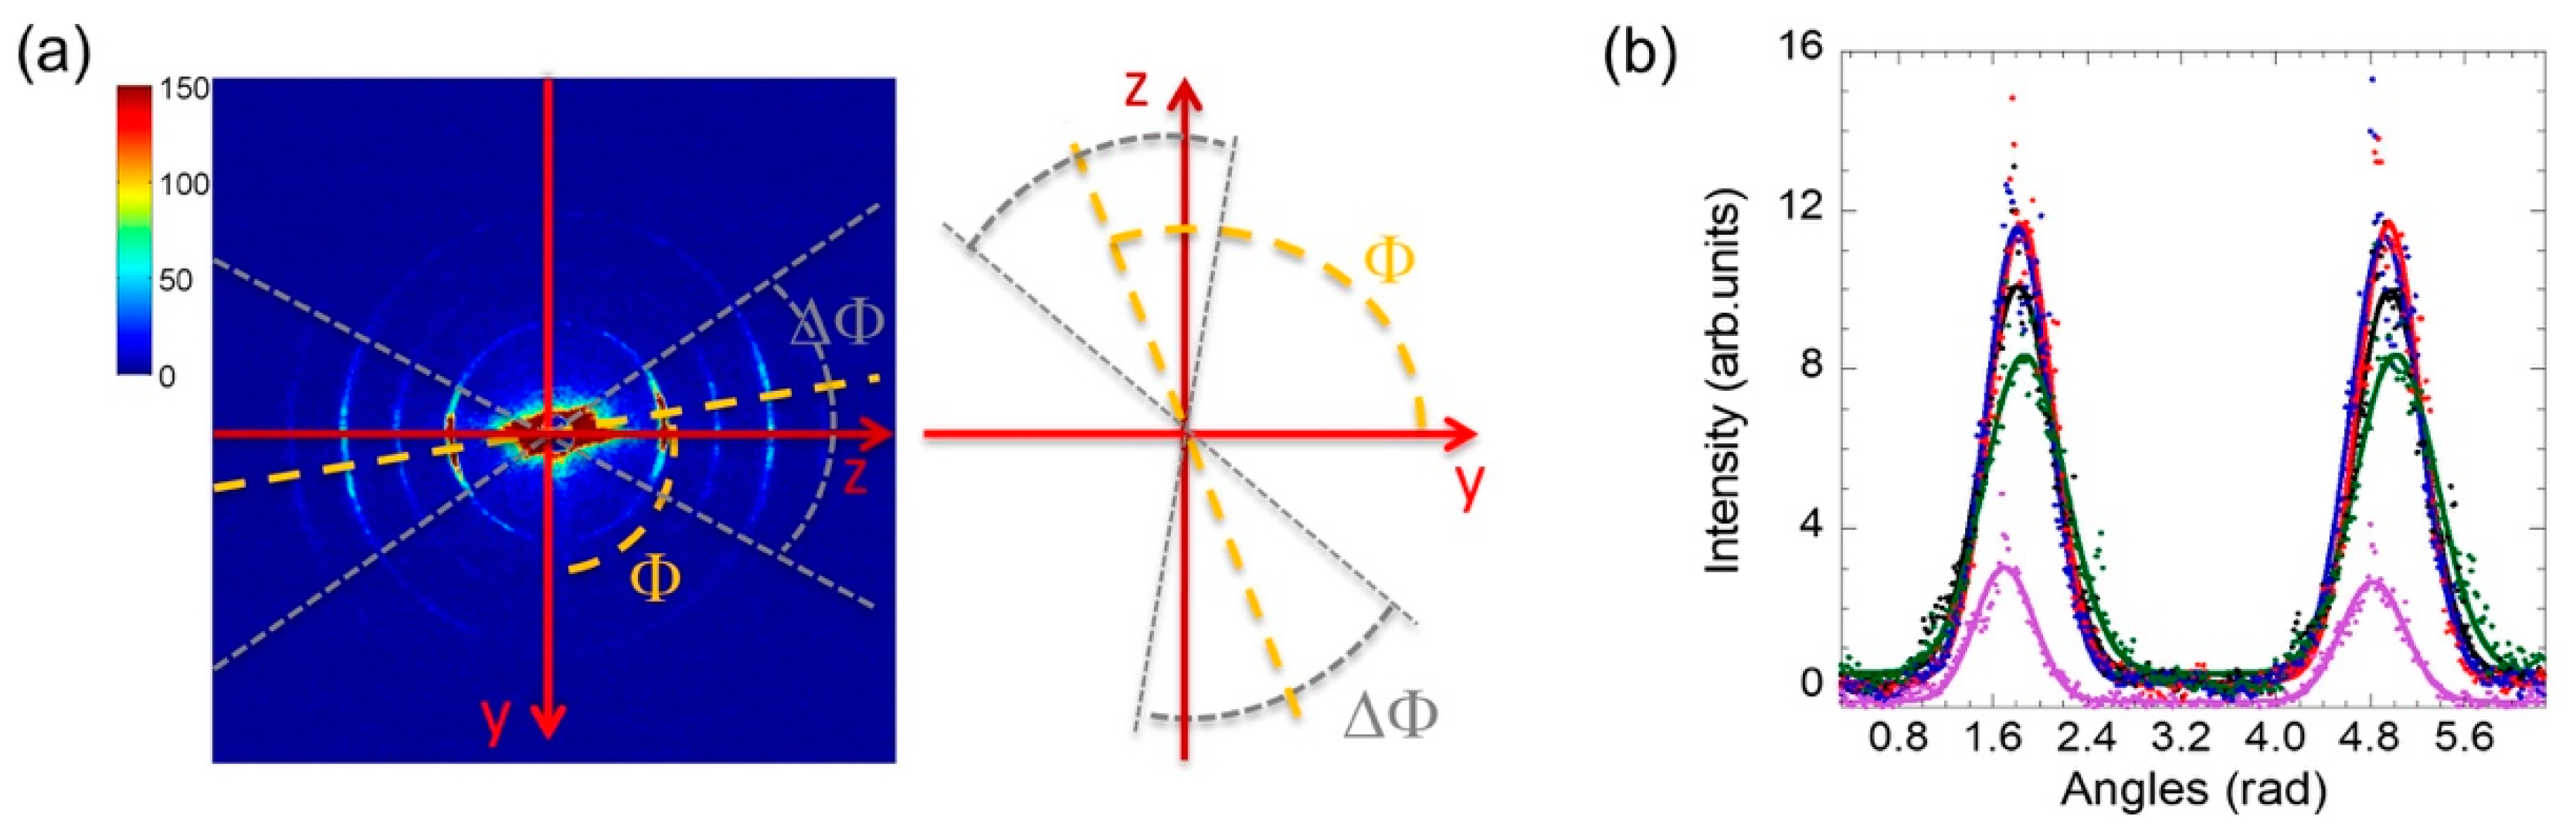
To determine the orientation of axons, we analyzed the 1-D angular distribution of the diffracted intensity, I(Φ), as a function of azimuthal angle (Φ) for each measured frame taken on each 1 μm2 illuminated spot in the sample. Figure 2 shows a typical image of the 2D diffraction pattern collected for a particular spot. Multiple curves I(Φ) collected at different spots are shown in Figure 2b.
The arc amplitudes ΔΦ in the 2D diffraction frames represent the spread of orientation of the lamellae, which also depends on the number of nodes of Ranvier (also known as myelin-sheath gaps, occurring along a myelinated axon between different wrapped glia cells, where the axolemma is exposed to the extracellular space) present in the illumined spots.
The curves I(Φ) show two peaks separated by π radians or 180°. The two peaks collected for each illuminated spot on the nerve are fitted with two Gaussians. The average Full Width at Half Maximum (FWHM) ΔΦ of the two Gaussian fits (Figure 2b) give the orientation spread of the axon orientations in the illuminated spot. The centers of the Gaussians, Φ0, give the mean orientation as described in detail in Materials and Methods. For each spot, it is therefore possible to collect the value of ΔΦ, normalized to the mean value, ΔΦ0, i.e., ΔΦ/ΔΦ0, which provides a non-dimensional parameter measuring the amplitude of the axon orientation in each spot.
2.2. Mapping of Axon Orientation Fluctuations
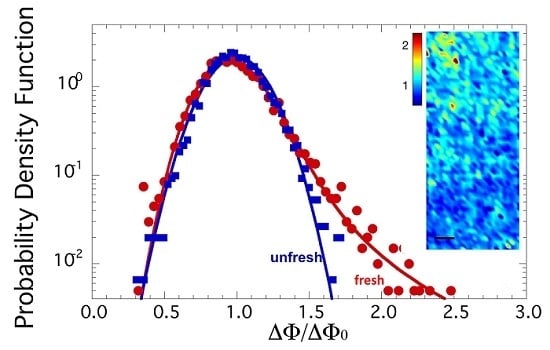
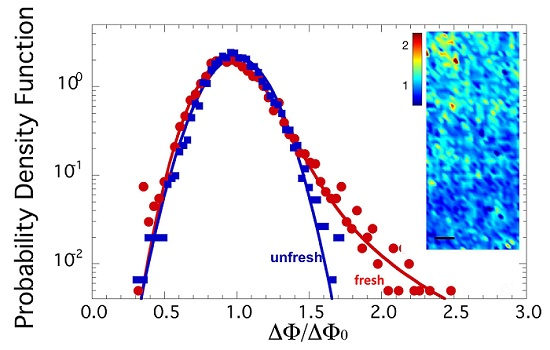
The spatial distribution of azimuthal dispersion may be visualized through the spatial map of ΔΦ/ΔΦ0 in selected illuminated spots of fresh and unfresh samples. Two typical color maps of orientation fluctuation amplitude ΔΦ/ΔΦ0 in fresh and unfresh samples, in an area of 300 × 125 μm2, are depicted in Figure 3a, to the left and to the right, respectivley. The probability density functions (PDF) of orientation fluctuations ΔΦ/ΔΦ0 for the two samples are plotted in Figure 2b. The PDF of ΔΦ/ΔΦ0 for the fresh sample shows a skewed line shape with a fat tail, which we found could be fitted by a Levy stable distribution [28,29,30,31,32,33], as shown in Figure 3b by the solid red curve. Recently, the Levy stable distribution has found increasing interest in several applications in diverse fields for describing complex phenomena [28,29,30,31,32,33]. This kind of probability distribution does not have an analytical expression, but is represented by a characteristic function defined by four parameters: stability index α, skewness parameter β, scale parameter γ (width of the distribution) and location parameter δ. These parameters vary in the ranges of 0 < α ≤ 2, −1 ≤ β ≤ 1, γ > 0 and δ real. For Gaussian distribution, the stability parameter becomes α = 2.
Here we have used basic functions in the numerical evaluation of these parameters as described by Liang and Chen [34]. The Levy fitting curve, indicated by the red line in Figure 3b, gives the following parameters for the Levy distribution:
- (i)
- stability index of 1.79 ± 0.02 (<2);
- (ii)
- scale parameter: γ of 0.141 ± 0.005.
where the location index and skewness indices assume unitary value.
Particularly interesting are the data in the PDF with higher angular distribution values. Indeed, this PDF shows a long tail, which emphasizes the presence of rare events of axons interacting between them with high fluctuations (ΔΦ/ΔΦ0 = 2.5), corresponding to ΔΦ of about 70°, being ΔΦ0 = 33.5° ± 0.4 in both fresh and unfresh samples. These results could be an indication of the system’s vitality in the fresh state of sciatic nerves, when the nerve has been just extracted.
In order to check if these fluctuations are an intrinsic feature of the functional state of myelin, we measured an aged state of unfresh myelin of a sciatic nerve left 18 h in a Ringer solution after dissection, without oxygenation and addition of ATP. In this unfresh sample, the PDF of ΔΦ/ΔΦ0 follows a Gaussian trend, as shown by the blue line in Figure 3b. Therefore, comparing the PDF of ΔΦ/ΔΦ0 for fresh and unfresh samples, we noted immediately that the probability distribution of the orientational fluctuations of the axons, ΔΦ/ΔΦ0, becomes Gaussian in the unfresh nerve, losing the fat tail of the fresh sample. Indeed, the Levy distribution parameters here become:
- (a)
- stability index of 2.00;
- (b)
- scale parameter: γ of 0.131 ± 0.005.
Meanwhile, the location index and skewness remain the same as for the fresh nerve. The stability parameter of 2 indicates a Gaussian distribution. Furthermore, the scale parameter decreases compared to the fresh sample, which identifies a decrease of interaction between axons.
The same behavior has already been observed for the conformational parameter of myelin [10], thus showing that this behavior is replicated for supramolecular structures at both the nanoscopic and mesoscopic levels. The variation of the stability index from 1.79 ± 0.02 to 2.00 indicates the transition from Levy to Gaussian distribution going from the fresh to unfresh state.
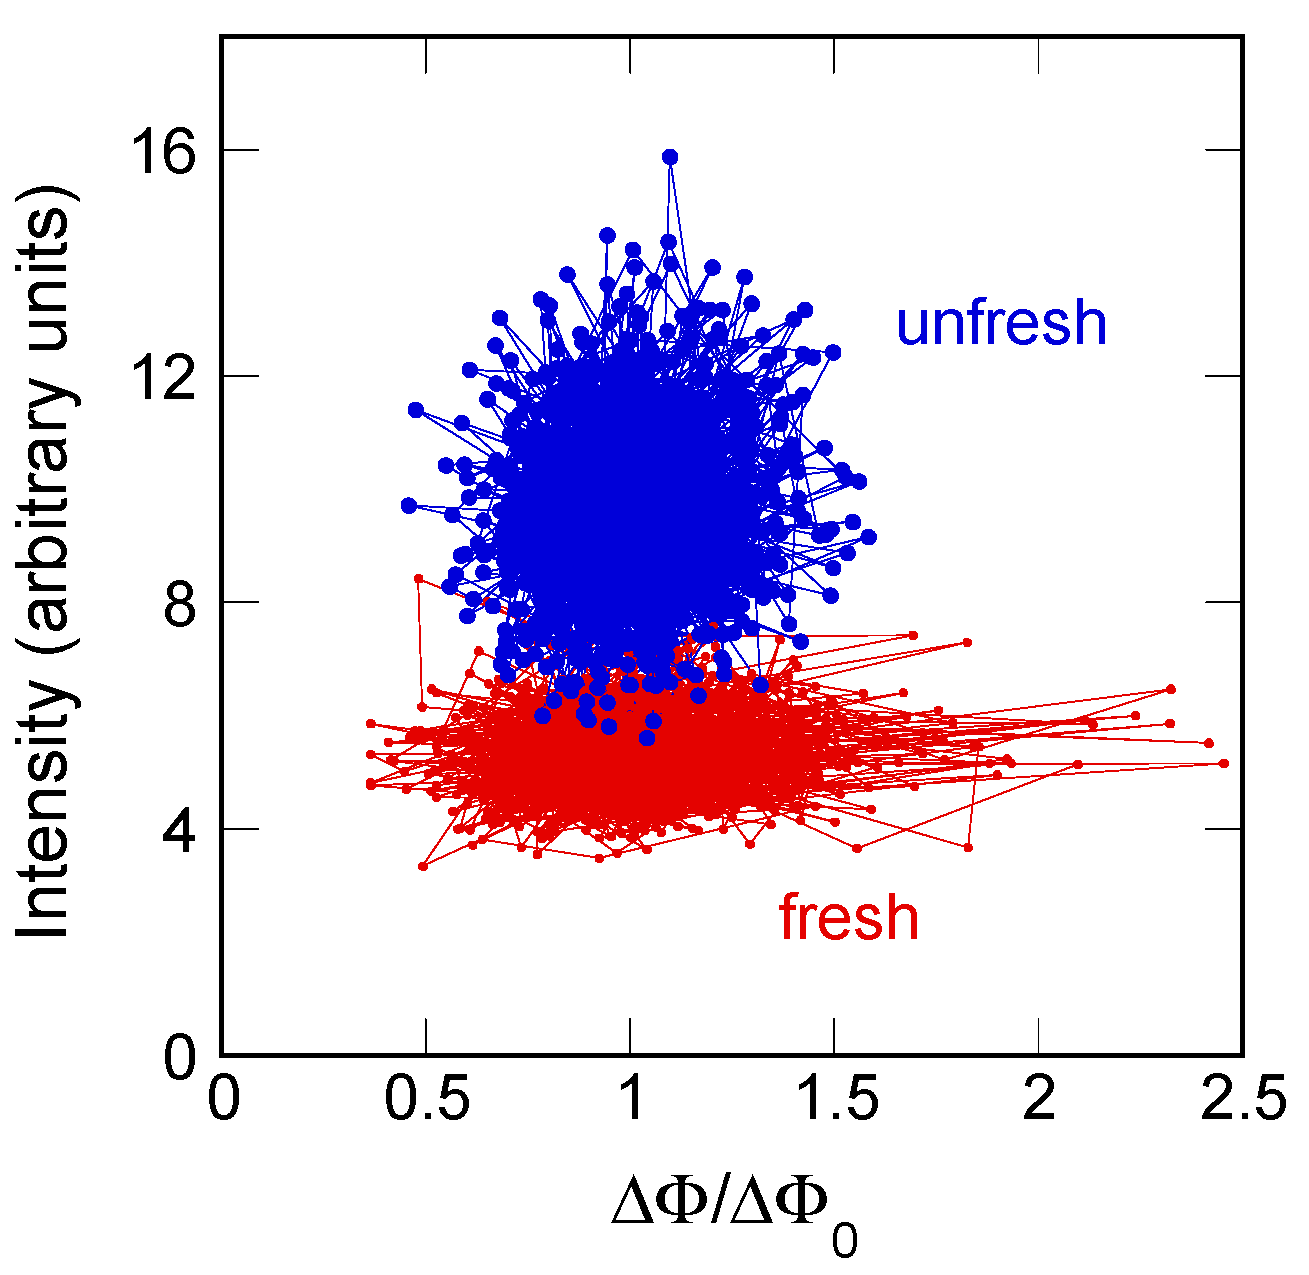
To gain a deeper insight in the geometrical fluctuations of the myelin ultrastructure, we build, here, a phase diagram of total diffracted intensity vs. orientation fluctuations. The integrated intensity of the XRD patterns can be associated to the degree of ordering of the myelin lamellae. Therefore, we plot the intensity vs ΔΦ/ΔΦ0 for each illuminated spot in the unfresh nerve, (blue dots) and in the fresh state (red dots). Going from the fresh to unfresh state, we see in Figure 4 the increasing diffraction intensity, which is in agreement with the measurements of Poccia et al. [15]. Moreover, we observe in Figure 4 that the amplitude of orientation fluctuations for the fresh state is larger than for the unfresh state.
These results indicate the occurrence of a crystallization-like process in the aged myelin membranes indicative of a transition from a quasi-critical fluctuating state out of equilibrium in the fresh state to a relaxed rigid state with Gaussian distribution approaching equilibrium in the unfresh state, which is in agreement with the hypothesis of criticality for living matter proposed by recent theories [10,12,13,14,35,36,37].
3. Materials and Methods
3.1. Samples Preparation
Xenopus Laevis adult frogs (12 cm length, 180–200 g weight, Xenopus express, France) were housed and euthanized at the Grenoble Institute of Neurosciences. The local committee of the Grenoble Institute of Neurosciences approved the animal experimental protocol. The sciatic nerves were ligated with sterile silk sutures and extracted from both thighs of freshly sacrificed Xenopus frogs at approximately the same proximal-distal level through a careful dissection of the thigh.
The fresh state of the sciatic nerves was obtained by placing the nerve after dissection immediately in a culture medium at pH 7.3 in a thin-walled quartz capillary, sealed with wax for the SµXRD imaging measurements.
The unfresh state of sciatic nerves was obtained by keeping the nerve for 18 h after dissection at room temperature, without oxygenation and without insertion of ATP in Petri dish equilibrated in culture medium at pH 7.3, and it was prepared for the SµXRD imaging session in the same experimental conditions on the same day.
The culture medium was a normal Ringer’s solution, containing 115 mM NaCl, 2.9 mM KCl, 1.8 mM CaCl2, 5 mM HEPES (4–2-hydroxyethyl-1-piperazinyl-ethanesulfonic).
3.2. Experimental and Data Analysis
The experimental methods were carried out in accordance with the approved guidelines. The scanning micro X-ray diffraction measurements of myelin of the frog sciatic nerve were performed on the ID13 beamline of the European Synchrotron Radiation Facility, ESRF, Grenoble, France. A scheme of the experimental setup is shown in Figure 1a. The source of the synchrotron radiation beam is an in vacuum undulator with an 18 mm period. The beam is first monochromatized by a liquid nitrogen cooled Si-111 double monochromator (DMC) and then is focused by a Kirkpatrick–Baez (KB) mirror system. This optics produces an energy X-ray beam of 12.6 KeV on a 1 × 1 μm2 spot. The sample holder hosts the capillary-mounted nerve with the horizontal (y) and vertical (z) translation stages with 0.1 μm repeatability. The sample was scanned by using a step size of 5 μm in both y and z direction. A Fast Readout Low Noise (FReLoN) camera (1024 × 1024 pixels of 100 × 100 μm2) is placed at a distance of 565.0 mm from the sample to collect the 2D diffraction pattern in transmission. Diffraction images were calibrated using silver behenate powder (AgC22H43O2), which has a fundamental spacing of d(001) = 58.38 Å. We choose an exposure time of 300 ms for minimizing the radiation damage. The crossed bundle is of approximately 50 myelinated axons. Therefore, the diffraction frames are an average of these axons. Considering the scale of our problem, this is an acceptable average.
We measured different regions of interest (ROIs) in the central part of the nerves around their axis to minimize the capillary geometry and nerve surface effect on the X-ray absorption. A typical 2D diffraction pattern with the expected arc-rings corresponding to the Bragg diffraction orders h = 2, 3, 4, 5 is shown in Figure 2a. The 2D diffraction patterns have been azimuthally and radially integrated to provide a 1D (Figure 2b) angular intensity distribution I(Φ) after background subtraction and normalization with respect to the impinging beam. Information about the preferred orientation of myelin is contained in the azimuthal plot, given by the integrated intensity along and around the myelin reflection from s = 0.1 to s = 0.3 nm−1. It shows two peaks modelled with two Gaussians, whose mean value and FWHM give the average orientation of the axons Φ0 and their orientation fluctuation ΔΦ (see Figure 2b). The integral of the radial profiles I(s) can be considered as the order parameter for the myelin multilamellar ultrastructure.
4. Conclusions
Understanding the structure-function relationships of biomaterials is often difficult due to their dynamic heterogeneous structure, and their composition at micron and submicron scale. This makes standard experimental probes probing the average structure inadequate for the visualization of this heterogeneity, requiring highly spatially resolved probes. Biological tissues are typically intrinsically heterogeneous; indeed, nowadays new features and properties have been visualized using scanning methods with high spatial resolutions, such as by Atomic Force Microscopy [38,39,40], Confocal Microscopy [40], Scanning Electron Microscopy [35] and Scanning micro X-ray diffraction [15,16,17,18,19,20,21]. Correlated spatial structural fluctuations in biological systems have been correlated with the emergence of quantum coherence in biological matter [35,41], in photosystems [42] and intrinsically disordered proteins [43,44], as well as in lamellar oxides showing quantum coherence [45,46,47,48], where non-Euclidean spatial geometries for signal transmission are able to emerge from a correlated disorder [22,48].
Our results support the hypothesis that the nerves in the living state are heterogeneous systems far away from thermal equilibrium [13,14], as a generic feature of living matter made of open dissipative systems in a non-equilibrium steady state tuned close to a critical point with typical features of quantum criticality [12]. In fact, near a quantum critical point the structure of living matter would display generic scale invariance and multiscale heterogeneity like critical opalescence [13,14].
Using scanning micro X-ray diffraction measurements, we found that the fluctuations of axons in the nerve present a Levy stable distribution, which is a general statistical property of complex signals deviating from normal behavior and presenting a correlated disorder. The presence of a correlation degree in the apparent disorder in a biological system and its quantitative measurement is of paramount importance. Here, we exploit the advances in X-ray synchrotron radiation sources and optics for visualizing, at a micrometric scale, the spatial distribution of both the orientation and the order degree fluctuations of myelin in a single sciatic nerve of a frog. The degeneration of the system due to the aging shows the loss of the correlation and a transition of the system in a random uncorrelated disordered state going toward thermal equilibrium. This is indicated by the transition from a Levy to a Gaussian distribution of the orientation fluctuations accompanied by an increase in diffracted intensity related to the static order and, thus, the rigidity of the axons. The potentiality of our approach results is well suited to describing the aging process of the unfresh nerve with a quantitative characterization of both spatial orientations of axons and their rigidity.
In summary, we demonstrate the feasibility of the use of SμXRD for non-invasive determination of spatial fluctuations of biomaterials, which provides unique information on the correlated disorder in biological systems [24]. From measurements of the statistical axon orientation distribution we obtained the following main evidence: the fluctuation’s distribution of the orientation of axons in the sciatic nerve of frog Xenopus leavis, in the native fresh state, is described by the Levy distribution, with large angle fluctuations. The power law behavior of the fat tail of the distribution in Figure 2 could be the experimental smoking gun of quantum critical fluctuation in the living state of myelin [12]. As the system moves toward equilibrium, the correlation degree of the disorder is expected to vanish, with the system ending up in an uncorrelated disordered state with Gaussian distribution. The quantitative characterization of the correlated disorder in the functional state is not only of interest for fundamental problems of the physics of life [10,11,12,13,14,36,37], but can open new perspectives, and may have important consequences for the understanding of injury to peripheral nerves and its treatment. This experiment provides a proof of feasibility of studies of statistical physics using scanning micro XRD, opening new perspectives to be explored by further investigations on the dynamics and time evolution of spatial fluctuations of the myelin ultrastructure.
Acknowledgments
The authors thank Manfred Burghammer, the ID13 beamline staff at ESRF in Grenoble, France and Andrei Popov of the Grenoble Institute of Neurosciences for help in the experiment.
Author Contributions
Nicola Poccia and Antonio Bianconi conceived and designed the experiments; Gaetano Campi and Nicola Poccia performed the experiments; Michael Di Gioacchino and Gaetano Campi analyzed the data; Michael Di Gioacchino, Gaetano Campi and Antonio Bianconi wrote the paper.
Conflicts of Interest
The authors declare no conflict of interest.
References
- Quarles, R.H.; Mcklin, W.B.; Morell, P. Myelin Formation, Structure and Biochemistry; Lippincott-Raven Publishing: Philadelphia, PA, USA, 2006; pp. 51–71. [Google Scholar]
- Zalc, B. The acquisition of myelin: An evolutionary perspective. Brain Res. 2016, 1641, 4–10. [Google Scholar] [CrossRef] [PubMed]
- Avila, R.L.; Inouye, H.; Baek, R.C.; Yin, X.; Trapp, B.D.; Feltri, M.L.; Wrabetz, L.; Kirschner, D.A. Structure and stability of internodal myelin in mouse models of hereditary neuropathy. J. Neuropathol. Exp. Neurol. 2005, 64, 976–990. [Google Scholar] [CrossRef] [PubMed]
- Luo, X.; Cerullo, J.; Dawli, T.; Priest, C.; Haddadin, Z.; Kim, A.; Inouye, H.; Suffoletto, B.P.; Avila, R.L.; Lees, J.P.B.; et al. Peripheral myelin of Xenopus Laevis: Role of electrostatic and hydrophobic interactions in membrane compaction. J. Struct. Biol. 2008, 162, 170–183. [Google Scholar] [CrossRef] [PubMed]
- Agrawal, D.; Hawk, R.; Avila, R.L.; Inouye, H.; Kirschner, D.A. Internodal myelination during development quantitated using x-ray diffraction. J. Struct. Biol. 2009, 168, 521–526. [Google Scholar] [CrossRef] [PubMed]
- Finean, J.B. Electron microscope and X-ray diffraction studies of the effects of dehydration on the structure of nerve myelin. J. Cell Biol. 1960, 8, 13–29. [Google Scholar] [CrossRef]
- Möbius, W.; Nave, K.A.; Werner, H.B. Electron microscopy of myelin: Structure preservation by high-pressure freezing. Brain Res. 2016, 1641, 92–100. [Google Scholar] [CrossRef] [PubMed]
- Knoll, W.; Peters, J.; Kursula, P.; Gerelli, Y.; Ollivier, J.; Demé, B.; Telling, M.; Kemner, E.; Natali, F. Structural and dynamical properties of reconstituted myelin sheaths in the presence of myelin proteins MBP and p2 studied by neutron scattering. Soft Matter 2014, 10, 519–529. [Google Scholar] [CrossRef] [PubMed]
- Williams, D. Essential Biomaterials Science; Cambridge University Press: Cambridge, UK, 2014. [Google Scholar]
- Turner, P.; Nottale, L. The physical principles underpinning self-organization in plants. Prog. Biophys. Mol. Biol. 2017, 123, 48–73. [Google Scholar] [CrossRef] [PubMed]
- Sitharam, M. Modeling Autonomous Supramolecular Assembly; Springer: Berlin/Heidelberg, Germany, 2014; pp. 197–216. [Google Scholar]
- Vattay, G.; Salahub, D.; Csabai, I.; Nassimi, A.; Kaufmann, S.A. Quantum criticality at the origin of life. J. Phys. Conf. Ser. 2015, 626, 012023. [Google Scholar] [CrossRef]
- Honerkamp-Smith, A.R.; Veatch, S.L.; Keller, S.L. An introduction to critical points for biophysicists; observations of compositional heterogeneity in lipid membranes. Biochim. Biophys. Acta (BBA)—Biomembr. 2009, 1788, 53–63. [Google Scholar] [CrossRef] [PubMed]
- Tauber, U.C. Scale Invariance in non-Equilibrium Systems, Chapter Part II; Cambridge University Press: Cambridge, UK, 2013. [Google Scholar]
- Poccia, N.; Campi, G.; Ricci, A.; Caporale, A.S.; Di Cola, E.; Hawkins, T.A.; Bianconi, A. Changes of statistical structural fluctuations unveils an early compacted degraded stage of PNS myelin. Sci. Rep. 2014, 4, 5430. [Google Scholar] [CrossRef] [PubMed]
- Campi, G.; Fratini, M.; Bukreeva, I.; Ciasca, G.; Burghammer, M.; Brun, F.; Tromba, G.; Mastrogiacomo, M.; Cedola, A. Imaging collagen packing dynamics during mineralization of engineered bone tissue. Acta Biomater. 2015, 23, 309–316. [Google Scholar] [CrossRef] [PubMed]
- Campi, G.; Di Gioacchino, M.; Poccia, N.; Ricci, A.; Burghammer, M.; Bianconi, A. Intrinsic dynamical fluctuations of PNS myelin ultrastructure. arXiv, 2017; arXiv:1705.09730. [Google Scholar]
- Dučić, T.; Quintes, S.; Nave, K.A.; Susini, J.; Rak, M.; Tucoulou, R.; Alevra, M.; Guttmann, P.; Salditt, T. Structure and composition of myelinated axons: A multimodal synchrotron spectro-microscopy study. J. Struct. Biol. 2011, 173, 202–212. [Google Scholar] [CrossRef] [PubMed]
- Inouye, H.; Liu, J.; Makowski, L.; Palmisano, M.; Burghammer, M.; Riekel, C.; Kirschner, D.A. Myelin organization in the nodal, paranodal, and juxtaparanodal regions revealed by scanning X-Ray microdiffraction. PLoS ONE 2014, 9, e100592. [Google Scholar] [CrossRef] [PubMed]
- Inouye, H.; Kuo, F.H.; Denninger, A.R.; Weinhausen, B.; Burghammer, M.; Kirschner, D.A. Myelin structure in unfixed, single nerve fibers: Scanning X-ray microdiffraction with a beam size of 200 nm. J. Struct. Biol. 2017, in press. [Google Scholar] [CrossRef] [PubMed]
- Hémonnot, C.Y.J.; Reinhardt, J.; Saldanha, O.; Patommel, J.; Graceffa, R.; Weinhausen, B.; Burghammer, M.; Schroer, C.G.; Köster, S. X-rays reveal the internal structure of keratin bundles in whole cells. ACS Nano 2016, 10, 3553–3561. [Google Scholar] [CrossRef] [PubMed]
- Campi, G.; Bianconi, A.; Poccia, N.; Bianconi, G.; Barba, L.; Arrighetti, G.; Innocenti, D.; Karpinski, J.; Zhigadlo, N.D.; Kazakov, S.M.; et al. Inhomogeneity of charge-density-wave order and quenched disorder in a high-Tc superconductor. Nature 2015, 525, 359–362. [Google Scholar] [CrossRef] [PubMed]
- Albert, R. Scale-free networks in cell biology. J. Cell Sci. 2005, 118, 4947–4957. [Google Scholar] [CrossRef] [PubMed]
- Bianconi, G.; Marsili, M. Emergence of large cliques in random scale-free networks. EPL Europhys. Lett. 2006, 74, 740–746. [Google Scholar] [CrossRef]
- Egu’iluz, V.M.; Chialvo, D.R.; Cecchi, G.A.; Baliki, M.; Apkarian, A.V. Scale-Free brain functional networks. Phys. Rev. Lett. 2005, 94, 018102. [Google Scholar] [CrossRef] [PubMed]
- Bonifazi, P.; Goldin, M.; Picardo, M.A.; Jorquera, I.; Cattani, A.; Bianconi, G.; Represa, A.; Ben-Ari, Y.; Cossart, R. GABAergic hub neurons orchestrate synchrony in developing hippocampal networks. Science 2009, 326, 1419–1424. [Google Scholar] [CrossRef] [PubMed] [Green Version]
- Altamura, M.; Elvevag, B.; Campi, G.; De Salvia, M.; Marasco, D.; Ricci, A.; Bellomo, A. Toward scale-free like behavior under increasing cognitive load. Complexity 2012, 18, 38–43. [Google Scholar] [CrossRef]
- Fofack, H.; Nolan, J.P. Tail behavior, modes and other characteristics of stable distributions. Extremes 1999, 2, 39–58. [Google Scholar] [CrossRef]
- Chechkin, A.V.; Gonchar, V.Y.; Klafter, J.; Metzler, R. Fundamentals of Lévy Flight Processes. Adv. Chem. Phys. 2006, 133B, 439–496. [Google Scholar]
- Oświȩcimka, P.; Kwapień, J.; Drożdż, S. Wavelet versus detrended fluctuation analysis of multifractal structures. Phys. Rev. E 2006, 74, 016103. [Google Scholar] [CrossRef] [PubMed]
- Barthelemy, P.; Bertolotti, J.; Wiersma, D.S. A Lévy flight for light. Nature 2008, 453, 495–498. [Google Scholar] [CrossRef] [PubMed]
- Humphries, N.E.; Queiroz, N.; Dyer, J.R.M.; Pade, N.G.; Musyl, M.K.; Schaefer, K.M.; Fuller, D.W.; Brunnscheweiler, J.M.; Doyle, T.K.; et al. Environmental context explains Lévy and Brownian movement patterns of marine predators. Nature 2010, 465, 1066–1069. [Google Scholar] [CrossRef] [PubMed]
- Podobnik, B.; Valentinčič, A.; Horvatić, D.; Stanley, H.E. Asymmetric Lévy flight in financial ratios. Proc. Natl. Acad. Sci. USA 2011, 108, 17883–17888. [Google Scholar] [CrossRef] [PubMed]
- Liang, Y.; Chen, W. A survey on computing Levy stable distributions and a new MATLAB toolbox. Signal Proc. 2013, 93, 242–251. [Google Scholar] [CrossRef]
- Poccia, N.; Ansuini, A.; Bianconi, A. Far from equilibrium percolation, stochastic and shape resonances in the physics of life. Int. J. Mol. Sci. 2011, 12, 6810–6833. [Google Scholar] [CrossRef] [PubMed]
- Mora, T.; Bialek, W. Are biological systems poised at criticality? J. Stat. Phys. 2011, 144, 268–302. [Google Scholar] [CrossRef]
- Goldfeld, N.; Woese, C. Life is Physics: Evolution of a collective phenomenon out of equilibrium. Annu. Rev. Condens. Matter Phys. 2011, 2, 375. [Google Scholar] [CrossRef]
- Ciasca, G.; Sassun, T.E.; Minelli, E.; Antonelli, M.; Papi, M.; Santoro, A.; Giangaspero, M.; Delfini, R.; De Spirito, M. Nano-mechanical signature of brain tumours. Nanoscale 2016, 8, 19629–19643. [Google Scholar] [CrossRef] [PubMed]
- Ciasca, G.; Papi, M.; Di Claudio, S.; Chiarpotto, M.; Palmieri, V.; Maulucci, G.; Nocca, G.; Rossi, C.; De Spirito, M. Mapping viscoelastic properties of healthy and pathological red blood cells at the nanoscale level. Nanoscale 2015, 7, 17030–17037. [Google Scholar] [CrossRef] [PubMed]
- Piccioli, A.; Donati, F.; Di Giacomo, G.; Ziranu, A.; Careri, S.; Spinelli, M.S.; Giannini, S.; Giannicola, G.; Perisano, C.; Maccauro, G. Infective complications in tumour endoprostheses implanted after pathological fracture of the limbs. Injury 2016, 47, S22–S28. [Google Scholar] [CrossRef] [PubMed]
- Poccia, N.; Ricci, A.; Innocenti, D.; Bianconi, A. A possible mechanism for evading temperature quantum decoherence in living matter by Feshbach resonance. Int. J. Mol. Sci. 2009, 10, 2084–2106. [Google Scholar] [CrossRef] [PubMed]
- Lambreva, M.; Russo, D.; Polticelli, F.; Scognamiglio, V.; Antonacci, A.; Zobnina, V.; Campi, G.; Rea, G. Structure/Function/dynamics of photosystem II plastoquinone binding sites. Curr. Protein Pept. Sci. 2014, 15, 285–295. [Google Scholar] [CrossRef] [PubMed]
- Bianconi, A.; Ciasca, G.; Tenenbaum, A.; Battisti, A.; Campi, G. Temperature and solvent dependence of the dynamical landscape of tau protein conformations. J. Biol. Phys. 2012, 8, 169–179. [Google Scholar] [CrossRef] [PubMed]
- Florenzano, F.; Veronica, C.; Ciasca, G.; Ciotti, M.T.; Pittaluga, A.; Olivero, G.; Sinopoli, A.; Filomena, I.; Valentina, L.; Michele, F.M.S.; et al. Extracellular truncated tau causes early presynaptic dysfunction associated with Alzheimer’s disease and other tauopathies. Oncotarget 2017, in press. [Google Scholar] [CrossRef]
- Bianconi, A. On the Fermi liquid coupled with a generalized Wigner polaronic CDW giving high Tc superconductivity. Solid State Commun. 1994, 91, 1–5. [Google Scholar] [CrossRef]
- Campi, G.; Ricci, A.; Poccia, N.; Fratini, M.; Bianconi, A. X-Rays Writing/Reading of charge density waves in the CuO2 plane of a simple cuprate superconductor. Condens. Matter 2017, 2, 26. [Google Scholar] [CrossRef]
- Caivano, R.; Fratini, M.; Poccia, N.; Ricci, A.; Puri, A.; Ren, Z.-A.; Dong, X.-L.; Yang, J.; Lu, W.; Zhao, Z.-X.; et al. Feshbach resonance and mesoscopic phase separation near a quantum critical point in multiband FeAs-based superconductors. Supercond. Sci. Technol. 2009, 22, 014004. [Google Scholar] [CrossRef]
- Campi, G.; Bianconi, A. High-temperature superconductivity in a hyperbolic geometry of complex matter from nanoscale to mesoscopic scale. J. Supercond. Novel Magn. 2016, 29, 627–631. [Google Scholar] [CrossRef]
Figure 1.
(a) Main components of the SμXRD apparatus. A typical 2D single diffraction frame, collected with the FReLon camera, shows 4 concentric arcs. The diffraction pattern is measured point by point allow spatial maps of the extracted quantities to be built, e.g., total intensity; (b) Pictorial view of the protein-depleted membrane layers made of polar lipid groups, lpg, with thickness dlpg, intercalated with two hydrophilic layers: the Schwann cell cytoplasm, cyt, and the extracellular apposition, ext, with thicknesses dcyt and dext, respectively. The specific myelin sheath proteins: Peripheral Myelin Protein 22 (PMP22), P0, P2 and Myelin Basic Protein (MBP) are schematized.

Figure 2.
(a) Typical 2D diffraction pattern, collected with the FReLon camera, showing 4 concentric rings with symmetrical arcs of high intensity with respect to the equatorial axis (y). The arcs are displaced around the direction indicated by the azimuthal angle Φ, counted from the y axis, and have amplitude ΔΦ. The tilting of myelin reveals an angular dispersion in the way the axons are arranged in the nerve. (b) I(Φ) measured at five different spots on the sample, showing the different preferred orientation of the axons, averaged throughout the tissue thickness passed by the X-ray. It shows two peaks separated by about 180° modelled by Gaussians (continuous lines). The total area under I(Φ) curve is proportional to the fraction of axons, while the FWHM represents the orientation fluctuations ΔΦ.

Figure 3.
(a) Maps of axon orientation fluctuations given by ΔΦ, normalized to their mean value ΔΦ0, in an area of 300 × 125 μm2 of fresh state, to the left, and unfresh state, to the right, axons in the sciatic nerve of a Xenopus Laevis; (b) Probability density function (PDF) of the orientation fluctuations ΔΦ/ΔΦ0 for fresh and unfresh samples in semilog plot. We note the fat tails of the PDF in the fresh sample are fitted by a Levy stable distribution.
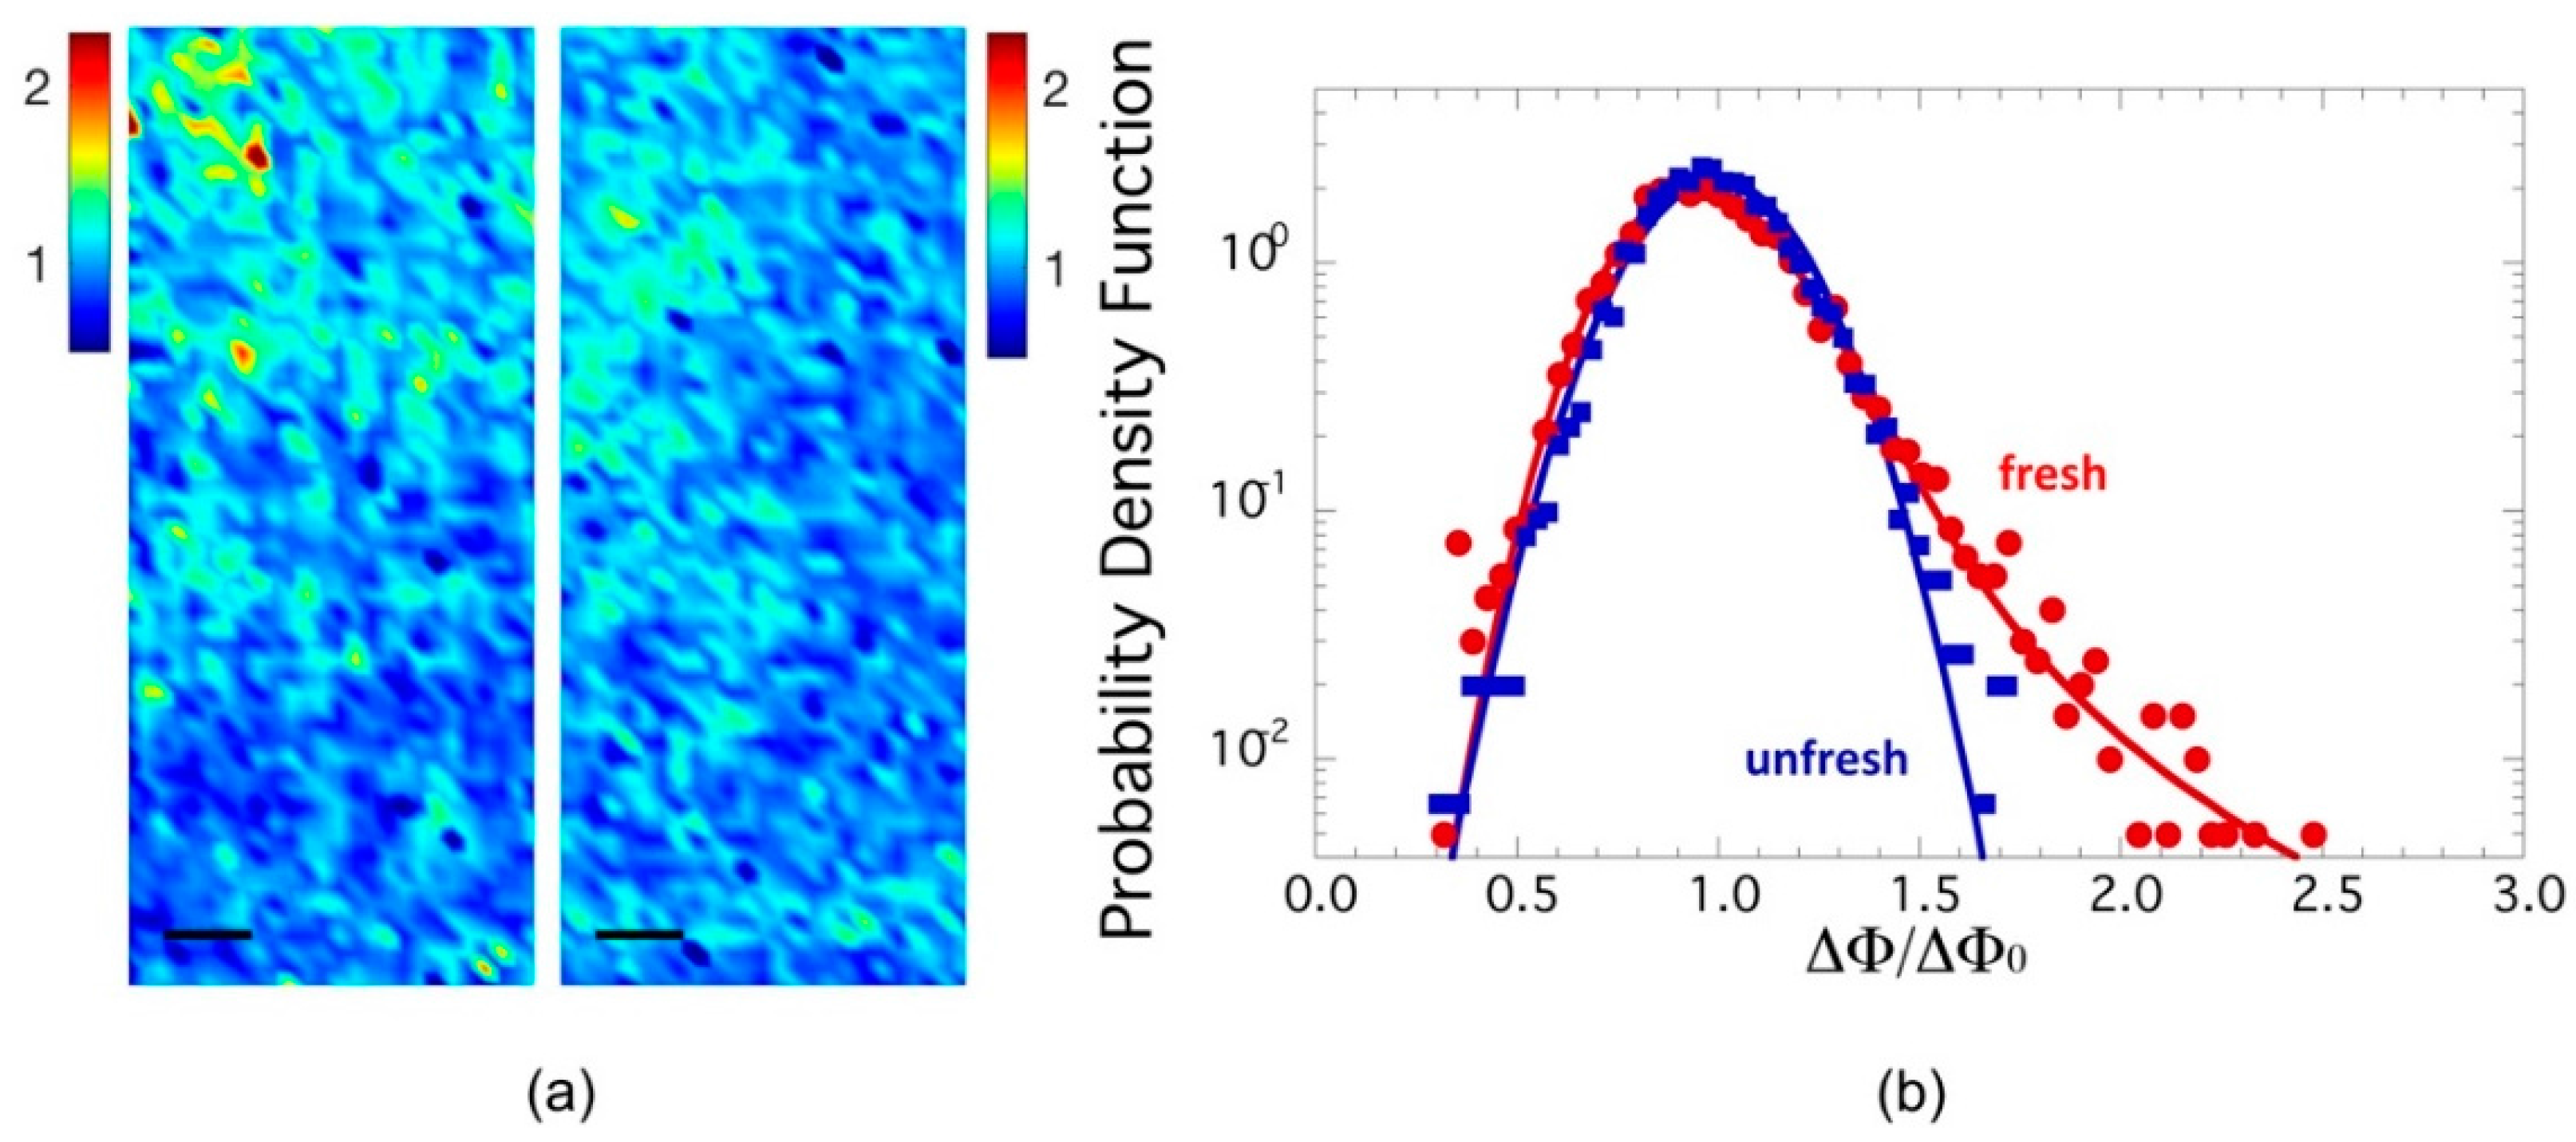
Figure 4.
Scatter plot of diffracted intensity as a function of ΔΦ/ΔΦ0. In this phase diagram, the larger orientational fluctuations and lower diffracted intensity characterize the functional fresh nerve.
Figure 4.
Scatter plot of diffracted intensity as a function of ΔΦ/ΔΦ0. In this phase diagram, the larger orientational fluctuations and lower diffracted intensity characterize the functional fresh nerve.
© 2017 by the authors. Licensee MDPI, Basel, Switzerland. This article is an open access article distributed under the terms and conditions of the Creative Commons Attribution (CC BY) license (http://creativecommons.org/licenses/by/4.0/).
Share and Cite
MDPI and ACS Style
Di Gioacchino, M.; Campi, G.; Poccia, N.; Bianconi, A. Correlated Disorder in Myelinated Axons Orientational Geometry and Structure. Condens. Matter 2017, 2, 29. https://doi.org/10.3390/condmat2030029
AMA Style
Di Gioacchino M, Campi G, Poccia N, Bianconi A. Correlated Disorder in Myelinated Axons Orientational Geometry and Structure. Condensed Matter. 2017; 2(3):29. https://doi.org/10.3390/condmat2030029
Chicago/Turabian StyleDi Gioacchino, Michael, Gaetano Campi, Nicola Poccia, and Antonio Bianconi. 2017. "Correlated Disorder in Myelinated Axons Orientational Geometry and Structure" Condensed Matter 2, no. 3: 29. https://doi.org/10.3390/condmat2030029