1. Introduction
Our understanding of the superconducting cuprates still requires development [
1]. It is the charge state of their ubiquitous CuO
plane that triggers a wealth of electronic properties [
1,
2,
3]. Recently, it was discovered that the sharing of the inherent planar Cu hole with planar O (i.e., the covalency of the bond) can also be essential for some properties. For example, the maximal possible critical temperature
achieved at optimal doping is nearly proportional to the planar O hole content of its parent (undoped) system [
4,
5]. Also recently, charge ordering in the CuO
plane and its relation to superconductivity or the pseudogap state was again the focus of research [
6,
7,
8,
9,
10,
11,
12,
13].
Nuclear magnetic resonance (NMR) of Cu and O in the CuO
plane is very sensitive to the local charge symmetry due to the nuclear quadrupole interaction that measures the electric field gradient (EFG) at each nucleus, and one might expect NMR to be a versatile, even benchmark, bulk probe for related research. However, NMR mostly focuses on the electronic spin susceptibility [
3,
14,
15,
16,
17], and only scattered publications have addressed the charge variation [
18,
19,
20,
21]. More recent work predominantly involves changes in the local charge symmetry due to rather high magnetic fields for a few selected cuprates [
12,
13,
22,
23,
24]. The chief reason why NMR has not been useful in this field is as follows. Two cuprates, YBa
2Cu
3O
and YBa
2Cu
4O
, appear to be very homogeneous, in the sense that the measured components of the EFGs hardly vary across the CuO
plane (i.e., one observes very narrow NMR lines for planar Cu and O) in these stoichiometric systems. Basically all other cuprates show broad featureless Cu and O lines, whose widths can vary with sample preparation or doping [
24]. Then, with a few materials being very homogeneous, the broad featureless lines of all the other systems have usually been dismissed as being related to inhomogeneous doping, impurities, or crystal imperfections.
The above view of NMR rests on an important assumption. For example, YBa
2Cu
3O
and YBa
2Cu
4O
show a substantial line splitting for planar O (cf.
Figure 1b), which is attributed to the orthorhombicity of these materials, as it makes planar O in the
a and
b directions different from each other. While reasonable, this assumption was never proven. It was pointed out years ago that if this interpretation fails, these splittings could easily signal large charge density variations of particular symmetry [
20,
25].
Here, we tackle this long-standing issue with high-pressure NMR experiments [
26,
27]. We use pressure high enough to affect the electronic properties of the material, but low enough to leave the chemical structure and crystal twinning unchanged. This lets us separate electronic spatial variations from those due to the chemical structure. Our results show unambiguously that electronic charge ordering at planar oxygen is present, which reacts to pressure and temperature.
It is known that various members of the YBa2Cu3
family of materials (YBCO) show the presumed “orthorhombic” planar O splitting to various degrees. Thus, the reported charge ordering appears to be ubiquitous in this family of materials. Furthermore, we present literature data on a number of cuprates, which suggest that this charge ordering is ubiquitous to the CuO plane of all cuprates.
2. Results
The experiments described here are unusual since they aim at proving or disproving whether features known to be present in the NMR data for a long time are indeed due to crystal orthorhombicity, or alternatively, charge ordering. We present and discuss a set of independent experiments, and then, we connect the evidence to draw further conclusions. Before we start presenting the results, we would like to summarize them now, to help the reader understand the procedure.
First, in
Section 2.1 we explain how the distribution of charge in the CuO
plane affects the NMR quadrupole splittings. Clearly, orientation-dependent NMR studies have to be performed, in which the crystal axes are rotated with respect to the magnetic field. However, the expected variations in the spectra due to charge ordering will be much smaller than those from the average charge due to doping. That is, one has to detect small irregularities in the angular dependences of the NMR splittings. Therefore, twinned crystals are advantageous because one can simultaneously measure two crystal orientations with very high precision (with respect to each other). More detailed information about the employed methods (crystal alignment and pressure cell) can be found in
Section 4.
In
Section 2.2 we show with Cu nuclear quadrupole resonance (NQR) and NMR that the charge symmetry at the Cu nucleus depends on pressure and temperature. In fact, it is the asymmetry of the charge in the CuO
plane that is affected. For example, at 18 kbar and 100 K, we find that all Cu nuclei experience a charge asymmetry that is ordered throughout the crystal, and the ordering can be changed reversibly with temperature or pressure. This already proves that charge ordering is at play, since the crystal structure could not adjust accordingly.
In
Section 2.3, we study the
O NMR under identical conditions (we only change the tuning of the NMR probe). Here we find, for example, at 18 kbar and 100 K, that the two different planar O atoms are ordered: O atoms with slightly larger splitting have their largest principle axis along the external, in-plane field direction. Those atoms with a smaller splitting have their largest principle axis
perpendicular to the in-plane field direction. We also count the nuclei and confirm that both numbers are equal and sum up to what we measure if the field is perpendicular to the plane. This again proves that charge ordering occurs.
Finally, in
Section 2.4 we compare both sets of data. We find that the charge asymmetries and the ordering observed for Cu and O are even in quantitative agreement with each other, and they are given by intra-unit cell charge variations on planar oxygen of up to 0.02 holes (in terms of the total planar oxygen hole content). This concludes the proof, and we discuss some consequences. We point to literature data, but a more complete discussion is outside the scope of the current paper.
2.1. Charge Ordering and NMR
Before we present the results for this important proof, we explain how NMR measures the charge distribution in the CuO
plane.
Cu or
O nuclear spins interact due to their quadrupole moments with electric field gradients (EFGs) present at the nuclear sites. With the moments known, NMR can measure the principle components (
) of the EFG tensors, as well as their orientations in the crystal (at Cu and O sites), cf.
Supplementary Figures S1 and S2.
For Cu with the partly filled
orbital, the EFG tensor must be nearly symmetric with its largest component (
) parallel to the crystal
c-axis, and
(traceless tensor), with
X and
Y along the planar
a or
b axes. Since the quadrupole interaction is quite strong for Cu, we also used nuclear quadrupole resonance (NQR) to determine
without a magnetic field. The situation is different for planar O (cf.
Figure 1).
A full shell configuration, O
, is known to have a vanishing EFG, but the hybridization between O and Cu must results in some hole content in the
orbital so that the largest principle value for the O EFG (while small compared to Cu) will be along this
-bond (i.e., along Cu-O-Cu bonds). Furthermore, the out-of-plane chemistry will make the O EFG asymmetric. For the planar CuO
unit cell, the two O sites have their Cu-O-Cu bonds at right angles to each other, and if the magnetic field is along one of the Cu-O-Cu bond directions (cf.
Figure 1c), the O site with Cu-O-Cu perpendicular to it resonates in a rather different spectral range, and the signals can easily be separated from each other (cf.
Supplementary Figure S2).
It is important to point out that we must use
twinned single crystals in order to have sufficiently high precision for comparing spectra from the crystal
a and
b axes, without systematic error from crystal alignment procedures. Note that for any chosen direction of the magnetic field in the CuO
plane, the
a and
b axes have projections with equal likelihood on the field direction. Thus, if the orthorhombicity was the determining factor for the observed NMR line splittings, both directions must contribute equally to every NMR spectrum (cf.
Supplementary Figure S1). We provide sufficient proof in the Methods section for why we can exclude changes in the chemical structure including de- or re-twinning during the course of our experiments.
We report below that the EFGs at Cu and O order as a function of pressure and temperature (throughout the whole crystal). This proves that we can quantify the ordering of the charges in the CuO
plane due to very recent progress relating the average EFGs in the plane to the hole contents of the bonding orbitals,
of Cu 3
, and
of O
. NMR can measure the actual doping (
x) quite reliably from determining the EFGs, and the expected relation,
, for hole (
) as well as for electron (
) doped systems is recovered. That is,
and
add up to the sum of inherent Cu hole plus doped hole (
) [
4,
5] (cf. also
Figure 1). We find with this simple formalism that the ordering of the EFGs at Cu and O is explained quantitatively by charge ordering of the
orbitals.
2.2. Ordering Phenomena from Cu NMR
For the planar Cu NMR satellites (cf.
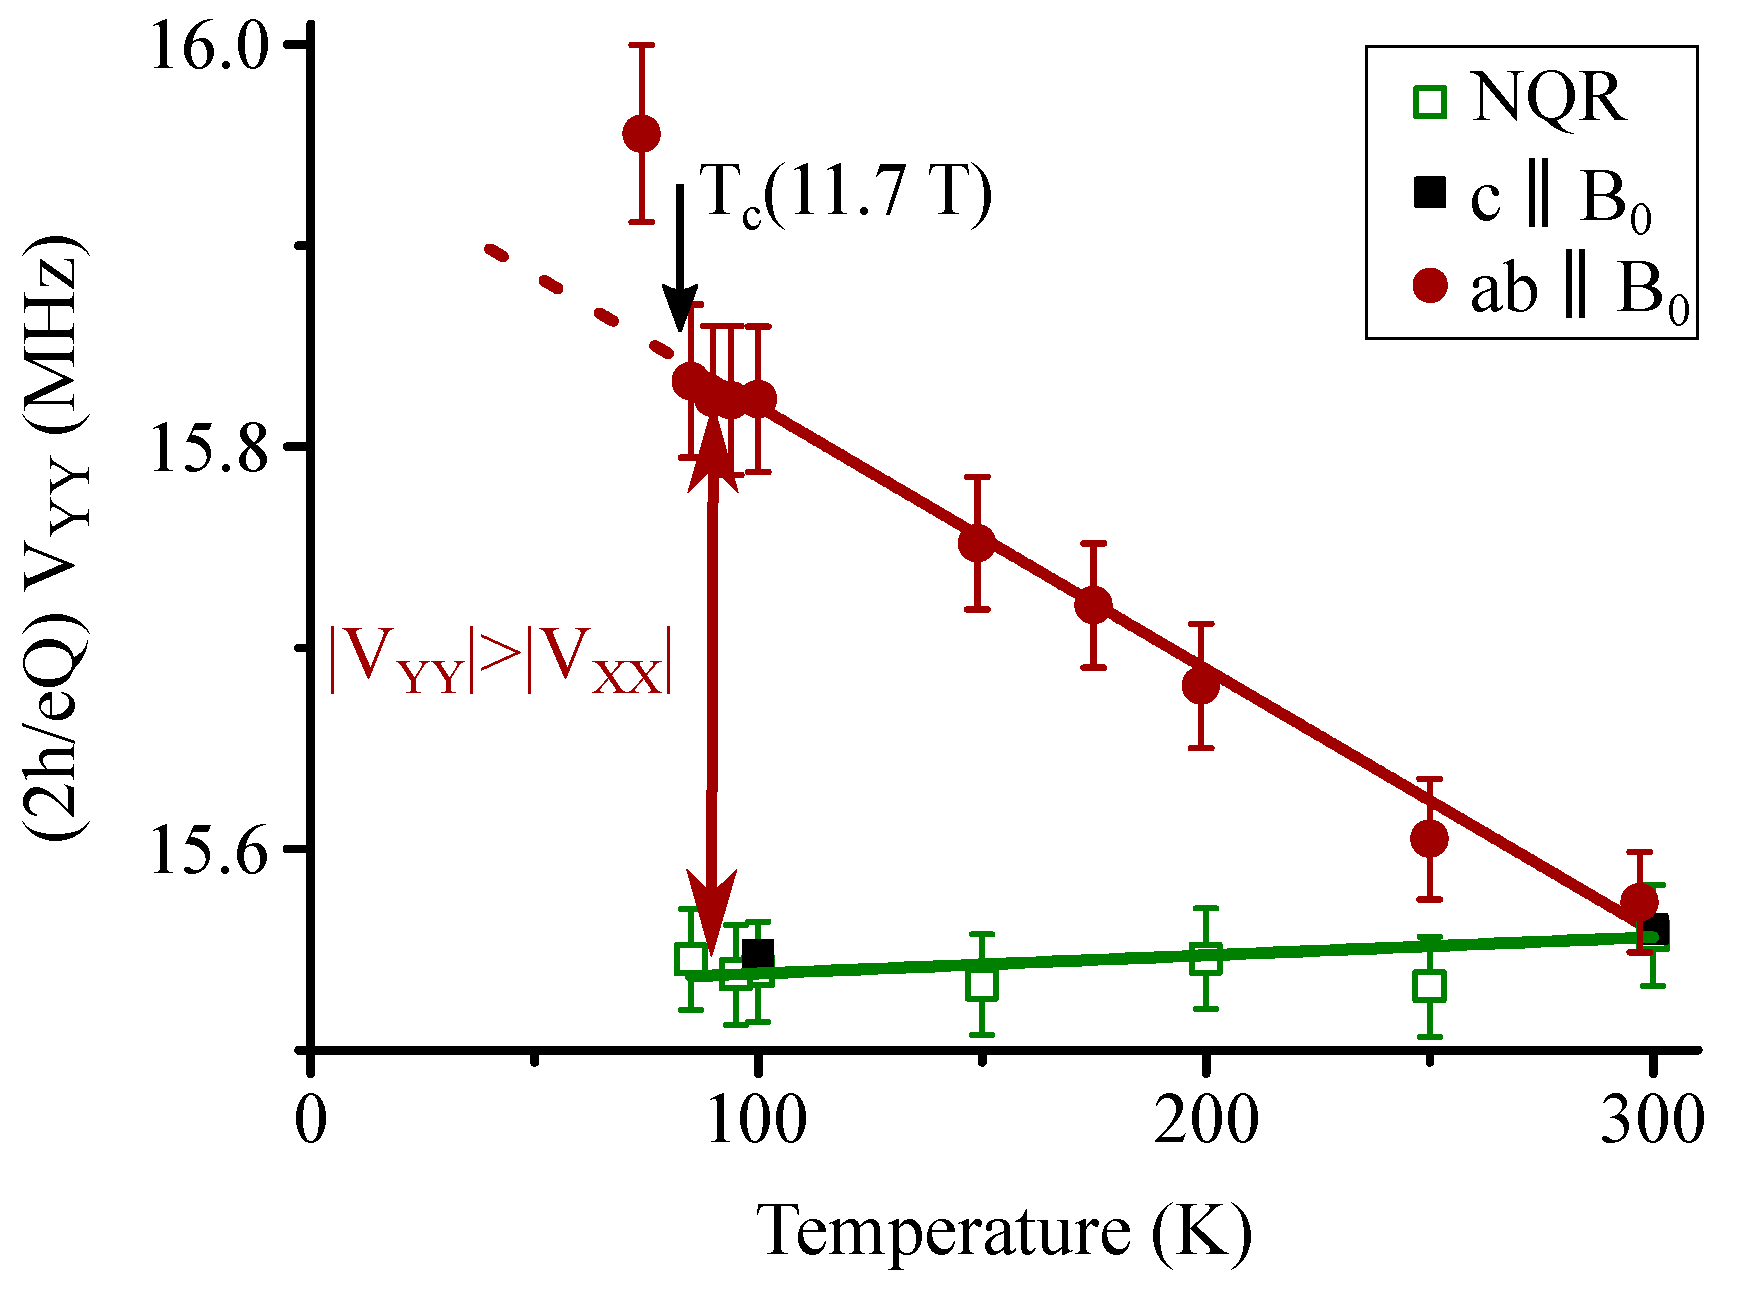
Figure 1b), the magnetic contributions to the linewidths are negligible, which makes data analysis very reliable, and we present our results sorted by how the magnetic field was aligned with respect to the crystal axes.
- (1)
Magnetic field
parallel to crystal
c-axis (
): For planar
Cu we measured
and its spatial distribution for this orientation. The results are compared with NQR in
Figure 1b, and we found nearly identical line shapes at ambient conditions (
MHz width). We deduced a quadrupole frequency (proportional to
) of
, consistent with literature data [
28]. Upon applying pressure,
changed only slightly (≈1%), while its spatial variation (linewidth) increased by a factor of two at 18 kbar (
Supplementary Figure S3). In summary, apart from a slight increase in broadening, pressure and temperature had only small effects on the principle EFG component
.
- (2)
Magnetic field
in the plane (
): We turned the sample by 90
such that the magnetic field was along
a and
b for this twinned crystal (Cu-O-Cu bond alignment set with
O NMR, see Methods). Selected spectra of the high-frequency Cu satellite are shown in
Figure 2. The dashed vertical lines in
Figure 2 denote the calculated resonance line positions for an exactly symmetric EFG. That is,
(using
from NQR/NMR). A Cu nucleus with a slightly asymmetric tensor would resonate at a certain frequency distance above (
) or below (
) that line, depending on the orientation of the EFG with respect to the in-plane magnetic field (
is proportional to
), cf.
Supplementary Figure S2. If a slightly asymmetric EFG were fixed by the orthorhombic distortion, we would see two resonance lines of similar intensity, namely one at
and the other at
. This is not observed in
Figure 2.
At ambient conditions (cf.
Figure 2a), we found most spectral weight below the dashed line at
. The intensity at
was too small to be caused by twinning (see also
Supplementary Figure S4). At
and room temperature (cf.
Figure 2b), the lineshape remained similar. At
and 300 K, the lineshape was nearly symmetric and the center of gravity was close to the dashed line (cf.
Figure 2c), similar to the situation found already at 9 kbar and 100 K. The linewidths were almost precisely what is expected from NQR (cf.
Supplementary Figure S4). Thus, all Cu sites had a nearly symmetric tensor (
). At
and
(cf.
Figure 2f), the resonance line was shifted to a higher frequency (
), indicating that basically all Cu sites had a similar asymmetry, almost twice that found at ambient conditions, but of different sign. This means that all EFGs were ordered throughout the whole crystal, not only in the
c-direction but also in the plane, irrespective of orthorhombicity.
Note that a change in orthorhombicity would require the Cu-O chains to change their orientation, which is of course not the case for such low pressures and temperatures (in particular the temperature dependence of the Cu EFG asymmetry in
Figure 3 would not be reversible, see also
Supplementary Figure S5). More importantly, we can exclude changes due to misalignment since this would shift the resonances to lower quadrupole frequencies. We also tracked the NMR intensities, and there was no intensity loss observed between 0 kbar and 18 kbar.
Thus, the data represent a simple charge ordering phenomenon. At 18 kbar and 100 K the whole crystal had the same local order. As the temperature was raised, the average tensor became symmetric, but at ambient pressure we again observed charge ordering, predominantly of opposite sign and almost half the amplitude.
2.3. Ordering Phenomena from O NMR
For
O NMR, the quadrupole splittings are correlated with magnetic shifts, and at magnetic fields typical for NMR, both are similar in size. This leads to asymmetric
O lineshapes in the cuprates [
19], and introduces some uncertainty in the data analysis. We determined the approximate average magnetic shifts and subtracted them in the spectra presented, but the linewidths were unaltered. As discussed above, for planar O its
was found along the Cu-O-Cu bonds, and
along the crystal
c-axis, and
[
29].
- (1)
Magnetic field
parallel to crystal
c-axis (
): The satellite lines for
were split. That is, there were two distinct quadrupole frequencies (cf.
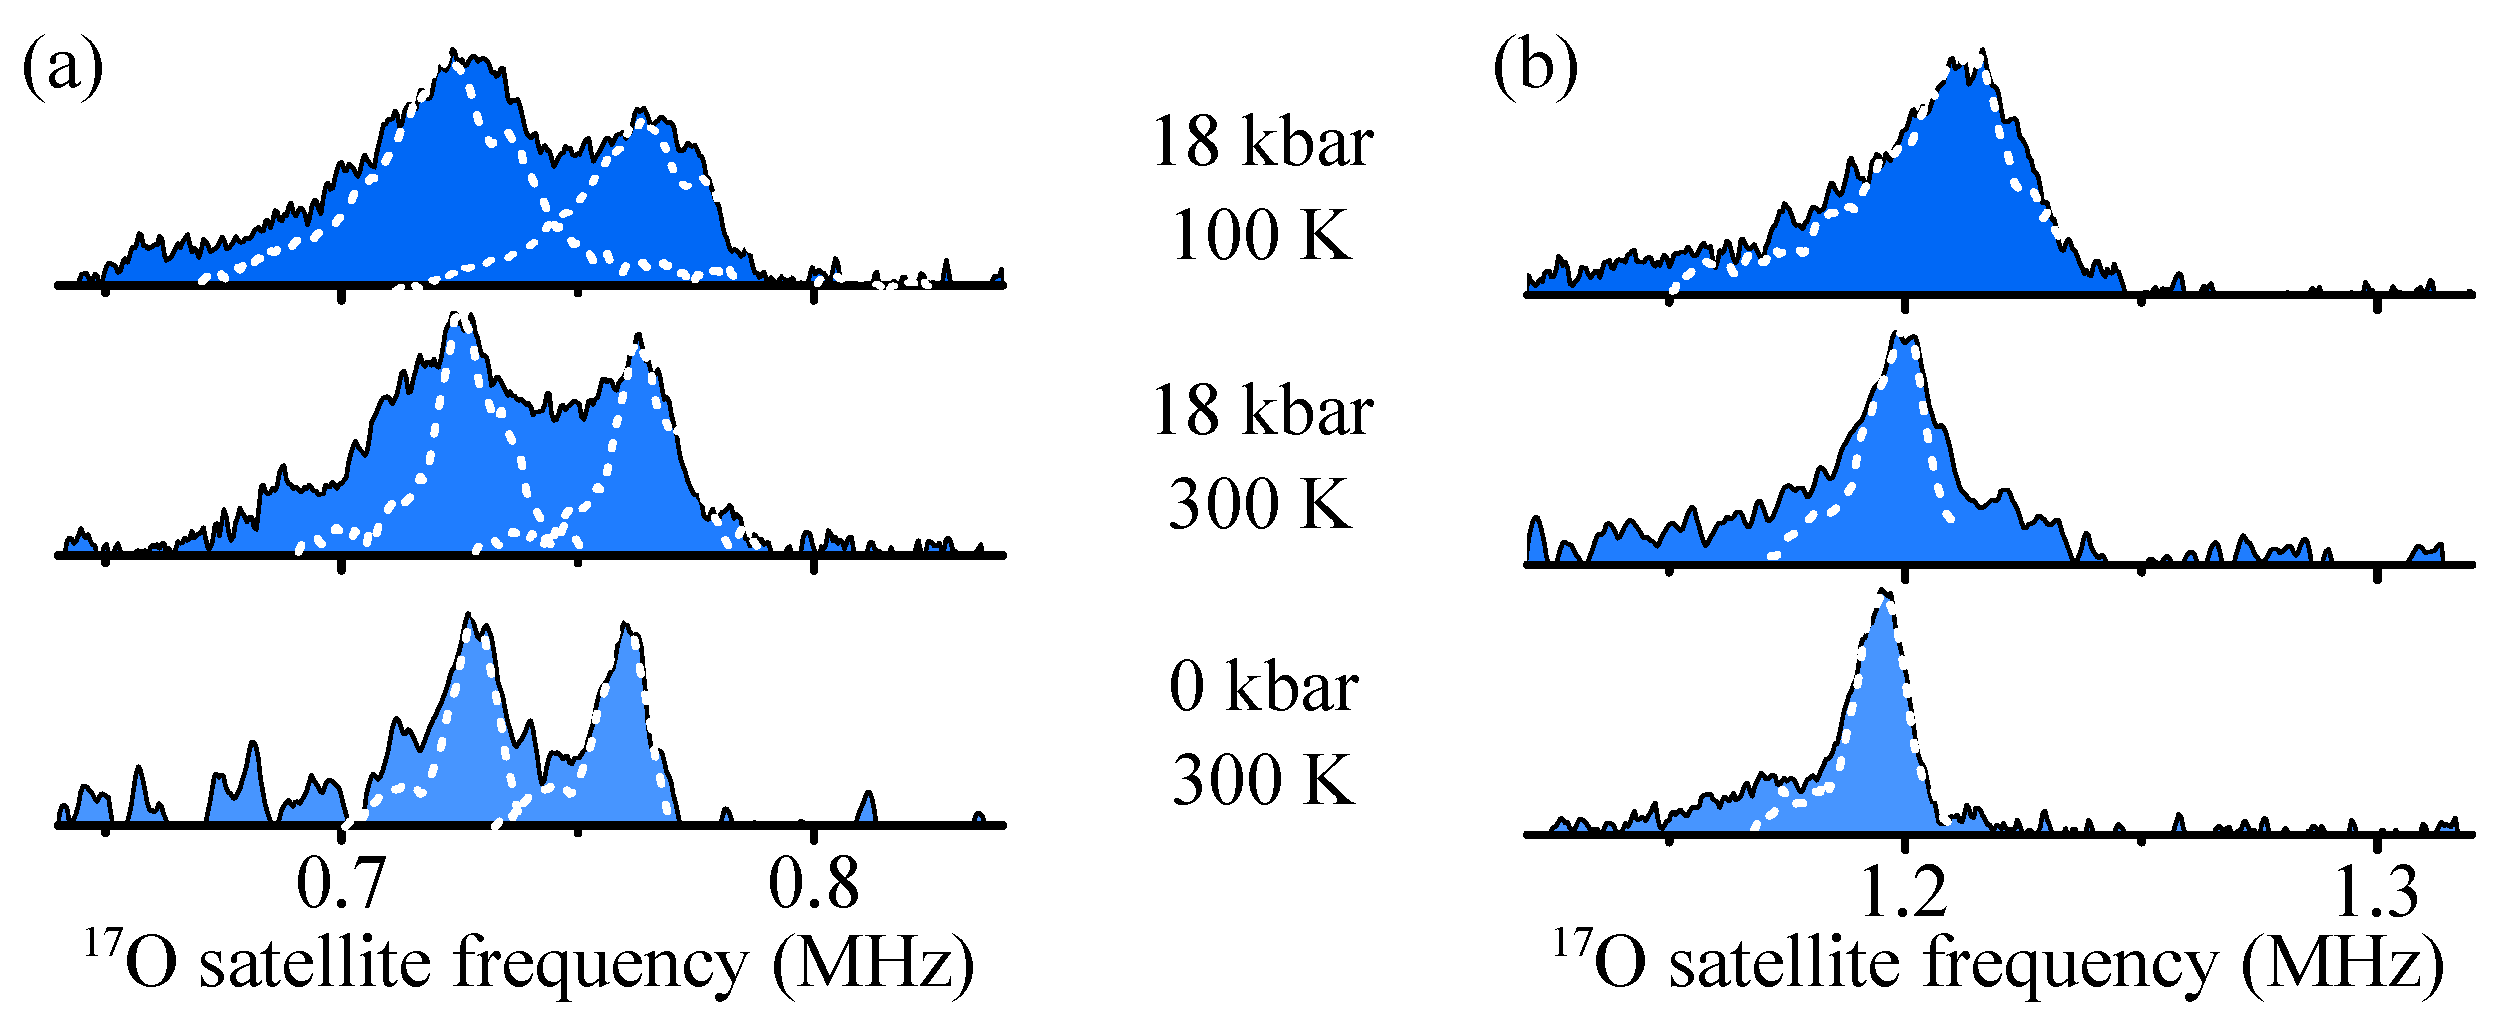
Figure 1b). This shows that there were two different oxygen sites with similar abundance. More data for this orientation at different pressures and temperatures are shown in
Figure 4a. The peak positions did not change significantly with increasing pressure or decreasing temperature, but we observed an overall broadening that was largely magnetic at 100 K. The peak splittings correspond to quadrupole frequency differences of 18 kHz to 26 kHz.
Qualitatively, this is in agreement with what one expects from two inequivalent planar O sites due to orthorhombicity, the explanation adopted early on [
29,
30].
- (2)
Magnetic field in the plane (): Note that this orientation is identical to that used for Cu NMR, only the radio frequency tuning outside the anvil cell was changed. The signals from planar O with the -bond parallel () and perpendicular () to the field () could easily be separated ( and were rather different) and we discuss them separately. Unfortunately, we were not able to rotate the field within the plane due to experimental constraints.
Oxygens with σ bonds perpendicular to (): Examples of spectra are shown in
Figure 4b. Note that the clear double peak structure as for
in
Figure 4a was absent, and the line became rather broad at higher pressure and lower temperature. The linewidth at 18 kbar, 100 K was dominated by magnetic broadening (black dashed line). In our twinned sample, we would expect two lines with similar intensities since
a and
b axes are equally likely to be perpendicular to the field (cf.
Supplementary Figure S1). Therefore, the spectra argue against orthorhombic distortion as the origin for the split
O lines.
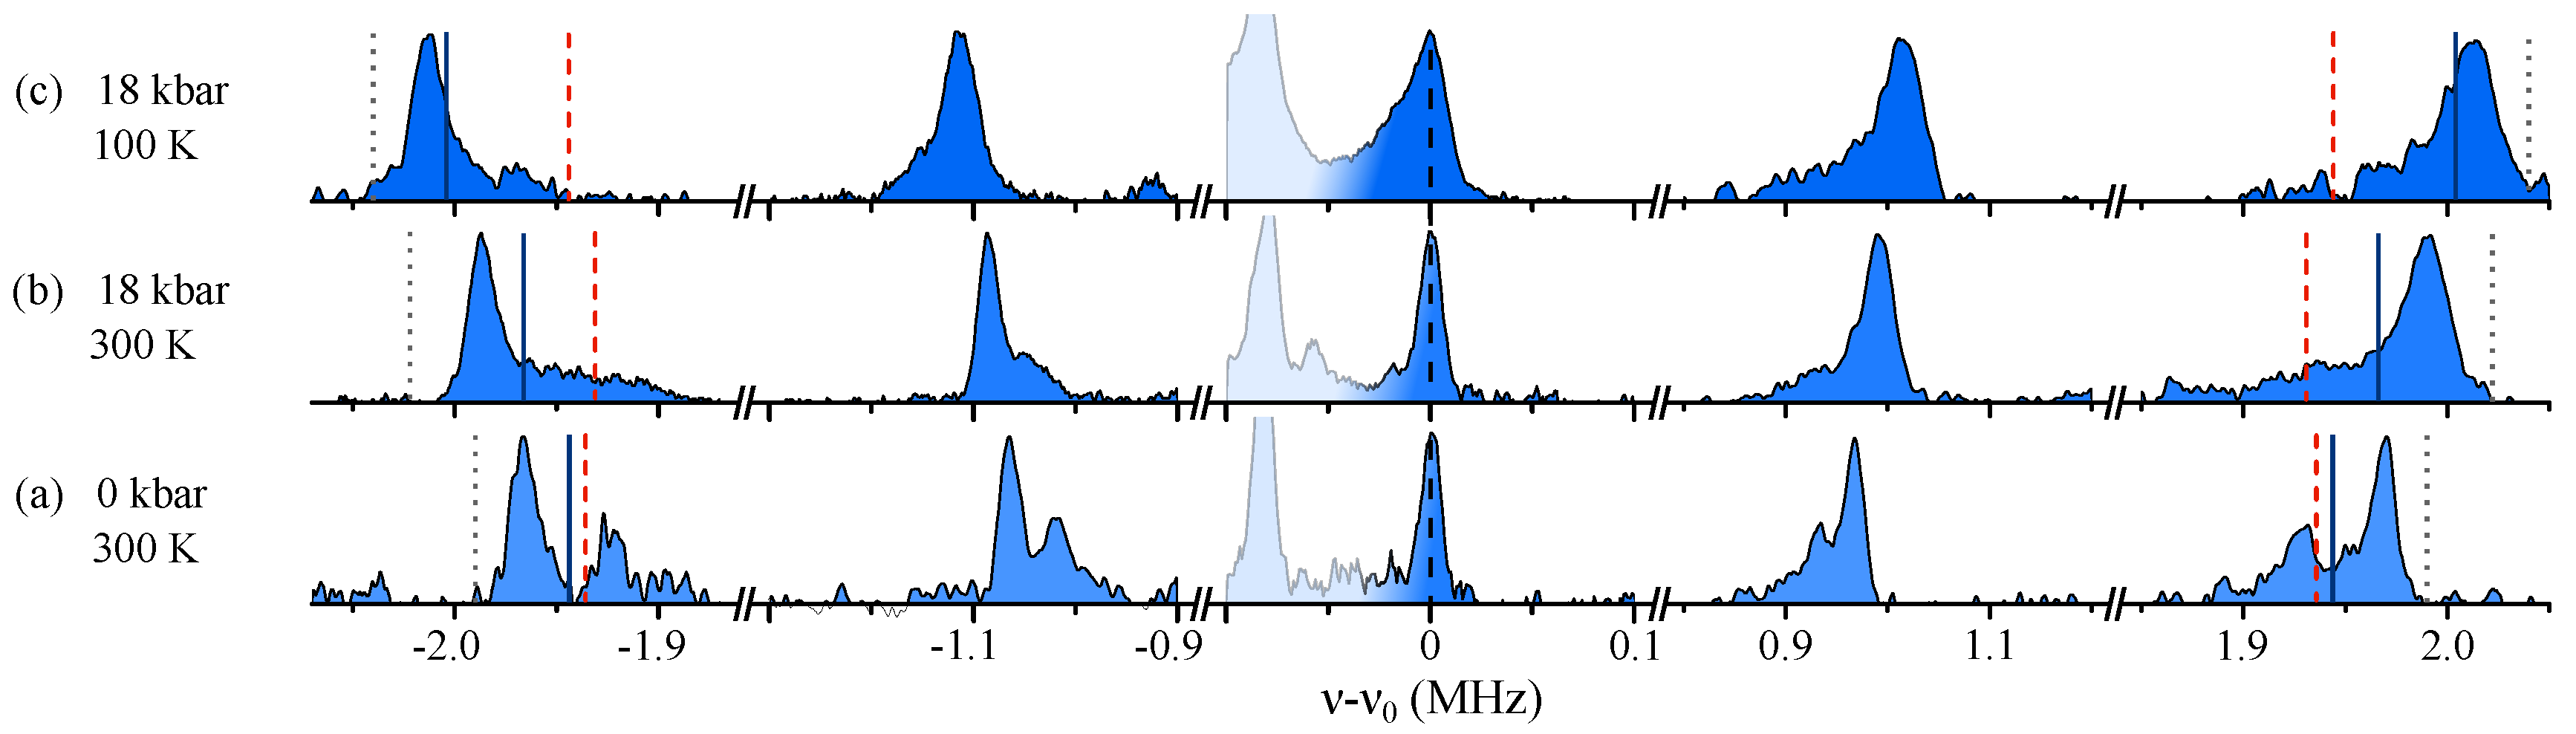
Oxygens with σ bonds parallel to (): Pronounced changes were observed for these O atoms, so we show all five
O transitions in
Figure 5 for clarity. At ambient conditions (
Figure 5a), there was a double-peak structure. The number of nuclei in each environment could be similar if one considers the different linewidths (cf.
Supplementary Figure S6). The line splitting was close to what we measured for
, and therefore only about half of what is expected for
along
. However, the total spectral range of a satellite line was indeed about twice as large as for the other two orientations (cf.
Figure 4).
At
,
Figure 5b, the line with the smaller quadrupole frequency broadened substantially while the other line remained similar in shape. The overall quadrupole frequency increased. From the linewidth and relative intensities we deduced that about half of the nuclei experienced a well-defined EFG compared to the other half that show a smaller EFG with large spatial variation. As we lowered the temperature at 18 kbar to 100 K (
Figure 5c), the broad peak nearly merged with the well-defined peak that had considerably more intensity (>75% of the total intensity) and showed an even larger quadrupole frequency.
This shows that planar O atoms that have their two -bonds parallel to the field undergo pressure and temperature dependent ordering of the planar EFGs, which is most pronounced at 18 kbar and 100 K. Such spectral changes, that are reversible and have one peak altered while the other stays rather similar, clearly rule out a structural origin, and thus, must be due to electronic ordering.
In order to be able to draw firm conclusions we determined the
O NMR intensities for all orientations, see
Figure 6. As expected, the number of nuclei contributing to the spectra for
was about twice as large as that for either set of spectra for
. Thus, within small error bars we can be certain that
all spectra represent true histograms of the local EFGs at planar O in the CuO
plane.
We now calculate two characteristic frequencies (cf. Methods). First, we determined the high-frequency cut-off from the data in
Figure 4, and the gray dotted lines in
Figure 5 denote the resulting positions for this alignment. The agreement was good, showing the consistency of the data. Second, we calculated the centers of gravity. From the data in
Figure 4 (including transitions not shown) we calculated centers of gravity denoted by red dashed lines in
Figure 5. We compared these with the actual centers of gravity from the spectra in
Figure 5, the full blue lines. Clearly, there was a stark contrast at higher pressure, substantial already at 18 kbar, 300 K, but at 18 kbar and 100 K the expected frequencies were even below the actual low-frequency cut-off (when considering peak positions, we found similar behavior, cf.
Supplementary Figure S7). These discrepancies prove that spectral weights measured for the three different directions of the field could not come from the same nuclear sites. Furthermore, since all nuclei contribute to a given
satellite (cf.
Figure 6), it must be that the two signals for the in-plane resonances (parallel and perpendicular to the field) did not belong to the same O atoms at 18 kbar and 100 K. In other words, planar O atoms parallel to the field were different from those perpendicular to the field. Note again that this order was observed in a twinned crystal, and thus this ordering of the O EFGs cannot be attributed to orthorhombicity.
2.4. Charge Ordering in the CuO Plane
Since the average Cu and O EFGs were determined by the average charge in the bonding orbitals of the CuO
plane [
4,
31] (cf.
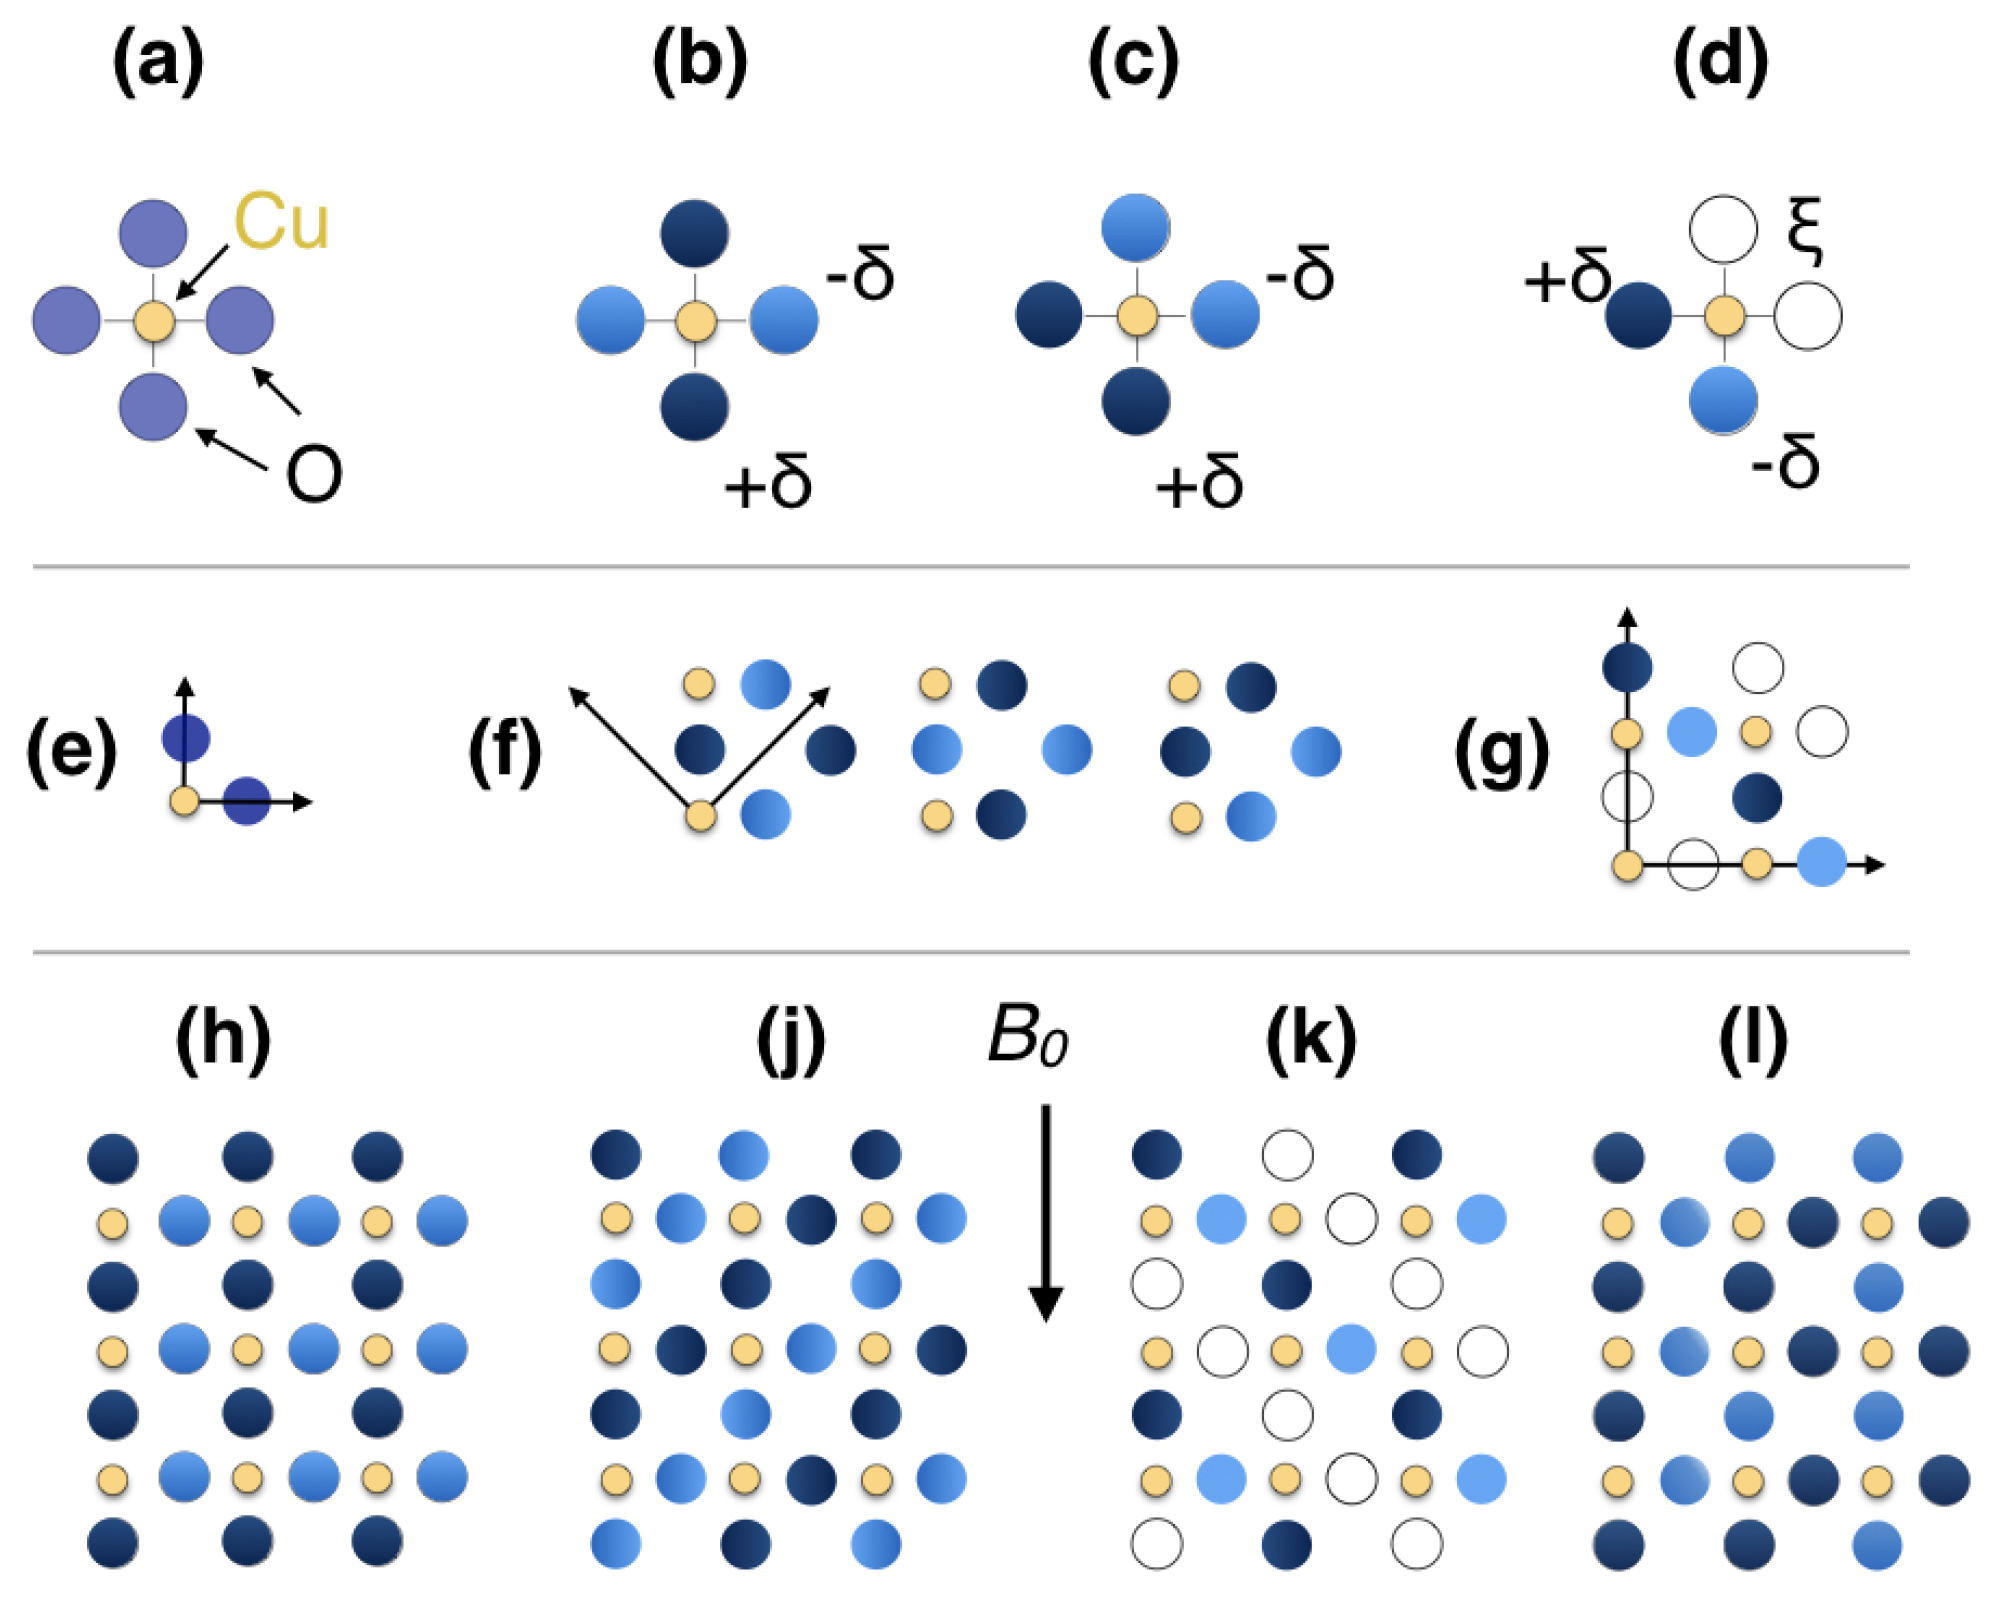
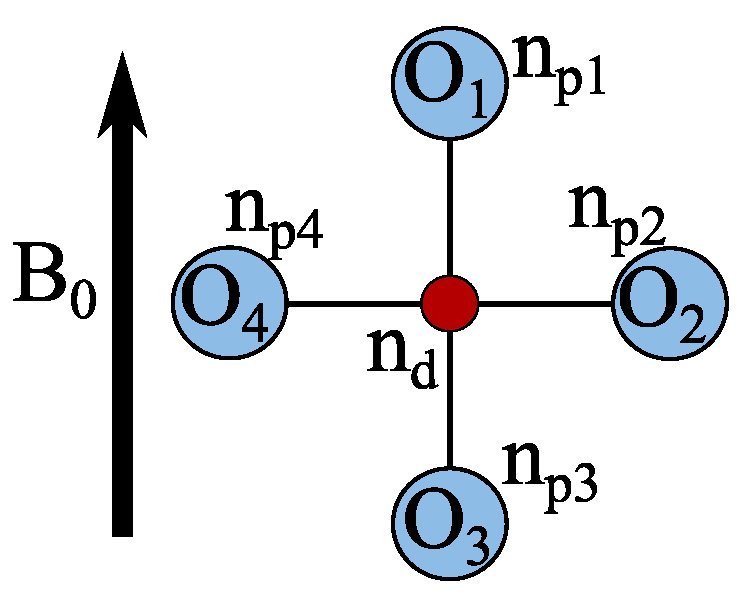
Figure 1a), we will attempt to describe the spatial charge ordering quantitatively by this formalism, as well. For this, we must consider CuO
units (cf.
Figure 7a), with a Cu hole content
and O hole contents
, since for the Cu EFG the charges at the four neighboring O atoms also contribute [
31].
(1) 18 kbar, 100 K: With the magnetic field in the plane we found the EFG tensors at all Cu atoms aligned in the plane. That is, with asymmetry
(and their
along the
c-direction). Under exactly the same conditions the O EFGs were also aligned. Here, the atoms with their
-bonds parallel to the field experienced a larger field gradient. Thus, these
-orbitals must carry a slightly higher charge [
31]. We define it to be
, and denote with
the smaller charge at the O atoms that have their
-bonds perpendicular to the in-plane magnetic field. This arrangement is depicted in
Figure 7b, and amounts to a charge modulation within the unit cell of the homogeneous CuO
plane. With two different O charges we can double the unit cell and have a choice of arranging the
charges. Three fundamentally different possibilities are shown in
Figure 7f. The first unit cell under (f) will result in a charge density wave (h) consistent with our data. From the O data we determined [
31] an amplitude of the charge density variation in the O
orbital of about
(holes per O). This amplitude with the configuration given in
Figure 7h resulted in a Cu EFG asymmetry with a positive frequency shift of
kHz (see Methods for details), in agreement with the experimentally found asymmetry shift of
kHz in
Figure 2f. Note that while we can be certain about bulk ordering, if less than about 15% of the Cu atom were missing in our spectra (due to excessive broadening) we would find the same result, since such a loss is almost unnoticed in these difficult NMR experiments. Thus, on average the ordering could be locally quite incommensurate, but globally it is quite commensurate. Of course, different parts of the sample could have different wave vectors (e.g., due to impurities).
(2) 18 kbar, 300 K: As the temperature was increased (
Figure 3), the asymmetry decreased linearly, and at 300 K the spectrum was nearly symmetric. A symmetric Cu EFG results if charges at the four O neighbors are the same. However, this is also the case for a distribution according to
Figure 7c. Note that the two O lines for
demand two O atoms of similar abundance with slightly different charge. The third unit cell in
Figure 7f would result in a charge density wave according to (j). However, this would demand two peaks for the O spectra in
, which we did not find. For O with
-bonds parallel and perpendicular to the field, we found one well-defined line each, for which the differences in the centers of gravity still proved order. The second broad spectral feature hints at disorder, but the centers of gravity were similar. In order to understand this as a long-range pattern, a larger unit cell is necessary. One such cell is indicated in
Figure 7g. The two well-defined sites (with
) carry the obvious colors, while the disordered sites ((
)) are left empty. A possible pattern consistent with our data is presented in
Figure 7k.
(3) 9 kbar: At K, we face perhaps a situation similar to that at 18 kbar, 300 K (a complete set of O data is not available), except that the average Cu asymmetry was even closer to zero, or had begun to change sign. The discussion would be similar to the one outlined above. At 9 kbar, 300 K the Cu asymmetry had a changed sign and remained similar at lower pressure at temperatures above 100 K. Therefore, we discuss these lineshapes in the next paragraph.
(4) Ambient pressure: Similar to 9 kbar, 300 K, a planar EFG asymmetry at Cu was found, but with a different sign for most of the nuclei, and it was about half in size compared to 18 kbar, 100 K. Only a smaller fraction of nuclei showed the high pressure, low temperature asymmetry. The overall linewidth decreased slightly. A combination of the first two unit cells in
Figure 7f can describe the asymmetry sufficiently well, and the charge difference between the O atoms was about 70% of that measured at 18 kbar, 100 K. The O spectra in
Figure 5 show a two-peak structure, as for
, but for the O atoms with
-bonds perpendicular to the in-plane field (
Figure 4b), the second line—if present—appears to be smeared over a broader spectral range. A simple scenario is sketched in
Figure 7l (where we used the same colors while
had decreased). Likewise, parts of the sample could order with either unit cell so that locally a higher order could be present. Besides the orientation of the Cu asymmetry, its amplitude matched the respective O satellite line splittings throughout. For example, at ambient conditions we deduced an O charge variation amplitude of
that, if ordered, would result in a deviation
=
kHz, in agreement with the experimentally measured deviation shown in
Figure 2a,b,d.
3. Discussion
The driving force for this comprehensive set of experiments was to find out whether those cuprates with rather narrow NMR lines were indeed very homogeneous, or if, for example, the split
O NMR satellites signal special intra-unit cell charge ordering, as proposed some years ago [
20,
25]. Such a charge density variation that breaks the symmetry of the chemical lattice may show a special behavior under pressure, and indeed, our results on YBa
Cu
O
revealed such a special electronic response. That is, the electric field gradient tensors of Cu and O in the plane underwent different ordering scenarios as a function of pressure and temperature. With the recently established quantitative picture for the measurement of the average charges with NMR [
4,
31], we found that a charge modulation of the O
orbitals of ≲1% was behind the observed EFG modulations. The ordering could be influenced already at
kbar by moderate temperature changes (note that 9 kbar corresponds to an energy density of a
Tesla field, at which about 1% of the total O hole content was being spatially rearranged, not far from
). With the bulk ordering observed, chemical inhomogeneity cannot be responsible for the effects, while it may be involved in pinning.
Given similar NMR features in other YBCO materials, and preliminary experiments on YBa
2Cu
4O
and YBa
2Cu
3O
that also show increasing linewidths with pressure [
15], this charge ordering appears to be the missing link that explains why only a few cuprates have narrow NMR lines, and why linewidths can depend on the method of preparation, or imperfections [
32,
33]. In particular, since the planar Cu NMR satellite linewidths are also known to be extremely sensitive to sample quality and doping level (e.g., for
one finds values ranging from 0.1 to more than 6 MHz [
24]), one is inclined to believe that the observed charge density variations can also affect the Cu
orbital. In such a case, one expects large Cu linewidths since the pre-factor that relates the Cu splitting to the related Cu hole content is much larger than in the case of planar O (e.g., a 1% variation of the Cu charge can cause about 1 MHz of linewidth for the Cu satellite [
31]). Indeed, for an electron doped system it was shown that the Cu linewidths were given predominantly by a charge density variation in the
orbital [
34]. Furthermore, similar linewidths and line splittings have been observed in a number of cuprates [
4,
24,
29,
35,
36,
37,
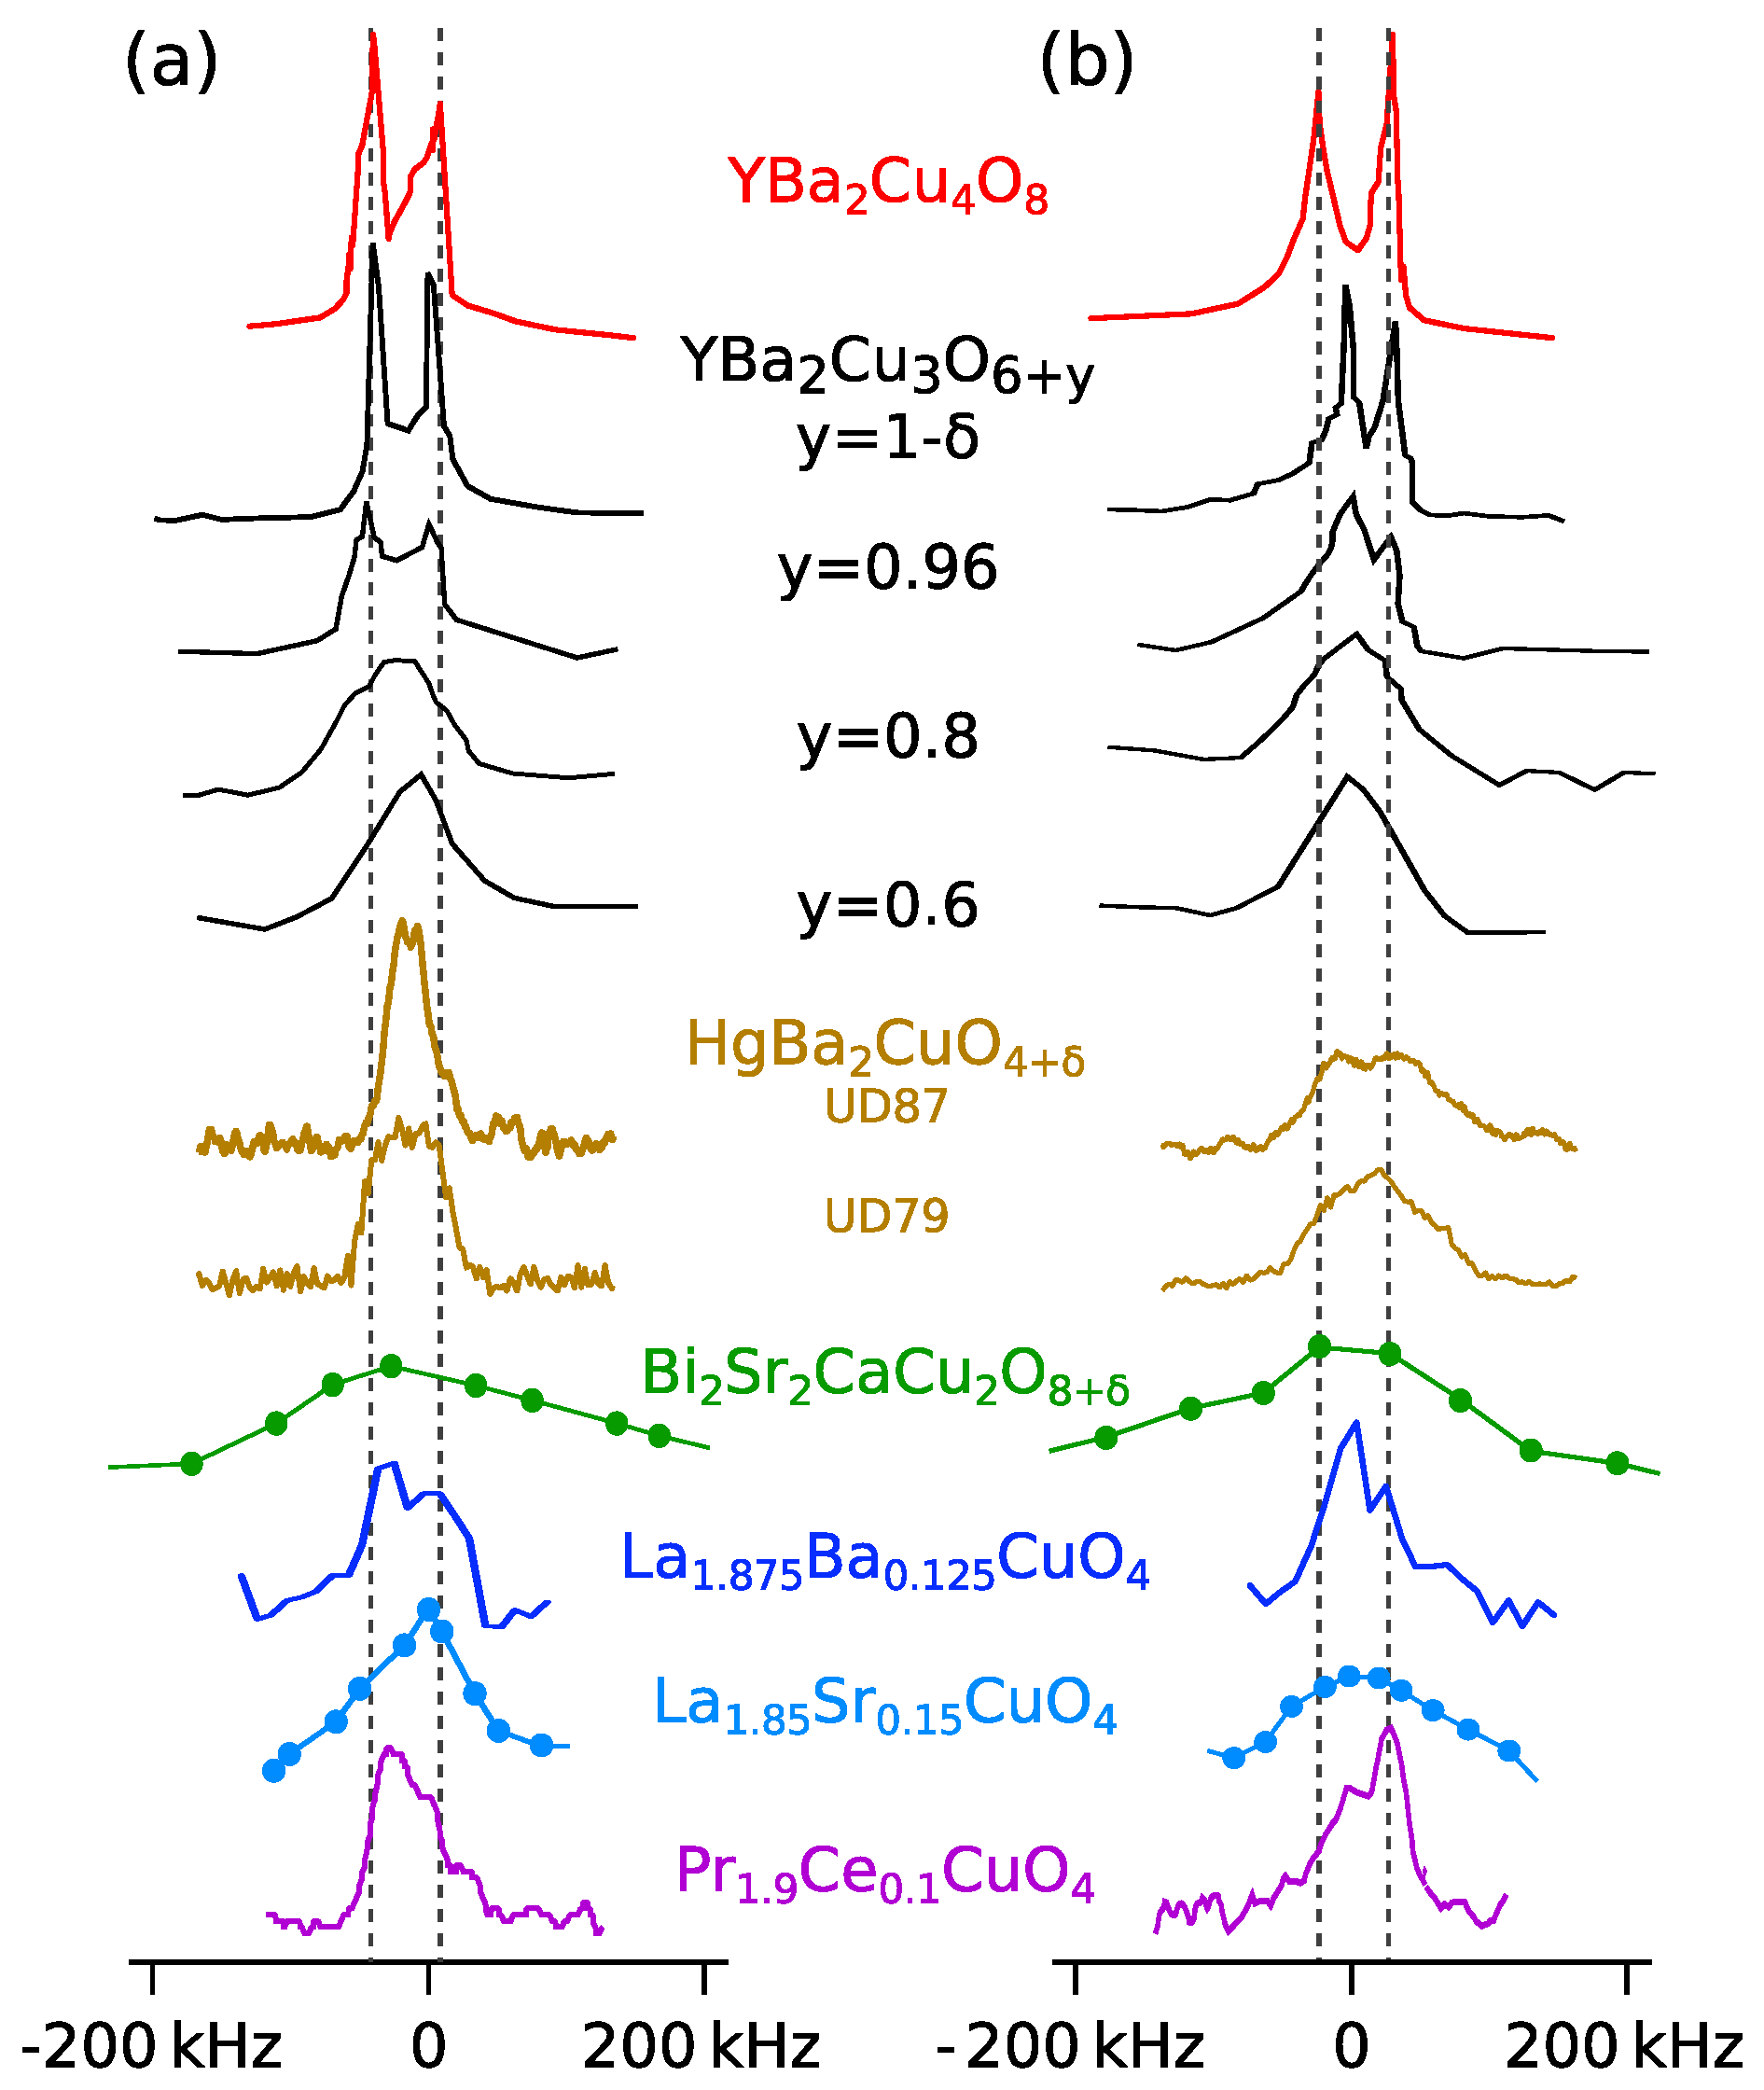
38], pointing to similar amplitudes of charge density variations. We collected literature
O NMR spectra for various cuprates and plot them in
Figure 8. These spectra clearly suggest that the charge ordering proven here with the two particular
O NMR peaks could be ubiquitous (if some additional inhomogeneity is present, since NMR is a bulk local probe and takes the average over all nuclear positions).
Our results may raise many questions that cannot be answered right away. Not enough is known about this new charge order, its behavior at much higher or much lower temperatures, or as a function of doping, and its importance for cuprate physics in general. For instance, our sample was close to optimal doping and
increased by about 4 K with pressure while the O charge ordering was enhanced. In addition, no simple trend between the NMR linewidths and the maximum
was found [
5].
Recent NMR reports on detwinned, underdoped YBCO samples observed similarly split O lines that, however, were attributed to sites near empty and full chains [
13]. Their observed (additional) Cu and O line splittings in high magnetic fields and at low temperatures in underdoped YBCO [
12,
13] may point to a perturbation that affects the existing charge ordering, as well. We also know that moderate magnetic fields are able to induce Cu quadrupolar linewidth in YBa
2Cu
3O
[
24], indicating an influence of the magnetic field that might be unexpected on general grounds.
At 18 kbar, 100 K we found fully established simple bulk ordering in our sample. One may ask, which mechanism is responsible for selecting a particular unit cell orientation with respect to the field (cf.
Figure 7f)? Is it a hidden symmetry that combined with pressure favors a field direction, or is it just the magnetic field itself that chooses the orientation of the charge pattern? We tried to answer the question by rotating the magnetic field, but with limited experimental choices we could not produce a clear result and further experiments have to be performed. However, it is conceivable that if the magnetic field influences the charge distribution, its effect in the three different directions could be markedly different and influence our conclusions.
4. Methods
Sample. A high-quality single crystal of YBa
2Cu
3O
was used for high-pressure
Cu and
O NMR experiments. It was obtained in the following way. Single crystals of YBa
2Cu
3 were grown in non-reactive BaZrO
crucibles and were annealed afterwards at
in 100 bar of O
for one week [
40]. This resulted in fully oxygenated single crystals (
) which were twinned within the
-plane. Some samples were cut into pieces of ∼150 × 100 × 100
for high-pressure experiments.
O exchange was performed at
in
enriched
O
gas for 3 days followed by a slow, stepwise cooling period of 1 month to
. The actual oxygen content was estimated [
41,
42] from the measured superconducting transition temperature
(p =
kbar) =
K and its positive pressure gradient (i.e.,
(p =
kbar) =
K), as well as comparison with ambient pressure NMR literature data.
Crystal twinning. The used single crystals were twinned. That is, while the crystal
c-axis was well defined, the
a-axis and
b-axis alternate over the whole crystal with a period of 1 to 3
m. Twinning lines occur as angle bisectors due to tension at the boundaries (cf. inset of
Supplementary Figure S8). Those lines could easily be seen using a polarization filter (cf.
Figure 8), and revealed that the alternating phases are homogeneously distributed for the used single crystals. In the investigated temperature and pressure regime, no structural changes occur that could explain our observations. In particular, we can exclude detwinning as the origin of the observed spectral changes at elevated pressure for various reasons. It is known that detwinning can only be achieved using uniaxial in-plane pressure at much higher temperature (
K). Since we worked with hydrostatic pressures and at much lower temperatures, a chemical rearrangement of the Cu-O chains (O(1) diffusion) necessary for detwinning is not possible. In addition, de-twinned single crystals of YBa
Cu
O
are known to be stable over years, and even at 600 K only partial re-twinning occurs, while we measured spectral changes for O and Cu NMR that are reversible in pressure and temperature and occur instantaneously. Furthermore, the spectral changes we observe are inconsistent with a detwinning scenario. For instance, if one were to explain the data by orthorhombicity, the axially symmetric EFG observed for planar
Cu at 9 kbar and 100 K, and at 18 kbar and 300 K (cf.
Figure 2e,c) would imply a mysterious loss of orthorhombicity altogether, which then must re-establish itself at 18 kbar, 100 K (cf.
Figure 2f), while the persistent
O double peak feature observed in all measurements for
(cf.
Figure 4a) implies persistent orthorhombicity. Nevertheless, we provide additional spectroscopic proof against detwinning or other structural changes with data for apical
O(4) and chain
Cu NMR (cf.
Supplementary Figure S10).
NMR pressure cell. Two Böhler-type moissanite anvils squeeze the sample space that is within a hardened nonmagnetic beryllium copper (BeCu) sheet that served as a gasket. For stable conditions under pressure the crystal was glued to one of the anvils. The NMR micro-coil was wound around the sample and paraffin oil was used as pressure medium. We used the luminescence shift of ruby for pressure calibration. For details see Ref. [
26,
43]. The pressure cell was then fitted into a two-angle goniometer that was fastened on a home-build NMR probe.
NMR and NQR experiments NMR and NQR experiments were carried out using standard pulsed spectrometers. NQR experiments were done at zero field, and the NMR measurements were performed in a superconducting magnet at T. Spin echo pulse sequences were used to obtain spectra with frequency stepped experiments for broad lines and/or limited excitation/detection bandwidth.
Alignment of the crystal. A two-angle goniometer allowed the alignment of the sample with the magnetic field
perpendicular to the CuO
plane (
) and parallel to half of the planar Cu-O-Cu bonds, that is, parallel to both planar axes (
a and
b) in a twinned crystal (
). For this, we used the angular dependence of the magnetic shifts and quadrupole frequencies of planar Cu and O, since they have principle axes coinciding with a crystal axis. The narrow planar
Cu central transition (35–70 kHz) changes under rotation by ≈3 MHz and exhibits two maxima, for
and
. Starting from
the planar
O satellite frequencies reveal extrema if a planar Cu-O-Cu bond direction is parallel to
(
). See
Supplementary Figure S9 for details of the alignment procedure.
Electric field gradients, NQR and NMR. An electric field gradient (EFG) tensor at a particular nuclear site is characterized by its principle values , , and , and its orientation with respect to the crystal axes. is by definition the largest component (the sign cannot be determined), and since the tensor is traceless, one typically defines . For Cu in the cuprates, the Z axis is along the crystal c axis. However, due to the nearly vanishing asymmetry in the CuO plane the other two axes are not well defined if inhomogeneity is present. Therefore, we abstained from using the typical convention for the discussion, and rather point to the spectral appearance of lines () for Cu NMR and .
The interaction of the EFG with the nuclear electric quadrupole moment gives rise to a Zeeman level splitting even in the absence of an external magnetic field. However, for planar oxygen the splitting is rather small (≈1 MHz) and NQR (nuclear quadrupole resonance) measurements are not feasible with small crystallites used with pressure cells, due to low signal to noise. However, planar Cu has a rather large quadrupole interaction (≈31 MHz) and in NQR experiments one obtains a single resonance line at , where , and I is the nuclear spin. Since the asymmetry in the plane cannot be large, is very small, and NQR measures the largest principle value and its spatial distribution .
For NMR at
T the Zeeman interaction is the leading term, and
resonances can be observed due to the quadrupole interaction. That is, for
there is a central transition and 2 satellite transitions (cf.
Figure 1b). The principle components of the EFG (
) can be measured by rotating the crystal (cf.
Supplementary Figure S2). Besides higher-order effects (up to third-order effects were taken into account analytically [
44] in the present work, and confirmed by diagonalization of the Hamiltonian), the splittings along the principle axes are given by
(
).
For planar Cu the magnetic contributions to the satellite linewidths are negligibly small so that the linewidths are determined by the spatial distribution of . However, for planar O, magnetic and quadrupole effects are known to be of similar size, and could not be separated easily for the observed double peak satellites (without assuming a particular model). Thus, by comparing the outermost satellites with the central transition that has vanishing quadrupolar contributions we estimated the spatial EFG variation.
Planar Copper: From the local symmetry of planar Cu one knows that the EFG is nearly axially symmetric (i.e.,
). Then, for
the difference of an actually measured line with respect to
determines the actual EFG asymmetry. That is, spectral weight below
corresponds to nuclei with
(
), and spectral weight above
corresponds to nuclei with
(
). As mentioned above, since Cu nuclei were measured for both alignments,
or
in the direction of the magnetic field, we use as a simple notation
, with
), for the deviation in frequency units from the axially symmetric case (cf.
Supplementary Figure S2). Note that the EFG asymmetry is usually described by the parameter
that is defined to be positive. Any spatial variation
gives rise to a satellite linewidth of
.
Planar Oxygen: Since the crystal lacks rotational symmetry about the Cu-O-Cu bond, the EFG asymmetry at planar O is substantial (a well established fact). Thus, for
the NMR spectra show two well separated regions. One contains the resonances from planar O for which the field is along the
-bond (
). The other region carries signal from those O nuclei that have their
-bond perpendicular to the fiel (
), (cf.
Supplementary Figures S1 and S2). The signal intensity must be 50% in each region compared to the planar O signal for
, where the orientation of the bond is irrelevant. Then, if one measures the spectra of planar O with the in-plane field, parallel and perpendicular to the bond, one can predict certain spectral properties (center of gravity, edges, or peaks) also for
(cf.
Supplementary Figures S2). In fact, and this is very unusual, we found disagreement in those features for a number of spectra. This immediately points to planar O EFGs being aligned with respect to the applied field, as is the case for charge ordering.
Simulation of NMR spectra. Since NQR of planar Cu directly measures the variation of the largest principle component (
), we were able to simulate the planar Cu NMR spectra (by diagonalization of the Hamiltonian). For this, we estimated the EFG asymmetry from the pronounced satellite peaks observed for
. The magnetic shift, which is the same for all transitions, was adjusted such that all observed transitions coincided with the simulation. The intensities were adjusted such that the peak values matched (cf.
Supplementary Figures S3 and S4).
Quantitative determination of local Cu and O charges. The hole contents in the bonding orbitals Cu
(
) and O
(
) were determined by the NMR splittings according to a well established method [
4,
31]:
Equations (
1) and (
2) describe the splitting of Cu and O for the respective principle axis of charge symmetry (i.e.,
for Cu and along the
-bond for O). Since the asymmetry of the Cu EFG is changing with pressure, it must be related to a change of the surrounding O charges (cf.
Figure 9). For instance, the charge
of the O
sigma bonding orbital along the in-plane field is seen by the Cu nucleus as partial occupation of the nominally empty Cu
orbital along
. One
electron causes a Cu splitting along the orbital axis of symmetry of +28.4 MHz, and −14.2 MHz in perpendicular directions (i.e.,
, or the perpendicular in-plane direction). So, with the field in the plane along the bonding orbitals of O
and O
, and with the overlap of Cu
and O
of
[
31], the charge on the four surrounding O contributes to the Cu splitting
MHz
MHz
. If all charges correspond to the average O hole content,
, the contribution is simply minus half that seen in the
c-direction (i.e.,
MHz
, cf. Equation (
1)), and the O contribution to the Cu splitting shows c-axial symmetry. If however, the hole contents differs,
, and in an asymmetric fashion (i.e.,
), the Cu satellite is shifted from the position for an axially symmetric EFG by
. Note that as the Cu splitting per our definition is positive for
, it is negative for
, such that the measured splitting is increased if
. Also note that as long as we have charge balance
around all Cu, the O variation will not affect the Cu linewidth measured in
.
Using the O satellite splitting for
as a measure of the amplitude of the O hole content variation (
), we find
[
31]. Taking, for instance, the O satellite line splitting seen at ambient conditions of
, cf.
Figure 4, we find
. In the charge ordered configuration depicted in
Figure 7b (i.e.,
), this value of
yields an increase in the measured Cu splitting (
O
-Cu-O
-bond) of +250 kHz. If the local charge order was in the other direction (i.e.,
), the effect would be a decrease of the measured Cu splitting by −250 kHz.


