A Nuclear Emulsion Detector for the Muon Radiography of a Glacier Structure

 ,
, 
 , and
, and 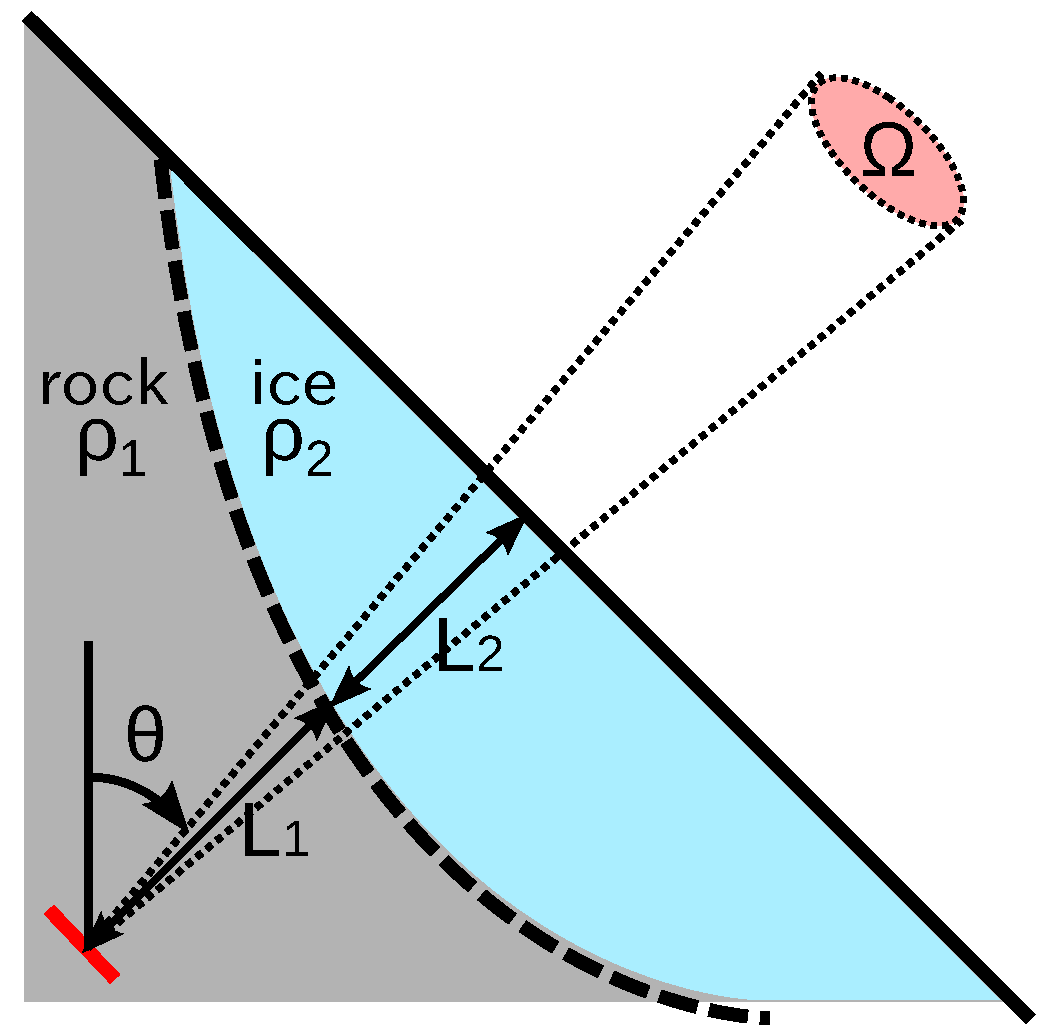
Abstract
:1. Introduction
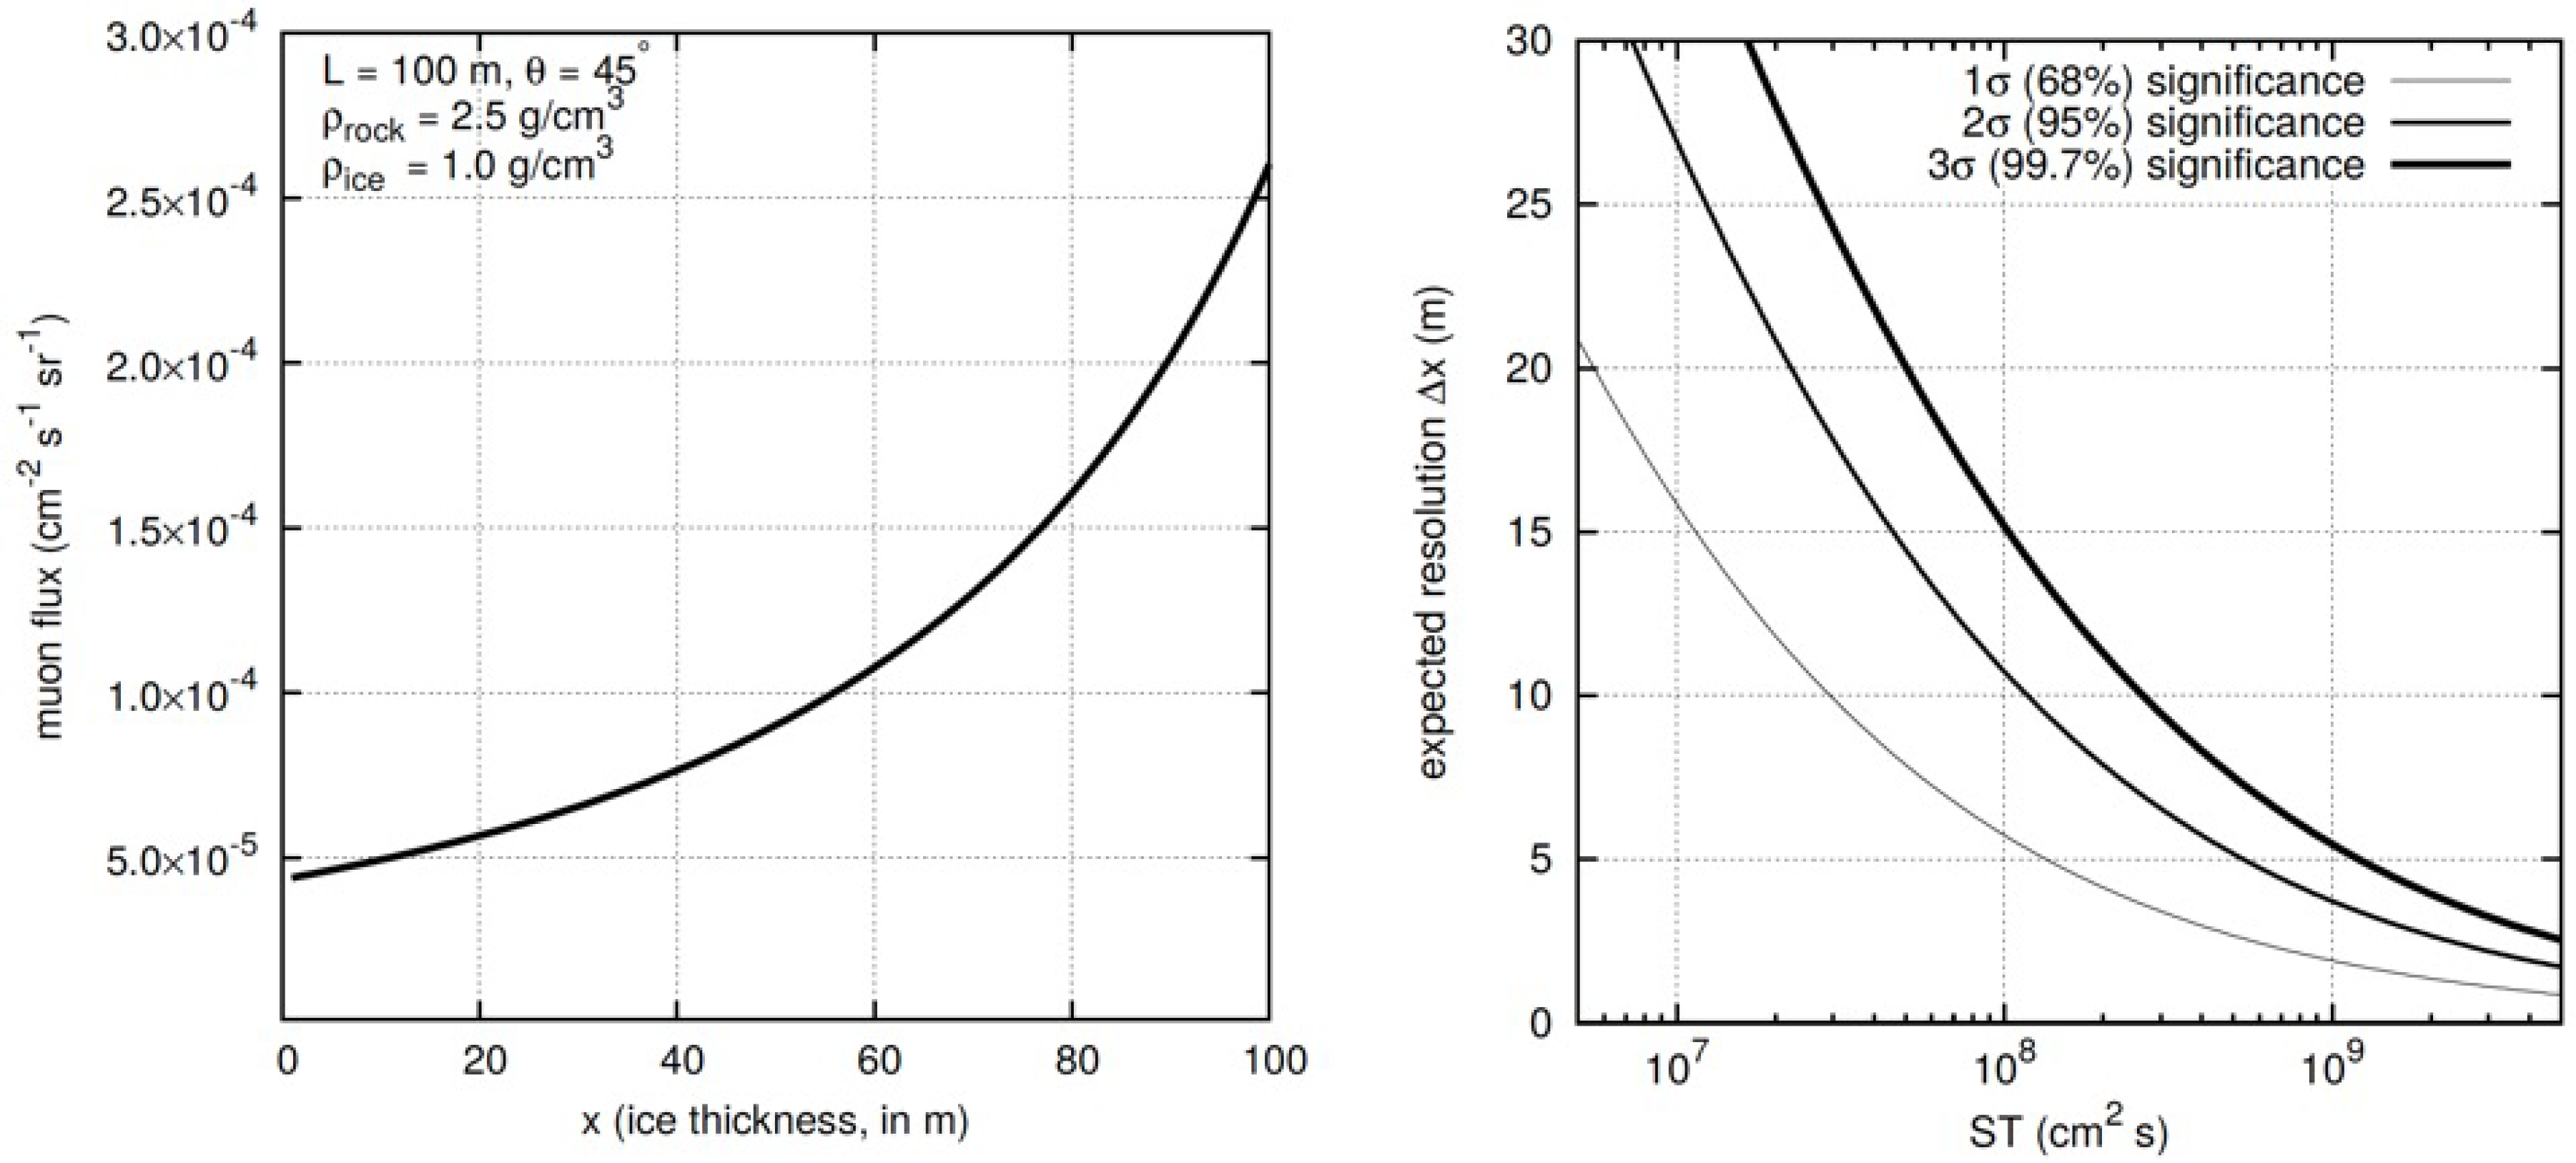
2. 3D Cosmic Muon Radiography Applied to Alpine Glaciers
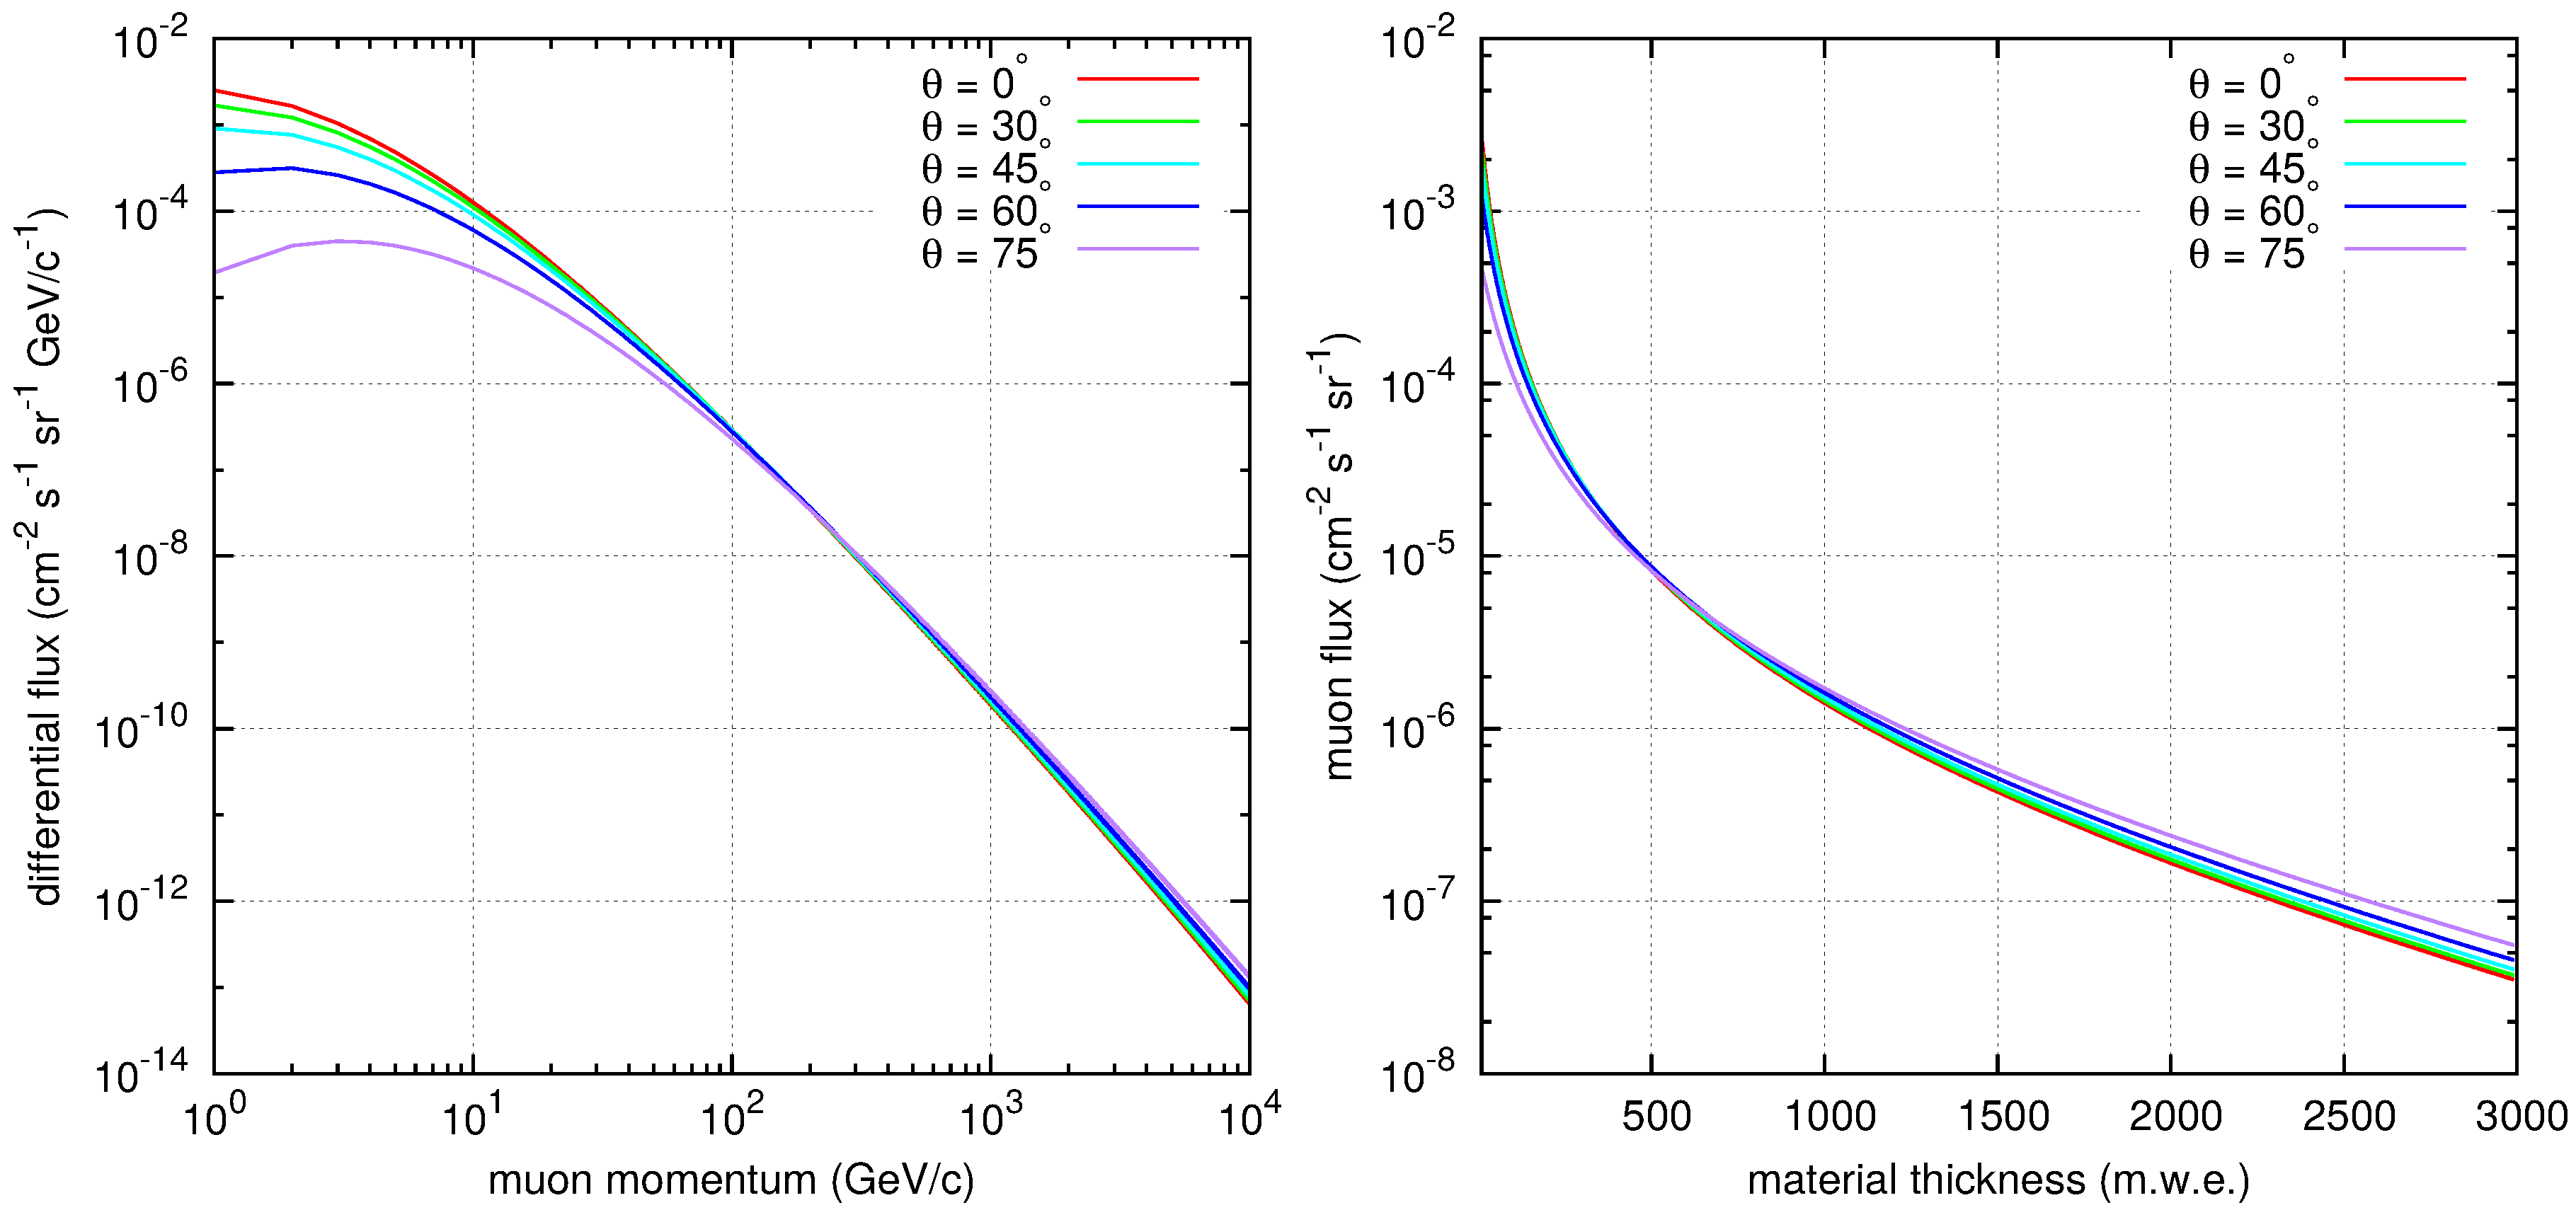
3. Muon Flux Detection
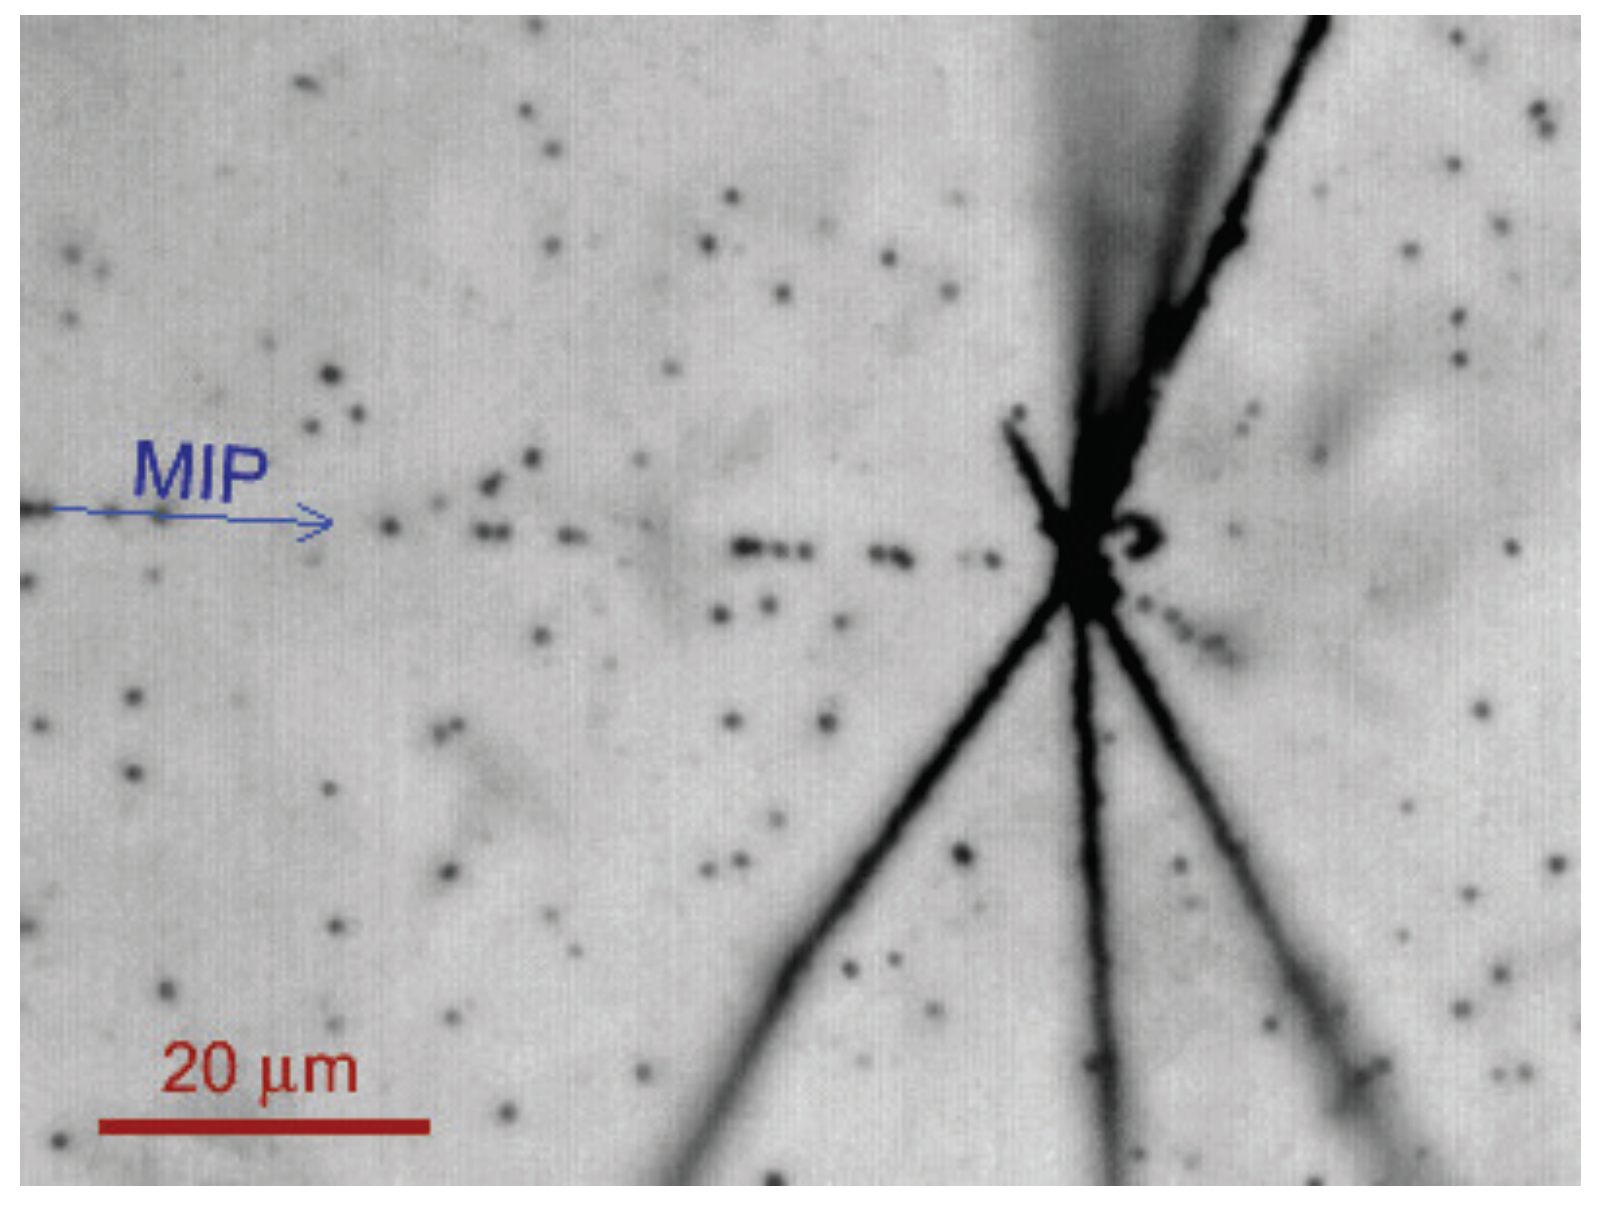
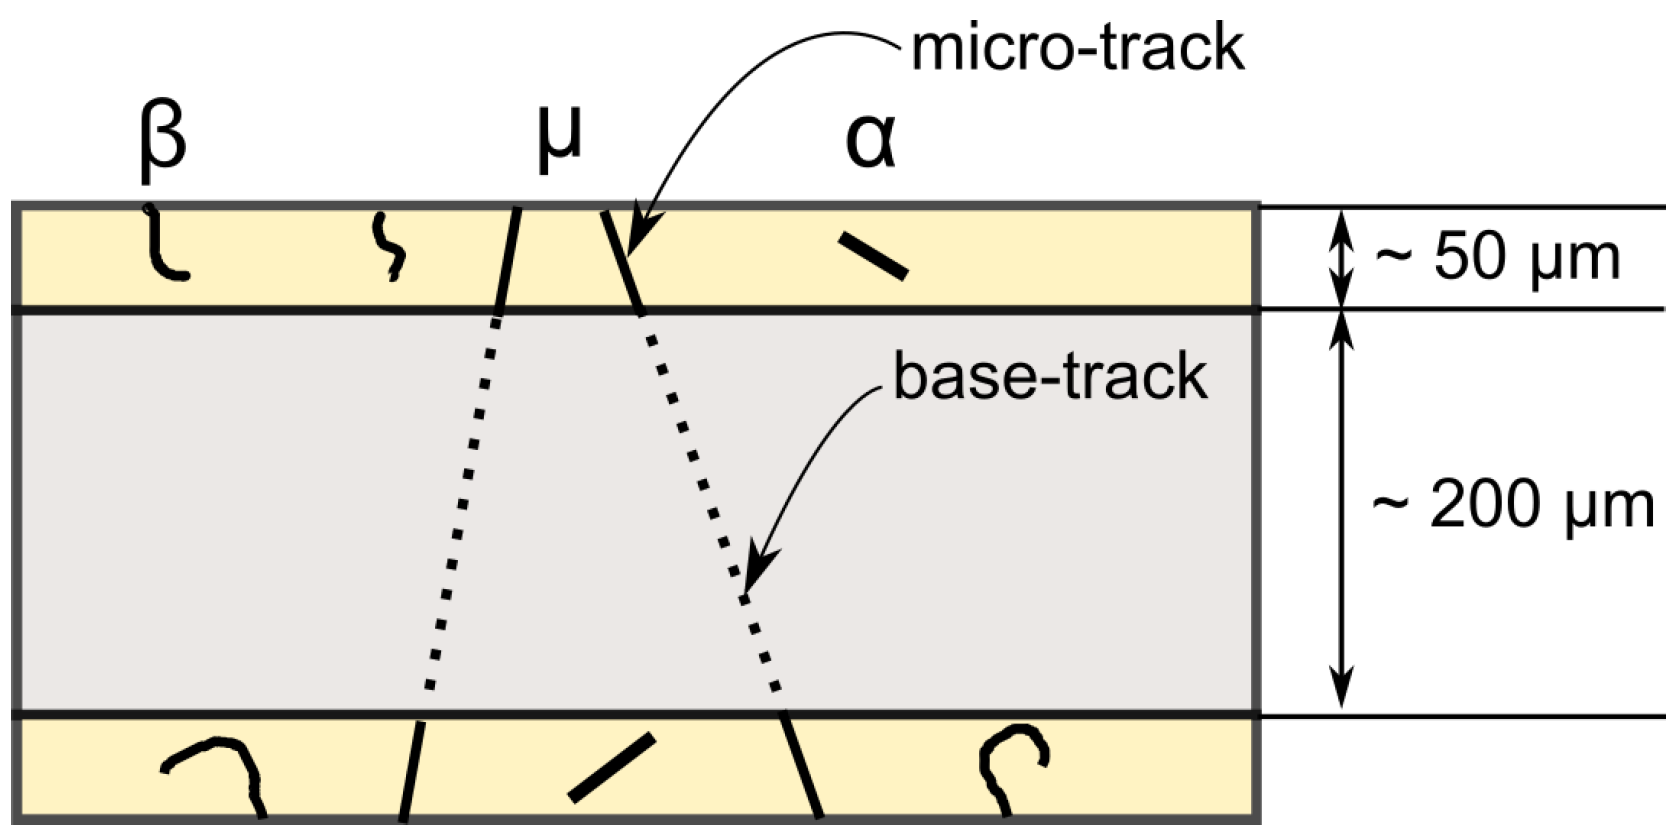
3.1. Emulsion Film Detectors
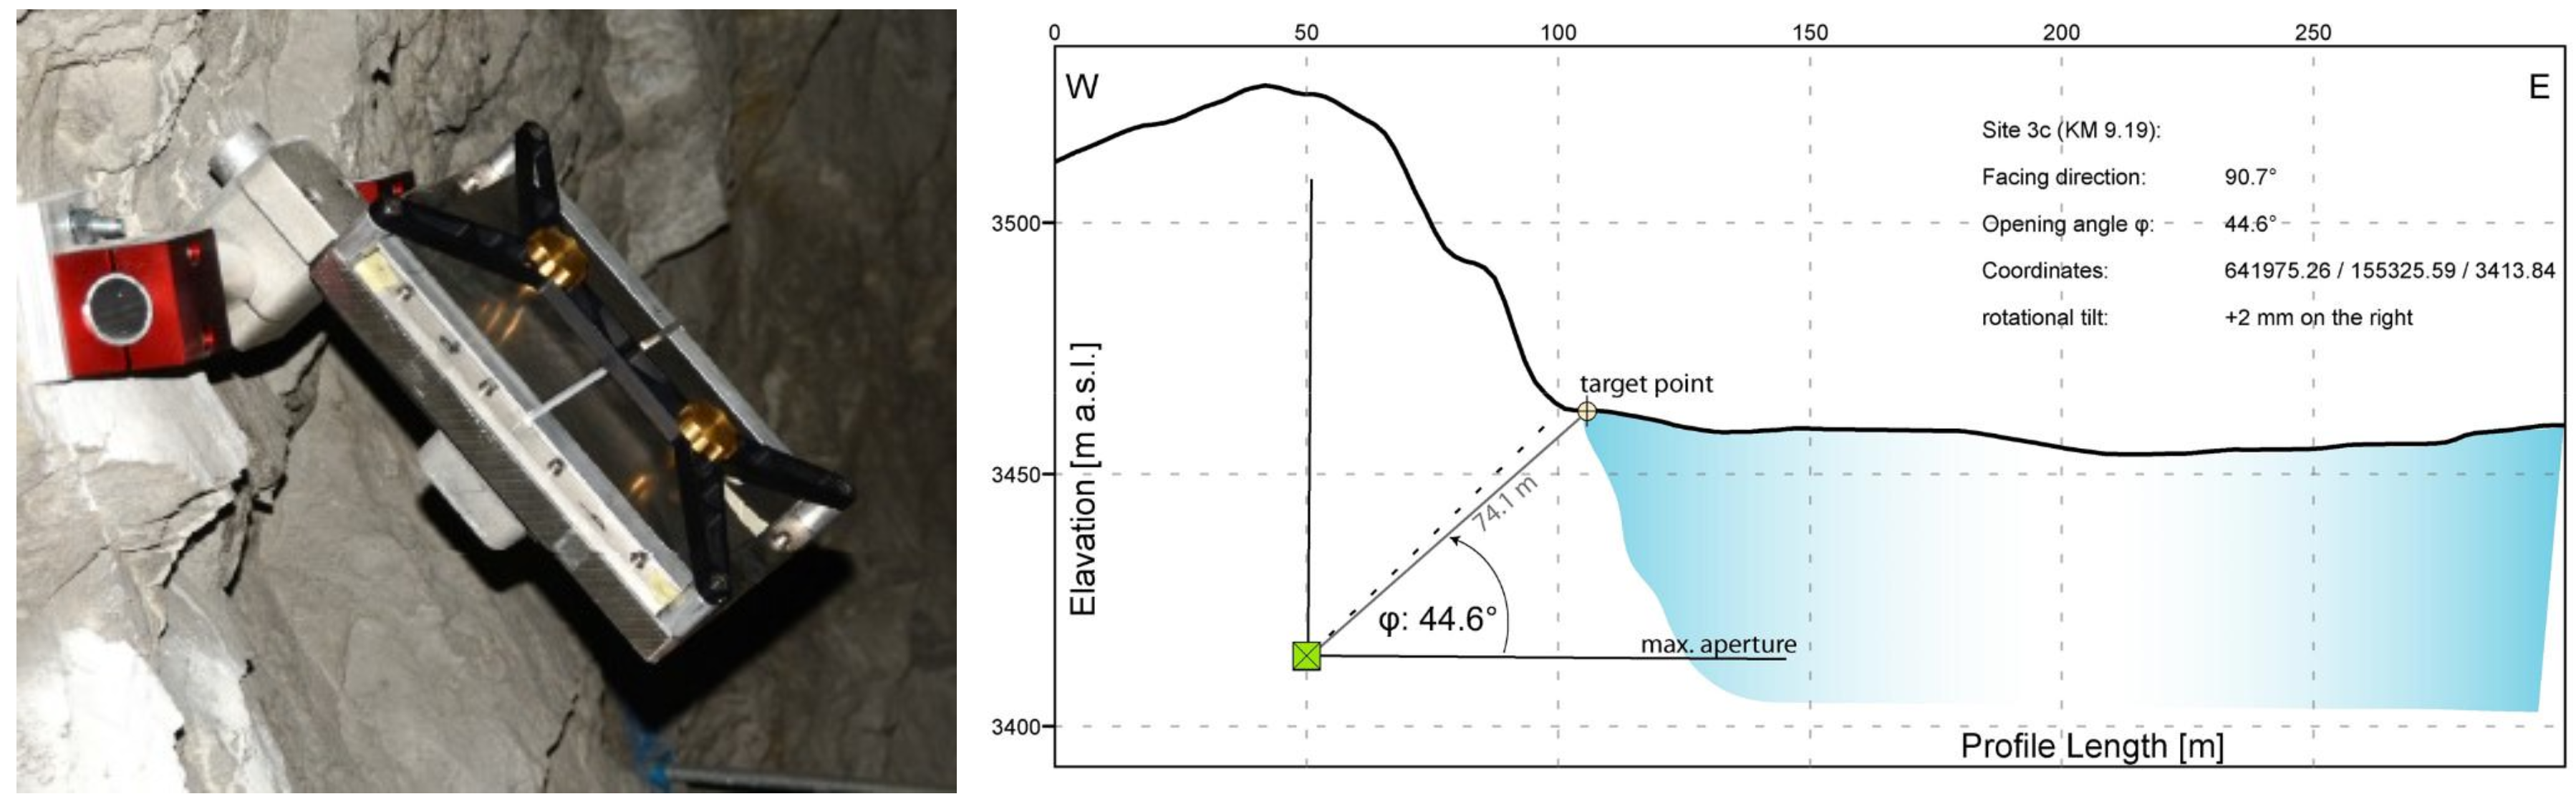
3.2. Detector Design
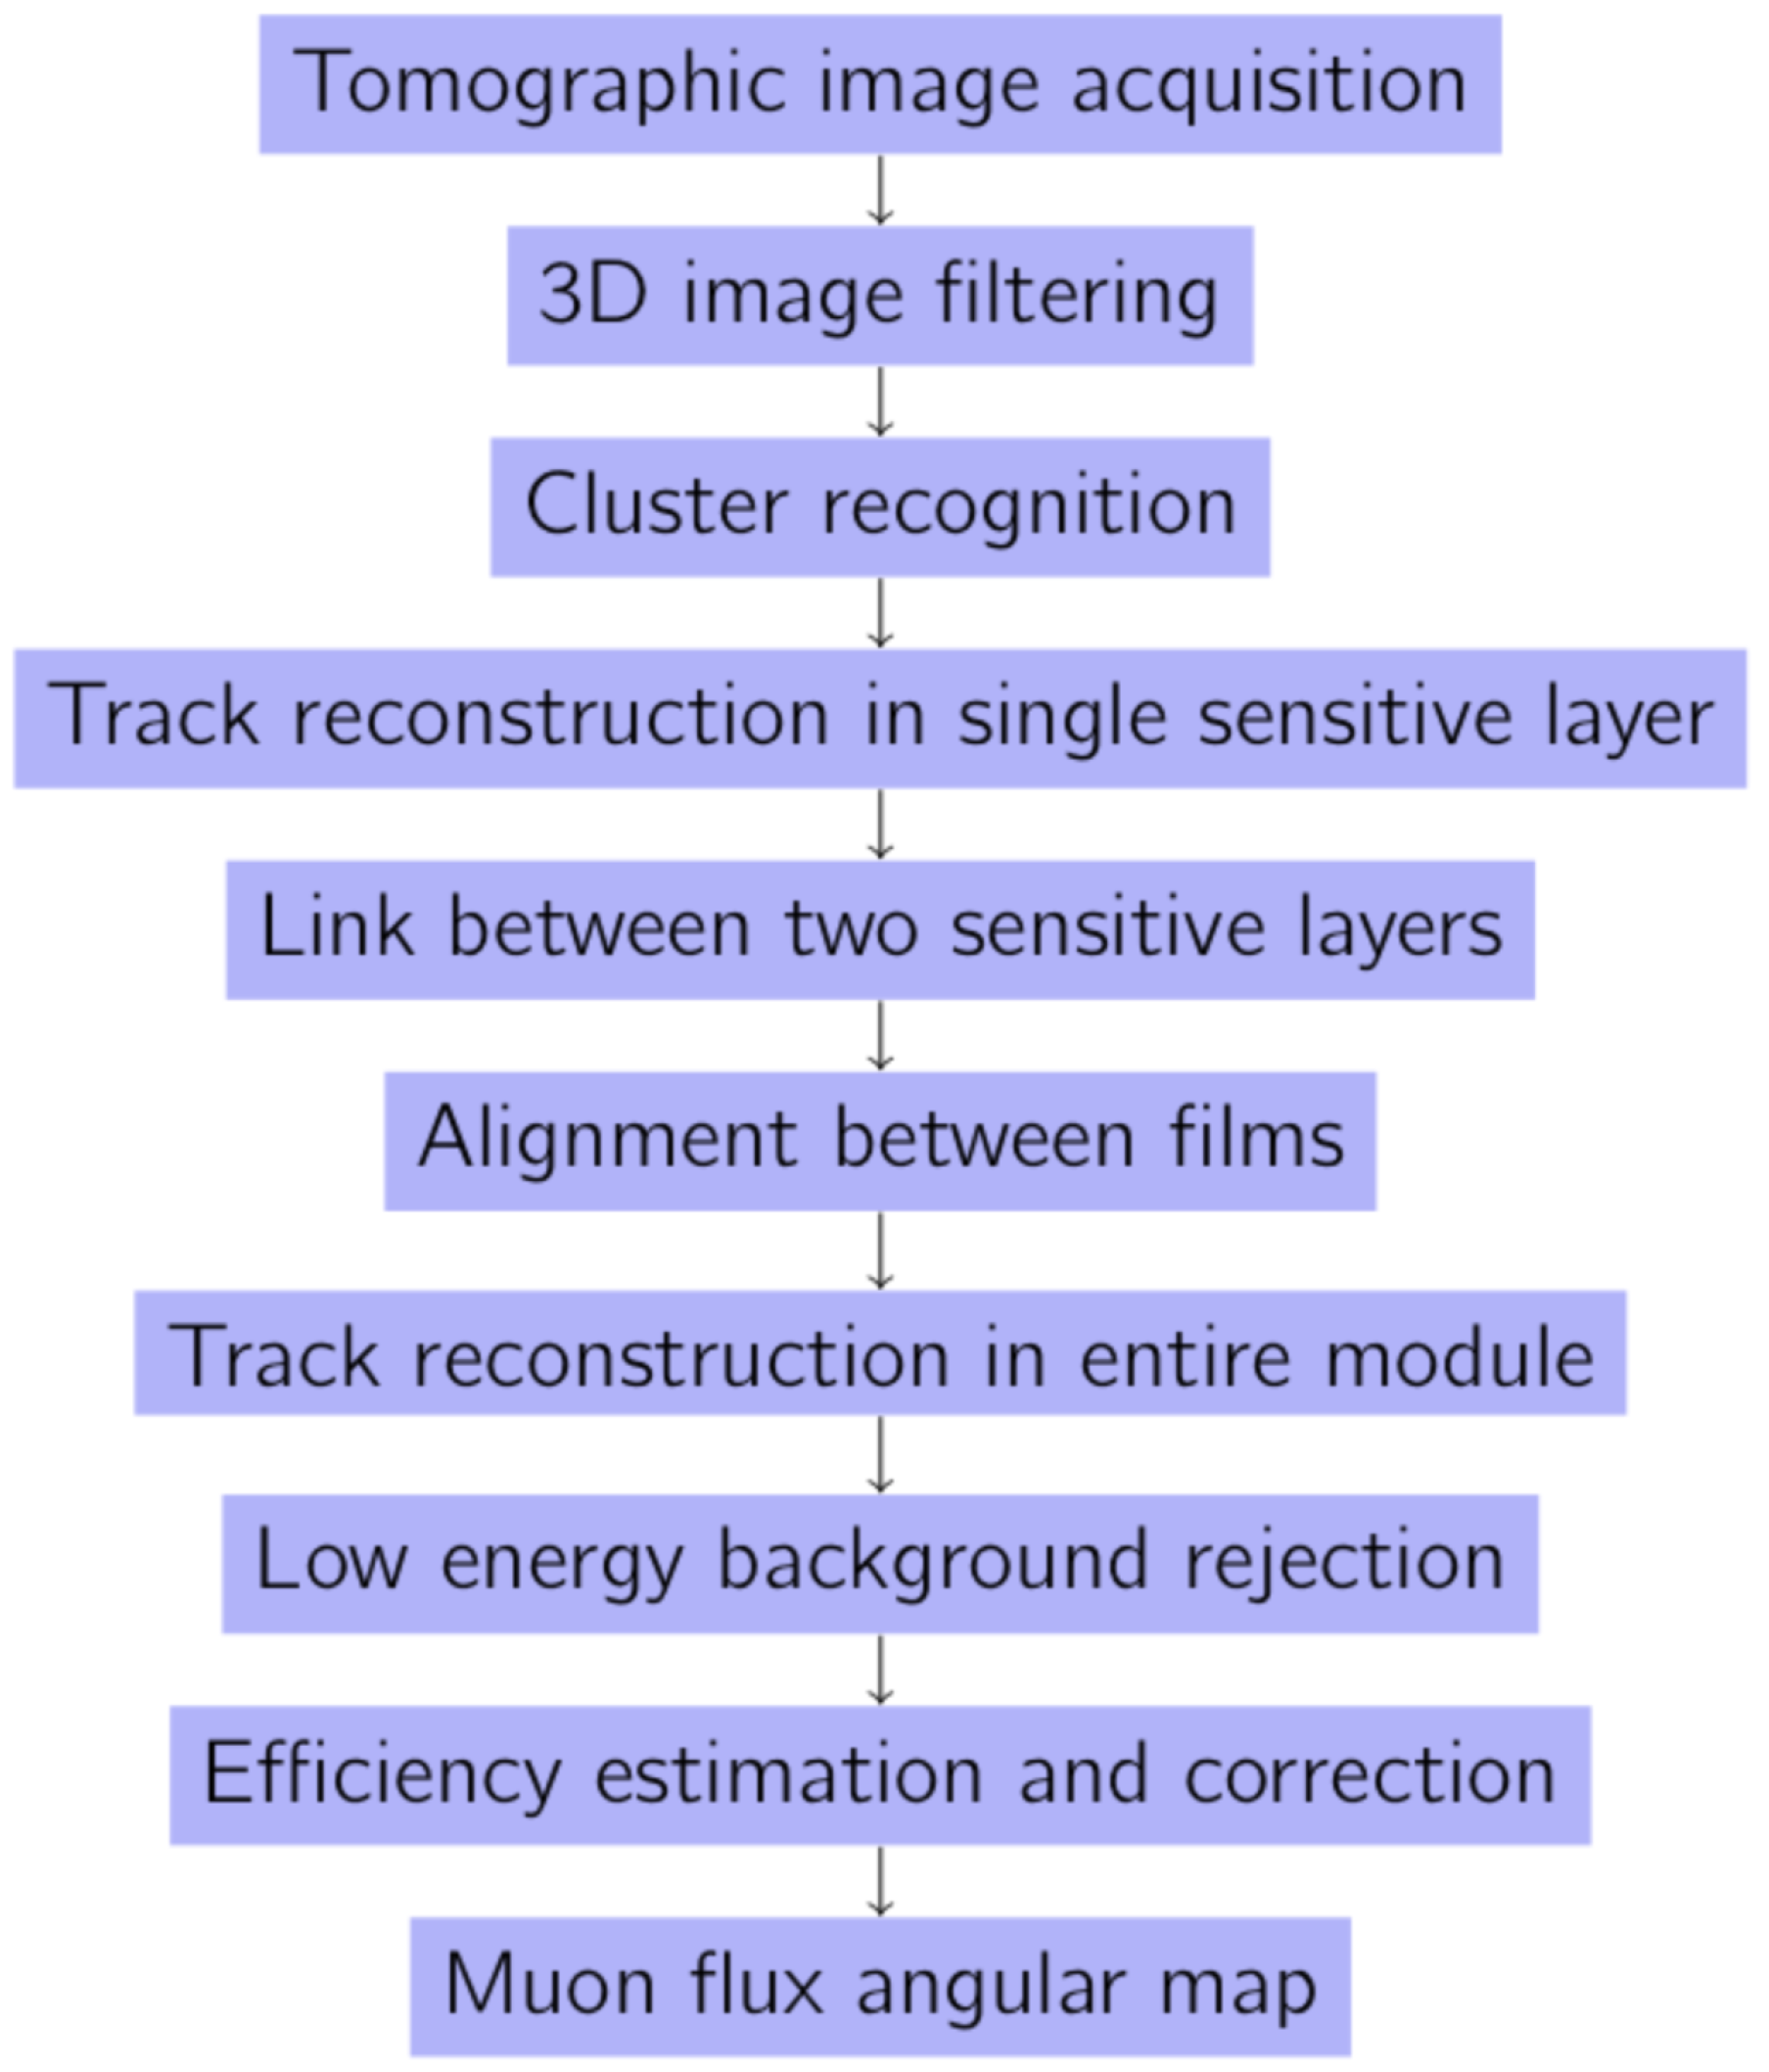
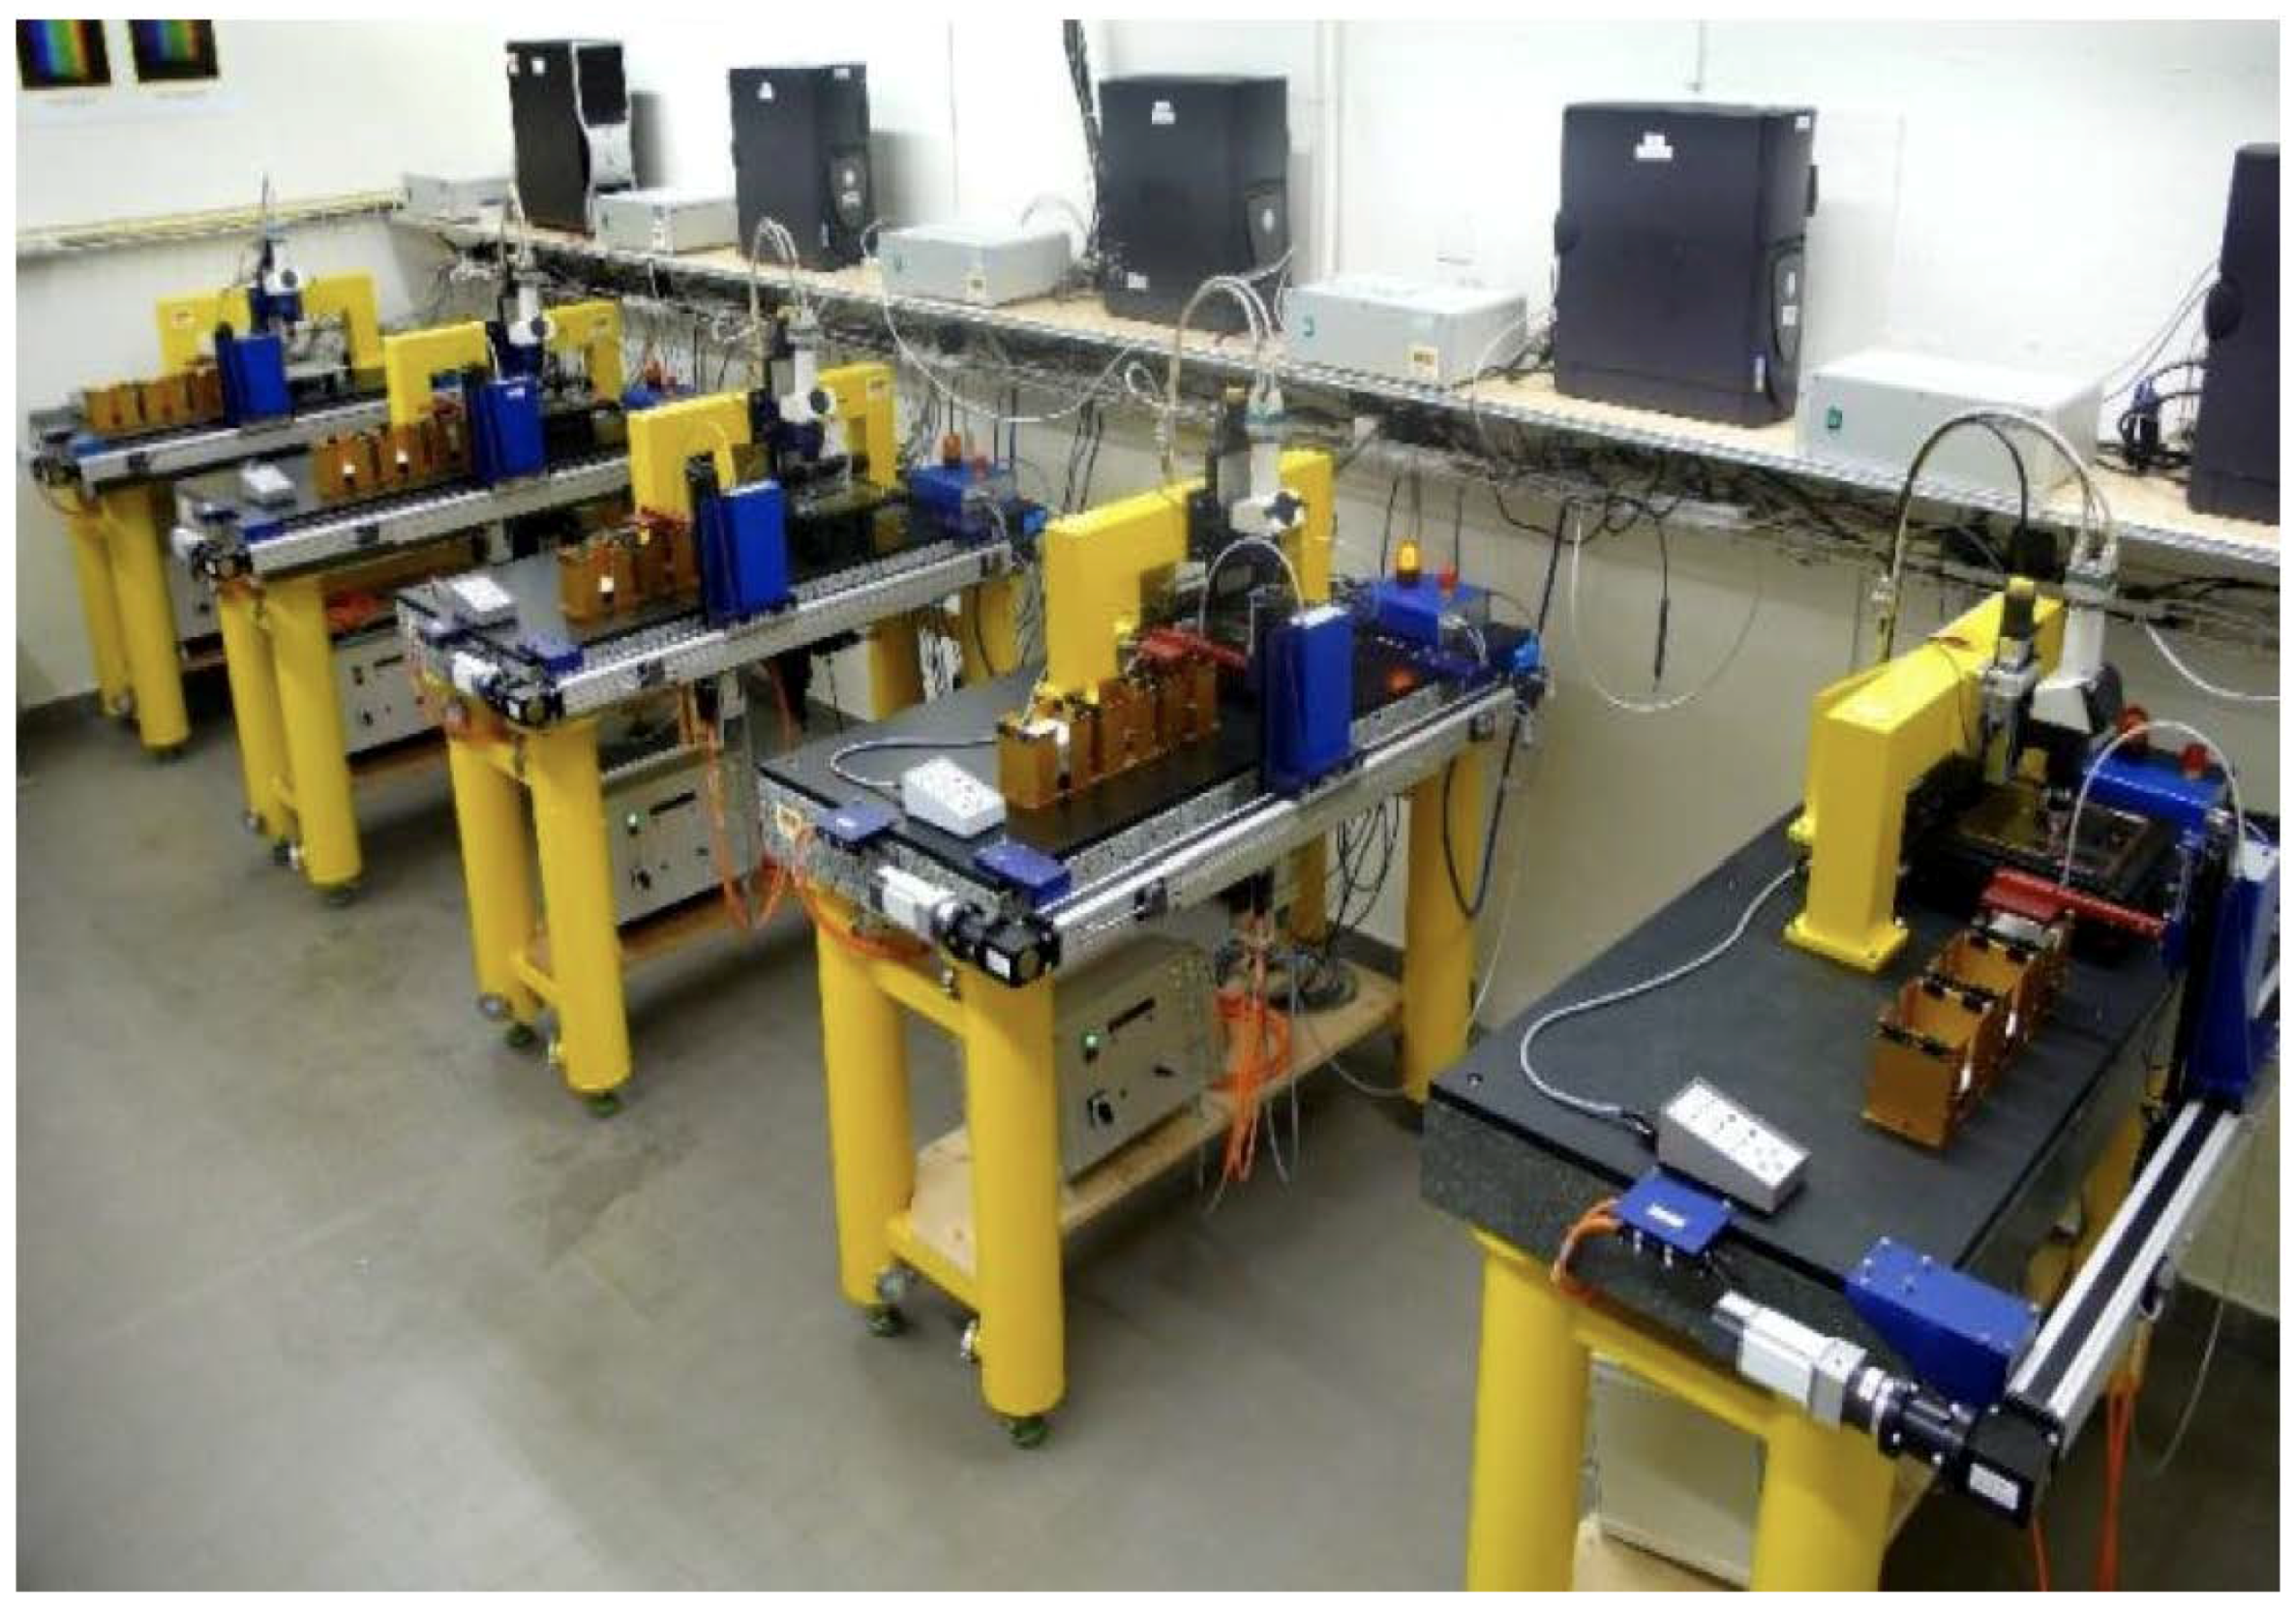
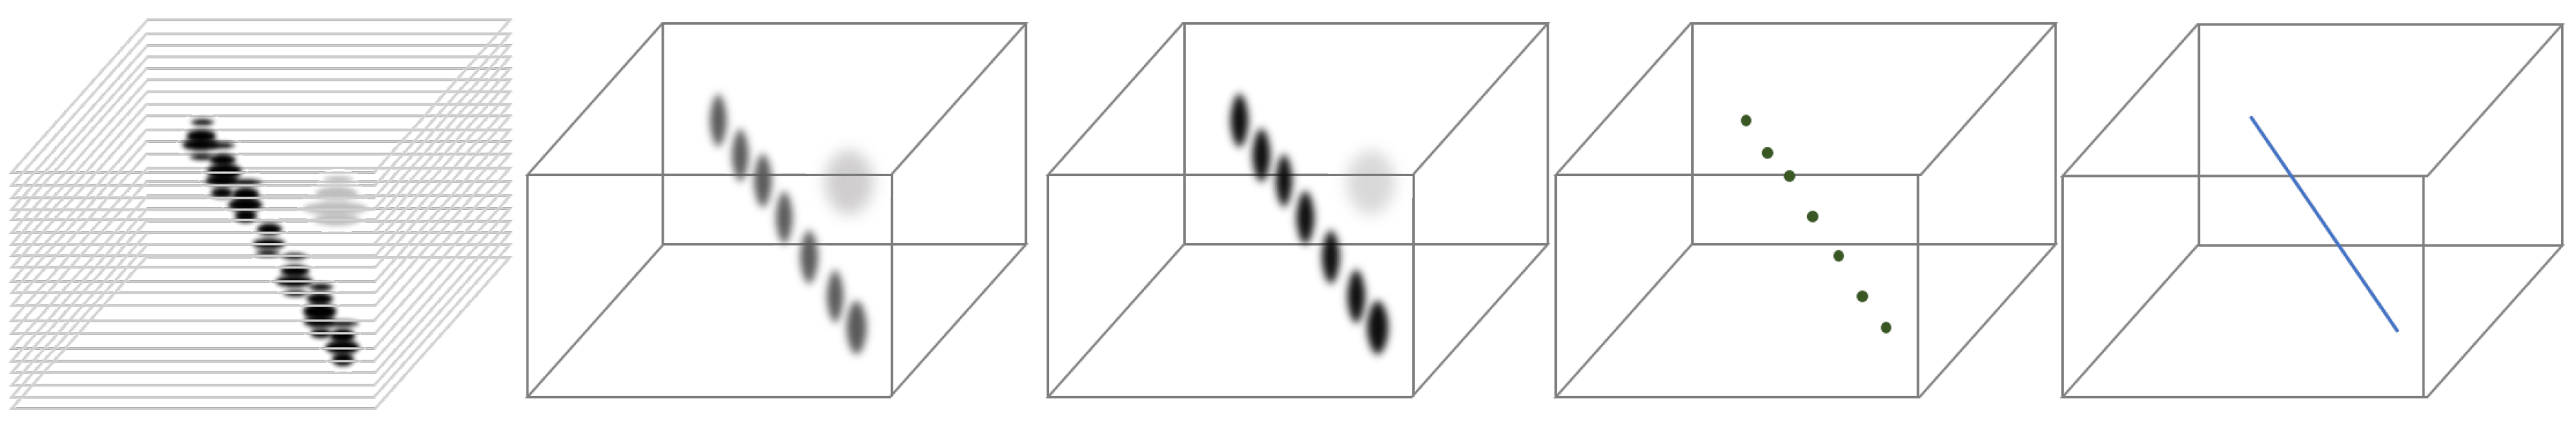
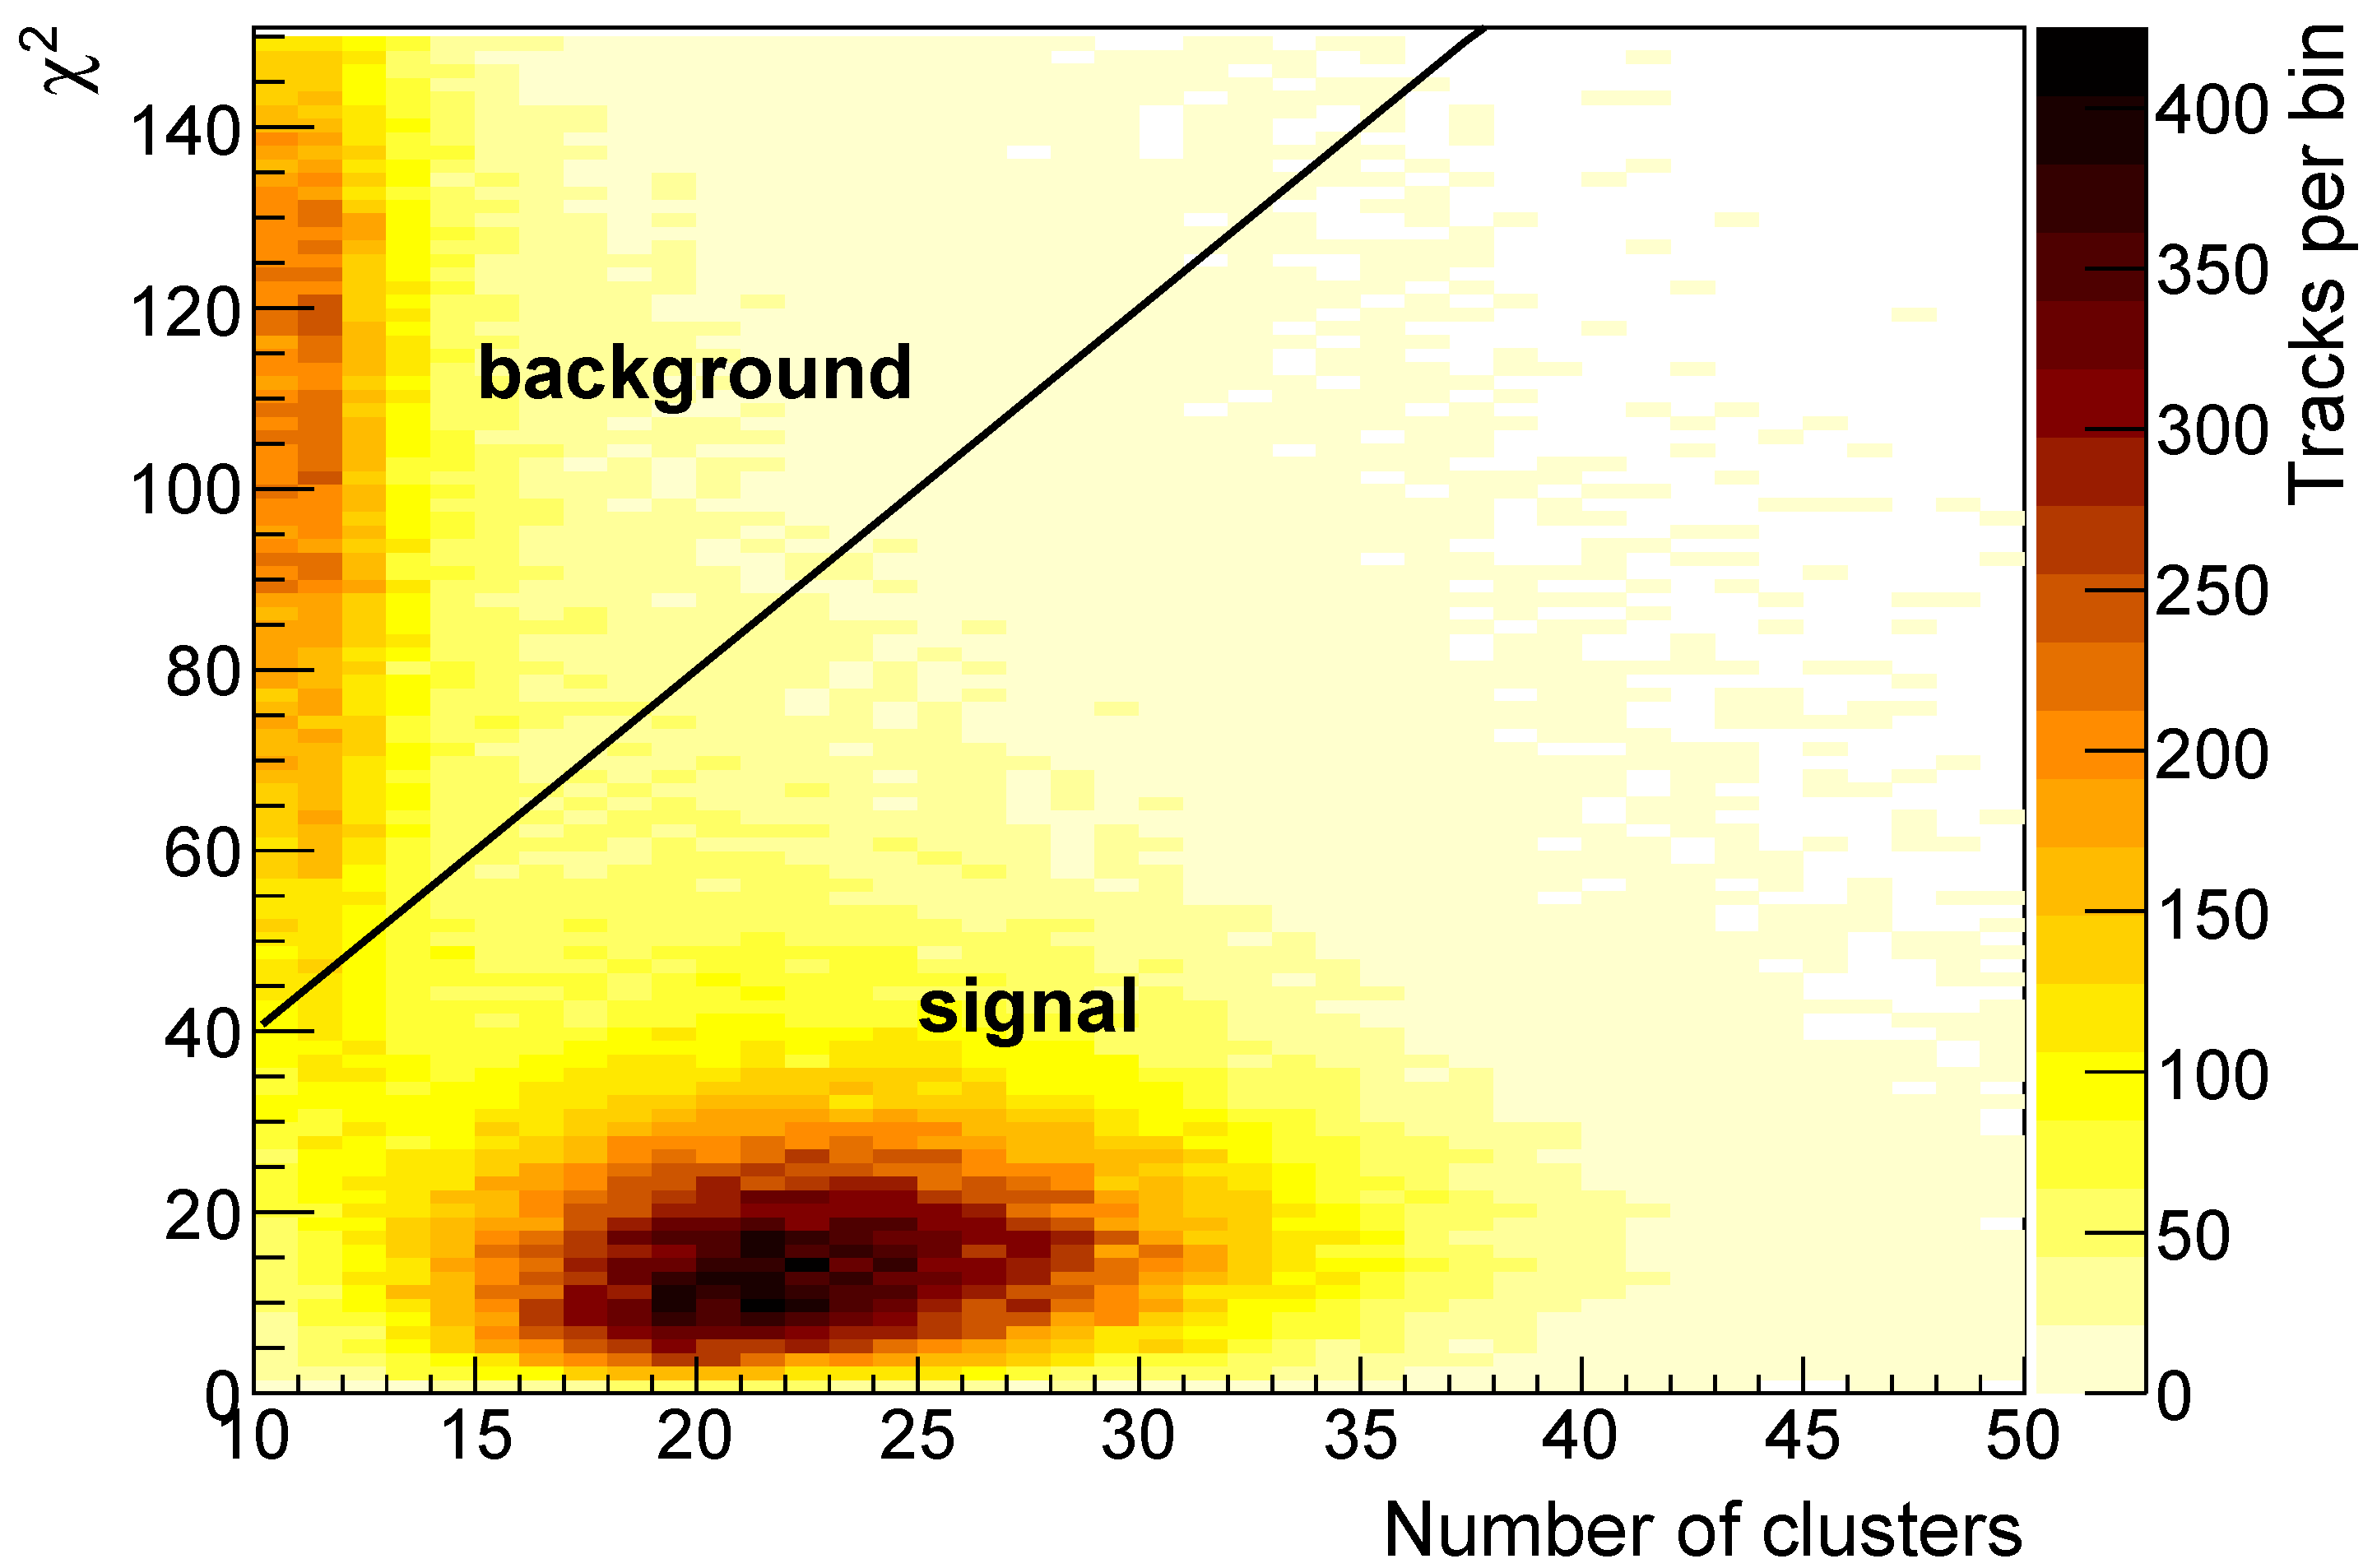
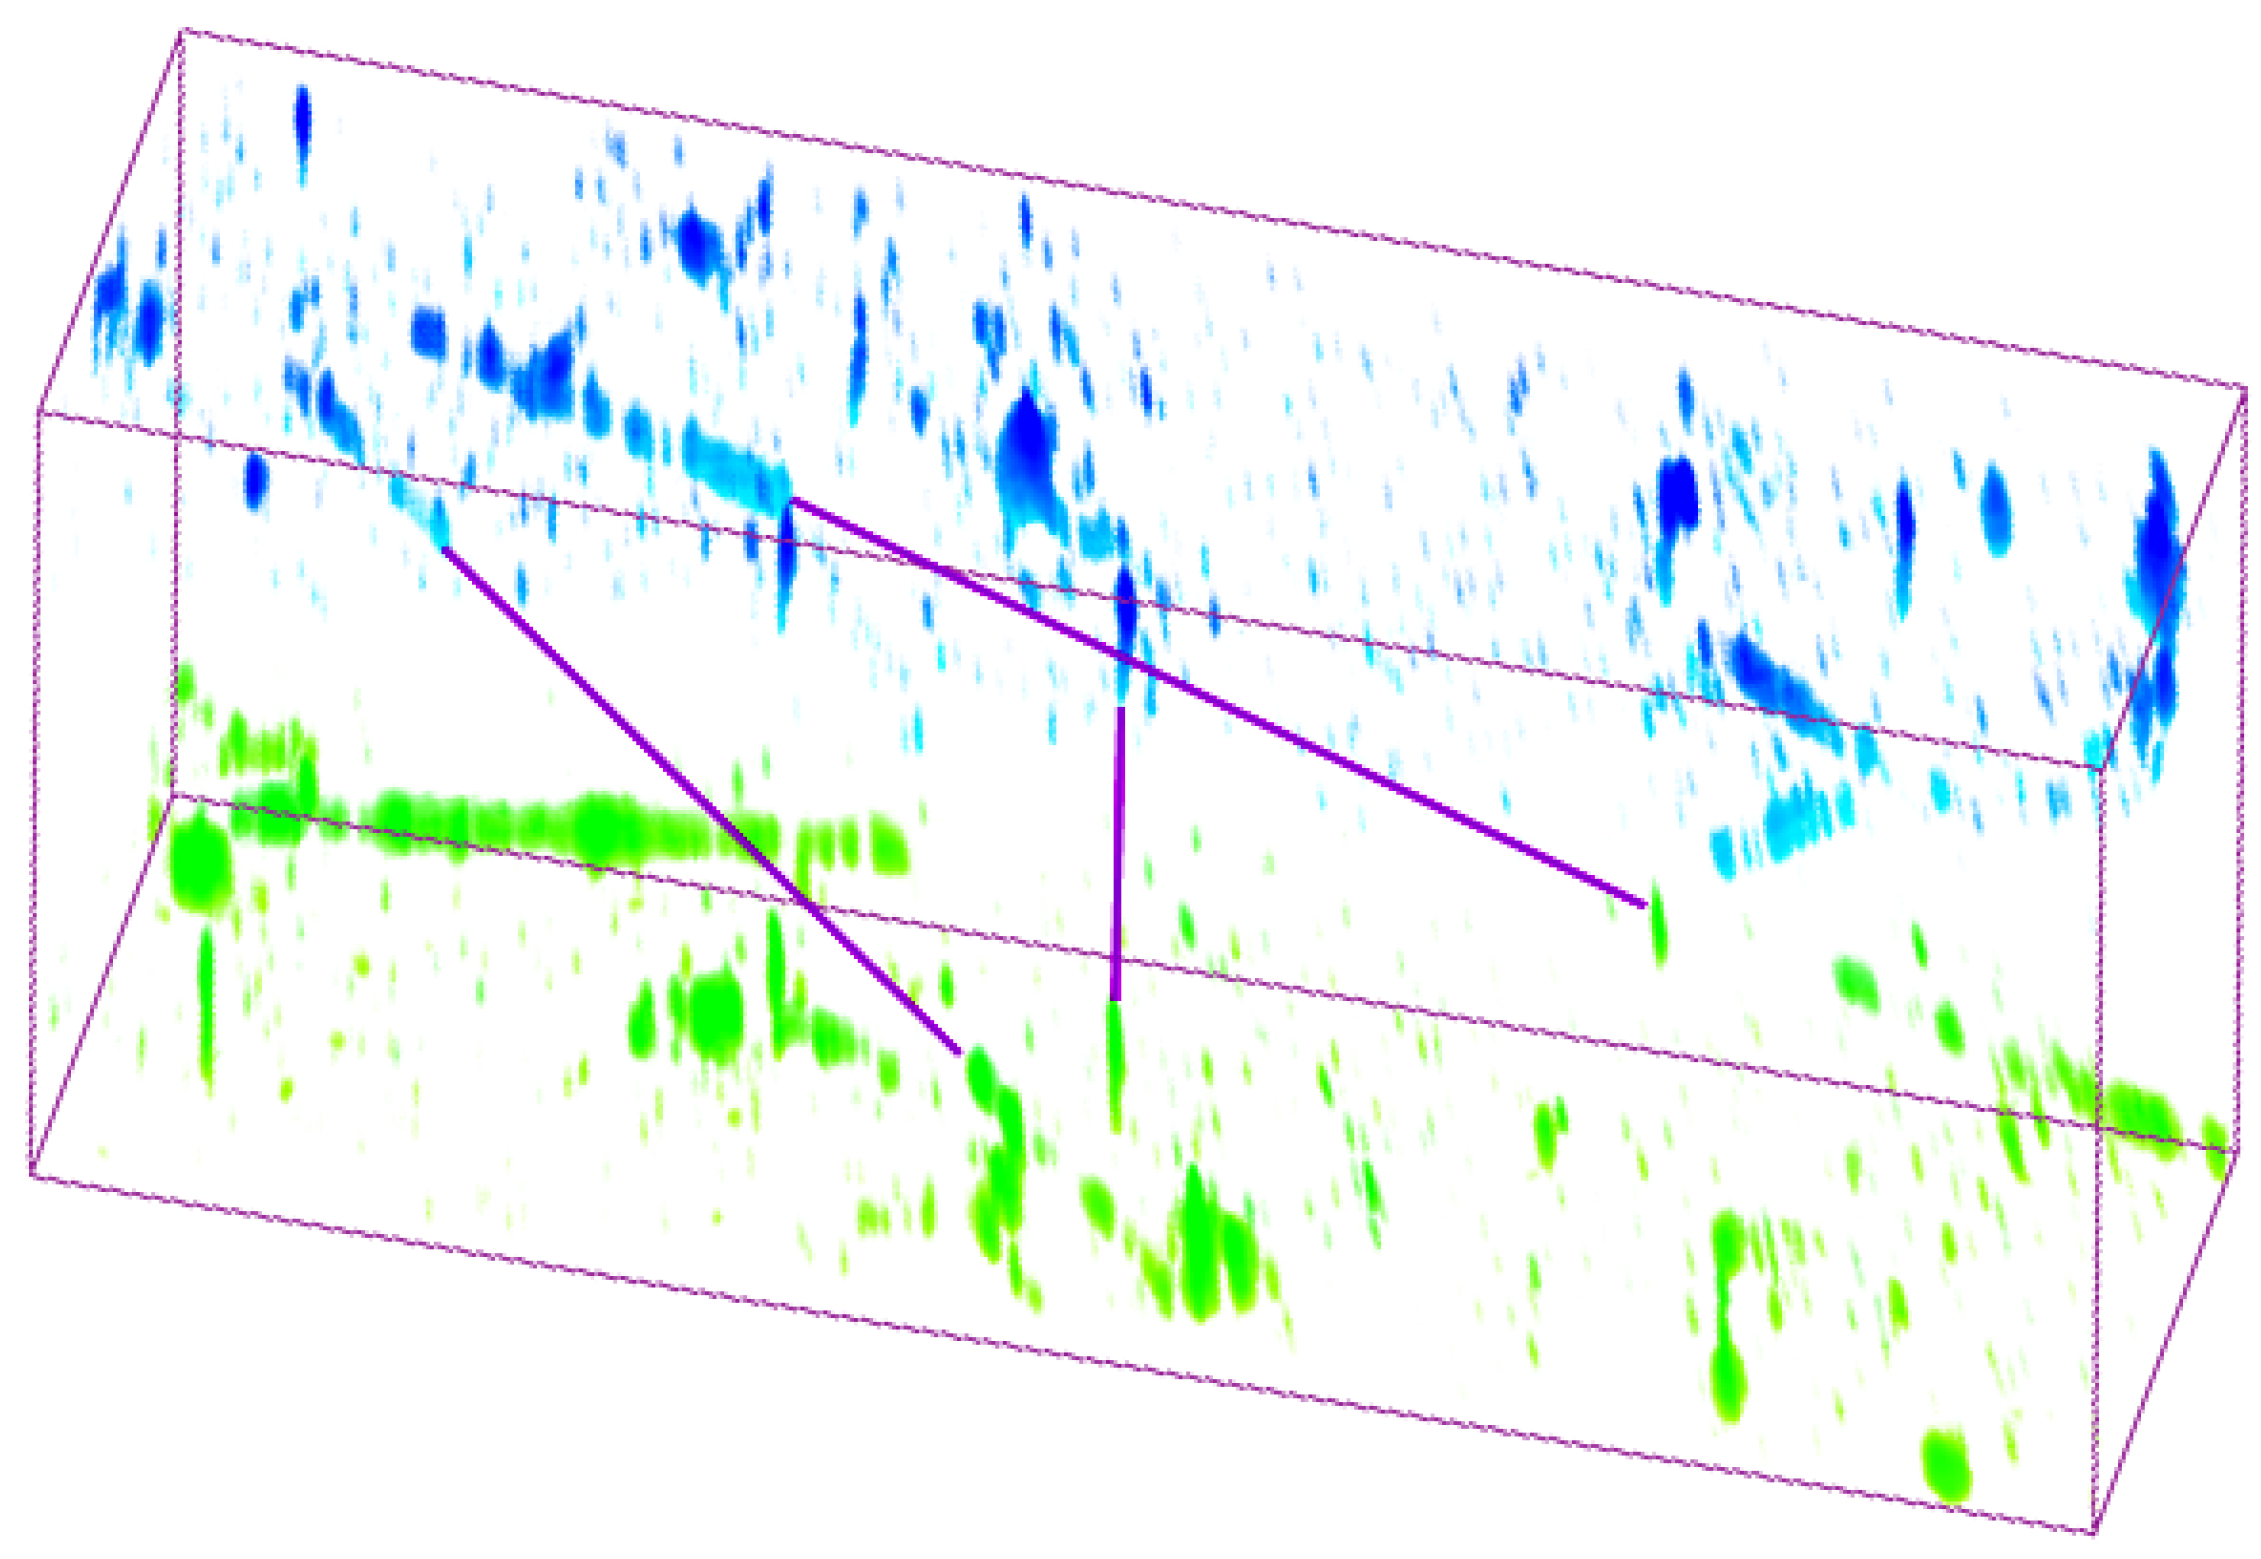
4. Readout and Track Reconstruction
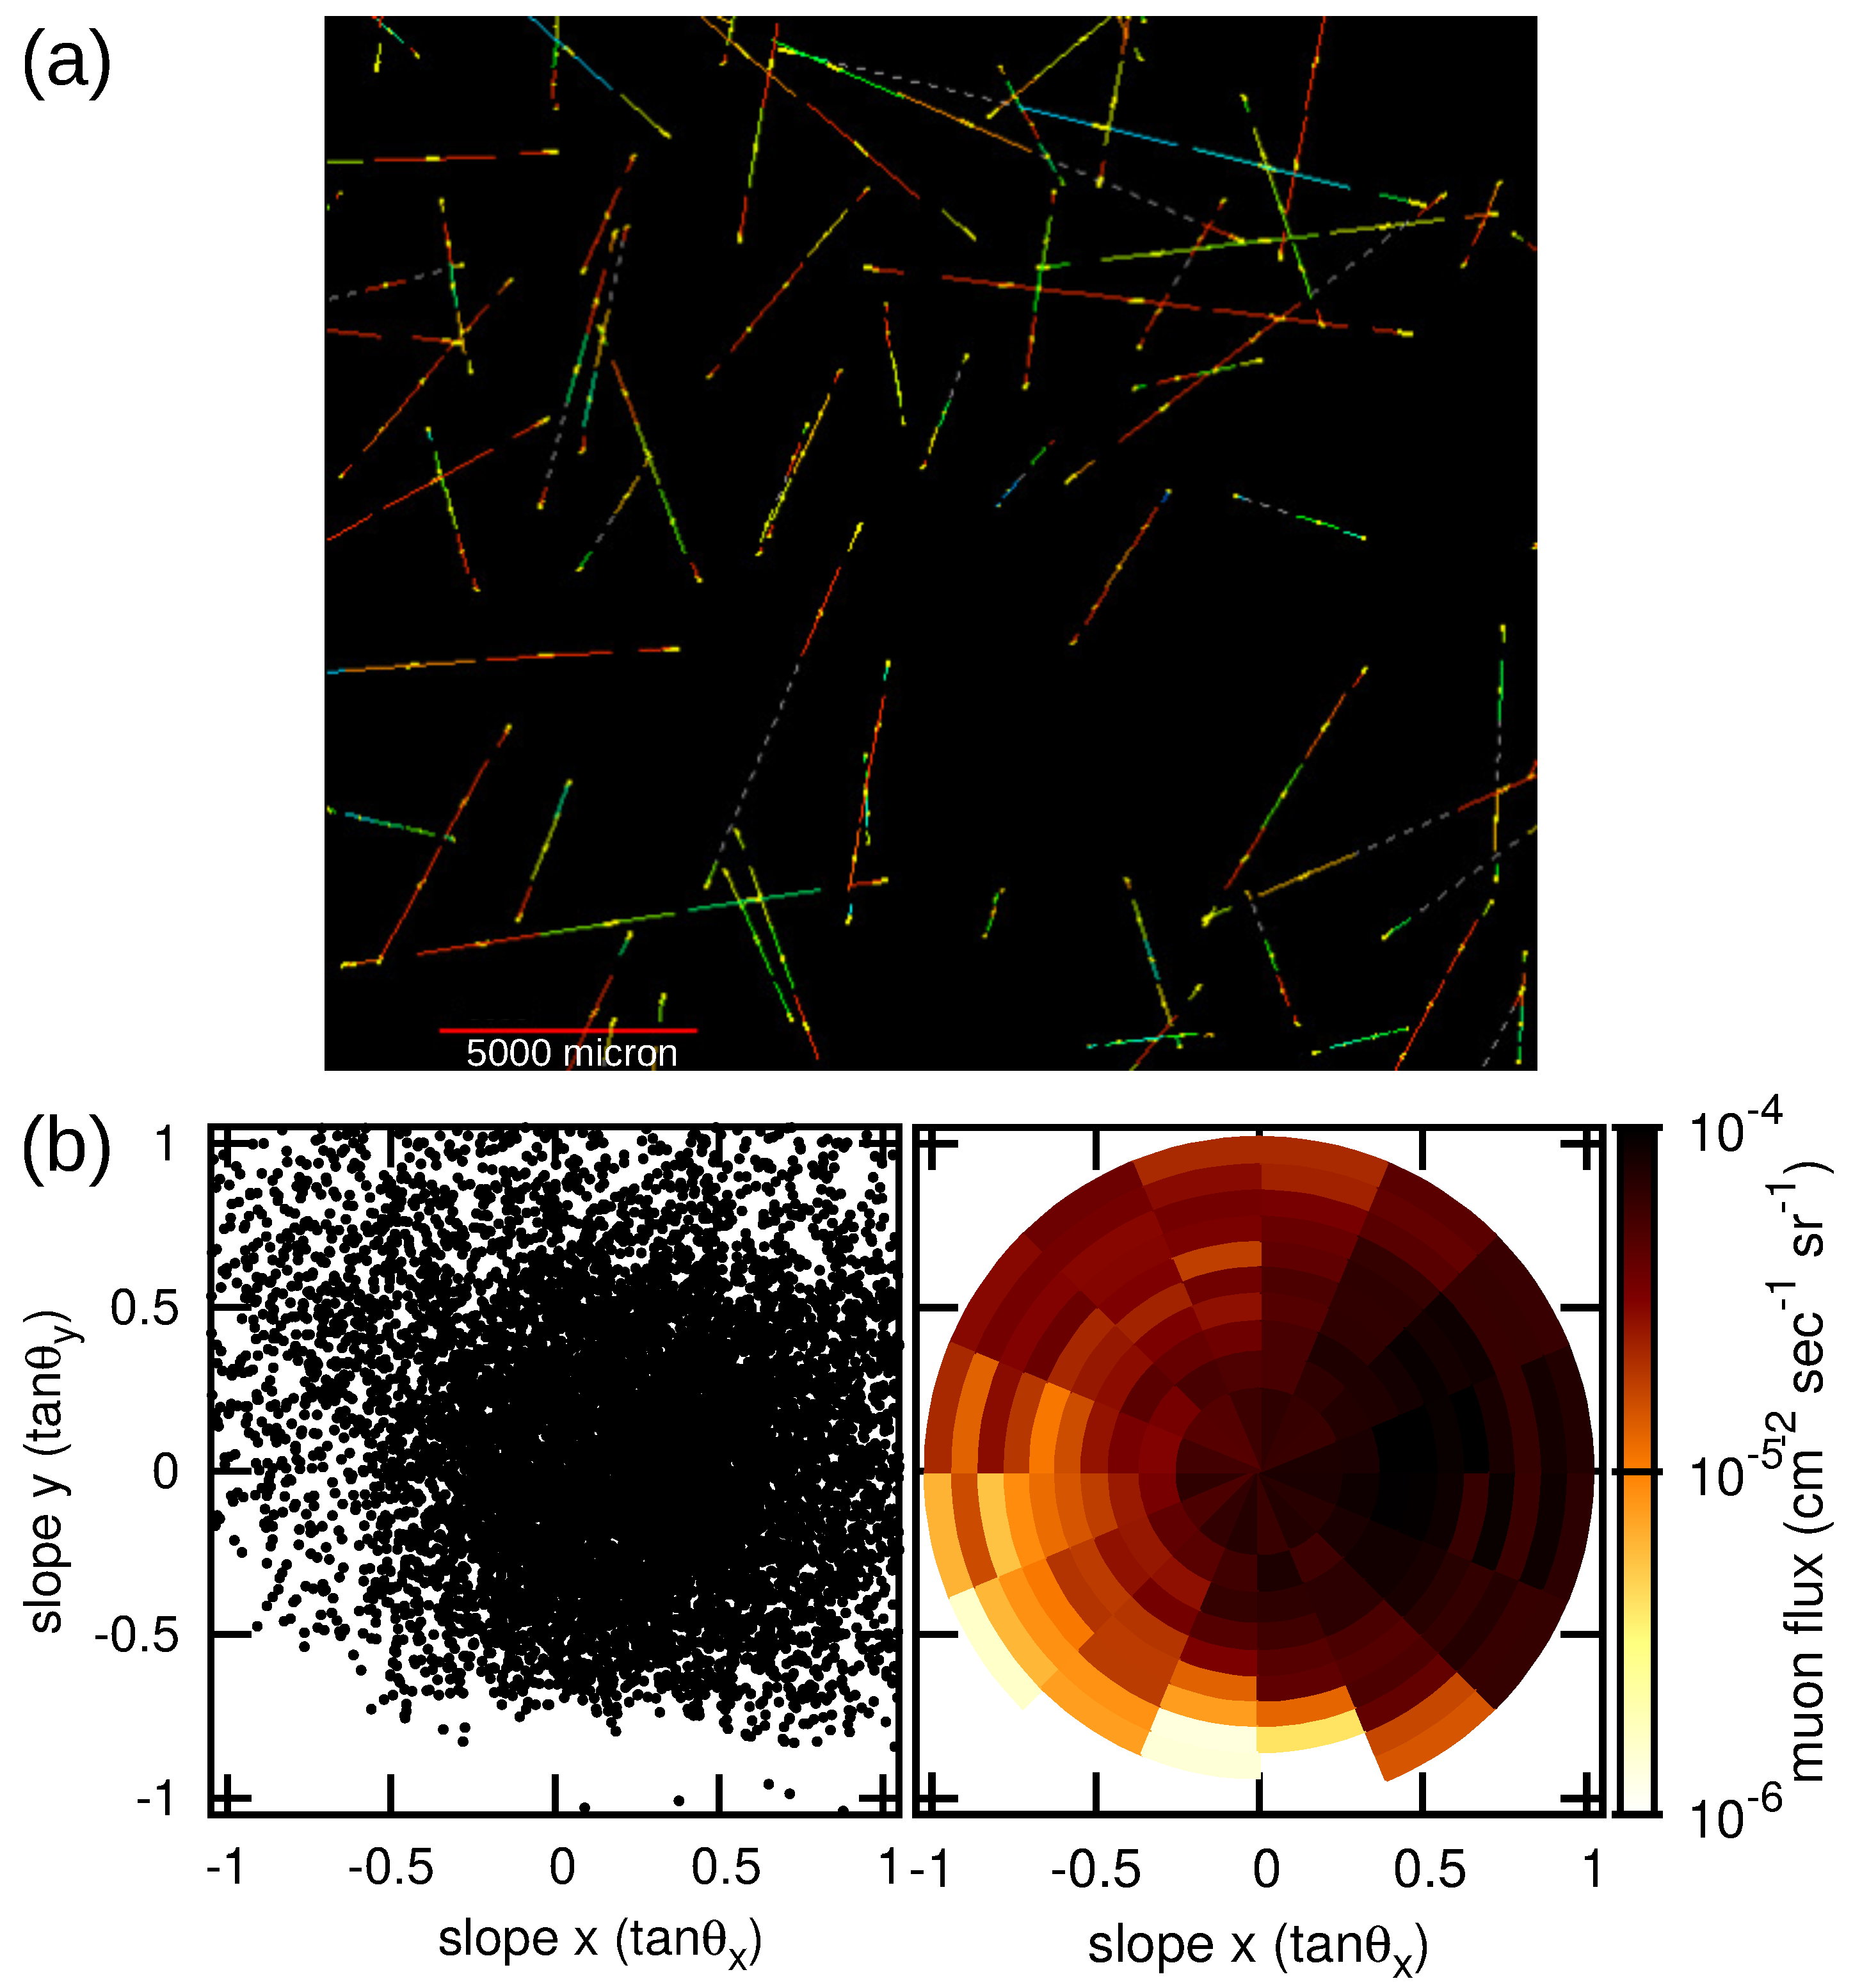
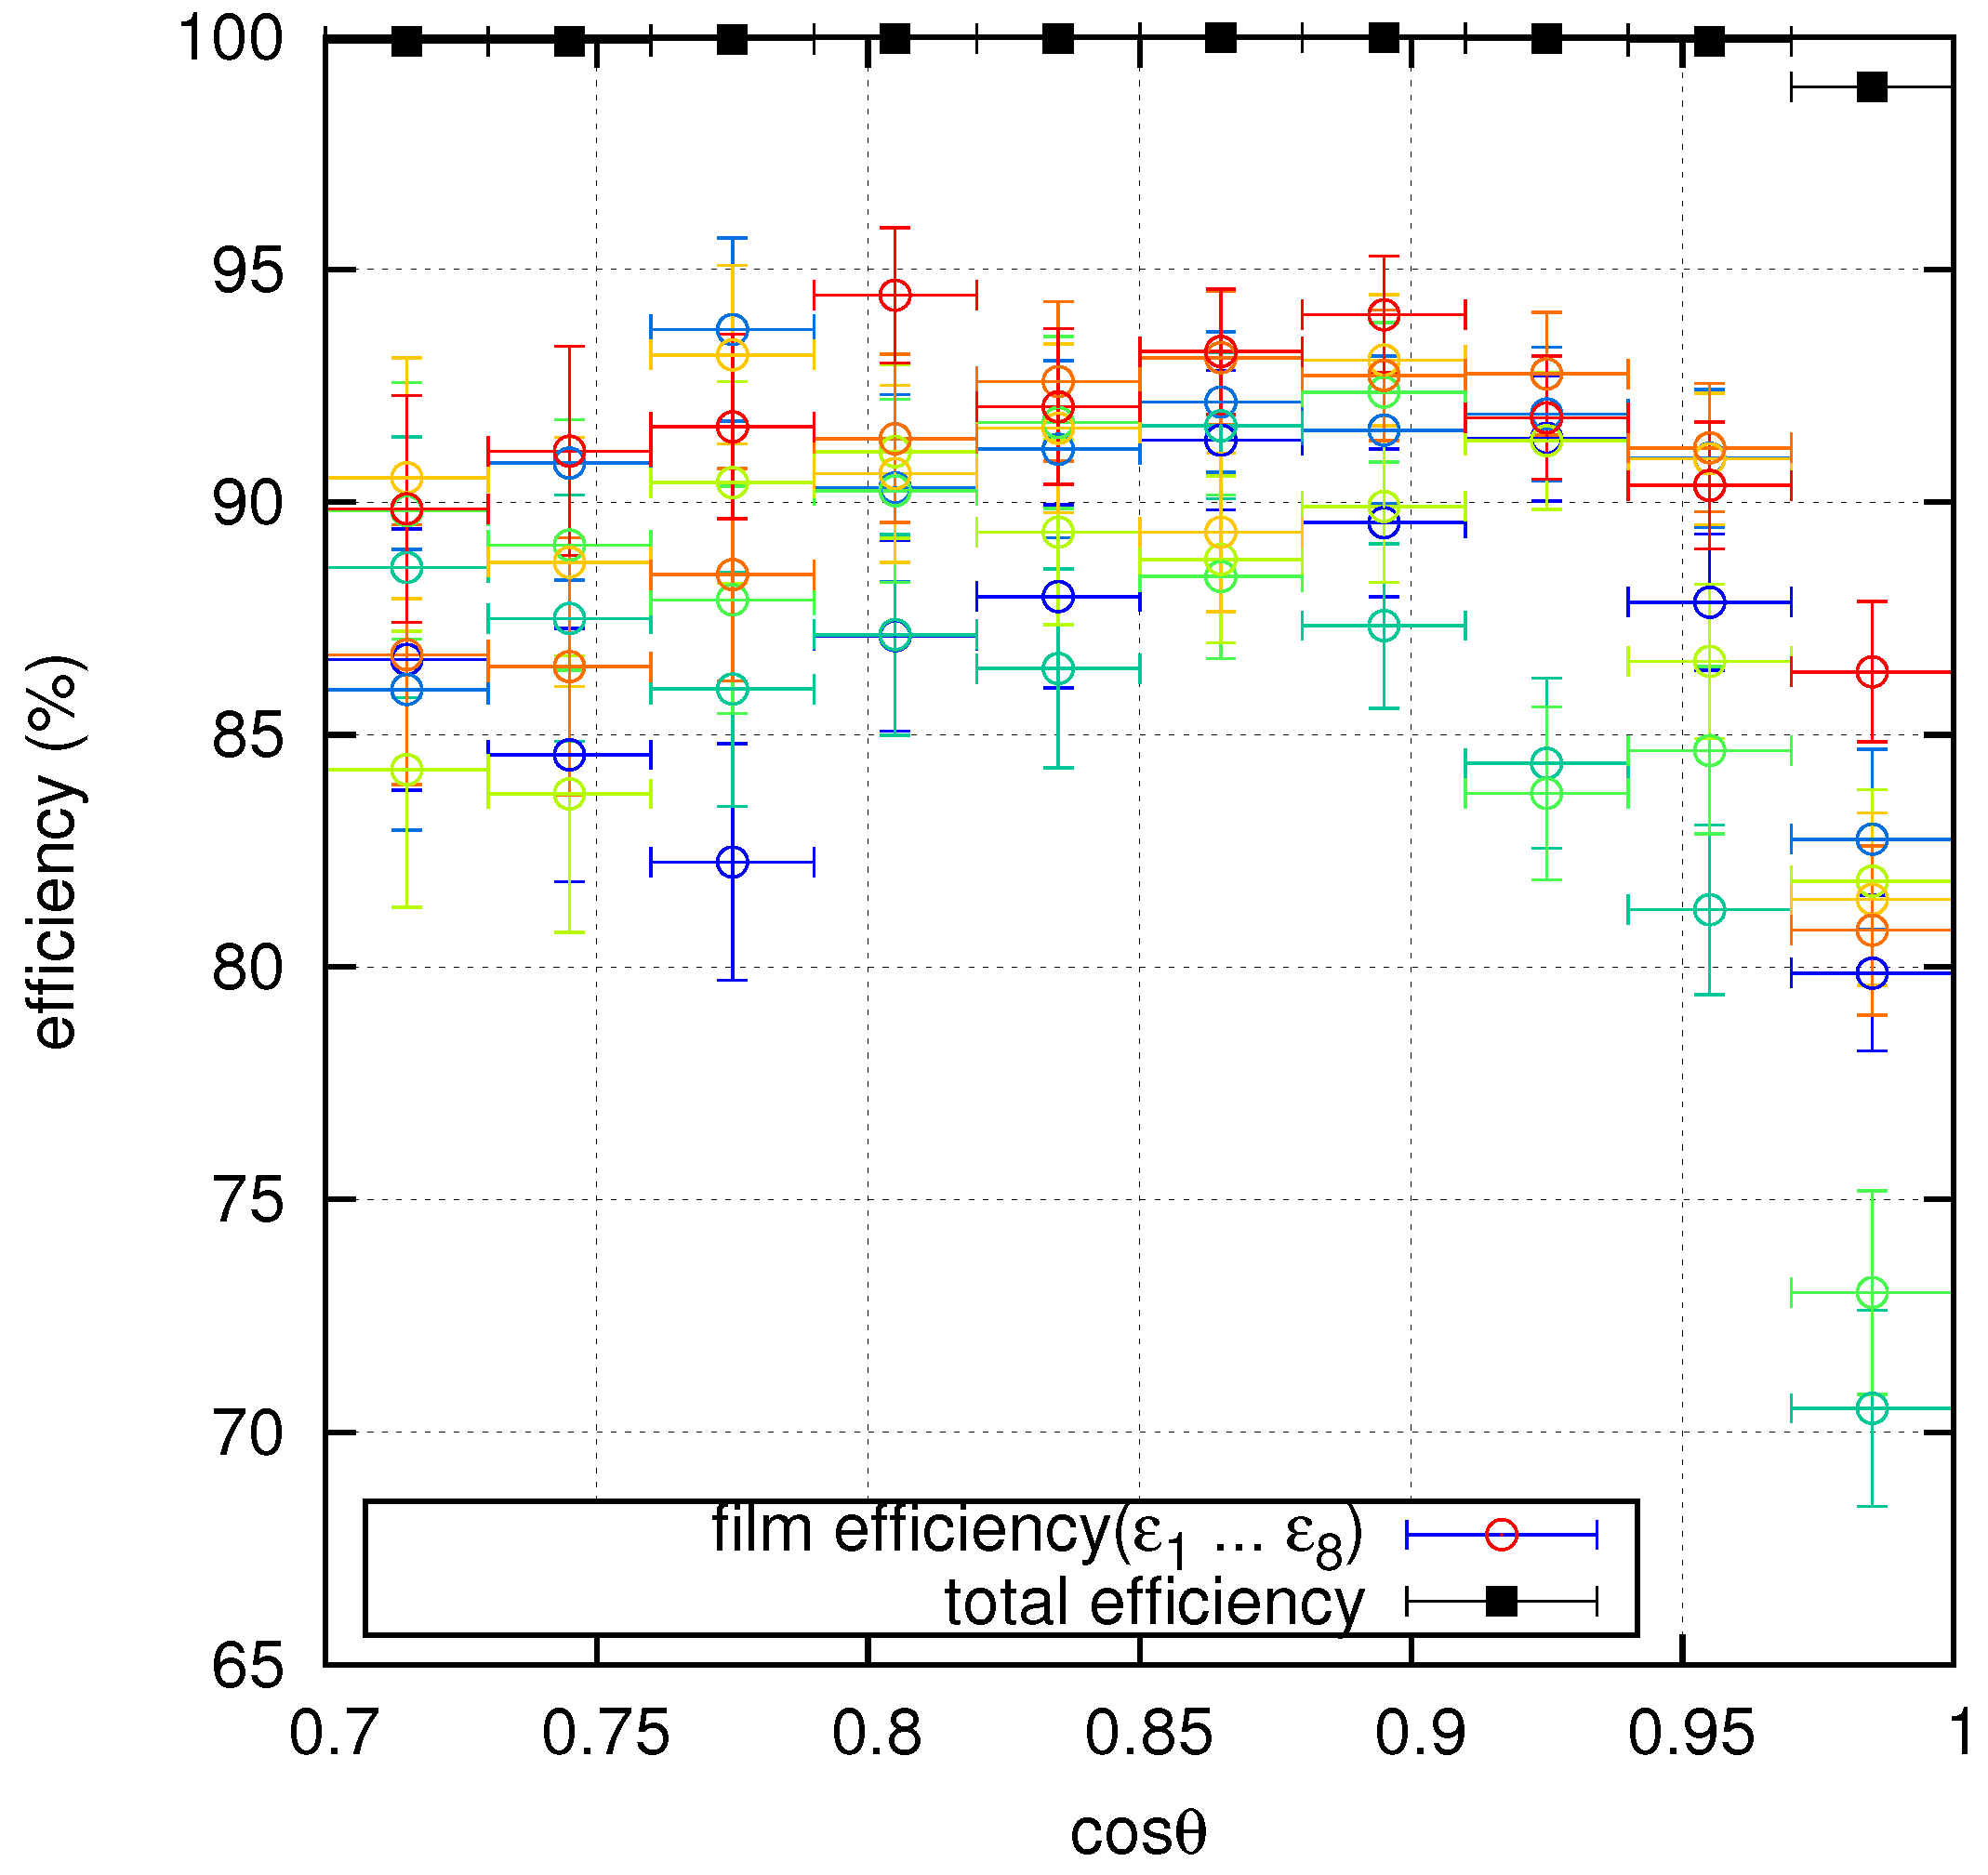
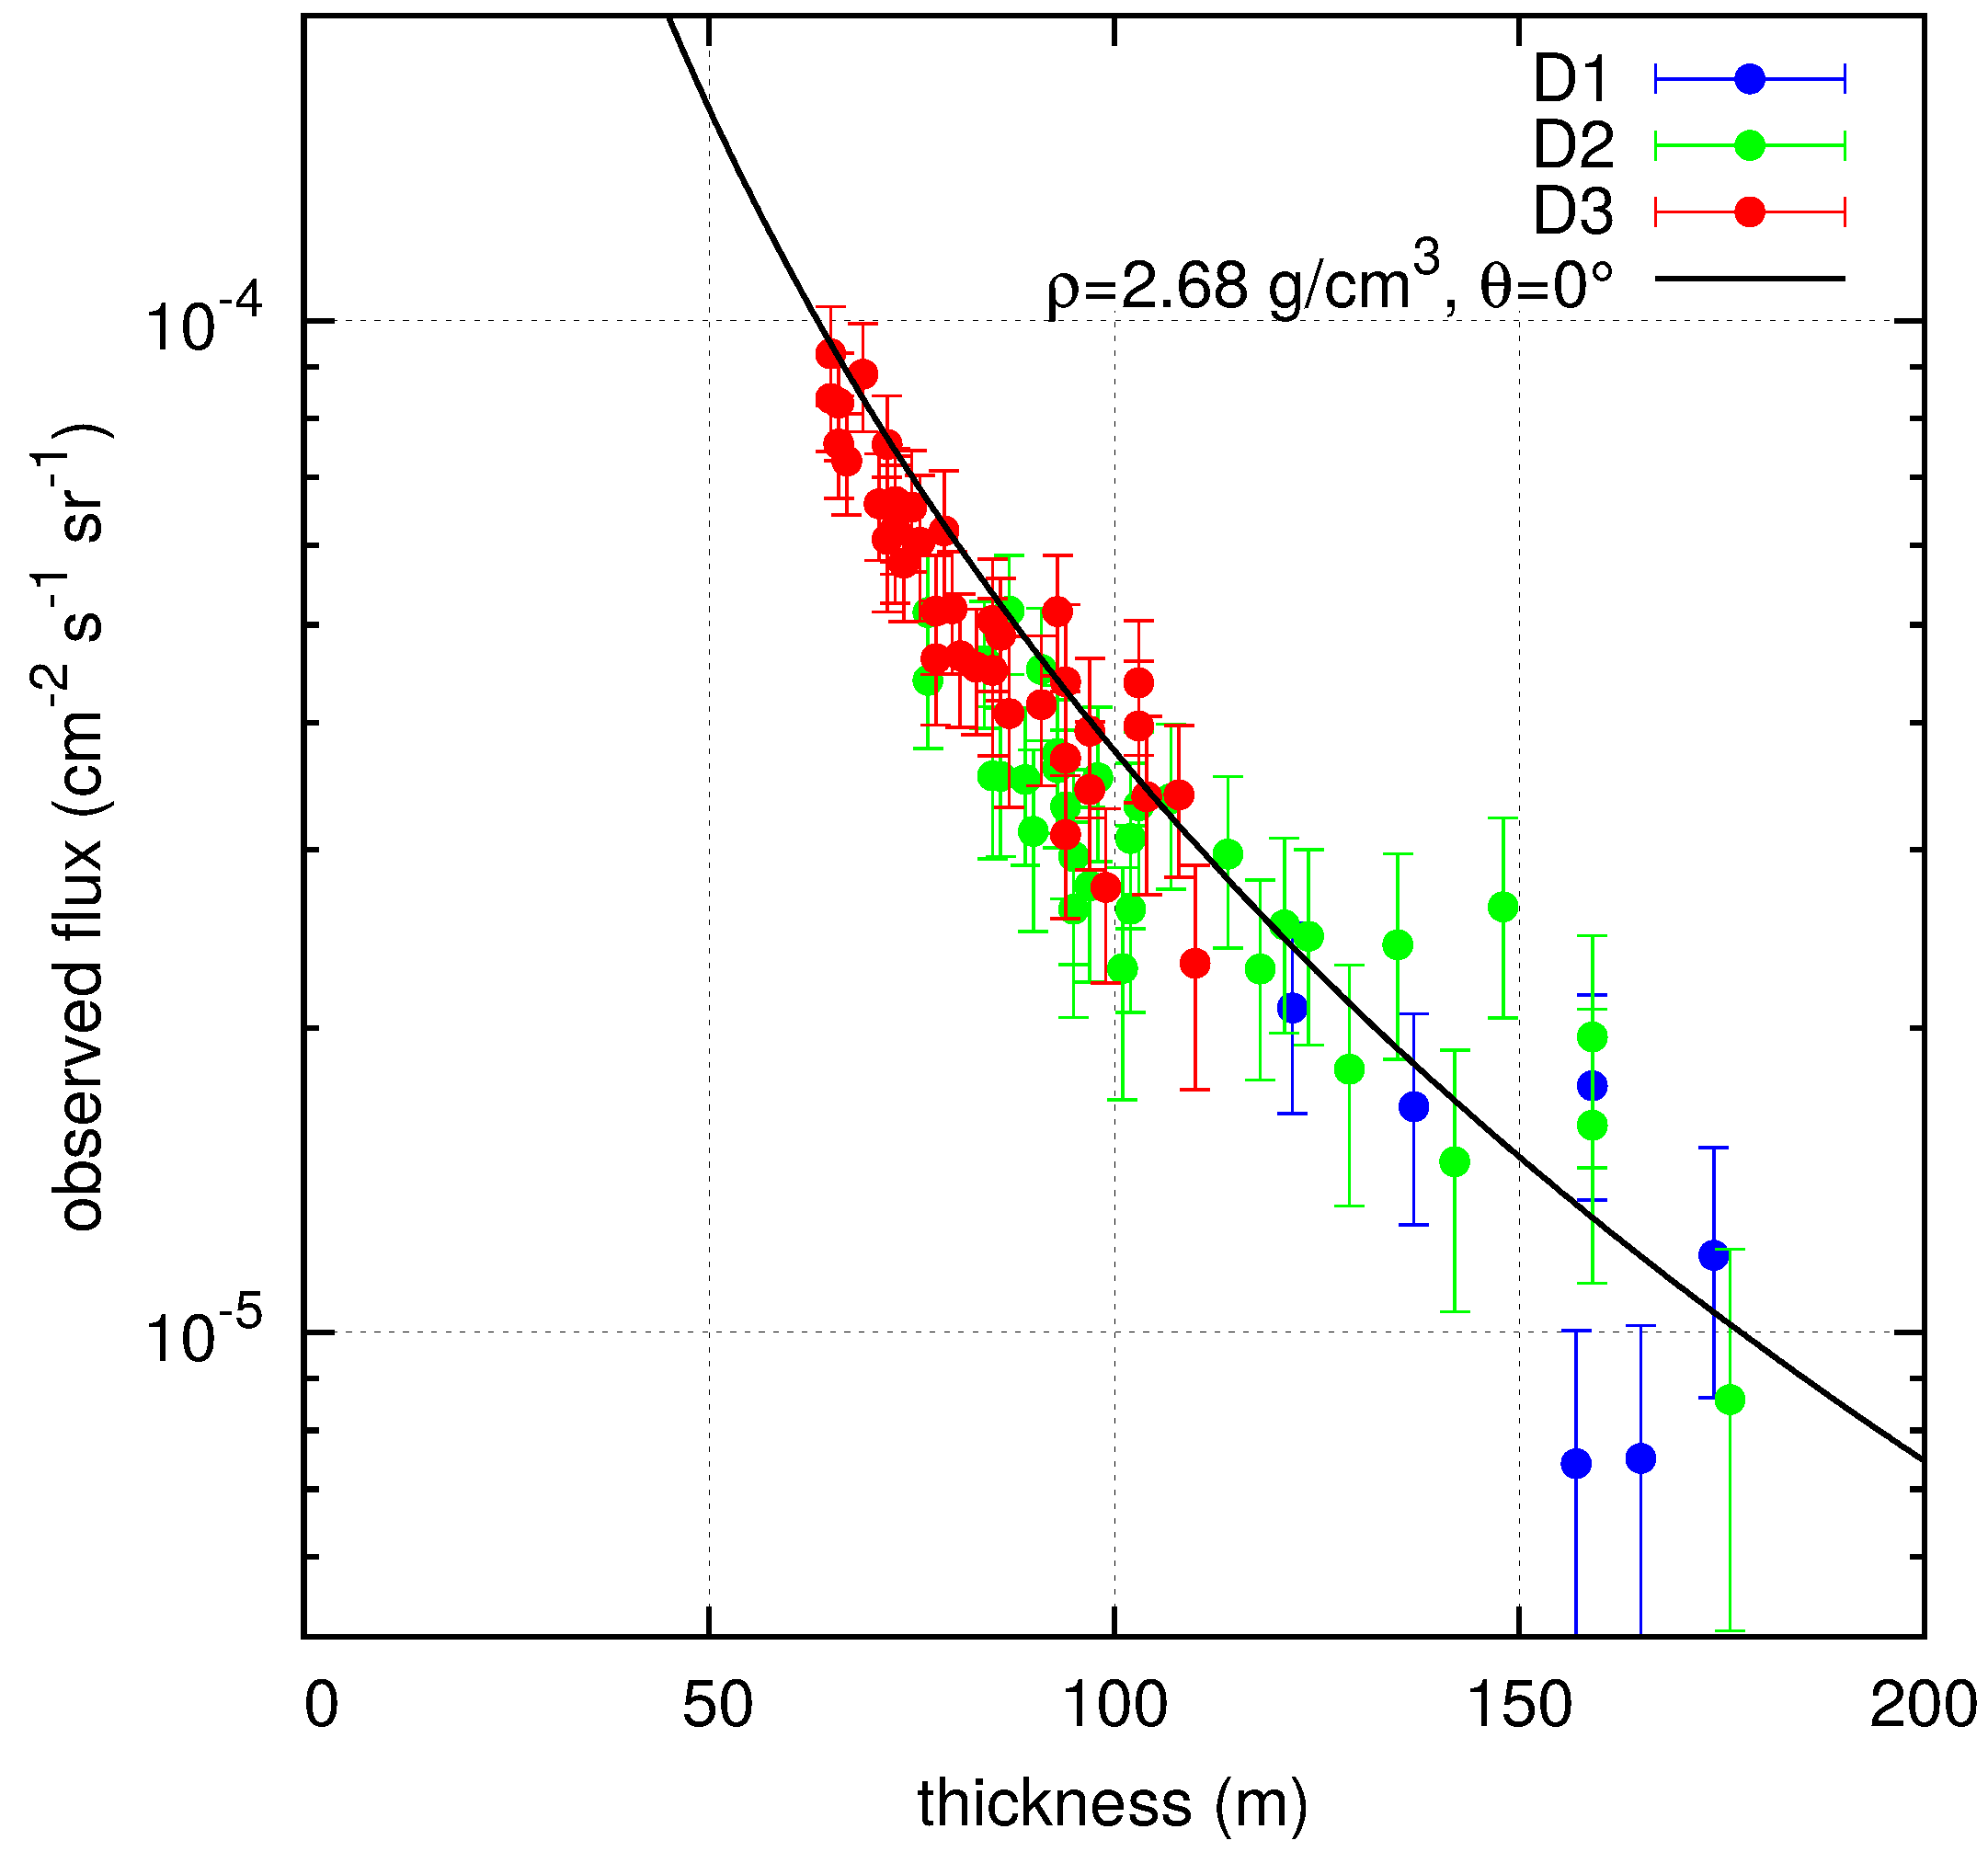
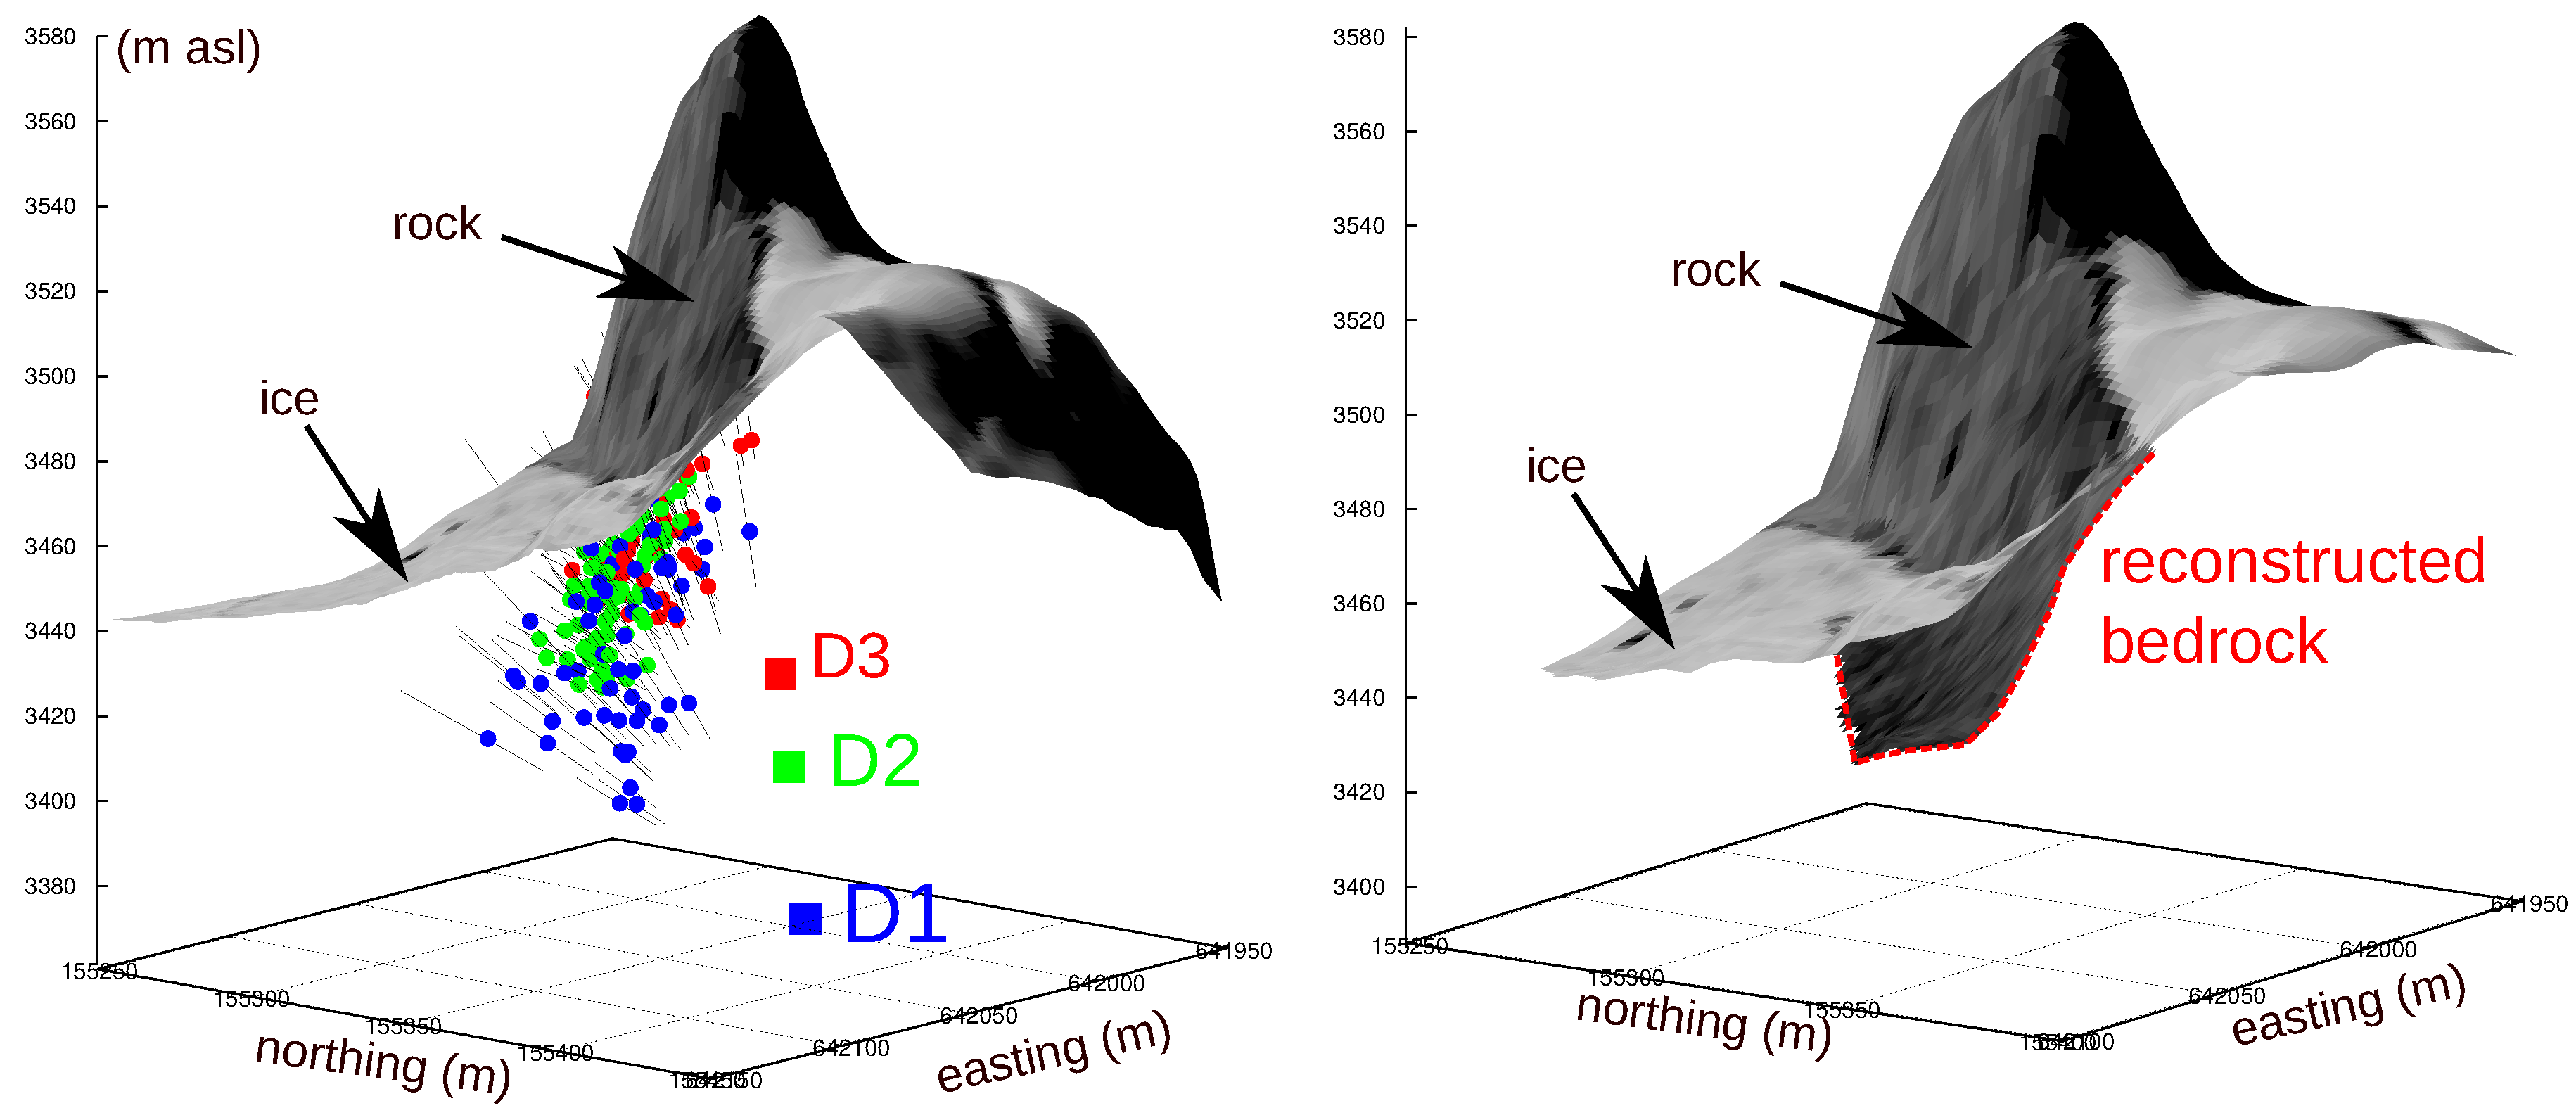
5. Results
6. Conclusions
Acknowledgments
Conflicts of Interest
References
- George, E.P. Cosmic Rays Measure Overburden of Tunnel. Commonw. Eng. 1955, 1955, 455–457. [Google Scholar]
- Alvarez, L.W.; Anderson, J.A.; El Bedwei, F.; Burkhard, J.; Fakhry, A.; Girgis, A.; Goneid, A.; Hassan, F.; Iverson, D.; Lynch, G.; et al. Search for Hidden Chambers in the Pyramids. Science 1970, 167, 832–839. [Google Scholar] [CrossRef] [PubMed]
- Tanaka, H.K.M.; Nakano, T.; Takahashi, S.; Yoshida, J.; Takeo, M.; Oikawa, J.; Ohminato, T.; Aokia, Y.; Koyama, E.; Tsuji, H.; et al. High resolution imaging in the inhomogeneous crust with cosmic-ray muon radiography: The density structure below the volcanic crater floor of Mt. Asama, Japan. Earth Planet. Sci. Lett. 2007, 263, 104–113. [Google Scholar] [CrossRef]
- Lesparre, N.; Gibert, D.; Marteau, J.; Komorowski, J.C.; Niccolin, F.; Coutant, O. Density muon radiography of La Soufrière of Guadeloupe volcano: Comparison with geological, electrical resistivity and gravity data. Geophys. J. Int. 2012, 190, 1008–1019. [Google Scholar] [CrossRef]
- Ambrosino, F.; Anastasio, A.; Bross, A.; Béné, S.; Boivin, P.; Bonechi, L.; Cârloganu, C.; Ciaranfi, R.; Cimmino, L.; Combaret, C.; et al. Joint measurement of the atmospheric muon flux through the Puy de Dôme volcano with plastic scintillators and Resistive Plate Chambers detectors. J. Geophys. Res. 2015, 120, 7290–7307. [Google Scholar] [CrossRef]
- Morishima, K.; Kuno, M.; Nishio, A.; Kitagawa, N.; Manabe, Y.; Moto, M.; Takasaki, F.; Fujii, H.; Satoh, K.; Kodama, H.; et al. Discovery of a big void in Khufu’s pyramid by observation of cosmic-ray muons. Nature 2017, 552, 386–390. [Google Scholar] [CrossRef] [PubMed]
- Nishiyama, R.; Ariga, A.; Ariga, T.; Käser, S.; Lechmann, A.; Mair, D.; Scampoli, P.; Vladymyrov, M.; Ereditato, A.; Schlunegger, F. First measurement of ice bedrock interface of alpine glacier by cosmic muon radiography (Aletsch glacier, Central Swiss Alps). Geophys. Res. Lett. 2017, 44, 6244–6251. [Google Scholar] [CrossRef]
- De Lellis, G.; Ereditato, A.; Niwa, K. Nuclear Emulsions. In Detectors for Particles and Radiation. Part 1: Principles and Methods; Fabjan, C.W., Schopper, H., Eds.; Springer: Berlin/Heidelberg, Germany, 2011; pp. 262–287. [Google Scholar]
- Ereditato, A. The Study of Neutrino Oscillations with Emulsion Detectors. Adv. High Energy Phys. 2013, 2013, 382172. [Google Scholar] [CrossRef]
- Nakamura, T.; Ariga, A.; Ban, T.; Fukuda, T.; Fukuda, T.; Fujioka, T.; Furukawa, T.; Hamada, K.; Hayashi, H.; Hiramatsu, S.; et al. The {OPERA} film: New nuclear emulsion for large-scale, high-precision experiments. Nucl. Instrum. Methods Phys. Res. Sect. A 2006, 556, 80–86. [Google Scholar] [CrossRef]
- Kreslo, I.; Cozzi, M.; Ereditato, A.; Hess, M.; Knuesel, J.; Laktineh, I.; Messina, M.; Moser, U.; Pistillo, C.; Pretzl, K. High-speed analysis of nuclear emulsion films with the use of dry objective lenses. JINST 2008, 3, P04006. [Google Scholar] [CrossRef]
- Ariga, A.; Ariga, T. Fast 4π track reconstruction in nuclear emulsion detectors based on GPU technology. JINST 2014, 9, P04002. [Google Scholar] [CrossRef]
- Nagamine, K.; Iwasakia, M.; Shimomura, K.; Ishida, K. Method of probing inner-structure of geophysical substance with the horizontal cosmic-ray muons and possible application to volcanic eruption prediction. Nucl. Instrum. Methods Phys. Res. Sect. A 1995, 356, 585–595. [Google Scholar] [CrossRef]
- Procureur, S. Muon imaging: Principles technologies and applications. Nucl. Instrum. Methods Phys. Res. Sect. A 2018, 872, 169–179. [Google Scholar] [CrossRef]
- Reyna, D. A Simple Parameterization of the Cosmic-Ray Muon Momentum Spectra at the Surface as a Function of Zenith Angle. arXiv, 2006; arXiv:hep-ph/0604145. [Google Scholar]
- Lesparre, N.; Gibert, D.; Marteau, J.; Déclais, Y.; Carbone, D.; Galichet, E. Geophysical muon imaging: Feasibility and limits. Geophys. J. Int. 2010, 183, 1348–1361. [Google Scholar] [CrossRef]
- Hebbeker, T.; Timmermans, C. A compilation of high energy atmospheric muon data at sea level. Astropart. Phys. 2002, 18, 107–127. [Google Scholar] [CrossRef]
- Nishiyama, R.; Taketa, A.; Miyamoto, S.; Kasahara, K. Monte Carlo simulation for background study of geophysical inspection with cosmic-ray muons. Geophys. J. Int. 2016, 206, 1039–1050. [Google Scholar] [CrossRef]
- Groom, D.E.; Mokhov, N.V.; Striganov, S.I. Muon Stopping Power and Range Tables 10 MeV–100 TeV. At. Data Nucl. Data Tables 2001, 78, 183–356. [Google Scholar] [CrossRef]
- Nishio, A.; Morishima, K.; Kuwabara, K.; Nakamura, M. Development of nuclear emulsion detector for muon radiography. Phys. Procedia 2015, 80, 74–77. [Google Scholar] [CrossRef]
- Aghion, S.; Ahlén, O.; Amsler, C.; Ariga, A.; Ariga, T.; Belov, A.S.; Bonomi, G.; Braünig, P.; Bremer, J.; Brusa, R.S.; et al. Prospects for measuring the gravitational free-fall of antihydrogen with emulsion detectors. JINST 2013, 8, P08013. [Google Scholar] [CrossRef]
- Huss, M. Density assumptions for converting geodetic glacier volume change to mass change. Cryosphere 2013, 7, 877–887. [Google Scholar] [CrossRef]
- Jourde, K.; Gibert, D.; Marteau, J.; De Bremond d’Ars, J.; Gardien, S.; Girerd, C.; Ianigro, J.-C.; Carbone, D. Experimental detection of upward going cosmic particles and consequences for correction of density radiography of volcanoes. Geophys. Res. Lett. 2013, 40, 6334–6339. [Google Scholar] [CrossRef] [Green Version]
- Tioukov, V.; Kreslo, I.; Petukhov, Y.; Sirri, G. The FEDRA—Framework for emulsion data reconstruction and analysis in the OPERA experiment. Nucl. Instrum. Methods Phys. Res. Sect. A 2006, 559, 103–105. [Google Scholar] [CrossRef]


© 2018 by the authors. Licensee MDPI, Basel, Switzerland. This article is an open access article distributed under the terms and conditions of the Creative Commons Attribution (CC BY) license (http://creativecommons.org/licenses/by/4.0/).
Share and Cite
Ariga, A.; Ariga, T.; Ereditato, A.; Käser, S.; Lechmann, A.; Mair, D.; Nishiyama, R.; Pistillo, C.; Scampoli, P.; Schlunegger, F.; et al. A Nuclear Emulsion Detector for the Muon Radiography of a Glacier Structure. Instruments 2018, 2, 7. https://doi.org/10.3390/instruments2020007
Ariga A, Ariga T, Ereditato A, Käser S, Lechmann A, Mair D, Nishiyama R, Pistillo C, Scampoli P, Schlunegger F, et al. A Nuclear Emulsion Detector for the Muon Radiography of a Glacier Structure. Instruments. 2018; 2(2):7. https://doi.org/10.3390/instruments2020007
Chicago/Turabian StyleAriga, Akitaka, Tomoko Ariga, Antonio Ereditato, Samuel Käser, Alessandro Lechmann, David Mair, Ryuichi Nishiyama, Ciro Pistillo, Paola Scampoli, Fritz Schlunegger, and et al. 2018. "A Nuclear Emulsion Detector for the Muon Radiography of a Glacier Structure" Instruments 2, no. 2: 7. https://doi.org/10.3390/instruments2020007