Next Article in Journal / Special Issue
Evidence for the Root-Uptake of Arsenite at Lateral Root Junctions and Root Apices in Rice (Oryza sativa L.)
Previous Article in Journal / Special Issue
Relevance of Reactive Fe:S Ratios for Sulfur Impacts on Arsenic Uptake by Rice
 
 
Please note that, as of 1 January 2018, Soils has been renamed to Soil Systems and is now published here.
Article

Legacy of Rice Roots as Encoded in Distinctive Microsites of Oxides, Silicates, and Organic Matter

by
Angelika Kölbl
1,*,
Steffen A. Schweizer
1,
Carsten W. Mueller
1,
Carmen Höschen
1,
Daniel Said-Pullicino
2,
Marco Romani
3,
Johann Lugmeier
1,
Steffen Schlüter
4 and
Ingrid Kögel-Knabner
1,5
1
Chair of Soil Science, Department of Ecology and Ecosystem Sciences, TUM School of Life Sciences Weihenstephan, Technical University of Munich, 85354 Freising, Germany
2
Department of Agricultural, Forest and Food Sciences, University of Torino, 10095 Grugliasco, Italy
3
Ente Nazionale Risi, Rice Research Centre, 27030 Castello d’Agogna, Pavia, Italy
4
Department Soil Physics, Helmholtz-Centre for Environmental Research—UFZ, 06120 Halle (Saale), Germany
5
Institute for Advanced Study, TU München, 85748 Garching, Germany
*
Author to whom correspondence should be addressed.
Submission received: 1 June 2017 / Revised: 2 August 2017 / Accepted: 3 August 2017 / Published: 9 August 2017
(This article belongs to the Special Issue Rhizosphere Processes)

Abstract

:
Rice (Oryza sativa) is usually grown under flooded conditions, leading to anoxic periods in the soil. Rice plants transport oxygen via aerenchyma from the atmosphere to the roots. Driven by O2 release into the rhizosphere, radial gradients of ferric Fe and co-precipitated organic substances are formed. Our study aimed at elucidating the composition and spatial extension of those gradients. Air-dried soil aggregates from a paddy field were embedded in epoxy resin, cut, and polished to produce cross sections. Reflected-light microscopy was used to identify root channels. With nano-scale secondary ion mass spectrometry (NanoSIMS), we investigated transects from root channels into the soil matrix and detected 12C, 16O, 12C14N, 28Si, 27Al16O, and 56Fe16O to distinguish between embedding resin, organic matter, oxides, and silicates. Image analyses reveal high occurrences of 56Fe16O within and in close proximity of oxide-encrusted root cells, followed by a thin layer with high occurrences of 27Al16O and 12C14N. In two of the three transects, 28Si only occurs at distances larger than approximately 10 µm from the root surface. Thus, we can distinguish distinct zones: the inner zone is composed of oxide encrusted root cells and their fragments. A thin intermediate zone may occur around some roots and comprises (hydr)oxides and organic matter. This can be distinguished from a silicate-dominated outer zone, which reflects the transition from the rhizosphere to the bulk soil.

Graphical Abstract

1. Introduction

Cultivated rice (Oryza sativa) is usually grown under flooded conditions in bunded fields (paddies). Because of continuous flooding, anoxic conditions accompanied by low redox potentials are characteristic of paddy soil ecosystems. Except for the soil surface layer, oxic conditions occur exclusively in the vicinity of active roots because rice plants supply the roots with oxygen by transporting it from the atmosphere to the roots through aerenchyma [1,2,3]. Oxygen diffusion from rice plant roots into the soil results in radial oxygen gradients with distance from the root surface [4]. Thus, rice roots are surrounded by an oxic zone, leading to the oxidation of reduced soil components within a few millimetres of the root surface of young roots [5]. The radius of the redox rhizosphere can vary between less than 1 mm in a strongly reduced soil up to 4 mm in a weakly reduced one, as reported by Flessa and Fischer [6]. In addition, it was found that the rice genotype is decisive for the rates of radial oxygen losses [7]. Kumazawa [5] showed that Fe(II) in soil pore water was oxidized and precipitated as reddish ferric oxides and hydroxides, forming concentric layers of several millimetres around the root surface as the root aged. Using a rhizotron experiment, Schmidt et al. [8] observed that some of the roots were surrounded by macroscopically visible reddish coloration after only 20 days from rice transplanting. During the following weeks, the number of these roots increased significantly. Thus, the distribution of iron-plaque is not uniform, as it does not coat all of the young roots or the younger portion of mature roots [9]. The aging of rice roots leads to reduced oxygen diffusion into the surrounding soil, presumably caused by the impregnation of the epidermis with iron oxides [10]. After drainage, the soil is still characterized by reddish coated roots [8]. The “oxidizing power” of rice roots protects the rice plants against phytotoxic concentrations of reduced substances like Fe2+ and H2S [3,6,11]. However, Hinsinger [12] reported that changes in the redox potential as induced by rice plant roots in the rhizosphere can be responsible for changes in pH. Root-induced oxidation of the rhizosphere contributed a significant or even major proportion of the rhizosphere acidification. In addition, roots and rhizosphere microorganisms relying on root exudates respire and thereby produce CO2 and hence carbonic acid in the rhizosphere [12]. The root-induced acidification of the rhizosphere can be responsible for an accelerated degradation and microstructural changes of minerals due to hydrolysis [13].
To summarize, several studies have already investigated the development of oxide coatings along rice roots on a mm scale and discussed possible microstructural changes of minerals in the rhizosphere. Detailed investigations of element gradients and their quantification on a submicron scale within the oxide coatings are still rare and exclusively focus on inorganic contaminants like As. For example, Frommer et al. [14] investigated Fe, Mn, and As around rice roots with synchrotron micro-X-ray fluorescence spectrometry. The authors showed that element-distribution patterns have a pronounced spatial variability and differ in the dependence of the root diameter. Yamaguchi et al. [15] also investigated As in the rice rhizosphere and showed that microscale changes of As speciation and Fe plaque deposition are related to spatial and temporal redox variations in the soil matrix. However, the microscale spatial distribution of organic materials (e.g., root exudates) and its influence on metal distributions (e.g., Al, Fe) in the root rhizosphere and its legacy beyond the root death have not yet been investigated.
Secondary ion mass spectrometry at the nanoscale (NanoSIMS) allows an exploration of the elemental and isotopic composition of a solid sample with high sensitivity and spatial resolution. It enables the investigation of intact soil structures and can unravel the interplay of the various soil compounds at a submicron scale like the attachment of organic material to minerals or the architecture of microstructures [16,17]. NanoSIMS analyses have already been successfully applied to investigate the fate of stable isotope 15N in the rhizosphere and its distribution between plant cells, microorganisms, and the adjacent soil matrix [18].
The aim of the present study was to provide a micro-scale spatial distribution of organic carbon, Fe, Al, and Si at the interface between rice roots and the soil matrix in order to unravel the iron plaque composition on a submicron level. We have combined NanoSIMS with reflected light microscopic analyses and developed an image analysis workflow for the quantification of spatial relationships. This approach could enable us to distinguish distinct zones around rice roots, characterized by specific enrichments of oxides, organic matter, and silicates, and thus help us to understand and evaluate the spatial extension of small-scale processes in the rice rhizosphere.

2. Materials and Methods

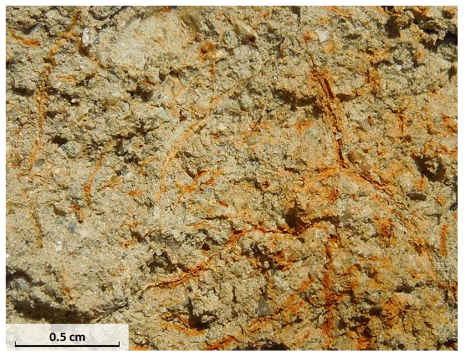
2.1. Sampling Site and Soil Material

Soil material was taken from the plough pan of a paddy field towards the end of October 2013, approximately four weeks after the rice harvest. The study site is situated on alluvial sediments on a floodplain by the river Po, in the vicinity of the National Rice Research Centre, Mortara in Pavia, Italy (N 45°11.536′; E 8°40.078′, elevation: approx. 80 m asl). Rice (Oryza sativa) is cultivated for at least 30 years in monocultural farming between April and September; the sites are kept fallow during winter. The topsoil is ploughed (not puddled) in spring, followed by dry seeding of the rice and field flooding about one month after seeding. The soil was classified according to IUSS Working Group WRB [19] as Haplic Gleysol. Soil texture was classified as sandy loam (59% sand; 30% silt; 11% clay). The volumetric water content during sampling was 30%. Some basic soil properties are given in Table 1.
Intact soil clods of the dense, less-rooted plough pan (Ardp horizon, 25–34 cm) were collected and broken up, allowing us to separate single, oxidised root channels within a highly reduced soil matrix (Figure 1). The key advantage of using the plough pan is the possibility to identify and select separate, discrete roots without any overlapping of the root-affected soil matrix. In densely rooted plough layers, the overlapping root-affected soil matrix and co-occurrences of young and dead roots hardly allow for the analyses and interpretation of the effect of single roots. The plough pan is not affected by annual ploughing and mixing of the soil material and, thus, enables us to investigate persistent soil structures and the long-term legacy of roots.

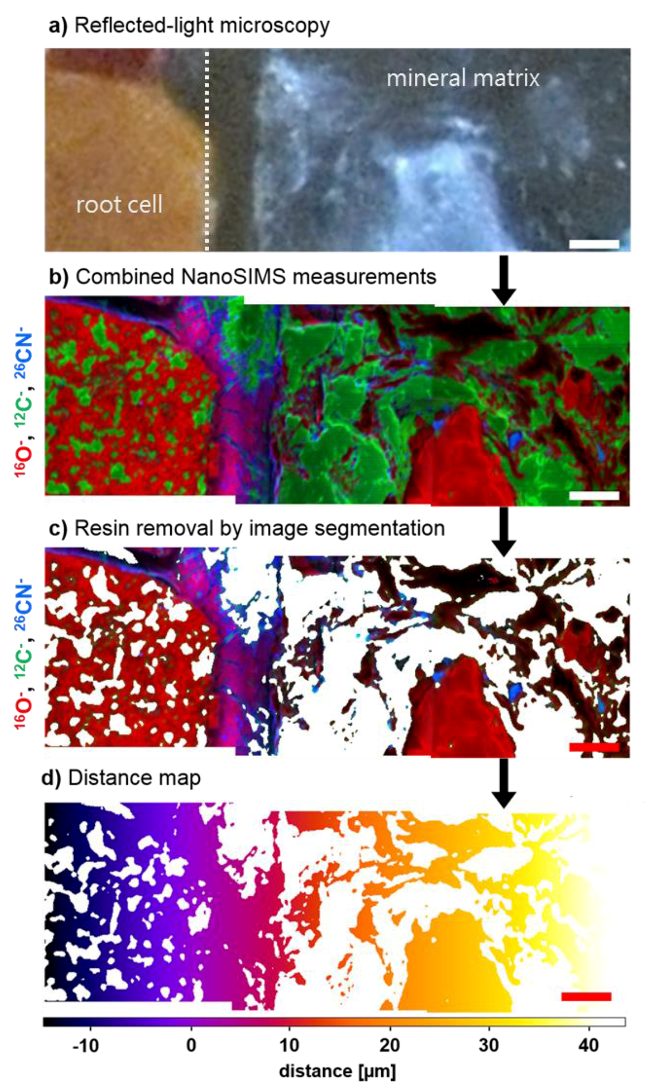
2.2. Sample Preparation, Microscopy, and NanoSIMS Analysis

Intact soil aggregates with an average diameter of 2–3 cm (containing oxidized root channels within a highly reduced soil matrix; Figure 1) were air-dried, embedded in epoxy resin (Araldite 502), and then cut and polished to obtain a surface with low topography [22]. The use of an embedding resin is an inevitable prerequisite to sustain the natural soil structures in the large quartz-rich soil aggregates and to produce mechanically stable cross sections with low topography. To obtain an optimized bonding of the large soil specimens, all soil pores need to be filled up with the resin, resulting in homogeneous polished cross sections. Considering that approximately 33% of the soil volume in the plough pan was pore space, relatively large proportions of the cross sections were filled up with resin. The resin that was used in our approach (Araldite 502) was shown to be the most suitable resin in terms of sample preparation for high vacuum conditions during NanoSIMS analyses [23]. In addition, as it shows distinctively different 12C and 12C14N secondary ion counts in relation to both plant and microbial derived OC, it can easily be distinguished from natural organic matter and be excluded from further evaluations (summarized in Mueller et al. [17,22]). Araldite 502 is widely used for NanoSIMS analyses and has been successfully applied to study interfaces between mineral and organic materials [22,23,24]. There were no indications in any of the studies for the preferred association of araldite with specific materials, structural changes, or the mobilization of elements at the microscale.
Reflected-light microscopy (Zeiss Axio Imager Z2m microscope (Zeiss, Göttingen, Germany)) was used to visualize the aggregate architecture and to identify root channels in the embedded aggregate on a mm to μm scale. Based on reflected light microscope images of the cross sections, we identified separate roots without any overlaps and focused on entire, clearly visible iron-coated root sections, showing former root cells and the surrounding soil matrix. We have selected rather intact root sections randomly and defined positions for measuring transects using the following criteria: (a) low proportions of large quartz grains, as they provide no useful information on a <20 µm scale; (b) an identifiable root cell as the starting point to be able to define the boundary line between the plant root and soil matrix.
Prior to NanoSIMS analyses, the samples were coated with Au/Pd under an Ar atmosphere (Emitech Sputtercoater SC7620, Gala Instrumente, Bad Schwalbach, Germany). Gold/Palladium coatings of ≈ 30 nm were used to avoid charging effects caused by the ion beam.
The NanoSIMS analyses were performed with a NanoSIMS 50 L (Cameca, Gennevilliers, France). A Cs+ primary ion beam with a 16 keV primary ion impact energy was used, and the dwell time was set to 30 ms/pixel. With this facility, up to seven secondary ion species can be simultaneously detected. The spatial distribution of organic material was measured as the molecular secondary ion 12C14N [22]. Iron and Al were measured as negatively charged molecular secondary ions 56Fe16O and 27Al16O, representing the distribution of Fe and Al oxides. Phyllosilicates can be recognized by their high signals in 28Si and 27Al16O [16], whereas almost pure 28Si signals at distinct areas are indicative for quartz. Thus, to distinguish between organic material and different mineral particles (oxides, phyllosilicates, and quartz), we simultaneously detected 12C14N, 28Si, 27Al16O, and 56Fe16O within selected, representative cross sections of two root channels. 12C and 16O were measured as indicators for resin and mineral phase, respectively. At three different positions representing three different transects, mosaics of three 20 × 20 µm images were combined to investigate possible gradients of oxides, silicates, and organic matter from the surface of the root channels into the soil matrix.

2.3. Image and Statistical Analyses

Before image analysis, we corrected the NanoSIMS images for the detector dead time (44 ns, OpenMIMS plugin (https://nano.bwh.harvard.edu/)). To further explore the spatial distribution of soil organic matter and mineral soil constituents based on the NanoSIMS measurements, we treated the SIMS measurements as image data. The contrast was enhanced by setting the darkest and brightest 0.5% of pixels to the minimum and maximum grey value with linear stretching in between using the Enhance Contrast tool in ImageJ (ImageJ 1.44, Wayne Rasband, National Institutes of Health, Bethesda, MD, USA). The transect mosaics were combined simultaneously for all elements using the MosaicJ plugin [25]. With the MosaicJ plugin, the NanoSIMS measurements were aligned according to the 16O ion distributions; the alignment was then transferred to all other secondary ion distributions. In addition, the plugin provided a smooth transition between the images by a blending algorithm [25]. To separate the epoxy resin matrix from the actual sample material, we employed a supervised pixel classification based on 12C (indicative for resin) as well as 16O and 12C14N (indicative for mineral and organic surfaces) secondary ion distributions. The images were segmented using a machine-learning algorithm implemented in Ilastik 1.2 [26]. The resulting segment masks were used to exclude the resin areas from further evaluations (see the scheme of image analysis, Figure 2). To identify and compare different soil zones from several successive measurements, we computed the following isotopic ratios: 12C14N/12C (excluding outliers > 50), 28Si/16O, 27Al16O/16O, and 56Fe16O/16O (excluding outliers > 10 in all previous ratios).
The distance map shows the horizontal distance of each pixel to the root zone boundary and was used to evaluate distance-dependent relationships. Considering that the root diameter (and with this the oxygen source in the rhizosphere) was much larger than the field of view of a NanoSIMS image (200 µm vs. 20 µm, respectively), we assumed a vertical line as an adequate approximation of the interface between the root channel and adjacent soil matrix. In all three transects, the interface between the single root cells and the soil matrix was mostly vertical. Thus, we have set the zero-line in all transects as a vertical line directly at the border between the root cell and soil matrix.
Combining the secondary ion distributions with the distance maps, we computed the moving medians with a horizontal window size of ten pixels. The embedding resin filled up all soil pore spaces, which were 33% of the total soil volume in the plough pan. By excluding the resin-filled sections, we clearly focused our image analyses on the pure soil matrix. The exclusion of the pore spaces left up to 2000 pixels at each distance available for quantification. This high number of pixels at each distance allowed for a proper calculation and, thus, a reliable data interpretation. To avoid data points with a low number of pixels, we excluded all those with < 200 pixels (around 3% of the data points). Standard deviations have been included as a measure of the variation of pixel values for each distance.

3. Results

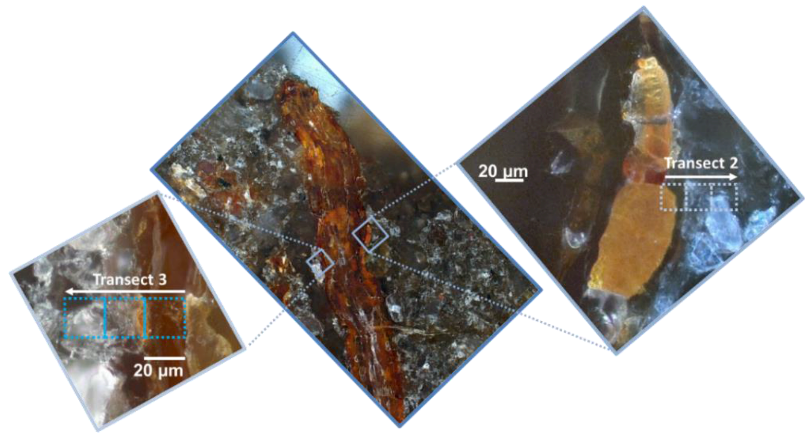
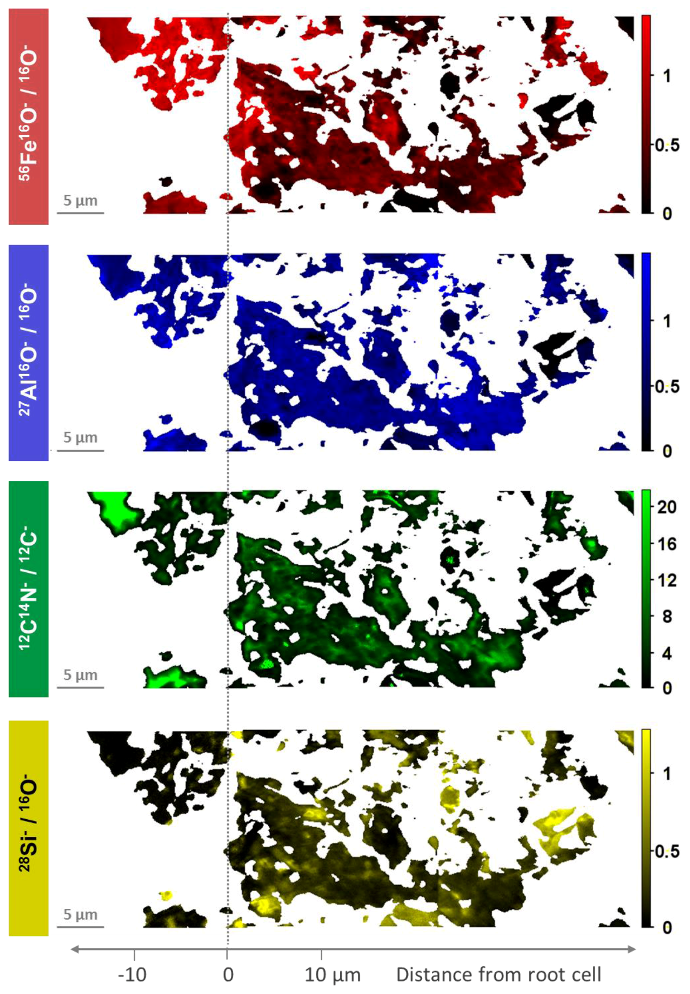
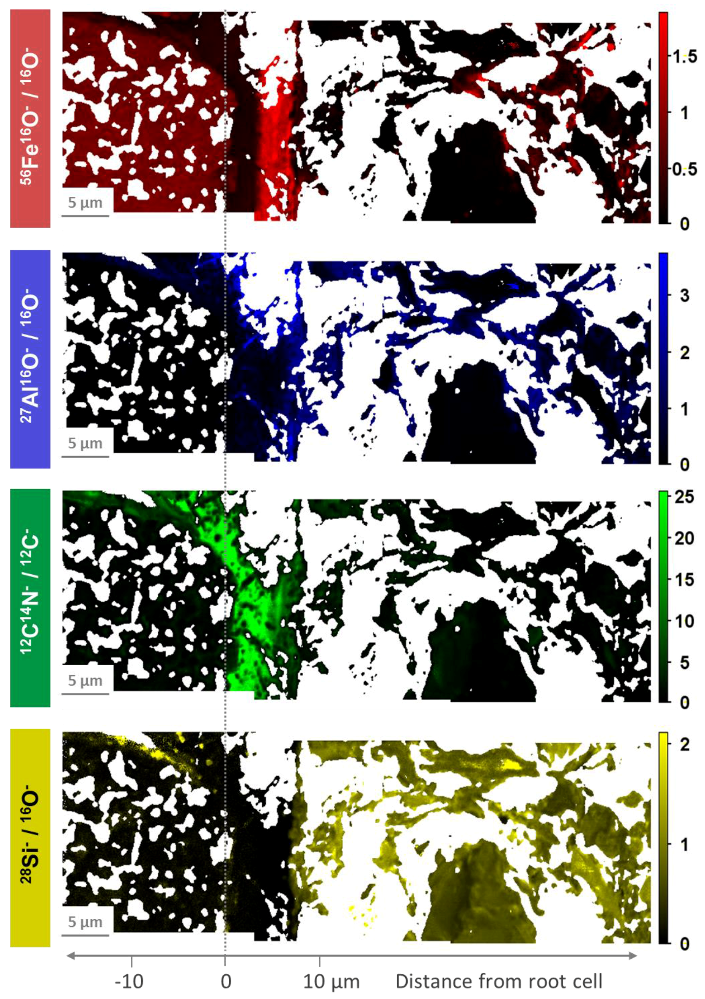
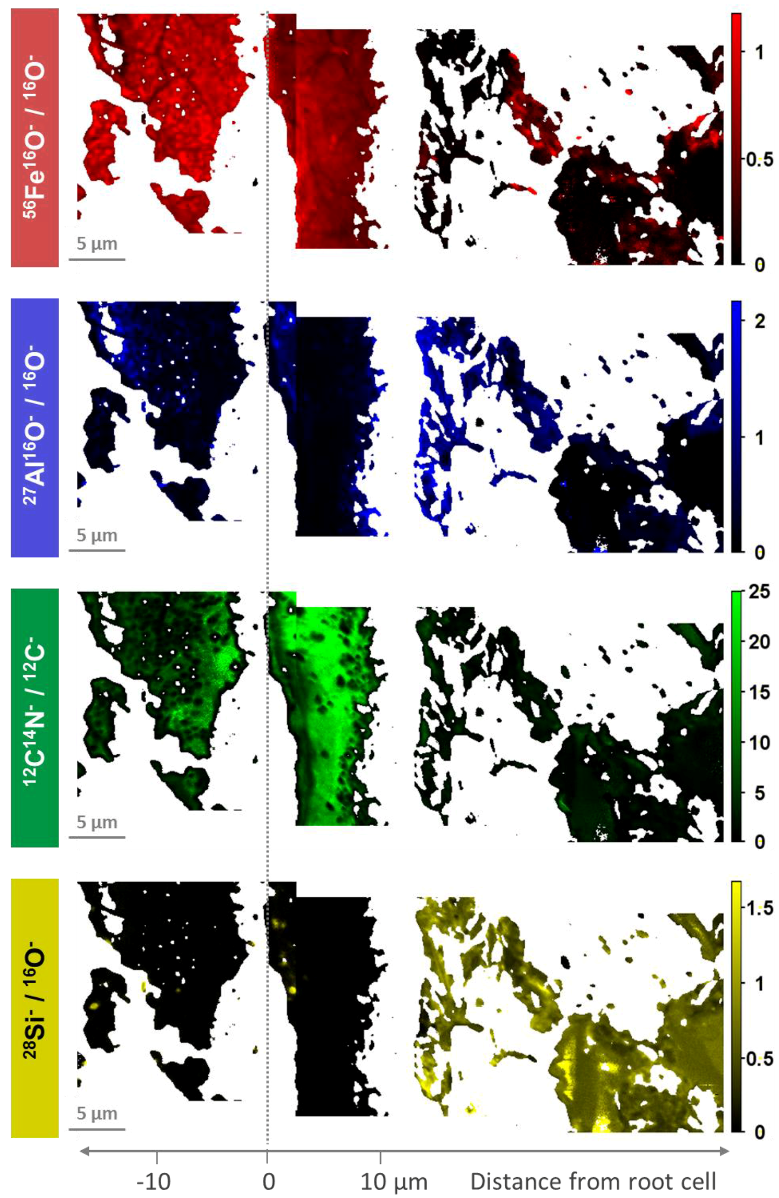
3.1. Distribution of Fe, Al, Si, and Organic C in Transects from Root Channels into the Soil Matrix

Images obtained by reflected-light microscopy visualized aggregate architecture and allowed us to identify the cross sections of single, oxidized root channels within the highly reduced, grey soil matrix (Figure 3 and Figure 4). Some oxide-encrusted root cells have been identified at the periphery of the root channel. Root cells were identified with reflected-light microscope images by their shape, their physiological features, and their reoccurring location around the root channels (see microscope images of rice root cross sections in Khan et al. [27]). The positions of the three consecutive NanoSIMS measurements were highlighted by three dotted rectangles in Figure 3 and Figure 4, representing transect 1, 2, and 3. The reddish colour that dominated the root cells and their immediate proximity confirmed oxic areas around the roots.
Figure 5 shows original NanoSIMS images, exemplified by transect 1. Original NanoSIMS images of transects 2 and 3 are shown in the supplementary material (Figures S1 and S2). Three NanoSIMS measurements (each 20 × 20 µm) were combined to investigate the gradient from the surface of the root channel into the soil matrix. The 16O image reflects the distribution of mineral-derived secondary ions (28Si, 27Al16O, 56Fe16O), whereas the 12C image is indicative of the embedding resin. The 12C14N image displays the distribution of organic matter.
Figure 6 shows the combined images of transect 1, with the resin signals removed to focus on the distribution of minerals and soil organic matter. The left part of the transect (approx. −15–0 µm), representing in the upper part a fragment of a dead root cell and the adjacent soil matrix, showed a clear dominance of 56Fe16O/16Oand 27Al16O/16O, as well as some 12C14N/12C enriched spots. Nearly no 28Si/16O has been detected within the root cell; it appears only in small spots. Considerable occurrences of 28Si/16O were detected in the middle and right part of the image, representing distances of 0–40 µm from the edge of the root channel. In this section, the occurrence of 56Fe16O/16O was slightly reduced, whereas the occurrence of 27Al16O/16O was relatively constant compared to the −15–0 µm zone. Thus, the −15–0 µm zone can be considered as a 56Fe16O/16O (= oxide)—dominated zone, which can be clearly distinguished from the adjoining silicate-dominated zone composed of 27Al16O/16O + 28Si/16O (= phyllosilicates) and 28Si/16O (= quartz). 12C14N/12C occurred in all zones. In the left zone, 27Al16O/16O and 56Fe16O/16O confirmed the entire encrustation of the root cell with Fe and Al oxides and hydroxides. The total image revealed either Fe or Al dominated areas, but also areas with similar 27Al16O/16O and 56Fe16O/16O occurrences. 12C14N/12C mainly occurred in distinct spots, which were often, but not always, associated with high occurrences of 27Al16O/16O and 56Fe16O/16O.
Transects 2 and 3 (Figure 7 and Figure 8) showed sequences of ion distribution which were not completely similar to transect 1 (Figure 6). This could be due to small-scale differences in the matrix composition, e.g., the mineral assemblage, root age, or solution chemistry. As for transect 1, the left image of both transects showed a fragment of an oxide encrusted root cell, with high occurrences of 56Fe16O/16O, but low occurrences of 27Al16O/16O. In contrast to transect 1, transects 2 and 3 revealed an approximately 0–5 µm sub-zone directly adjacent to the encrusted root cell with high occurrences of 12C14N/12C and 56Fe16O/16O, low occurrences of 27Al16O/16O, and without 28Si/16O. This sub-zone transitioned into a thin 27Al16O/16O enriched sub-zone that was depleted in 56Fe16O/16O and 12C14N/12C, and still free of 28Si/16O. 28Si/16O indicating quartz and 27Al16O/16O + 28Si/16O indicating phyllosilicates occurred at distances of approximately 10 µm from the edge of the outermost root cell.

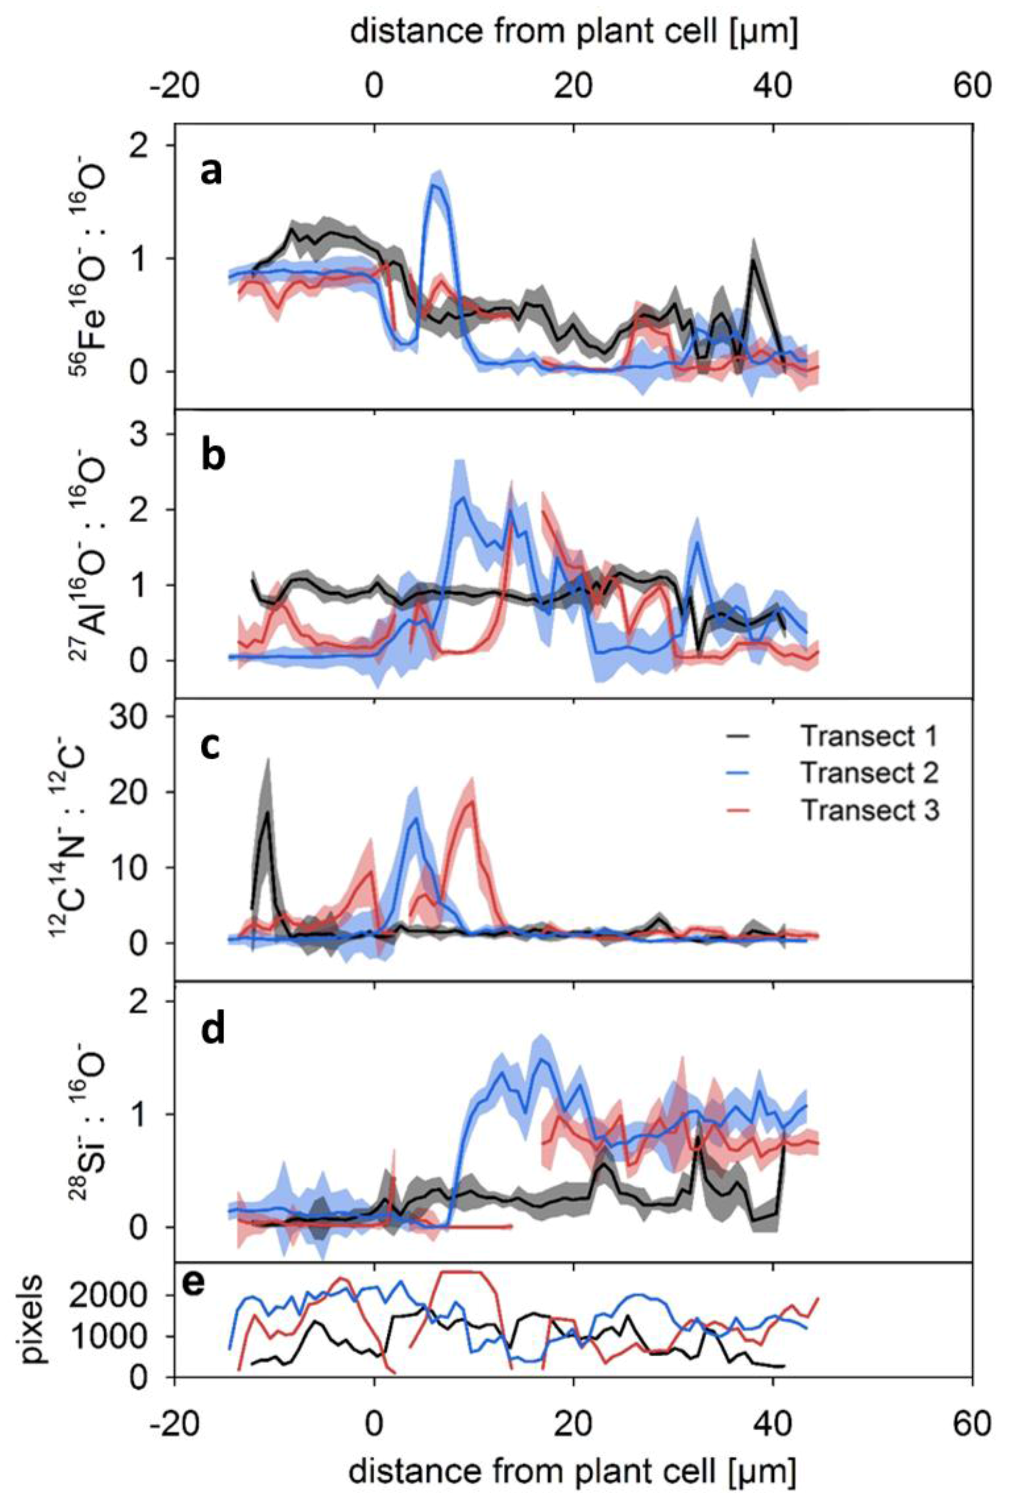
3.2. Average Element Occurrences with Distance from Root Channels

Median values and standard deviations of all element ratios were calculated for each distance from the periphery of the root channel (Figure 9). High ratios of 56Fe16O/16O of approximately 1.0 at −15–0 µm distances confirmed that the outermost root cells of all three transects are encrusted with Fe oxides. From 0–10 µm, the 56Fe16O/16O ratios showed a high variability between 0.5 and 2.0, whereas at larger distances from the root cell the ratios were much lower (0–0.4). At approximately +5 µm, transects 2 and 3 showed a distinct peak of 56Fe16O/16O ratios. The ratios of 27Al16O/16O revealed a different spatial pattern of transect 1 compared to transects 2 and 3. While transect 1 showed rather constant ratios of approximately 1.0 throughout the transect, transects 2 and 3 showed low ratios of 0–0.5 within the root cell (−15–0 µm), high ratios up to 2.0 at 0–20 µm, and decreasing ratios between 20 and 40 µm. 28Si/16O ratios showed a sharp increase at approximately 10 µm. 12C14N/12C ratios showed high values up to 20 and a high variability at distances between −10 and +10 µm.

4. Discussion

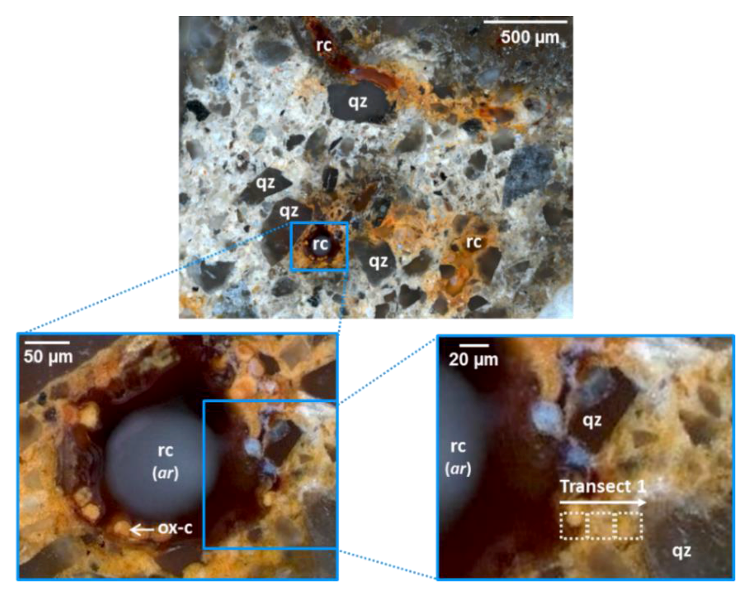
4.1. Oxide-Encrusted Root Cells

The periphery of the root channel showed some single, oxide-encrusted root cells (Figure 3 and Figure 4). These are most likely residues of former rhizodermis cells (see microscope images of rice root cross sections in Khan et al. [27]). On the left side of the transects (Figure 6, Figure 7 and Figure 8), there were high yields of 56Fe16O/16O and a lack of 28Si/16O within the root cells. All of these root cells seem to be entirely encrusted with Fe (hydr)oxides that precipitated in these cells. Our observation refers to dead rice roots after harvest and is in contrast to studies focusing on Fe plaque formation along a root system of young rice plants. For example, Green and Etherington [28] found Fe oxides only adhering to the surface of the root and the root hairs. The authors found that deposits of Fe oxides extended inwards from the root surface and were present throughout the outer cortex in cell walls and intercellular spaces. The authors showed that all cells of the outer cortical parenchyma were dead; however, they found no indications of Fe oxides inside the cells. Thus, we assume that the impregnation of entire root cells as observed in our study occurs at a later stage. It is highly probable that the root cells have been incrusted with oxides after drainage and harvest, as the root channels would have provided aeration paths following root decay.
The image of the root cell in Figure 6 and Figure 8 revealed either Fe or Al dominated areas, but also areas with similar 27Al16O/16O and 56Fe16O/16O yields. In addition, the scatter plot of both secondary ions (Figure S3c) indicated no or even negative relationships between 27Al16O/16O and 56Fe16O/16O occurrences within encrusted root cells, leading to the suggestion that Fe and Al (hydr)oxides form spatially independent during encrustation of the root cells. However, the scatter plots reveal positive trends between 27Al16O/16O and 12C14N/12C (Figure S3b). Concerning the Al compounds, April and Keller [29] found that chemical interactions between roots and rhizosphere minerals included the precipitation of amorphous Al oxides and hydroxides within the cells of mature roots. Cloutier-Hurteau et al. [30] revealed that Al-organic complexes were generally the dominant species in the rhizosphere of forest soils. By analyzing the spatial distribution of these elements at the microscale, we are now able to confirm the occurrence of Al-organic complexes in the rhizosphere of a paddy soil.

4.2. Element Distribution from the Periphery of the Root into the Soil Matrix

In the investigated plough pan, we identified two distinctive zones in the mineral phase around the root channel (approx. 0–10 µm and 10–40 µm), which are characterised by significantly different element compositions (Figure 6, Figure 7 and Figure 8). These zones are clearly visible in transects 2 and 3, but less pronounced in transect 1. Within 0–10 µm from the outer root cells, only 56Fe16O/16O and 27Al16O/16O occurred, without any 28Si/16O. The 0–5 µm sub-zone directly adjacent to the encrusted root cell was particularly enriched in 56Fe16O/16O and 12C14N/12C, but with no clear (positive) relations between them (Figure S3d). Obviously, Fe(II) in the soil pore water was directly oxidised and hydrolysed to ferric (hydr)oxide at rice root surfaces [5,10] with some discontinuous organic matter retention through co-precipitation. Between 5–10 µm from the root cell, 27Al16O/16O enrichments were found at the interface to the silicate-containing zone (Figure 7 and Figure 8). Since this thin layer is free of 28Si/16O, this observation supports the idea of mineral weathering as the likely Al source. Al-organic-complexes are then formed and appear as a thin layer on phyllosilicates [31], which are identified by the presence of 27Al16O/16O + 28Si/16O and occur at distances > 10 µm. Alternatively, Al-phosphate precipitates may occur as a continuous layer around roots [32]. The depletion of 28Si/16O in the 0–10 µm zone can be explained by Si uptake by rice plants [33]. Thus, our study visualized that Fe/Al-organic matter associations form in distinct layers around rice roots. 56Fe16O/16O is directly concentrated at the root surface, as a result of Fe transport in a reduced form from the anoxic soil matrix to the oxic area around the roots. 27Al16O/16O is slightly enriched at the interface to silicates.
In the zone 10–40 µm from the edge of the root channel, 28Si/16O appeared, and the presence of both 27Al16O/16O and 28Si/16O indicated the predominance of silicates, e.g., phyllosilicates. Although the reddish colour shown by the images of reflected-light microscopy confirmed the oxidized state in these zones (particularly for transect 1), the 56Fe16O/16O occurrence is much lower in these areas compared to the encrusted root cells (Figure 9). This indicates lower abundances of Fe (hydr)oxides with increasing distance to the root channel. Our observations refer to thin roots with diameters of approximately 150 µm. According to Frommer et al. [14], Fe (hydr)oxides accumulated directly at the surface of thin roots. This was ascribed to a smaller O2 flux at the channel-soil interface compared to thicker roots. Around thicker roots, larger redox potentials can be maintained over longer distances (up to 1 mm), leading to concentric Fe accumulations formed further away from the root surface [14].
The spatial distribution of 12C14N/12C shows either high occurrences at distinct spots within the oxide-encrusted root cell (transect 1, Figure 6 and Figure 9), or high occurrences in a thin layer between the root cell and soil matrix (transects 2 and 3, Figure 7, Figure 8 and Figure 9). In this interface between the root and soil, root products released into the surrounding soil (rhizodeposits) may include sloughed-off root cap and border cells, mucilage, and exudates [34], and may thus explain the enrichment of 12C14N/12C in this zone.

4.3. Distinctive Zones of Oxides and Silicates

To summarize, our results visualized that the innermost oxic zone around rice roots cannot be explained by linear radial gradients alone. We found indications at the microscale that the oxic zone can be subdivided into distinctive zones. In all three transects, we identified a zone of completely oxide-encrusted root cells (or fragments of those cells), where exclusively Fe (hydr)oxides and Al–organic complexes occur. These oxides may have formed after drainage and harvest, and only subsequently dominated the mineral composition of this inner zone. It can be distinguished from an intermediate zone that was identified in two of the three transects, showing high occurrences of 27Al16O/16O and 12C14N/12C due to rhizodeposits and Al compounds retained therein. This intermediate zone was also characterized by high 56Fe16O/16O ratios, indicating precipitated Fe (hydr)oxides as a result of O2 flux at the channel-soil interface. However, the intermediate zone was depleted in 28Si/16O, which can be explained by the absence of phyllosilicates and quartz, and by the Si-uptake of rice plants. The third distinctive zone around the root channels was a silicate-dominated zone, which can be clearly identified by the occurrence of 28Si/16O and by the decreasing 56Fe16O/16O ratios.
The present study showed, on the basis of three randomly selected transects, similar elemental distributions at the microscale around rice roots after harvest. The combination of NanoSIMS and reflected light microscopic analyses, and the subsequent image analysis workflow, allowed us to quantify the microspatial relationships of element ratios in intact soil samples of root-affected microenvironments in a plough pan. Although these microscale analyses do not allow for a large number of replicates, they provide the opportunity to gain insight into underlying processes. For example, future applications could include the use of stable isotope enrichment to visualize, e.g., the formation of Al-organic complexes during the growing season, thus enabling the direct evaluation of effects of the active rhizosphere on organo-mineral associations in root affected soil matrices.

5. Conclusions

Oxygen diffusion from the rice roots into the rhizosphere leads to oxic conditions at the soil-root microenvironment. Visualization of element distributions in three transects with a high spatial resolution (µm scale) and their quantification using a newly developed workflow allowed distinguishing three distinctive zones in the oxic rhizosphere of single rice roots:
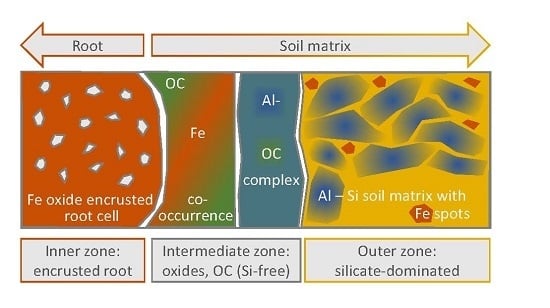
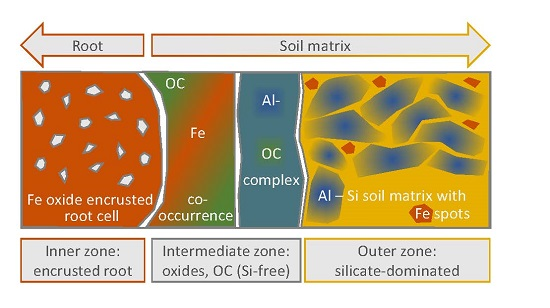
  • The inner zone is composed of oxide-encrusted residues of root cells (rhizodermis cells). This zone shows no occurrence of 28Si/16O. High occurrences of 56Fe16O/16O and clear positive relations between 27Al16O/16O and 12C14N/12C revealed coexisting regions of Fe (hydr)oxides and Al–organic complexes.
  • An intermediate zone was identified in two of the three transects (approx. 0–10 µm from the outermost root cell) and comprised not only high occurrences of precipitated Fe (hydr)oxides, but also rhizodeposits with Al compounds retained therein. This supports the ability of rice roots to protect the rice plants against phytotoxic concentrations of reduced substances.
  • Contiguous to the intermediate zone, the outer zone is characterized by an abrupt change in element composition. 28Si/16O and 27Al16O/16O in distances of > 10 µm from the edge of the root channel revealed the occurrence of silicates in this zone. Lower 56Fe16O/16O ratios with a different spatial pattern as compared to 27Al16O/16O indicated interspersed Fe (hydr)oxides.
Al-organic complexes seem to be the dominant form of organic matter in encrusted root cells and the adjacent soil matrix. This suggested that the formation of Al-organic complexes occurs independently from the formation of Fe (hydr)oxides in the rhizosphere of paddy soil.

Supplementary Materials

The following are available online at https://www.mdpi.com/2411-5126/1/1/2/s1, Figure S1: Original NanoSIMS images, exemplified by transect 2, Figure S2: Original NanoSIMS images, exemplified by transect 3, Figure S3: Scatter plots, showing the relation between 56Fe16O/16O, 27Al16O/16O, 28Si/16O and 12C14N/12C for each pixel of all three transects, differentiated between −15–0 µm, 0–10 µm and 10–40 µm distance from the root surface. Grey: transect 1; blue: transect 2; red: transect 3.

Acknowledgments

The National Rice Research Centre is gratefully acknowledged for giving us the opportunity to work at the paddy field near Zeme (Mortara, Italy), for help during soil sampling, and for providing important information about the sampling area. The authors thank Peter Schad for his description of the soil profiles. We acknowledge Bärbel Angres and Monika Heilmeier for their analysis of basic soil parameters. Three anonymous reviewers are gratefully acknowledged for their suggestions which considerably improved the manuscript. Funding from the German Research Foundation (DFG) is acknowledged for the NanoSIMS instrument (KO 1035/38-1). Financial support for Steffen Schweizer is acknowledged from Deutsche Forschungsgemeinschaft within the framework of the research unit “MAD Soil—Microaggregates: Formation and turnover of the structural building blocks of soils” (DFG RU 2179) through project KO 1035/48-1. We are grateful to the Deutsche Forschungsgemeinschaft (DFG) for their generous funding of the Research Unit FOR 995: Biogeochemistry of paddy soil evolution.

Author Contributions

Angelika Kölbl and Carsten W. Müller conceived and designed the experiments; Carmen Höschen and Johann Lugmeier performed the experiments; Carmen Höschen, Steffen A. Schweizer, and Steffen Schlüter analyzed the data and edited the manuscript; Daniel Said-Pullicino and Marco Romani edited the manuscript and contributed materials and site information; Angelika Kölbl, Carsten W. Müller, and Ingrid Kögel-Knabner wrote the paper.

Conflicts of Interest

The authors declare no conflict of interest.

References

  1. Ponnamperuma, F.N. The chemistry of submerged soils. Adv. Agron. 1972, 24, 29–96. [Google Scholar]
  2. Armstrong, W.; Justin, S.; Beckett, P.M.; Lythe, S. Root adaptation to soil waterlogging. Aquat. Bot. 1991, 39, 57–73. [Google Scholar] [CrossRef]
  3. Butterbach-Bahl, K.; Papen, H.; Rennenberg, H. Scanning electron microscopy analysis of the aerenchyma in two rice cultivars. Phyton-Ann. Rei Bot. 2000, 40, 43–55. [Google Scholar]
  4. Armstrong, W. Radial Oxygen Losses from Intact Rice Roots as Affected by Distance from the Apex, Respiration and Waterlogging. Physiol. Plantarum 1971, 25, 192–197. [Google Scholar] [CrossRef]
  5. Kumazawa, K. Physiological specificity of rice root in relation to oxidizing power and nutrient uptake. In Biology of Rice; Elsevier Science Publishers: Amsterdam, The Netherlands, 1984. [Google Scholar]
  6. Flessa, H.; Fischer, W.R. Plant-induced changes in the redox potentials of rice rhizospheres. Plant Soil 1992, 143, 55–60. [Google Scholar] [CrossRef]
  7. Wu, C.; Ye, Z.H.; Li, H.; Wu, S.C.; Deng, D.; Zhu, Y.G.; Wong, M.H. Do radial oxygen loss and external aeration affect iron plaque formation and arsenic accumulation and speciation in rice? J. Exp. Bot. 2012, 63, 2961–2970. [Google Scholar] [CrossRef] [PubMed]
  8. Schmidt, H.; Eickhorst, T.; Tippkoetter, R. Monitoring of root growth and redox conditions in paddy soil rhizotrons by redox electrodes and image analysis. Plant Soil 2011, 341, 221–232. [Google Scholar] [CrossRef]
  9. Seyfferth, A.L.; Webb, S.M.; Andrews, J.C.; Fendorf, S. Arsenic Localization, Speciation, and Co-Occurrence with Iron on Rice (Oryza sativa L.) Roots Having Variable Fe Coatings. Environ. Sci. Technol. 2010, 44, 8108–8113. [Google Scholar] [CrossRef] [PubMed]
  10. Doran, G.; Eberbach, P.; Helliwell, S. The impact of rice plant roots on the reducing conditions in flooded rice soils. Chemosphere 2006, 63, 1892–1902. [Google Scholar] [CrossRef] [PubMed]
  11. Trolldenier, G. Visualisation of oxidizing power of rice roots and of possible participation of bacteria in iron deposition. Z. Pflanzenern. Bodenk. 1988, 151, 117–121. [Google Scholar] [CrossRef]
  12. Hinsinger, P. Bioavailability of soil inorganic P in the rhizosphere as affected by root-induced chemical changes: A review. Plant Soil 2001, 237, 173–195. [Google Scholar] [CrossRef]
  13. Spence, A.; Robinson, C.; Hanson, R.E. The effects of microstructural changes on montmorillonite-microbial interactions. J. Mol. Struct. 2014, 1056, 157–165. [Google Scholar] [CrossRef]
  14. Frommer, J.; Voegelin, A.; Dittmar, J.; Marcus, M.A.; Kretzschmar, R. Biogeochemical processes and arsenic enrichment around rice roots in paddy soil: Results from micro-focused X-ray spectroscopy. Eur. J. Soil Sci. 2011, 62, 305–317. [Google Scholar] [CrossRef]
  15. Yamaguchi, N.; Ohkura, T.; Takahashi, Y.; Maejima, Y.; Arao, T. Arsenic Distribution and Speciation near Rice Roots Influenced by Iron Plaques and Redox Conditions of the Soil Matrix. Environ. Sci. Technol. 2014, 48, 1549–1556. [Google Scholar] [CrossRef] [PubMed]
  16. Heister, K.; Hoeschen, C.; Pronk, G.J.; Mueller, C.W.; Koegel-Knabner, I. NanoSIMS as a tool for characterizing soil model compounds and organomineral associations in artificial soils. J. Soils Sediment 2012, 12, 35–47. [Google Scholar] [CrossRef]
  17. Mueller, C.W.; Remusat, L.; Rumpel, C. Characterization of biogeochemical processes at the microscale: Concepts and applications of NanoSIMS. In Terrestrial Ecosystem Research Infrastructures; Chabbi, A., Loescher, H.W., Eds.; CRC Press: Boca Raton, FL, USA, 2017. [Google Scholar]
  18. Clode, P.L.; Kilburn, M.R.; Jones, D.L.; Stockdale, E.A.; Cliff, J.B.; Herrmann, A.M.; Murphy, D.V. In Situ Mapping of Nutrient Uptake in the Rhizosphere Using Nanoscale Secondary Ion Mass Spectrometry. Plant Physiol. 2009, 151, 1751–1757. [Google Scholar] [CrossRef] [PubMed]
  19. IUSS Working Group WRB. World Reference Base for Soil Resources 2006, First Update 2007; World Soil Resources Reports 103; FAO: Rome, Italy, 2007. [Google Scholar]
  20. Blakemore, L.C.; Searle, P.L.; Daly, B.K. Methods for Chemical Analysis of Soils. New Zealand Soil Bureau Scientific Report 1987; New Zealand Soil Bureau: Lower Hutt, New Zealand, 1987; Volume 80. [Google Scholar]
  21. Mehra, O.P.; Jackson, M.L. Iron oxide removal from soils and clays by a dithionite-citrate system buffered with sodium bicarbonate buffer. Clays Clay Miner. 1960, 7, 317–327. [Google Scholar] [CrossRef]
  22. Mueller, C.W.; Weber, P.K.; Kilburn, M.R.; Hoeschen, C.; Kleber, M.; Pett-Ridge, J. Advances in the Analysis of Biogeochemical Interfaces: NanoSIMS to Investigate Soil Microenvironments. Adv. Agron. 2013, 121, 1–46. [Google Scholar]
  23. Herrmann, A.M.; Clode, P.L.; Fletcher, I.R.; Nunan, N.; Stockdale, E.A.; O’Donnell, A.G.; Murphy, D.V. A novel method for the study of the biophysical interface in soils using nano-scale secondary ion mass spectrometry. Rapid Commun. Mass Spectrom. 2007, 21, 29–34. [Google Scholar] [CrossRef] [PubMed]
  24. Mueller, C.W.; Hoeschen, C.; Steffens, M.; Buddenbaum, H.; Hinkel, K.; Bockheim, J. Microscale soil structures foster organic matter stabilization in permafrost soils. Geoderma 2017, 293, 44–53. [Google Scholar] [CrossRef]
  25. Thévenaz, P.; Unser, M. User-friendly semiautomated assembly of accurate image mosaics in microscopy. Microsc. Res. Tech. 2007, 70, 135–146. [Google Scholar] [CrossRef] [PubMed]
  26. Sommer, C.; Strähle, C.; Köthe, U.; Hamprecht, F.A. Ilastik: Interactive Learning and Segmentation Toolkit. Eighth IEEE Int. Symp. Biomed. Imaging (ISBI) 2011, 230–233. [Google Scholar]
  27. Khan, N.; Seshadri, B.; Bolan, N.; Saint, C.P.; Kirkham, M.B.; Chowdhury, S.; Yamaguchi, N.; Lee, D.Y.; Li, G.; Kunhikrishnan, A.; et al. Root Iron Plaque on Wetland Plants as a Dynamic Pool of Nutrients and Contaminants. Adv. Agron. 2016, 138, 1–96. [Google Scholar]
  28. Green, M.S.; Etherington, J.R. Oxidation of Ferrous Iron by Rice (Oryza sativa L.) Roots: A Mechanism for Waterlogging Tolerance? J. Exp. Bot. 1977, 28, 678–689. [Google Scholar] [CrossRef]
  29. April, R.; Keller, D. Mineralogy of the rhizosphere in forest soils of the eastern United States. Biogeochemistry 1990, 9, 1–18. [Google Scholar] [CrossRef]
  30. Cloutier-Hurteau, B.; Turmel, M.-C.; Sauve, S.; Courchesne, F. The speciation of water-soluble Al and Zn in the rhizosphere of forest soils. J. Environ. Monit. 2010, 12, 1274–1286. [Google Scholar] [CrossRef] [PubMed]
  31. Violante, A.; Caporale, A.G. Biogeochemical processes at soil-root interface. J. Soil Sci. Plant Nutr. 2015, 15, 422–448. [Google Scholar] [CrossRef]
  32. Batty, L.C.; Baker, A.J.M.; Wheeler, B.D. Aluminium and phosphate uptake by Phragmites australis: The role of Fe, Mn and Al root plaques. Ann. Bot. 2002, 89, 443–449. [Google Scholar] [CrossRef] [PubMed]
  33. Klotzbucher, T.; Marxen, A.; Jahn, R.; Vetterlein, D. Silicon cycle in rice paddy fields: Insights provided by relations between silicon forms in topsoils and plant silicon uptake. Nutr. Cycl. Agroecosyst. 2016, 105, 157–168. [Google Scholar] [CrossRef]
  34. McNear, D.H., Jr. The rhizosphere—roots, soil and everything in between. Nat. Educ. Knowl. 2013, 4, 1. [Google Scholar]
Figure 1. Exposed surface after breaking the soil, showing several oxidised root channels within the reduced soil matrix.
Soils 01 00002 g001
Figure 2. Scheme of the image analysis based on NanoSIMS images. (a) Reflected-light microscopy was used to select transects from the rice root into the mineral matrix; (b) NanoSIMS images (each 20 × 20 µm) were combined; (c) Areas of the images displaying only the embedding epoxy resin were removed based on image segmentation; (d) Distance maps were created, showing the distance from the rice root. The outer root cells in all transects form an approximately vertical boundary to the soil matrix, thus we assume a horizontal gradient of the oxygen impact in all transects. The dotted line in (a) displays the boundary between the outer root cell and the soil matrix. We defined negative values as representing locations within the root cell; positive values describe distances from the root cell into the soil matrix. Distance maps were produced for all transects and were used to calculate the mean distributions of secondary ions. (Scale bar = 5 µm).
Soils 01 00002 g002
Figure 3. Optical micrographs showing root channels (rc), the soil matrix including quartz grains (qz), and a close-up view of a single root cross-section. The centre of the root channel is filled with epoxy resin (araldite, ar), whereas some oxide-encrusted root cells (ox-c) are localised at the periphery of the channel. Three rectangles indicate the position of the subsequent NanoSIMS analyses.
Soils 01 00002 g003
Figure 4. Optical micrographs of a root tip within the soil matrix. Three rectangles indicate the position of the subsequent NanoSIMS analyses.
Soils 01 00002 g004
Figure 5. Original NanoSIMS images of transect 1, showing occurrences of 16O, 12C, 56Fe16O, 27Al16O, 12C14N, and 28Si.
Soils 01 00002 g005
Figure 6. Merged NanoSIMS images of transect 1 representing 56Fe16O/16O, 27Al16O/16O, 12C14N/12C, and 28Si/16O ratios, each area 20 × 20 µm, 255 × 255 pixels, 30 ms dwell time.
Soils 01 00002 g006
Figure 7. Merged NanoSIMS images of transect 2 representing 56Fe16O/16O, 27Al16O/16O, 12C14N/12C, and 28Si/16O ratios, each area 20 × 20 µm, 255 × 255 pixels, 30 ms dwell time.
Soils 01 00002 g007
Figure 8. Merged NanoSIMS images of transect 3 representing 56Fe16O/16O, 27Al16O/16O, 12C14N/12C, and 28Si/16O ratios, each area 20 × 20 µm, 255 × 255 pixels, 30 ms dwell time.
Soils 01 00002 g008
Figure 9. Average occurrences given as median ± standard deviation of 27Al16O/16O (a) and 56Fe16O/16O (b) and 28Si/16O (c) and 12C14N/12C (d) with distance from the plant cells; (e) shows the number of applicable pixels at each distance. Each data point represents the median of the element ratios within 10 distance pixels (around 1.2 µm) with > 200 pixel counts (around 3% had < 200 pixels and were not included in the figure).
Soils 01 00002 g009
Table 1. Basic soil properties of the Ardp horizon (25–34 cm) were analyzed using air-dried, homogenized samples (including root channels) sieved to < 2 mm.
ParameterUnitValue
Bulk densityg·cm−31.82
pHCaCl2 1 5.1
OC 2mg·g−16.20
Nt2mg·g−10.68
Alox 3mg·g−10.53
Feox 3mg·g−12.48
Mnox 3mg·g−10.01
AlDCB 4mg·g−10.47
FeDCB 4mg·g−14.02
MnDCB 4mg·g−10.01
1 Soil pH was measured with a combined electrode in 0.01 M CaCl2 solution at a soil/solution ratio of 1:2.5. The suspension was shaken for 5 min and allowed to equilibrate for 1 h. 2 Organic carbon (OC) and total nitrogen (Nt) concentration was determined by dry combustion at 950 °C on a Vario MAX elemental analyzer (Elementar Analysensysteme, Hanau, Germany). 3 Oxalate-extractable Al, Fe, and Mn (abbreviated as Alox, Feox, Mnox) were determined according to Blakemore et al. [20] with NH4-oxalate at pH 3.0 after shaking for 2 h in the dark. 4 Total “free” oxides of Al, Fe, and Mn were determined by dithionite-citrate-bicarbonate (DCB) extraction after Mehra and Jackson [21] (abbreviated as AlDCB, FeDCB, and MnDCB). The concentrations of Al, Fe, and Mn were determined by inductively coupled plasma-optical emission spectroscopy.

