1. Introduction
In an all-electric ship power system, ensuring the continuity of service for the ship’s equipment is of paramount importance. The mission’s success depends on the proper functioning of equipment loads, such as radar, weapons, and propulsion motors. A distribution system failure can result in power disruptions to vital equipment loads of the naval vessel, potentially posing a serious threat to the crew and the mission. Therefore, it is necessary to ensure that shipboard power systems (SPS) are designed to be as robust as possible with a minimum frequency and duration of service interruptions.
In literature, to obtain a high level of service reliability, survivability and quality of service (QOS) measures have been characterized as primary design criteria for SPS [
1,
2]. Survivability measures the ability of the power system to support system loads in an event of damage due to battle operations, floods or fire, while QOS measures the ability to provide continued service during peacetime or normal operations. Usually, design considerations for survivability and QOS requirements do not conflict. However, some of the design choices may impact one criterion more than others [
1,
2]. To ensure survivability, zonal architectures are sought that prohibit the spread of a fault to undamaged zones of the SPS [
2,
3,
4,
5]. As for the peacetime operations, service interruptions are most often caused by the failures of individual components within the distribution system. The reliability during peacetime operations is characterized using QOS metrics. In the literature, the metrics for calculating peacetime QOS in SPS have been established [
6,
7] and applied to designing SPS with a primary focus on equipment design choices and control interfaces. The approach to quantify distribution system reliability as a function of system topology has also been explored [
8,
9,
10,
11].
This work evaluates system reliability from the perspective of the overall distribution network topology, that is, the relationship between the reliability of a distribution circuit and the high-level topology of its connections. The proposed approach is based on a two-level distribution topology: the primary distribution system, and the secondary zonal electric distribution (ZED) system. To ensure the highest possible level of service continuity in equipment loads, this work aims to improve the reliability of shipboard electrical distribution systems through the choice of distribution system topology. Furthermore, methods to improve service reliability, both for the ship’s primary distribution system and the ZED system, are explored.
For the ship’s primary distribution system, three notional topologies based on ring bus, breaker-and-a-half (BAAH) and double-bus double-breaker (DBDB) have been compared. The analysis demonstrates that an equivalent topology based on the BAAH design results in the maximum reliability, outperforming the other two topologies. For the primary distribution system, the reliability improvements obtained by optimal placement of equipment loads and generation units within an existing topology are investigated [
12]. Note that in the literature, system reconfiguration problems have been extensively studied. These problems focus on serving critical loads during a fault or damage condition by reconfiguring the power path [
13,
14,
15,
16]. An equipment placement problem is, however, different from the system reconfiguration problem. The equipment placement problem is a planning concern and aims to find an optimal equipment placement configuration for a given SPS topology.
Additionally, to maximize the reliability of the ship’s ZED system, an algorithm is proposed aiming to design a ZED topology that maximizes the overall availability of the network while minimizing the design economy or the number of conductors. Availability is defined as the steady-state probability that a component or a system is operational [
17,
18]. The distribution circuit design problem is approached from the perspective of minimizing circuit losses and satisfying load demand [
19,
20,
21,
22]. However, in recent years, to provide improved service continuity [
23], researchers have sought to develop circuit architectures with improved service reliability [
24,
25,
26,
27]. Contrary to residential distribution circuits, for a ship’s ZED system, usually a grid topology is adopted to maximize the service continuity. However, considering the space constraints in an electric ship, it would be better if a required level of service continuity/reliability can be achieved using a lesser number of conductors. We propose an algorithm to design a distribution topology that satisfies a given reliability constraint while minimizing the number of conductors [
28].
The rest of the paper is organized as follows.
Section 2 presents a background on the SPS design problem. A detailed literature review including the limitations of the existing methods and the proposed approach is presented.
Section 3 details reliability concepts and metrics used in this work to quantify system reliability and availability.
Section 4 presents the proposed approach and design principles for reliable SPS design. The findings are presented in
Section 5, followed by discussions and conclusions in
Section 6 and
Section 7, respectively.
3. Reliability Concepts
Reliability analysis evaluates the probability of observing an equipment failure and the estimated duration for which the failure will persist before the equipment is repaired and returned to service. For distribution systems, reliability is quantified using the following related concepts: component reliability, system reliability, and network availability.
3.1. Component Reliability Indices
Component reliability analysis evaluates the expected frequency and duration of failures of distribution system components, such as circuit breakers, buses, and power converters. This study groups the component failures into three categories: passive failures, active failures, and stuck breakers. Passive failures result in an open circuit preventing power from flowing through the component. Active failures disable the failed component and cause all adjacent circuit breakers to trip and isolate the fault. A stuck breaker fails to isolate a fault.
Component reliability is quantified through two indices: (1) failure rate (λ)—defined as the expected number of failures a given component will experience in one year, and (2) mean time to repair (MTTR)—defined as the expected length of time, in hours, that the component failure will persist before it is repaired. The inverse of MTTR is defined as the repair rate, denoted by π. Except stuck breaker failure, which by definition must occur as the result of an adjacent active failure, this study assumes component failures to be independent of one another. The component failure reliability indices used in this analysis are taken either from manufacturer data or independent testing [
32,
33,
34], and are shown in
Table 1.
3.2. System Reliability Indices
System reliability analysis obtains the expected frequency and duration of service interruptions to equipment loads due to component failures. Service interruption to an equipment load results when the load is electrically isolated from all generation units. In this study, we have assumed that the SPS serves five equipment systems: propulsion, energy storage, radar, pulsed loads, and zonal load centers. The reliability of each equipment system is separately calculated.
Same as component reliability, equipment system reliability is quantified using the following two indices: service interruption rate (μ), and system MTTR. The service interruption rate quantifies the expected number of service interruptions experienced by an equipment load in one year. The system MTTR measures the expected number of hours before the service to the equipment load is interrupted before repairs to the failed components are performed. A third index, total expected downtime, is the product of the interruption rate and MTTR, defined as the expected number of hours per year that the equipment system will spend in an interrupted state.
3.3. Network Availability
Network availability () is defined as the probability that the network is in operating state at time , given that the network was operating at time zero. To quantify network availability, we must characterize network operating state, depending upon the desired network operation. For example, for an electric distribution circuit, the network is said to be operational if the electric service is available to each load supplied by the circuit. In this paper, we characterize a network as being operational if a path exists from the source node to each load node. We identify a failure condition if any one of the load nodes has no electric service due to disconnection from the source node.
A network availability problem is modeled on a probabilistic graph where each edge has an associated probability of failure or operation. A graph or a network is a collection of nodes and edges. A distribution circuit is mathematically represented using a probabilistic graph. A probabilistic graph is a set V of n nodes representing load and source nodes together with a set E of m edges representing distribution lines, where each edge is associated with an availability index (). The index () quantifies the availability of edge, which is equal to the probability that edge is operational at time , given that it was operational at time zero.
Using reliability theory, the steady-state availability of edge
depends on its failure rate,
, and repair rate,
, and is given by (1).
3.4. Calculate System Reliability Indices
The calculation of the system reliability indices for each equipment load is accomplished using a two-part process. First, the fault-tree analysis is used to identify a complete list of interruption scenarios for a given equipment load [
18]. Here, an interruption scenario is a minimal set of one or more concurrent component failures that disconnects the equipment load from all generators. The scenario order is defined as the number of individual component failures resulting in an interruption scenario. Interruption scenarios up to second-order are considered, as third- and higher-order failures are exceptionally rare and therefore do not greatly affect reliability indices [
8], [
9]. Reliability indices are derived for the equipment load using Markov models [
10]. Markov models are used to represent each interruption scenario, with each state of the model representing a combination of working and failed components. Through each scenario’s Markov model, equations used for calculating scenario interruption rates and MTTRs are derived. A more detailed derivation of these equations can be found in [
10].
3.5. Calculate Network Availability Indices
In this work, network availability (
) is computed using minpaths [
35]. The implemented availability calculation algorithm does not use any approximation and calculates the actual network availability for a given distribution system. A minpath is a set of nodes and edges that characterizes an operational network, but the removal of any one edge results in a loss of service; such a case is defined as network failure. A minpath would be defined differently depending upon the definition of the operational network [
36]. For example, the minpath for the grid topology (
) shown in
Figure 1 is characterized by a minimal subgraph of
connecting all nodes of
.
The principle of minpath based availability calculation algorithm is discussed here. Let
be minpaths of
. Let
be the event that all edges in minpath
are operational and
denote the probability of such an event. Then, the network availability is simply the probability that one or more events
occur (Equation (2)). Note that
are not disjoint events. Hence, the reliability of graph
(network) representing a ZED system is given by (Equation (2)).
where,
is the event that all paths
with
are operational. This is referred to as standard inclusion-exclusion expansion [
36].
4. Proposed Methodology for Designing SPS
In this paper, we present methods to design an SPS system for improved reliability during peacetime operation. As stated before, during peacetime operations, service interruptions are most often caused by failures of individual components within the distribution system. The probability that the service to an equipment load might be interrupted depends on two factors: the overall topology of the distribution system and the relative placement of loads and generation units within the system. To design reliable SPS architectures, we propose a framework that results in reliable SPS designs by the choice of distribution system topology and by exploring methods to improve reliability within a topology.
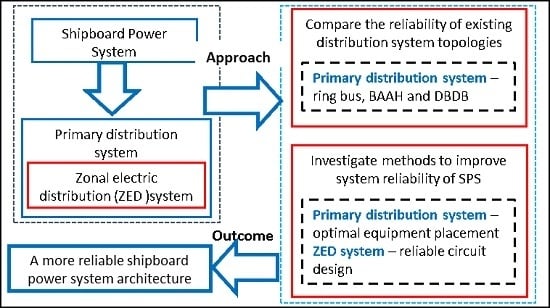
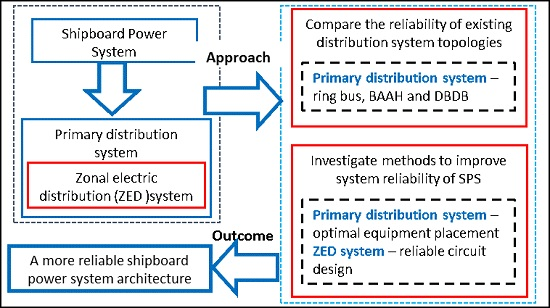
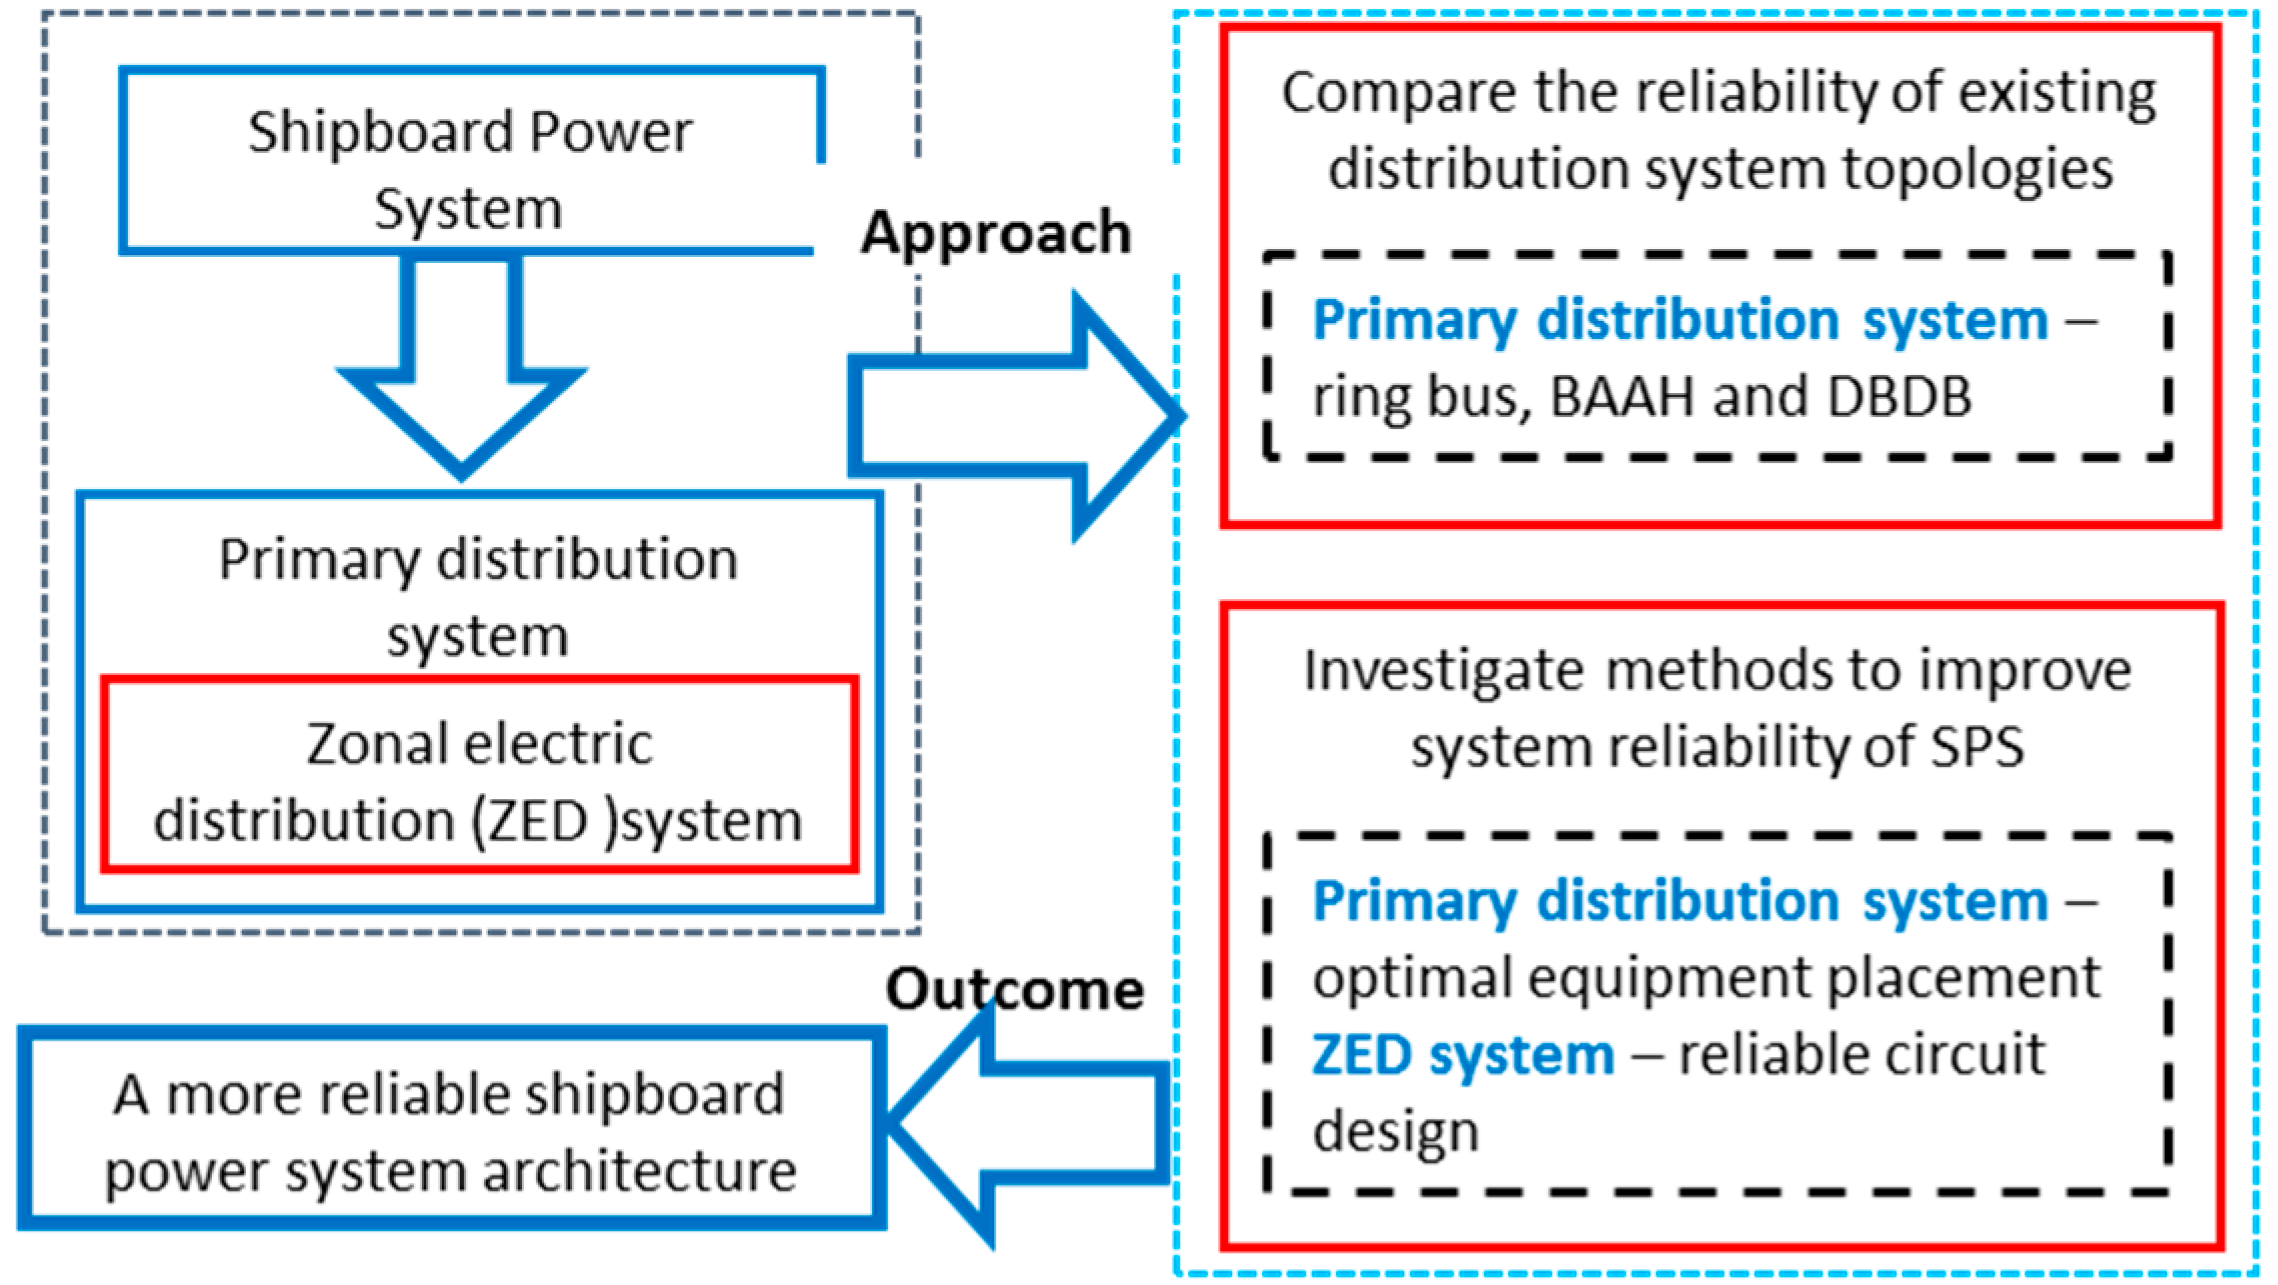
The proposed framework is based on designing a two-level distribution system topology: the ship’s primary distribution system, and a secondary/zonal electric distribution (ZED) system (see
Figure 1). The framework is outlined in
Figure 2. The analysis begins with comparing the reliability of three notional topologies for a ship’s primary distribution systems: ring bus, BAAH, and DBDB. Next, an approach to improve the reliability of SPS by optimally placing the equipment loads within an SPS topology is detailed. Finally, an algorithm to design a ZED topology that maximizes the overall reliability of the ZED system while minimizing the design economy or the number of conductors is developed.
4.1. Designing Primary Distribution System
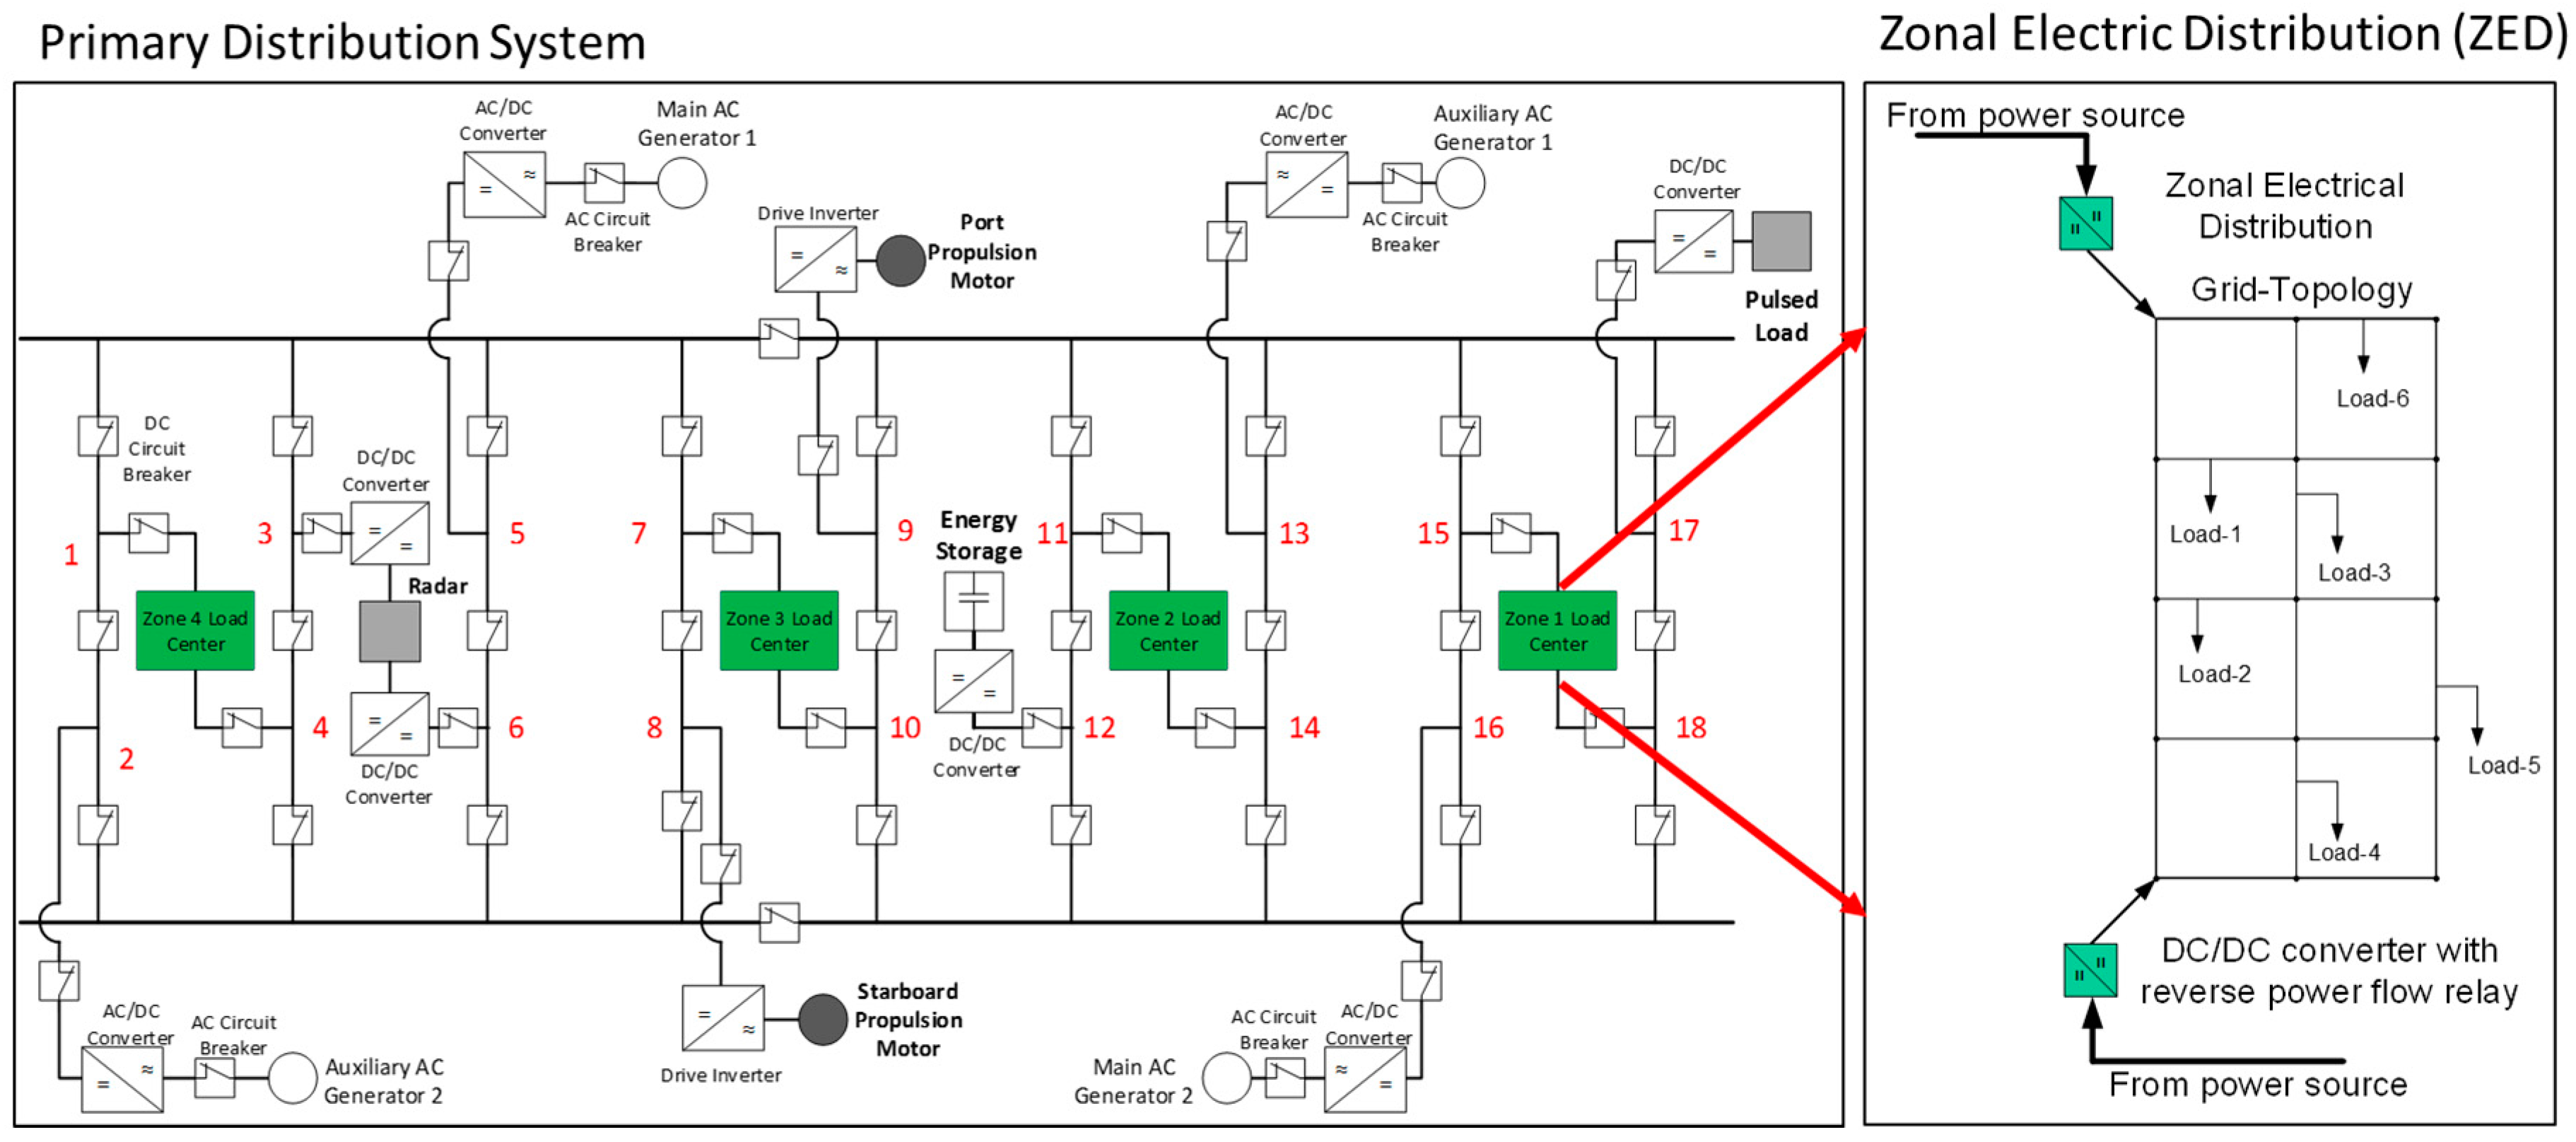
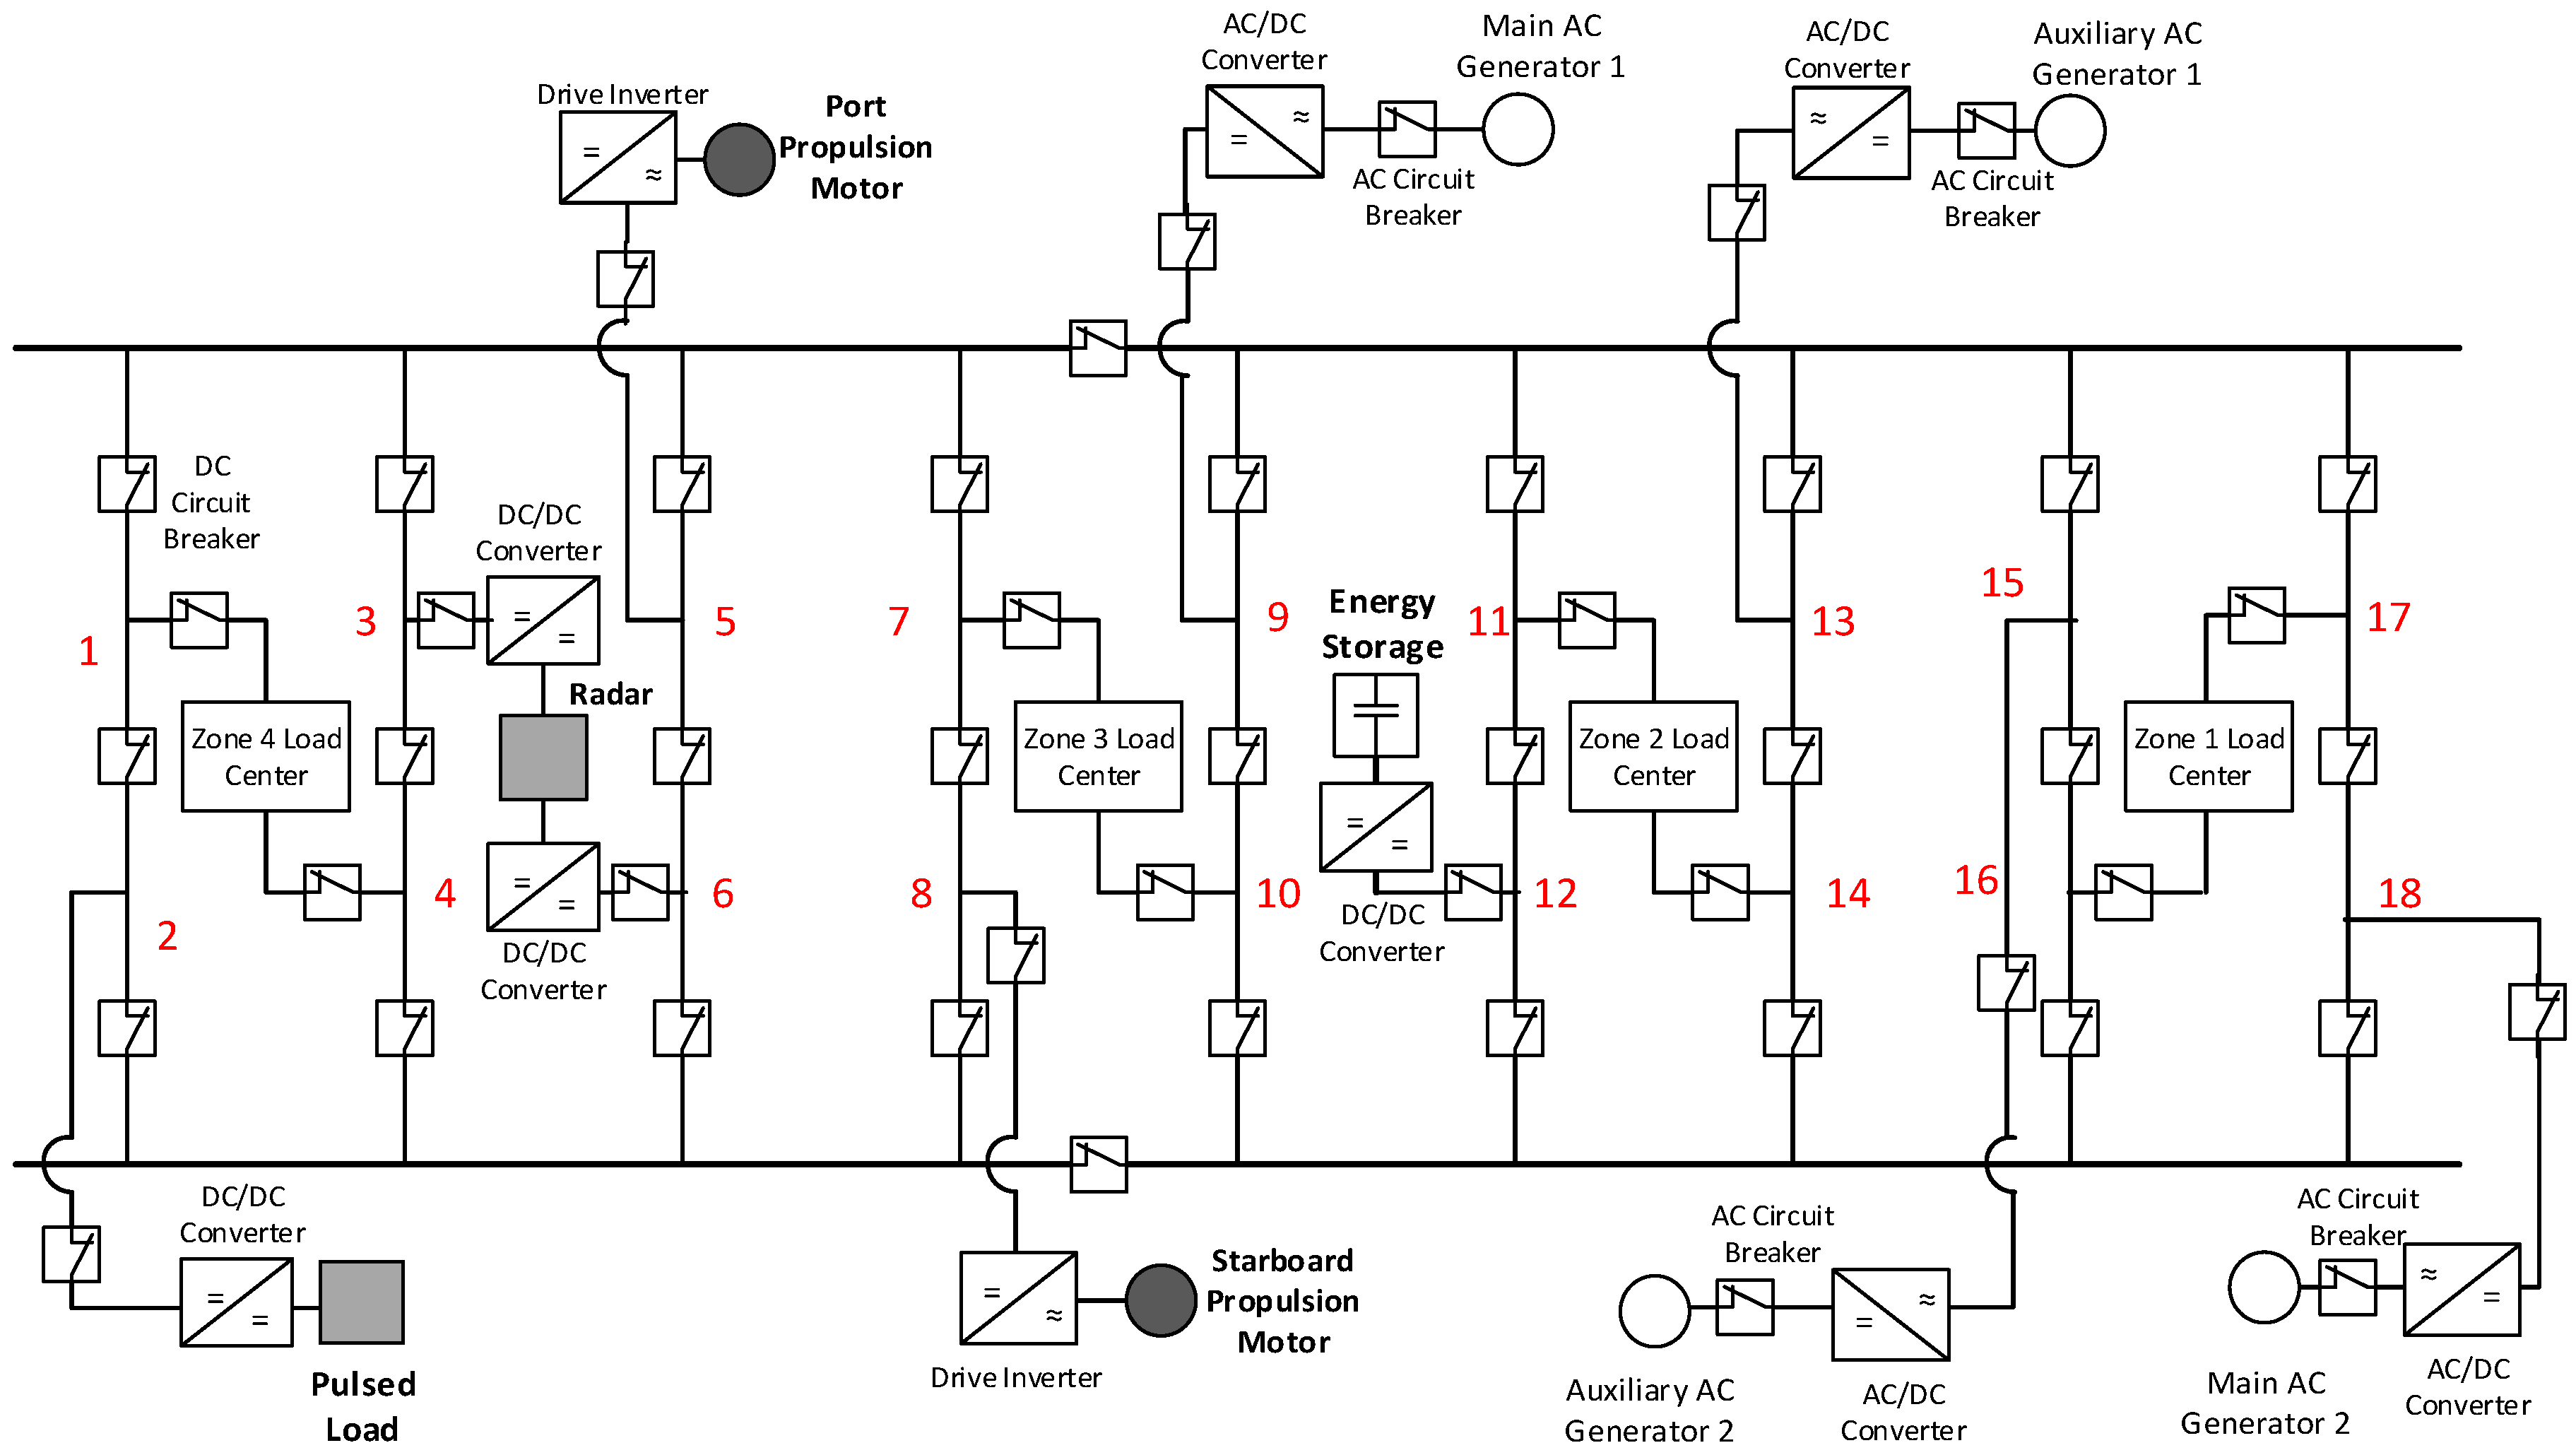
The probability that service to an equipment load might be interrupted depends on two factors: the overall topology of the distribution system and the relative placement of loads and generation units within the system. For the analysis, the shipboard power system shown in
Figure 1 is selected, which is supplying for nine equipment loads using four generators, i.e., two main and two auxiliaries. The equipment loads supplied by the distribution circuit are as follows: radar, energy storage, pulsed load, port propulsion motor, starboard propulsion motor, and four zonal load centers.
4.1.1. Comparing Distribution Circuit Topologies
We evaluate system reliability from the perspective of the overall distribution network topology, that is, the relationship between the reliability of a distribution circuit and the high-level topology of its connections. The method is specifically applied to the primary distribution system for an electric naval vessel, but the approaches described here can apply to most small-scale distribution systems, such as substations or microgrids. In this paper, three notional distribution system topologies based on terrestrial distribution substation design are adopted for designing a ship’s primary distribution system.
Figure 3 shows simplified one-line diagrams of the selected topologies, (1) ring bus (2) BAAH, and (3) DBDB.
In the ring bus topology, a ring of busbar runs around the ship’s perimeter with circuit breakers sectionalizing the ring to connect several equipment loads and generators. Note that ring bus arrangement is employed in most current notional electric naval vessels. In a BAAH topology, two parallel bus bars run across the port and starboard side of the ship, connected by several conducting wires called bays protected using three circuit breakers. Each incoming and outgoing wire is protected using 1.5 circuit breakers. In DBDB configuration, same as the BAAH topology, two parallel busbars are connected using cross-hull bays. Each bay is protected using two circuit breakers and contains only one line to equipment load or generator. Therefore, each incoming or outgoing line is protected using two circuit breakers.
4.1.2. Improving Reliability
Once the most reliable topology for SPS primary distribution system is identified, we aim to investigate methods to further improve the system reliability. We propose an approach to improve SPS reliability by optimally placing the equipment loads within a given SPS topology [
12]. This task specifically aims to understand the relationship between system reliability and the relative placement of equipment loads and generators within a given SPS topology. An equipment placement algorithm based on particle swarm optimization (PSO) [
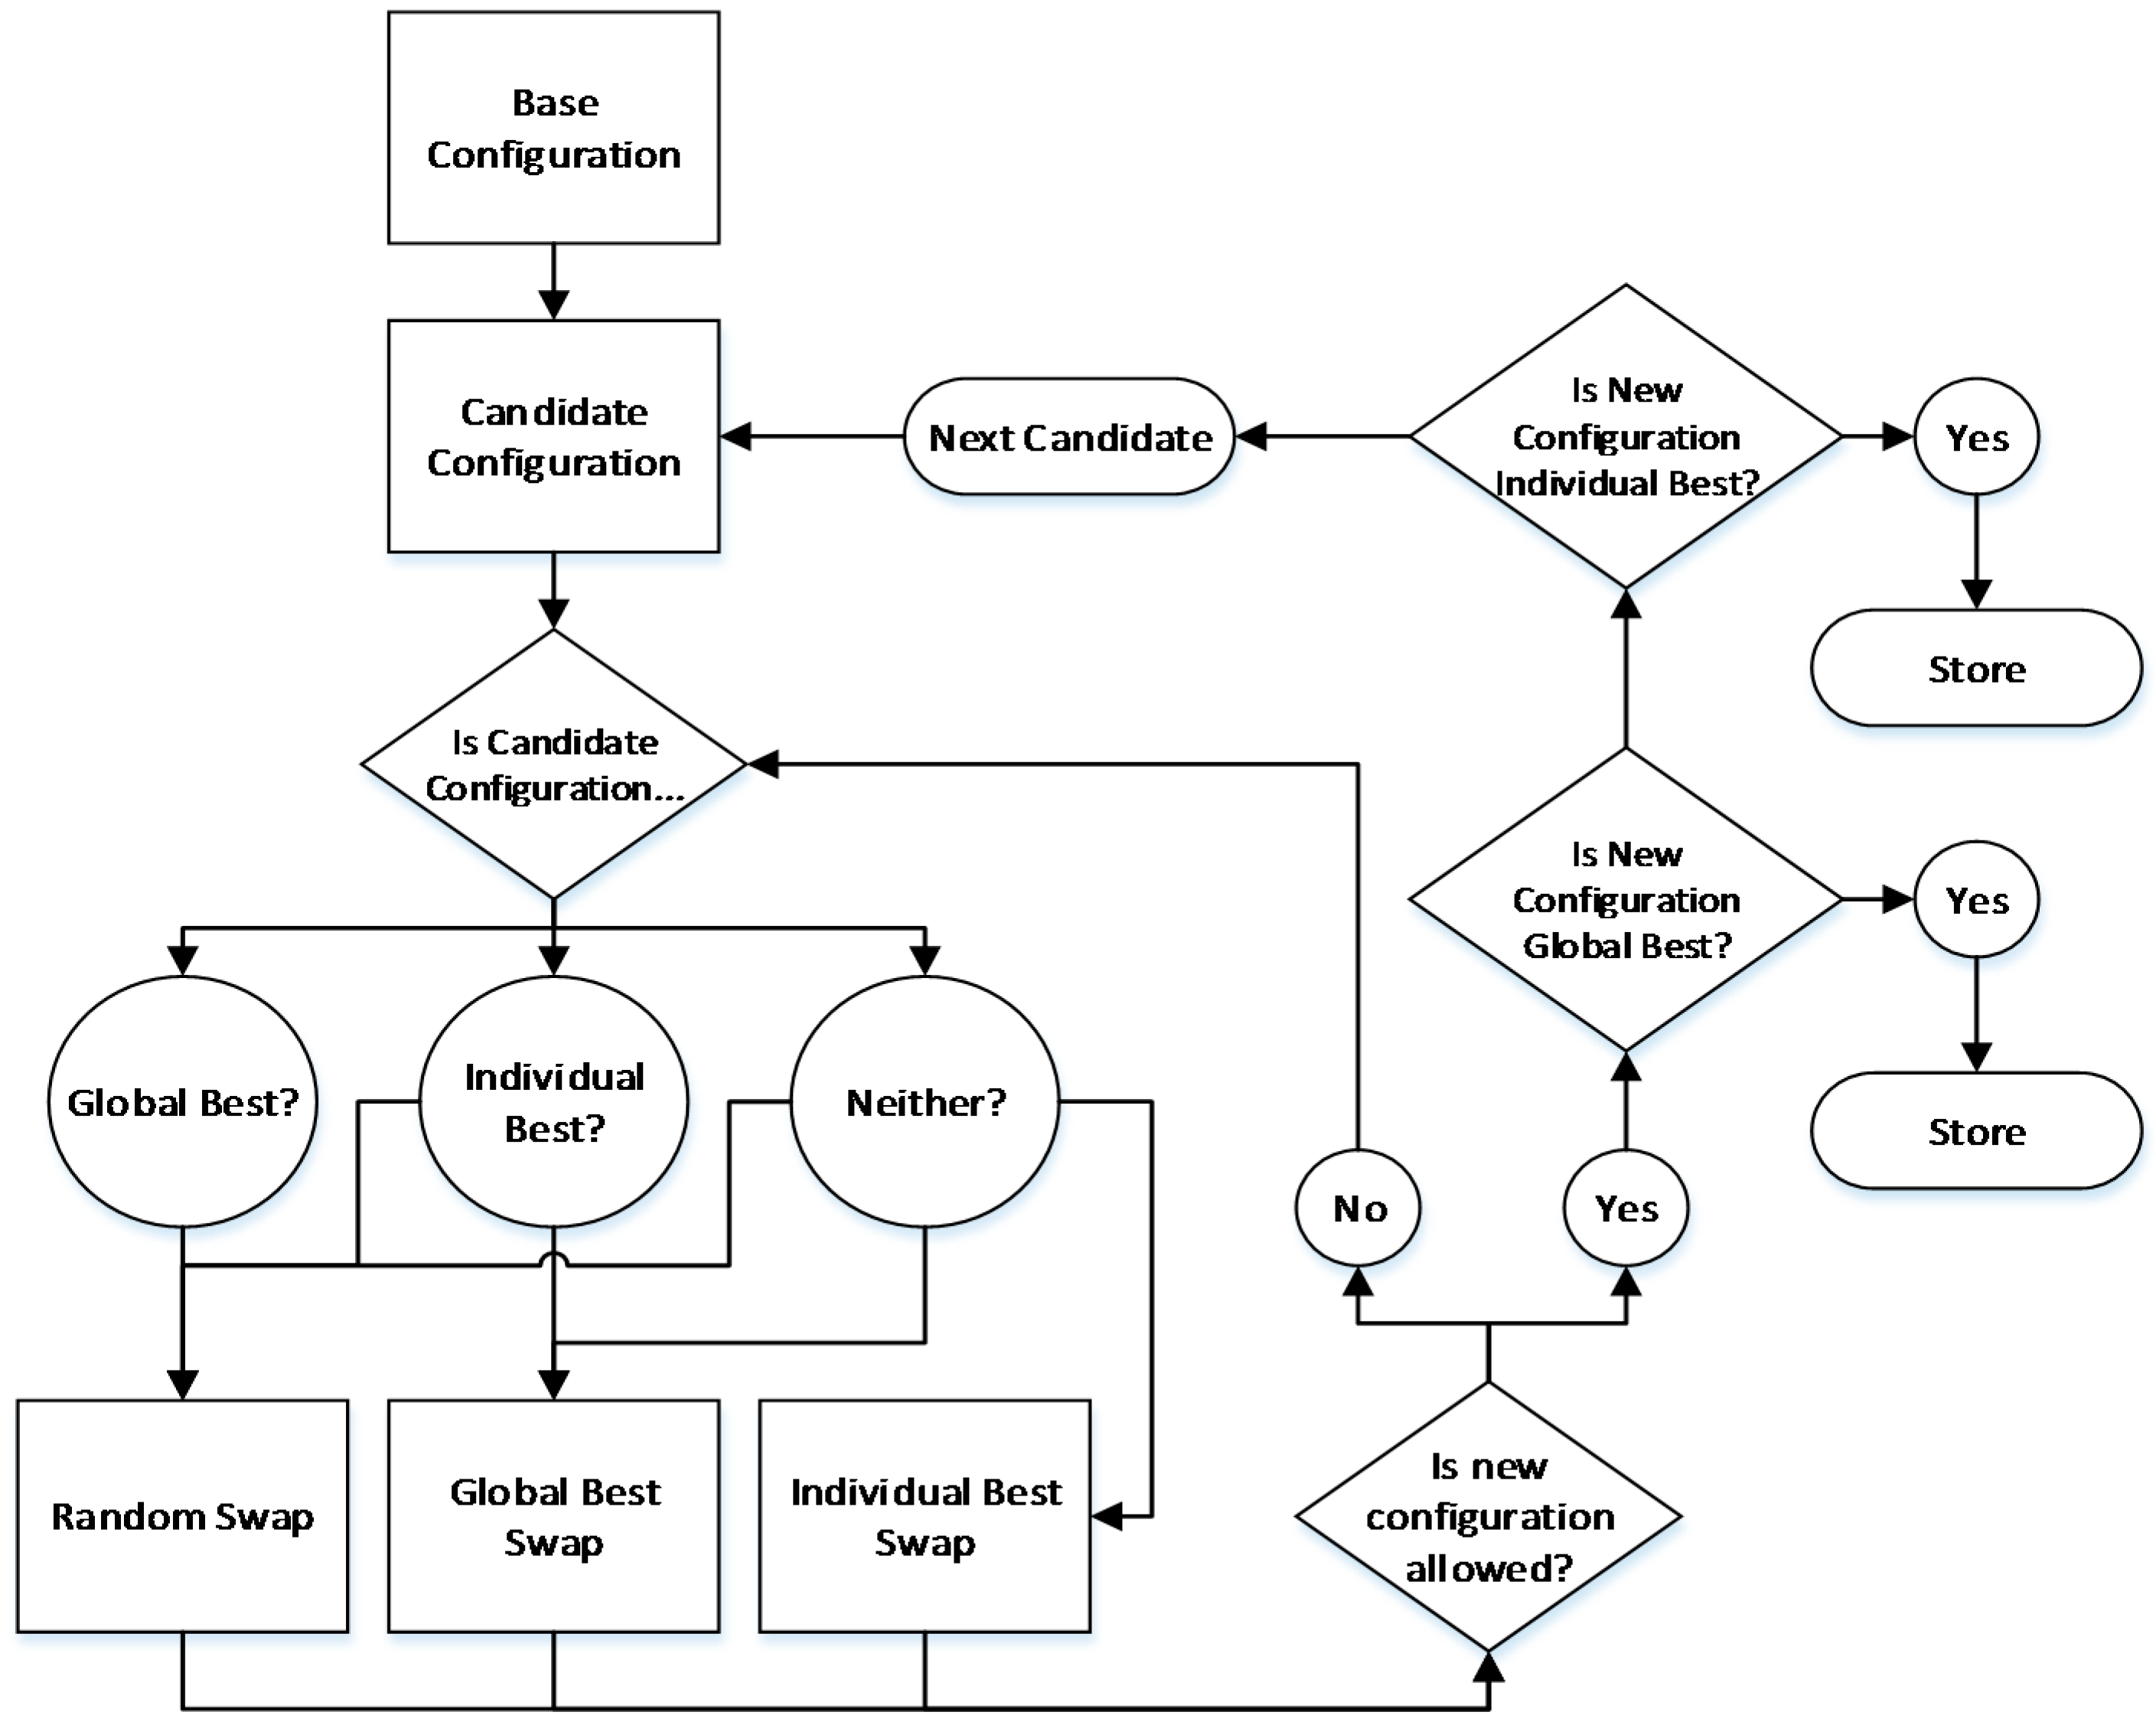
37] is proposed to obtain an optimal equipment arrangement in a given SPS topology, which will confer the highest level of system reliability. The flowchart for the proposed algorithm is shown in
Figure 4. The proposed algorithm simulates several candidate solutions, each candidate solution representing a particular equipment configuration. The algorithm updates each candidate configuration according to the candidate best and the global best solutions, and eventually converges to the globally optimized solution, representing the optimal equipment configuration.
For a simple comparison between different placement configurations, we define an overall system interruption rate, calculated as the weighted sum of each load’s interruption rate (
). The weights reflect the relative impact on a ship’s operation due to an interruption to each load. For example, the radar and weapons systems are weighted higher while calculating the overall interruption rate, as an interruption to these systems can significantly affect crew safety or mission success. On the other hand, the zonal load centers are assigned a lower weight index because of inherent redundancy by design [
1]. The overall interruption rate (
) is calculated using (Equation (3)). Please refer to [
12] for the details regarding the algorithm and the solution approach.
4.2. Designing Secondary Zonal Electric Distribution (ZED) System
An integrated SPS system requires methods for designing a reliable secondary/zonal electric distribution (ZED) system for the ship. The ship’s ZEDs are similar to a utility secondary distribution circuit supplying electric power to the end-users. Generally, a ship’s ZEDs are designed in a grid topology, realizing a high service availability (see
Figure 1). Understating the relationship between service reliability and circuit topology, we propose to design zonal circuit topology for a required reliability/availability index. In this paper, we propose an approach to achieve higher service reliability by designing an optimal circuit topology subject to a given service availability constraint. First, we propose a mathematical framework for the reliable ZED circuit design problem aiming to satisfy a given network availability constraint. Next, we present a graph-theory based algorithm to solve the proposed topology design problem [
28].
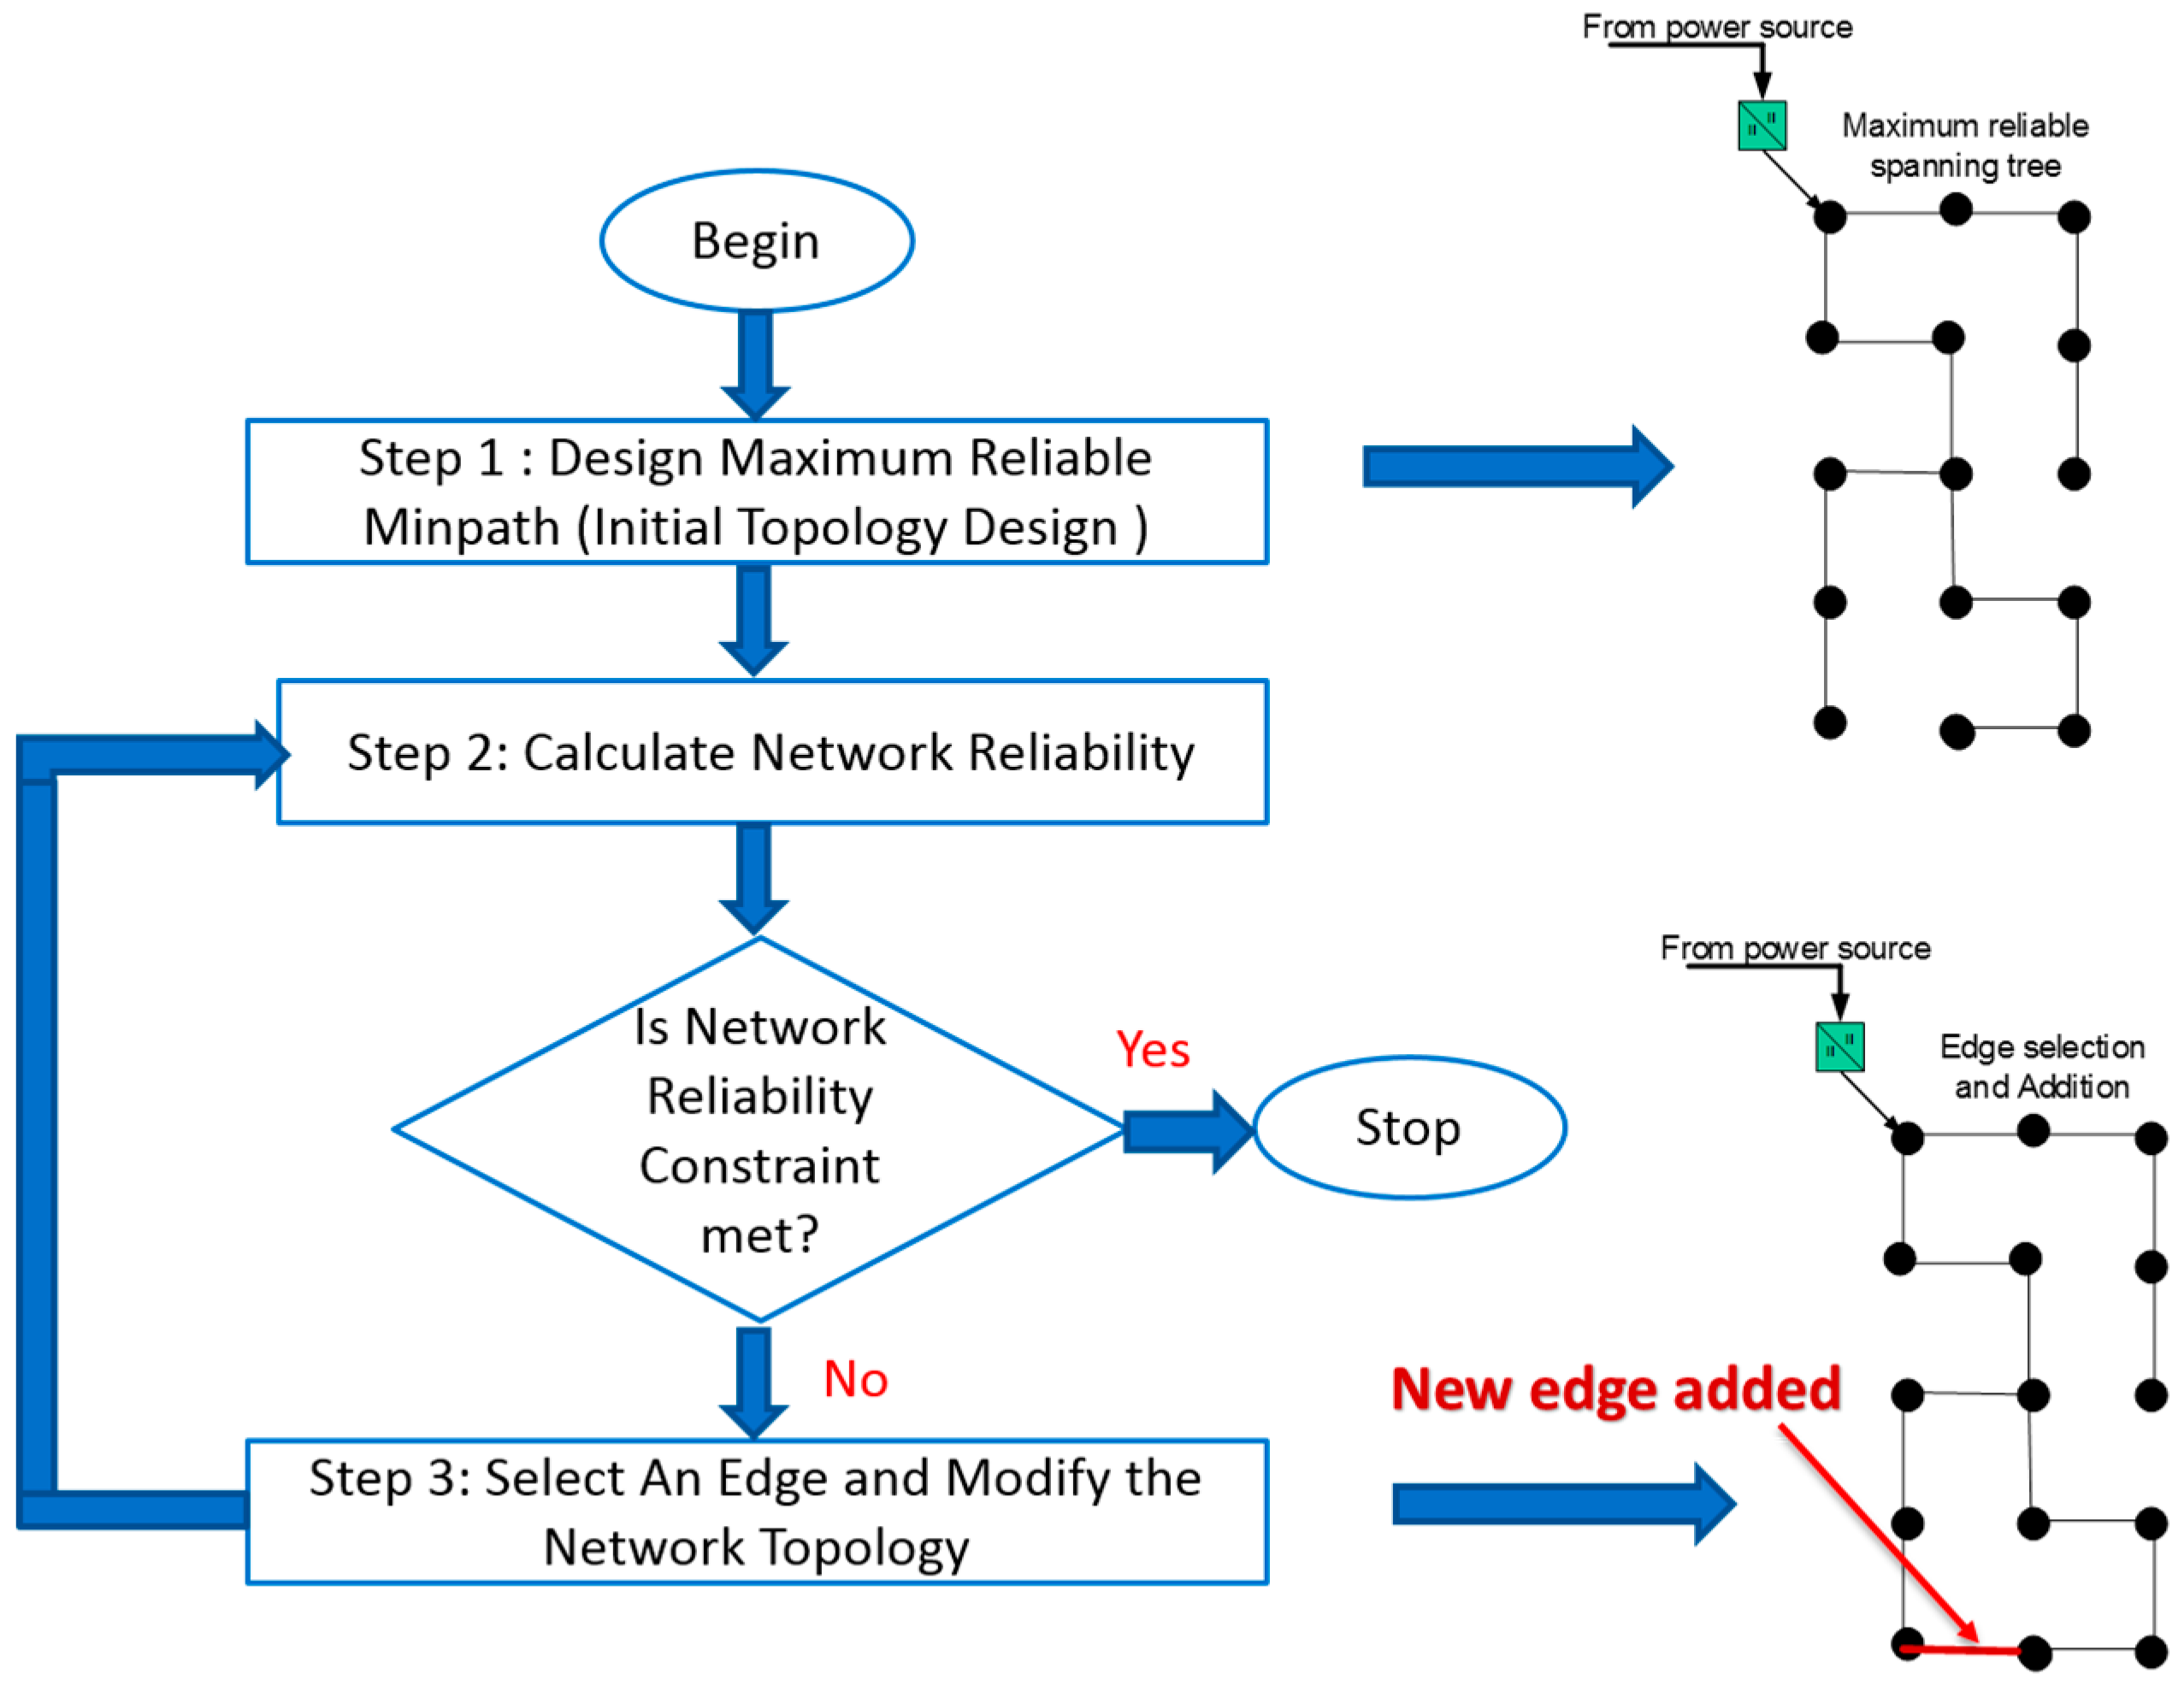
The algorithm aims to find an optimal network topology for the ZED in an electric ship power system. The problem formulation begins with a typical grid topology for a ZED system, with a load connected to every node and each load equally critical for a successful network operation. Clearly, the design economy is relatively higher for the complete grid network because of the multiple paths. The number of edges in the optimal circuit topology will be a subset of the edges in the original grid topology. The algorithm aims to find a minimal set of edges that ensures the desired network availability. The flowchart for the algorithm is shown in
Figure 5. The three steps are detailed below:
4.2.1. Initial Topology Design
The algorithm begins with identifying a spanning tree
of the graph
conferring the largest network availability. The problem of finding a maximum available tree is the same as finding a maximum cost spanning tree [
14]. A standard min-cost spanning tree algorithm is modified to generate a maximum reliable spanning tree
for the graph
4.2.2. Reliability Calculation
To make the reliability calculation further tractable, the standard inclusion-exclusion approach to the reliability calculation discussed in (2) is modified. The method of disjoint products [
15] is used, which makes events
(the event that all edges in minpath
are operational) disjoint. This modification makes the network reliability calculation recursive and thus computationally efficient.
4.2.3. Edge Selection and Addition
Once the connectivity constraint is met, the next step is to meet the reliability constraint. The edge selection algorithm selects an edge amongst the remaining edges that maximizes the network reliability. For this, all remaining edges are added one-by-one to the current network topology and the reliability of the modified topologies is computed. The reliability is computed using the recursive algorithm. The additional edge resulting in the largest reliability for the modified network topology is selected and added.
5. Results
The proposed methodology is applied to design a reliable shipboard power system for an all-electric ship. First, the results for designing reliable primary distribution system topology are detailed. The primary distribution system is designed using three notional topologies: ring bus, BAAH, and DBDB. The topologies are compared for equipment reliability indices and the number of protection devices. We conclude that the BAAH topology outperforms both ring bus and DBDB topologies and results in the least normalized overall service interruption rates. The reliability of BAAH topology, shown in
Figure 1, is further improved by obtaining an optimal equipment placement within the topology. The proposed PSO-based optimization approach, detailed in
Section 4.2, is used to obtain an optimal equipment placement. The results demonstrate that the modified BAAH results in better service reliability indices; the quantitative reliability improvement is, however, small. Finally, we present results for a ship’s zonal electric distribution (ZED) system. The proposed topology design algorithm is applied to design reliable topologies for a 15-node ZED system, supplied by single as well as multiple power sources.
5.1. Primary Distribution System—Comparing Shipboard Power System Reliability
The analysis is carried out for an SPS primary distribution system supplying for nine equipment loads using four generators, i.e., two main and two auxiliaries. The equipment loads supplied by the distribution circuit are as follows: radar, energy storage, pulsed load, port propulsion motor, starboard propulsion motor, and four zonal load centers. The selected SPS laid out in BAAH topology, with all its equipment loads, is shown in
Figure 1. In this analysis, SPS is simulated in two other notional topologies: ring bus and DBDB. The notional ring bus, BAAH, and DBDB shipboard distribution topologies are protected by 40, 51 and 58 circuit breakers, respectively. Each topology has the same number of loads, generators, and power converters, as well as the same level of redundancy in load connections [
12].
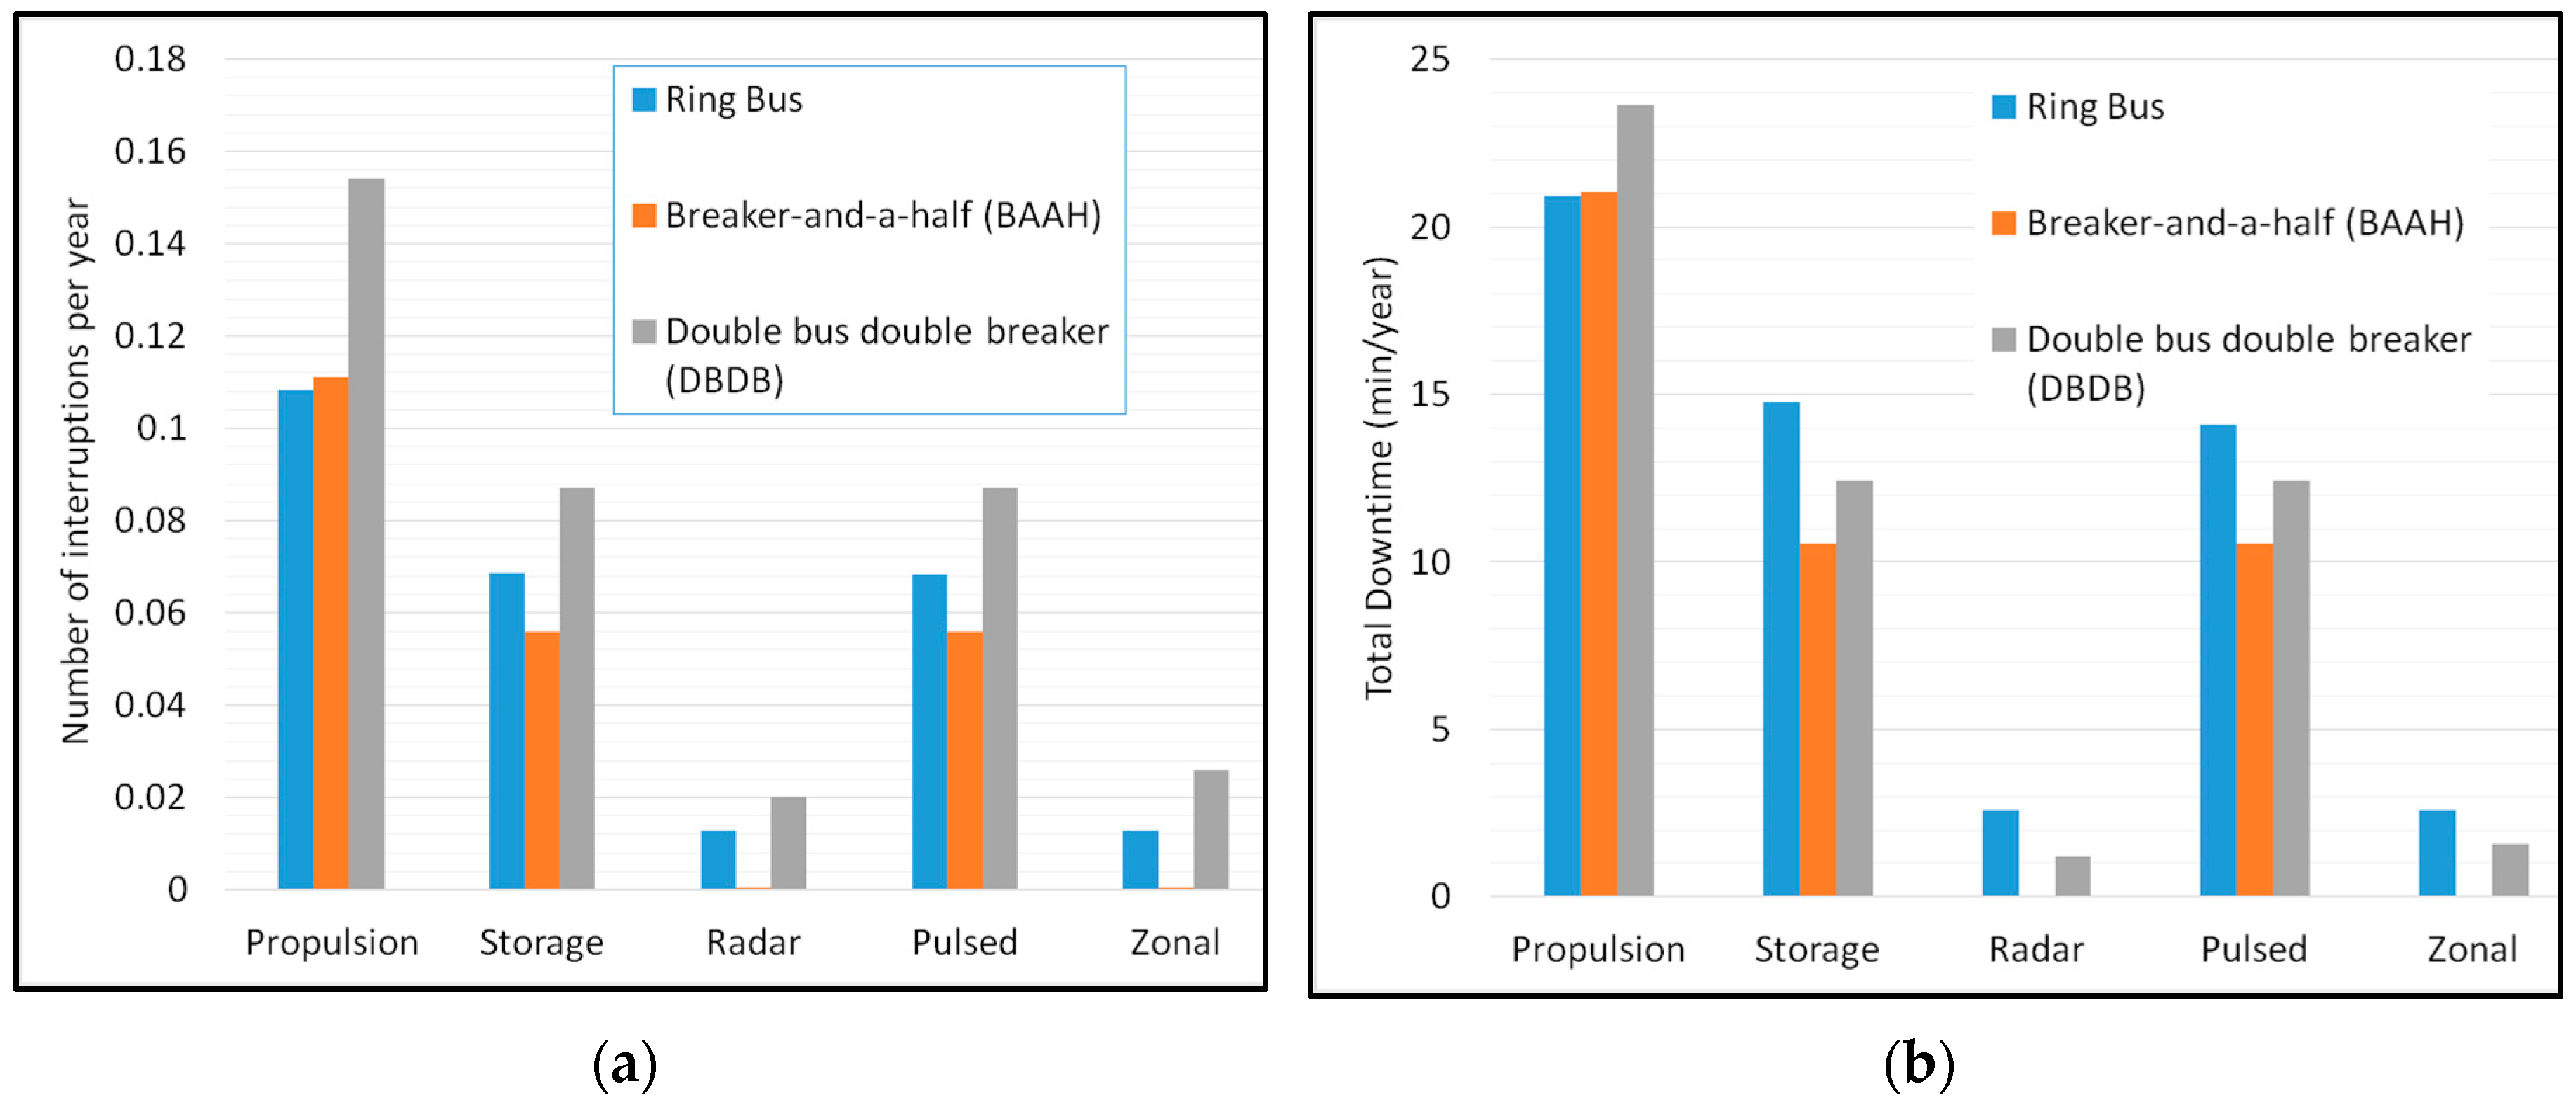
The service interruption rates obtained for each equipment system in each topology are compared in
Figure 6a. From the figure, the BAAH topology has a lower rate of an interruption than the other topologies for each equipment load except the propulsion system, where ring bus outperforms BAAH topology. Also, the DBDB topology results in a higher service interruption rate to every equipment load when compared with the other two topologies. The overall service interruption rates (
) are also calculated for each topology using (3), and
for the ring bus, BAAH, and DBDB topologies are 0.270778421, 0.22253151 and 0.37117996, respectively. For each topology, the total downtime per year for each equipment load is compared as well and shown in
Figure 6b. With the exception of propulsion system, BAAH topology performs better than the other two notional SPS topologies.
Based on the analysis, the BAAH topology is more reliable than the ring bus topology, but at the cost of requiring a higher number of circuit breakers. The increased reliability of BAAH topology could simply be the result of the increased number of circuit breakers. However, if this were the case, the DBDB topology, requiring an even larger number of circuit breakers, should be even more reliable. However, as can be seen in
Figure 6, DBDB topology is less reliable than both the ring bus and BAAH topologies. To make the reliability comparisons unbiased to the number of circuit breakers, we calculate the overall service interruption rates normalized against the number of breakers present in the system. The resulting normalized overall service interruption rates of the ring bus, BAAH, and DBDB topologies are equal to 0.00676946, 0.00436336 and 0.00639965, respectively. BAAH topology resulting in the least service interruption rate per breaker supports the notion that it confers higher reliability because of its topology.
5.2. Improving Reliability of Shipboard Primary Distribution System
In this section, we propose a method to improve the reliability of an SPS by optimally placing the equipment loads. The previous section concludes that BAAH topology confers higher reliability to equipment loads. Therefore, BAAH topology is selected to establish the relationship between system reliability and the relative placement of equipment loads and generators.
Using the equipment placement algorithm, a modified BAAH topology is obtained by optimally placing equipment loads and generators within the BAAH topology. The initial base case and the modified topology are shown in
Figure 1 and
Figure 7, respectively. In the modified configuration, the positions of main generator 1 and port propulsion are exchanged. Also, the pulsed load is moved to the other side of the bus tie breakers, exchanging places with of one of the auxiliary generators. The zonal load center 1 is now connected to slots 16 and 17, and the previous connection slots of zonal load center 4 (15 and 18) are replaced by a main and an auxiliary generator.
The reliability indices for the equipment loads supplied by the base case and optimized configuration are compared in
Table 2. It can be observed from the table that the service interruption rates and total downtime decrease for both propulsion and pulsed load. This is expected, as pulsed load and propulsion are weighted higher than the rest of the equipment loads while calculating the overall system interruption rate. For the same reason, the reliability indices of the energy storage remain unchanged between the two configurations. Also, the reliability indices for zonal load centers increase in the modified configuration. The zonal load centers are weighted lower in an overall system interruption rate computation. Therefore, their reliability is sacrificed to ensure a higher degree of reliability for the critical loads.
Contrary to expectation, the reliability indices for the radar, which was heavily weighted while calculating the overall system interruption rate, increase in the optimized configuration. This is because the interruption rate for radar in the base case is very small. Therefore, while optimizing for overall system interruption rate, the contribution of radar is not too significant in absolute terms. However, since the radar interruption rate was so low to begin with, the increase in reliability indices for radar in the optimized configuration results in a negligible increase of 0.097 s/year in radar’s total downtime.
5.3. Designing Reliable Distribution Circuit Topology for ZED System
A reliable operation of ship’s ZEDs is imperative for zonal load centers. As discussed before, the reliability of the network comes from the collective reliability of the network topology and thus the manner in which nodes are connected. To obtain a higher service reliability, we have proposed an approach (see
Section 4.2) to design an optimal circuit topology satisfying a given service availability requirement. The application of the proposed approach is demonstrated through designing topologies for a 15-node ZED supplied by both single and multiple power sources.
The proposed approach is applied to design optimal circuit topologies for a 15-node ZED subject to different network availability constraints
. We consider three cases for circuit design with required service availability greater than 0.98, 0.99 and 0.995.
Figure 8 shows the designed optimal circuit topologies using the proposed approach for each case. Using the proposed algorithm, we obtain a service availability greater than 0.98, 0.99, and 0.995, using only 16, 18, and 19 conductors, respectively. Note that a grid topology for 15-node ZED (see
Figure 1) requires 22 conductors. The resulting network availability for the grid topology is equal to 0.9982. This observation implies that the additional conductors in grid topology contribute lesser towards service availability. Therefore, the proposed approach is successful in designing reliable circuit topologies while using a lesser number of conductors. Please refer to [
28] for additional details and results.
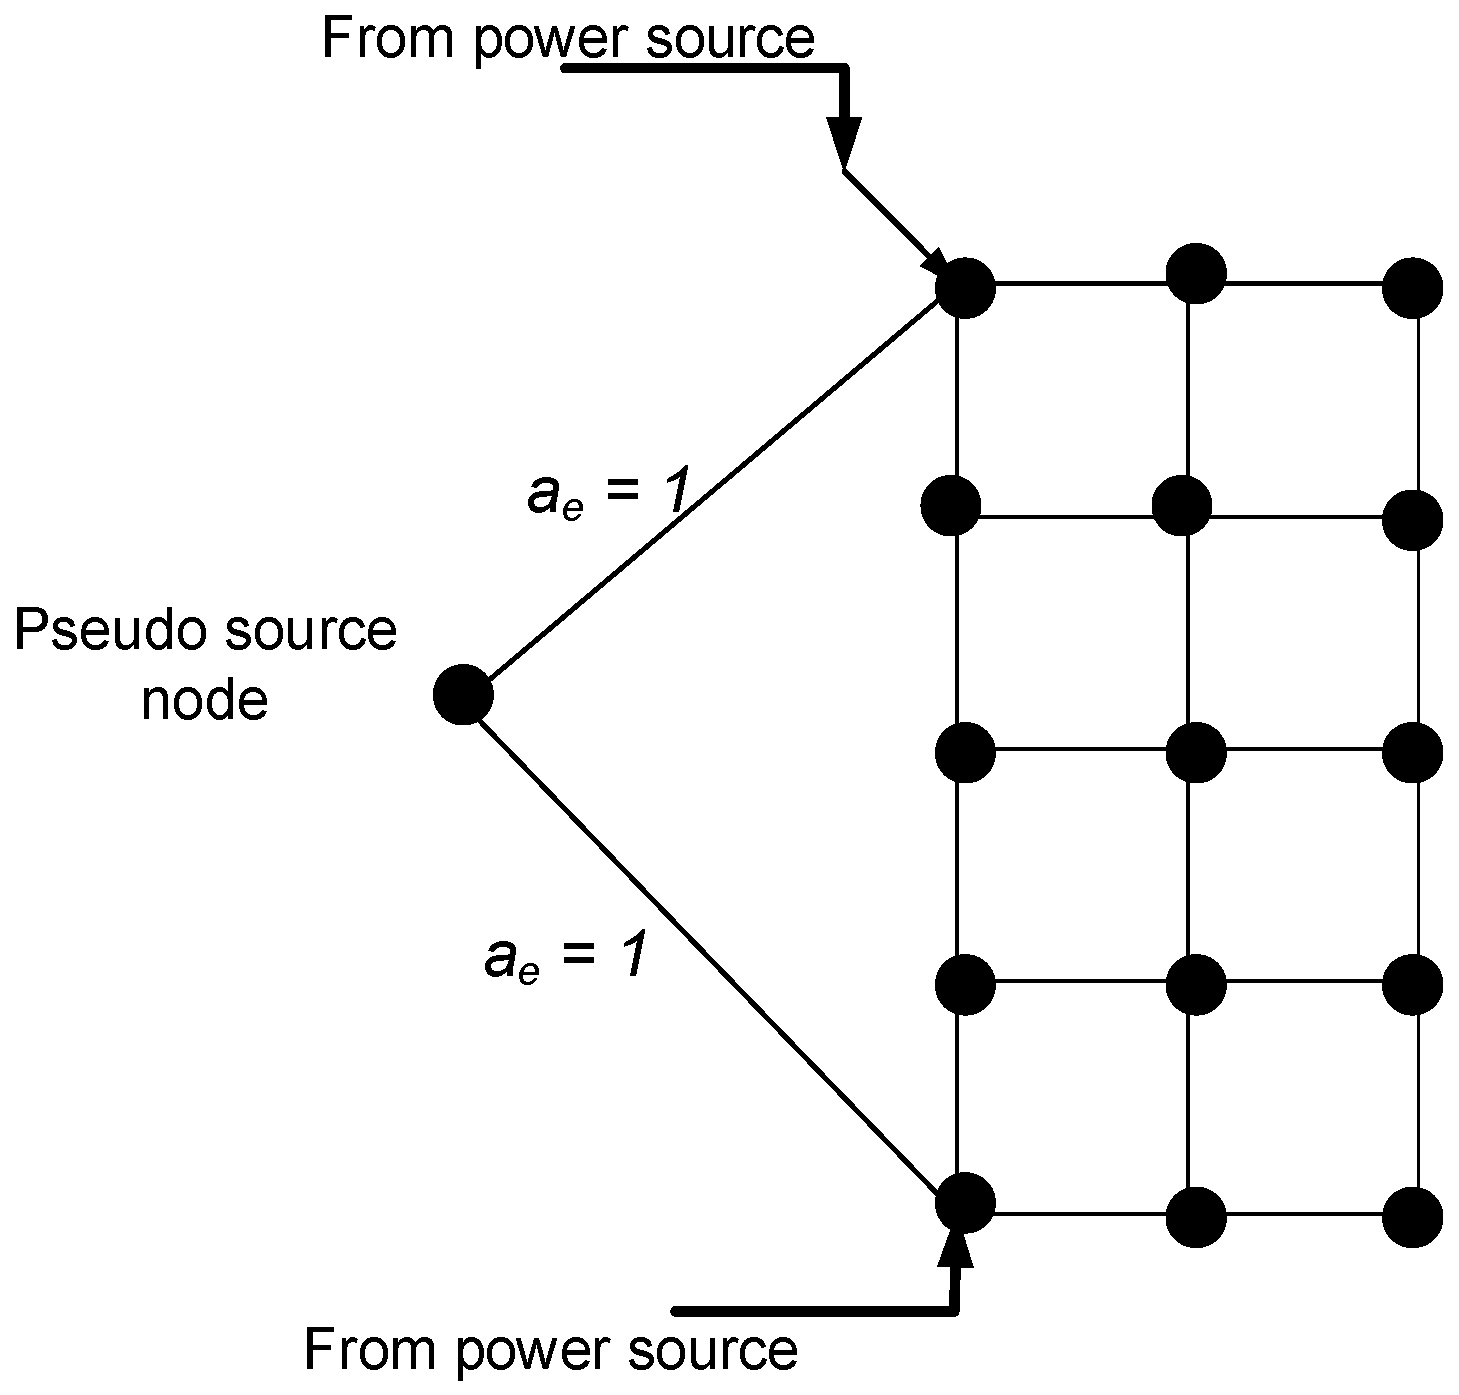
Generally, ZEDs in all-electric ships are connected at multiple points to the primary distribution circuit; thus, they are effectively supplied by multiple power sources. A 15-node circuit laid out in a grid topology and connected at two different points to the primary distribution circuit is shown in
Figure 9. Multiple sources are included in the proposed topology design approach by adding a pseudo source node, which is connected to each source supplying the circuit, as shown in
Figure 9. The power sources are assumed to be 100% available, and the edges connecting the pseudo source node and the source nodes in
have availability,
.
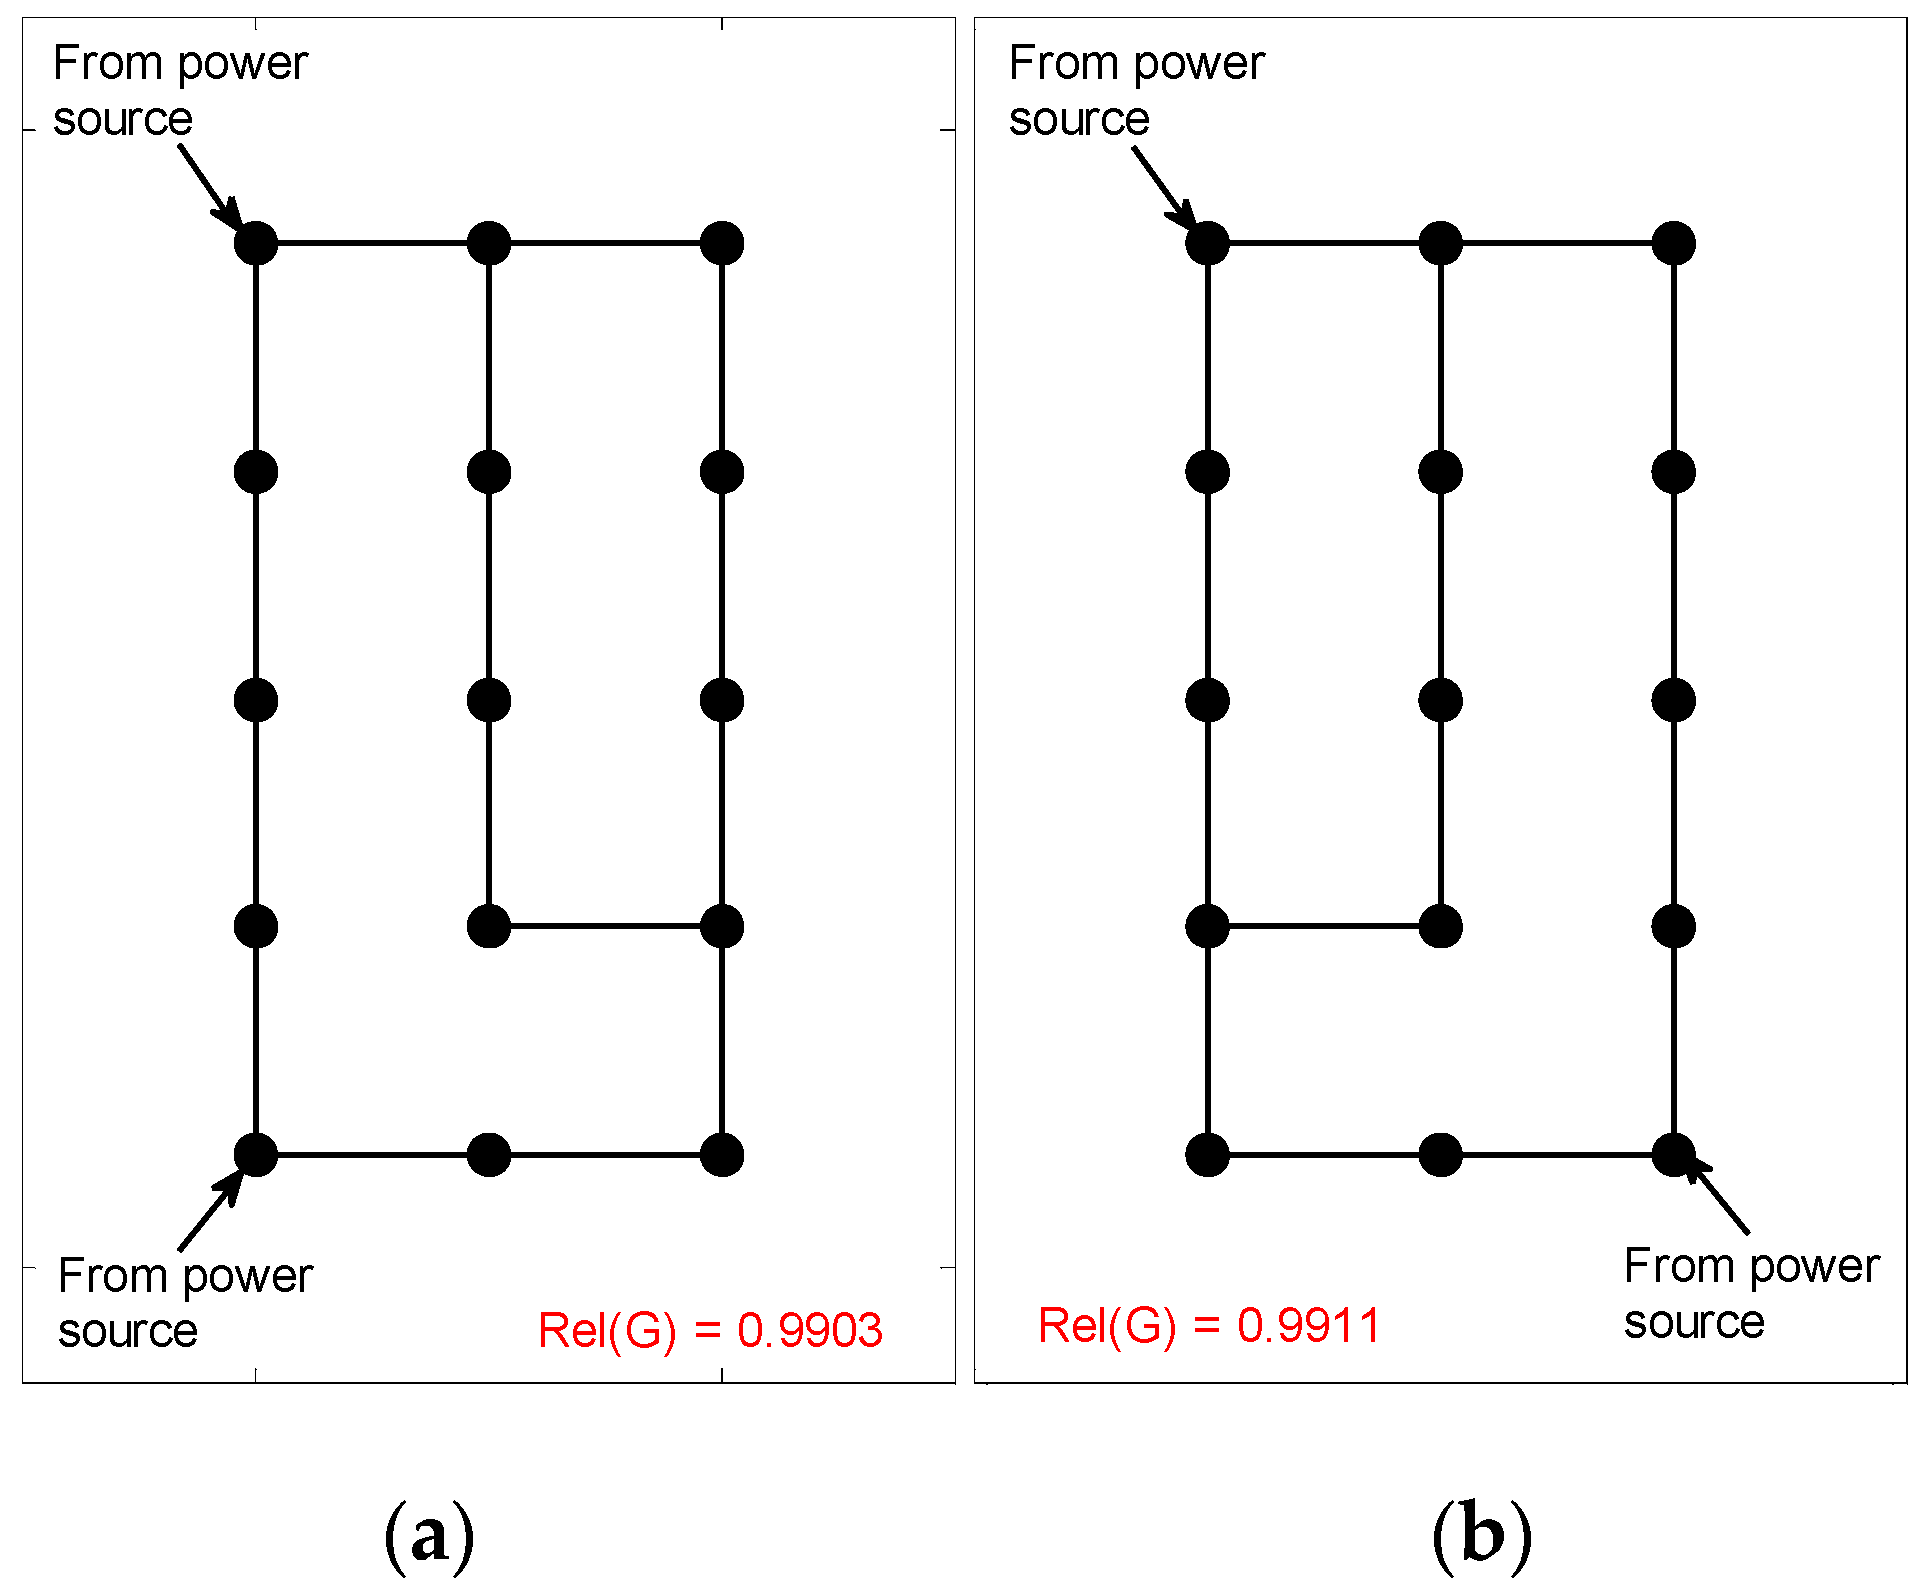
We test the proposed modification by designing resilient circuit topologies for the 15-node system with two power sources. The designed topology should have network availability greater than 0.99. The circuit topologies designed for the distribution circuits supplied by two power sources are shown in
Figure 10. Both designed circuits are using 16 conductors and provide a network availability greater than 0.99. Note that for the same distribution circuit supplied by only one power source, the designed topology using 16 conductors result in network availability equal to 0.97. It is observed that as we increase the number of power sources connected to the circuit, the required number of conductors to achieve a given network availability index decreases. Furthermore, we observe that network availability also depends on the location of power sources. The network availability of the circuit shown in
Figure 10b is greater than that of
Figure 10a only because of the difference in the location of the power sources.
6. Discussion
This paper presents an approach to designing SPS architectures satisfying a given service reliability requirement. The proposed approach is based on designing a two-level distribution system topology: the primary distribution system, and the secondary/zonal electric distribution (ZED) system. Note that a ship’s primary distribution system and ZED system are analogous to terrestrial primary and secondary distribution systems. Methods are proposed to improve system reliability by (1) the choice of circuit topology, (2) optimal equipment placement, and (3) by designing optimal reliable circuit topologies. The recommendations derived from the analysis are detailed separately for a ship’s primary and zonal distribution systems in the following sections.
6.1. Designing Reliable Primary Distribution System for Shipboard Power System
As for the primary distribution system, the analysis concludes that the reliability of the system is fundamentally linked to (1) higher-level topology of its design, and (2) relative location of equipment loads and generation. The breaker-and-a-half (BAAH) topology was shown to be the most reliable of the commonly used distribution system designs, outperforming both the ring bus and double bus double breaker topologies. The normalized overall service interruption rates per circuit breaker obtained for the ring bus, BAAH, and DBDB topologies are equal to 0.00676946, 0.00436336, and 0.00639965, respectively. BAAH topology resulting in the least service interruption rate per breaker implies it confers greater reliability per component.
We obtain an optimized BAAH topology by optimally placing the equipment loads using the PSO algorithm. The overall interruption rate of the optimized configuration, shown in
Figure 7, is 0.221326453, compared to the base case (
Figure 1) where the value is 0.22253151. The overall system interruption rate decreases by 0.54%. Therefore, the SPS reliability can be further improved through an optimized placement of equipment loads within a given topology. Note that the reliability gains obtained through optimal equipment placement are relatively small when compared to the choice of overall topology. The changes in equipment placement are, however, easier and less costly to implement than changing the system topology. Also, placement choices do not affect the number of distribution system components, as can be the case with choices of system topology. Moreover, the small improvements conferred by the modified configuration suggest that the base configuration was close to optimal. This is because the ship design in
Figure 1 is iteratively developed by the teams of engineers considering reliability as an important, if not rigorously quantified, concern [
12].
It should be noted that the proposed optimal equipment placement approach is applicable to any SPS topology, and also to any distribution system where service reliability is of primary concern. The algorithm allows modifying the overall reliability index by prioritizing the reliability of specific equipment or a group of equipment loads. This feature is expected to prove valuable in designing systems serving a wide variety of loads as, for example, a microgrid.
6.2. Designing Reliable Zonal Electric Distribution (ZED) System for Shipboard Power System
As for the ship’s zonal distribution system, we develop a novel mathematical formulation and an efficient graph-theory based algorithm for the design of a resilient distribution circuit topology while satisfying a given network availability requirement. The proposed approach aims to design distribution system topology for a desired network reliability/availability measure while using a minimum number of conductors. The service reliability of ZED systems is quantified in terms of network availability, which is defined as the steady-state probability of a network being in the operational state. For a high level of service availability, the ship’s ZED system is designed in a grid topology. Using the proposed approach, a ZED topology using a lower number of conductors can be designed which can provide the desired level of network availability.
The proposed algorithm, termed successive minpath generation, is tested and validated using distribution circuits supplied by single as well as multiple power sources. The results confirm that the proposed algorithm is significantly efficient in designing resilient circuit topologies. Furthermore, it is also demonstrated that the algorithm maximizes the number of operational paths at each iteration, therefore resulting in the maximum possible improvement in network availability at that iteration [
28]. By optimizing the distribution circuit topology, the proposed approach presents a new perspective on the general distribution circuit design problem. The designed circuit topology can be further optimized for additional service requirements (capacity, voltage regulation, etc.), thus prioritizing service continuity as the distribution circuit design objective.
Note that service availability is defined as the steady state probability that a given network is operational. In the context of the distribution circuit design problem, the selected distribution circuit is assumed to be operational if there is a path from the source to each load node. The availability as defined in this work is not contingent upon the reliability of the protection equipment. Instead, the availability solely depends on the circuit topology and the availability of the feeders. Additionally, it is assumed that as soon as the fault occurs in the feeder, the faulty feeder is isolated, and the rest of the circuit operates normally.
It should be noted that while designing distribution systems, several other requirements, including feeder voltage class, cable type, capacity, impedance, etc. need to be satisfied. The circuit design problem satisfying all these objectives is complex. Therefore, by prioritizing the requirements, the design problem is broken down into several smaller optimization problems. The design begins with the selection of a distribution circuit topology (radial, loop or grid). Next, an optimal distribution circuit is designed to satisfy different service requirements such as the ability to efficiently serve the load demand, minimize the circuit losses, maximize operational economy, etc. In the end, to ensure circuit reliability and service continuity, a protection system is designed for the distribution circuit. Therefore, in a traditional distribution circuit design approach, a reliable service operation is achieved using the protection system. This work, however, prioritizes improved service availability as the distribution circuit design objective. Note that additional service requirements such as system losses, equipment reliability, and other operational requirements can be satisfied on the designed reliable circuit topology.
7. Conclusions
In conclusion, the distribution system reliability can be optimized through the choice of overall topology and the placement of equipment within the topology. The BAAH topology was shown to be the most reliable of the commonly used distribution system designs, outperforming both the ring bus and DBDB topologies. Moreover, the results for the equipment placement algorithm prove that further gains in reliability can be achieved by optimally placing equipment loads within a distribution system topology. These gains are relatively small compared to those that are achieved through choice of overall topology, but changes in equipment placement are easier and less costly design choices to implement than modifying the system topology. Placement choices also do not affect the number of required distribution system components, as can be the case with choices of system topology.
As for ZED system, we developed a novel mathematical formulation and an efficient graph theory-based algorithm for the design of an optimal distribution circuit topology, while satisfying a given service reliability requirement. The proposed algorithm, termed as successive minpath generation, is tested and validated using an example 15-node ZED system. The results confirm that the proposed algorithm is significantly efficient in designing optimal circuit topologies. Furthermore, it is also demonstrated that the algorithm maximizes the number of operational paths at each iteration, therefore resulting in a maximum possible improvement in service reliability at a particular iteration. Finally, by simultaneously considering the reliability requirements of ship’s primary and zonal systems, this paper presents a useful framework for designing reliable SPS architectures.


