Numerical Analysis of CNC Milling Chatter Using Embedded Miniature MEMS Microphone Array System

1
Master’s Program of Electro-Acoustics, Feng Chia University, Taichung 40724, Taiwan
2
Bachelor’s Program in Precision System Design, Feng Chia University, Taichung 40724, Taiwan
*
Author to whom correspondence should be addressed.
Inventions 2018, 3(1), 5; https://doi.org/10.3390/inventions3010005
Submission received: 22 November 2017
/
Revised: 11 January 2018
/
Accepted: 12 January 2018
/
Published: 16 January 2018
(This article belongs to the Special Issue Selected Papers from ICI2017 and Spintech Thesis Awards)
Abstract
:With the increasingly common use of industrial automation for mass production, there are many computer numerical control (CNC) machine tools that require the collection of data from intelligent sensors in order to analyze their processing quality. In general, for high speed rotating machines, an accelerometer can be attached on the spindle to collect the data from the detected vibration of the CNC. However, due to their cost, accelerometers have not been widely adopted for use with typical CNC machine tools. This study sought to develop an embedded miniature MEMS microphone array system (Radius 5.25 cm, 8 channels) to discover the vibration source of the CNC from spatial phase array processing. The proposed method utilizes voice activity detection (VAD) to distinguish between the presence and absence of abnormal noise in the pre-stage, and utilizes the traditional direction of arrival method (DOA) via multiple signal classification (MUSIC) to isolate the spatial orientation of the noise source in post-processing. In the numerical simulation, the non-interfering noise source location is calibrated in the anechoic chamber, and is tested with real milling processing in the milling machine. As this results in a high background noise level, the vibration sound source is more accurate in the presented energy gradation graphs as compared to the traditional MUSIC method.
1. Introduction
In recent years, industrial exhibitions have presented the latest measuring instruments and systems for Industry 4.0, including those in the area of electronic acoustics. Due to their wide variety of frequency responses and their use in huge environmental spaces, microphone arrays have continuously been applied in new ways, allowing for novel uses of a relatively old technology. In the past, the central processing unit (CPU) speed of electronic acoustic digital sensors was slow and inaccurate, while analog sensors, which required large and bulky equipment, were expensive. With the semiconductor industry booming in recent years, however, CPU processing has become cheaper and faster, allowing digital sensors to be modularized easily. Step by step, the application of digital signal processing (DSP) has allowed various hardware restrictions to be overcome, making it possible to equip digital sensors with various advantages, such as microminiaturization, heavy computing power, precision, and high processing speed. DSP can be applied on the industry automation production line.
The improvement of computer numerical control (CNCs) has recently focused on providing automated and user-friendly measurements, which requires the use of a sensor or sensors to collect data regarding unstable conditions when cutting. During the operation of intelligent CNCs, lots of unsteady flutters appear, and these flutters result from the vibration of the end mill. If the end mill passes through the cut surface again, the cut will go deeper and deeper, and eventually, the CNC will break down. In this way, bad milling processing will result. In order to solve this processing problem, an accelerometer can be attached to the spindle to collect data regarding the detected vibration of the CNC. However, chatter usually occurs between the end mill and the workpiece, and it is difficult to attach an accelerometer on the milling surface. Simultaneously, the noise will combine with the milling chatter [1,2,3]. In light of these issues, in this study, we used an embedded MEMS microphone array system as a means of applying acoustic localization estimation to intelligent CNCs [4].
Early research into the technique of using sensor arrays to identify the direction of arrival (DOA) [5] involved the use of such arrays in high-frequency radar systems. This approach can estimate the direction of a source according to the power and phase of the signal. Recently, this technique has usually been used with microphone arrays to estimate the audible band of a sound source. There are three kinds of estimation of source. The first kind usually uses the DOA to locate the source direction. In this approach, the specific direction energy is strengthened by the beamforming of the DOA method in the time domain, which can be accomplished using the steer beamformer and delay-and-sum (DAS) methods. The second kind is the time difference of arrival (TDOA) approach [6]. Usually, this approach involves the combined use of a couple of microphones and utilizes the direction and angle relation between the source and the microphones to estimate the source’s location. The third kind consists of using the least-squares (LS) method and cross correlation (CC) to calculate the relation between two signals from a microphone. This approach must be used in a steady environment and must be conducted via digital signal processing in a noisy environment. Therefore, it is proposed that the generalized cross correlation (GCC) [7] and the time-domain phase transform generalized cross correlation (GCC-PHAT) [8] be used in this complex situation.
The proposed method consists of processing the orthogonal relationship of eigenvectors from multiple signals in order to estimate the direction of the source. The current study also used the multiple signal classification (MUSIC) algorithm [9,10,11] to estimate the sound source. The precision of direction estimation when using the eigenstructure method will be affected by the noise of the surrounding environment. Previous studies [12,13,14,15] have shown that voice activity detection (VAD) has already been used for many years to implement noise cancellation for voice signals. In this study, we propose the voice activity detection (VAD) method to subtract the non-sound source signal energy and eliminate the unsteady noise in the spectrum. After the VAD process, the MUSIC algorithm is used to estimate the sound location. The simulation results of this study are based on the CNC milling chatter signal in a high frequency region with simulated noise. The results are validated with numerical simulation and tested by carrying out real milling processing in the CNC machine.
2. Method Description
VAD has already been used for many years to implement noise cancellation for voice signals, and it is also highly suitable for one-dimensional blind signals that contain noise elements. As described in the introduction section, the objective of this study was to use VAD to separate noise and target signals and eliminate the noise in the spectrum, after which the pure signals were input into the sound source location to carry out calculations using an estimation algorithm, thereby identifying the effective sound source location. The primary method utilized in this study was the robust VAD method proposed by Sohn [15]. The method can be expressed using the equation
where is the frequency domain signal obtained through the Fourier transform. is the clean signal vector obtained from the m microphones, is the vector corresponding to the noise detected by each microphone. Using a Gaussian statistical model, the following two hypothesis functions are obtained
and
and are the variances for the target signal and noise signal. By rearranging Equations (1)–(3), the likelihood coefficient at the frequency point can be expressed as
in which and are the signal-to-noise ratio (SNR) coefficients of the a priori and a posteriori signals, respectively. Therefore, after obtaining the logarithm of , an attempt is made to maximize the SNR coefficient of the priori signal α, and the Itakura–Saito method can be used to derive the objective function as
then, using the Newton’s method iteration, we obtain the equation
where is the iteration number and is a small iteration step . By using the least square method or repeated iteration to solve Equation (6), Equation (5) can be minimized to allow for α and β to be substituted into Equations (2) and (3), through which the target signal and noise signal values can be obtained. By applying the inverse Fourier transform, these values can be converted to the time domain signal X(t). Then, the MUSIC algorithm is applied to obtain the estimated value of DOA [16] from the following estimation of the covariance matrix R(X),
where is the strength of the microphone signal, The next step is to carry out eigenvalue decomposition (EVD), and the relevant equation can be written as
The spherical coordinates of the sound source locations can be defined by the spatial spectrum as
when matrix B is orthogonal with respect to each column of V, the eigenvalue and eigenvector can be solved by . If , the eigenvector indicates the presence of existence noise, and the denominator of Equation (9) is not zero. The peak value of can be determined by changing the values of of Equation (9).
3. Results and Discussion
3.1. System Setup
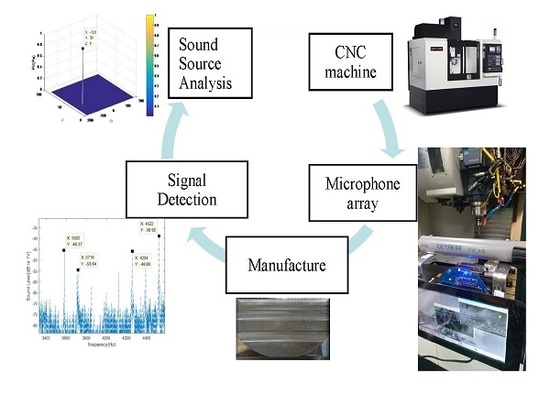
This study proposed an embedded system architecture consisting of three parts. First, the microphone array system was created and fixed in a stable manner to the hardware. The signal was then recorded by beamforming with an embedded system, as shown in Figure 1. Second, file transfer protocol (FTP) wireless transmission was used to transfer the data to a personal computer (PC) for analysis. Third, after the noise cancelling calculation and source estimation were conducted in the post-processing, the signal was then shown in the presented energy gradation graphs. The signals of the microphone array were collected by Xilinx Field-Programmable Gate Array (FPGA), which allowed the data from the array to approach synchronous transmission. The structure of proposed method is shown in the Figure 2.
3.2. Comparison Results
In the first test, we use the MUSIC algorithm to estimate the different azimuths and elevation angles of the CNC milling sound source. The three different spherical coordinates of the 1 kHz sound source locations are defined as , , and . The results for the sound sources are shown in Figure 3a–c. It is observed that the results show the accurate location of sound sources as a peak in each figure.
For the next validation case, the source estimation of the circumstances of the CNC milling chatter concerns multi-tone simulation. The settings of the CNC milling operation are shown in Table 1, including four different combinations of spindle speed, depth of cut and feed rate. The related results of the spectrum analysis are shown in Figure 4a–d. The results of the resonance frequencies indicate that the different circumstances of CNC milling chatter are observed in the high frequency range of 3.4–4.5 kHz. The results in Figure 4a–d show that the peak intervals of the resonance frequency are almost consistently separated by 134 Hz.
Based on the frequency domain results in Figure 4d, we use the time domain signal with additive noise from different SNRs as 12, 6, and 0 dB (as shown in Figure 5a–c), so as to evaluate the performance of CNC milling sound source estimation as and to compare the original MUSIC and VAD-MUSIC approaches. As indicated in Figure 6a–c, the original MUSIC approach yields unstable results as the energy of the white noise is increased. After the energy level was increased, the sound source locations obtained by the highest peak for SNR = 12, 6, and 0 dB corresponded to , , and in Figure 6a–c, respectively. It is also observed that the results of the original MUSIC approach become rough around the other error peak estimations in Figure 6c. These results clearly indicate that accuracy became lower in Figure 6c due to the decrease of the SNR value. In contrast, for the results in Figure 6d–f, the estimation approach showed clear and accurate results when the VAD-MUSIC algorithm was used. There are no error peak estimations in the various peaks, which indicates that the VAD-MUSIC algorithm can account for the interruption of stationary sound that is similar to white noise.
4. Conclusions
In this study, an algorithm utilizing both the VAD and MUSIC methods for the noise location estimation of CNC milling chatter is proposed. The results in different SNR cases show that the proposed method is highly accurate at detecting CNC milling chatter locations when the SNR is high. In the future, we are going to incorporate the VAD-MUSIC algorithm into embedded microphone array systems to enable the practical detection of the sources of CNC milling chatter during real time processing.
Acknowledgments
The authors would like to thank the Ministry of Science and Technology of Taiwan for its financial support specified under contract nos. MOST 105-2221-E-035-034-, MOST 106-2221-E-035-051-, MOST 106-2218-E-035-011-, and MOST 105-2511-S-035-012-MY3.
Author Contributions
Pang-Li Wang conceived and designed the experiments; Pang-Li Wang performed the experiments; Pang-Li Wang analyzed the data; Yu-Ting Tsai contributed analysis tools; Pang-Li Wang and Yu-Ting Tsai wrote the paper.
Conflicts of Interest
The authors declare no conflict of interest.
References
- Liu, Y.; Liu, Z. Development of Constrained Layer Damping Toolholder to Improve Chatter Stability in End Milling. Int. J. Mech. Sci. 2016, 117, 299–308. [Google Scholar] [CrossRef]
- George, W. Analysis of Tool Wear Effect on Chatter Stability in Turning. Int. J. Mech. Sci. 1995, 37, 391–404. [Google Scholar]
- Rafal, R.; Pawel, L. Chatter Identification Methods on the Basis of Time Series Measured During Titanium Superalloy Milling. Int. J. Mech. Sci. 2015, 99, 196–207. [Google Scholar] [CrossRef]
- Crocco, M.; Martelli, S. Audio Tracking in Noisy Environments by Acoustic Map and Spectral Signature. IEEE Trans. Cybern. 2017. [Google Scholar] [CrossRef] [PubMed]
- Tuncer, E.; Friedlander, B. Classical and Modern Direction of Arrival Estimation; Elsevier: Burlington, MA, USA, 2009. [Google Scholar]
- Ho, K.H.; Chan, Y.T. Solution and Performance Analysis of Geolocation by TDOA. IEEE Trans. Aerosp. Electron. Syst. 1993, 29, 1311–1322. [Google Scholar] [CrossRef]
- Knapp, C.H.; Carter, G.C. The Generalized Correlation Method for Estimation of Time Delay. IEEE Trans. Acoust. Speech Signal Process. 1976, 24, 320–327. [Google Scholar] [CrossRef]
- Den Broeck, B.V.; Bertrand, A. Time-Domain Generalized Cross Correlation Phase Transform Sound Source Localization for Small Microphone Arrays. In Proceedings of the 2012 5th European DSP Education and Research Conference (EDERC), Amsterdam, The Netherlands, 13–14 September 2012. [Google Scholar]
- Mathews, C.P.; Zoltowski, M.D. Eigenstructure Techniques for 2-D Angle Estimation with Uniform Circular Arrays. IEEE Trans. Signal Process. 1994, 42, 2395–2407. [Google Scholar] [CrossRef]
- Stoica, P.; Nehorai, A. MUSIC Maximum Likelihood and Cramer-Rao Bound. IEEE Trans. Acoust. Speech Signal Process. 1989, 37, 720–741. [Google Scholar] [CrossRef]
- Lee, H.B.; Wengrovitz, M.S. Resolution Threshold Beamspace MUSIC for Two Closely Spaced Emitters. IEEE Trans. Acoust. Speech Signal Process. 1990, 38, 723–738. [Google Scholar] [CrossRef]
- Ephraim, Y.; Malah, D. Speech Enhancement Using a Minimum Mean-Square Error Short-Time Spectral Amplitude Estimator. IEEE Trans. Acoust. Speech Signal Process. 1984, 32, 1109–1121. [Google Scholar] [CrossRef]
- Ephraim, Y.; Malah, D. Speech Enhancement Using a Minimum Mean-Square Error Log-Spectral Amplitude Estimator. IEEE Trans. Acoust. Speech Signal Process. 1985, 33, 443–445. [Google Scholar] [CrossRef]
- Sohn, J. A Statistical Model-Based Voice Activity Detection. IEEE Signal Process. Lett. 1999, 6, 1–3. [Google Scholar] [CrossRef]
- Cappe, O. Elimination of the Musical Noise Phenomenon with the Ephraim and Malah Noise Suppressor. IEEE Trans. Speech Audio Process. 1994, 2, 345–349. [Google Scholar] [CrossRef]
- Honghao, T. DOA Estimation Based on MUSIC Algorithm; Institutionen för Fysik och Elektroteknik: Kalmar, Sweden, 2014. [Google Scholar]
Figure 1.
The measurement system setup and numerical analysis process.
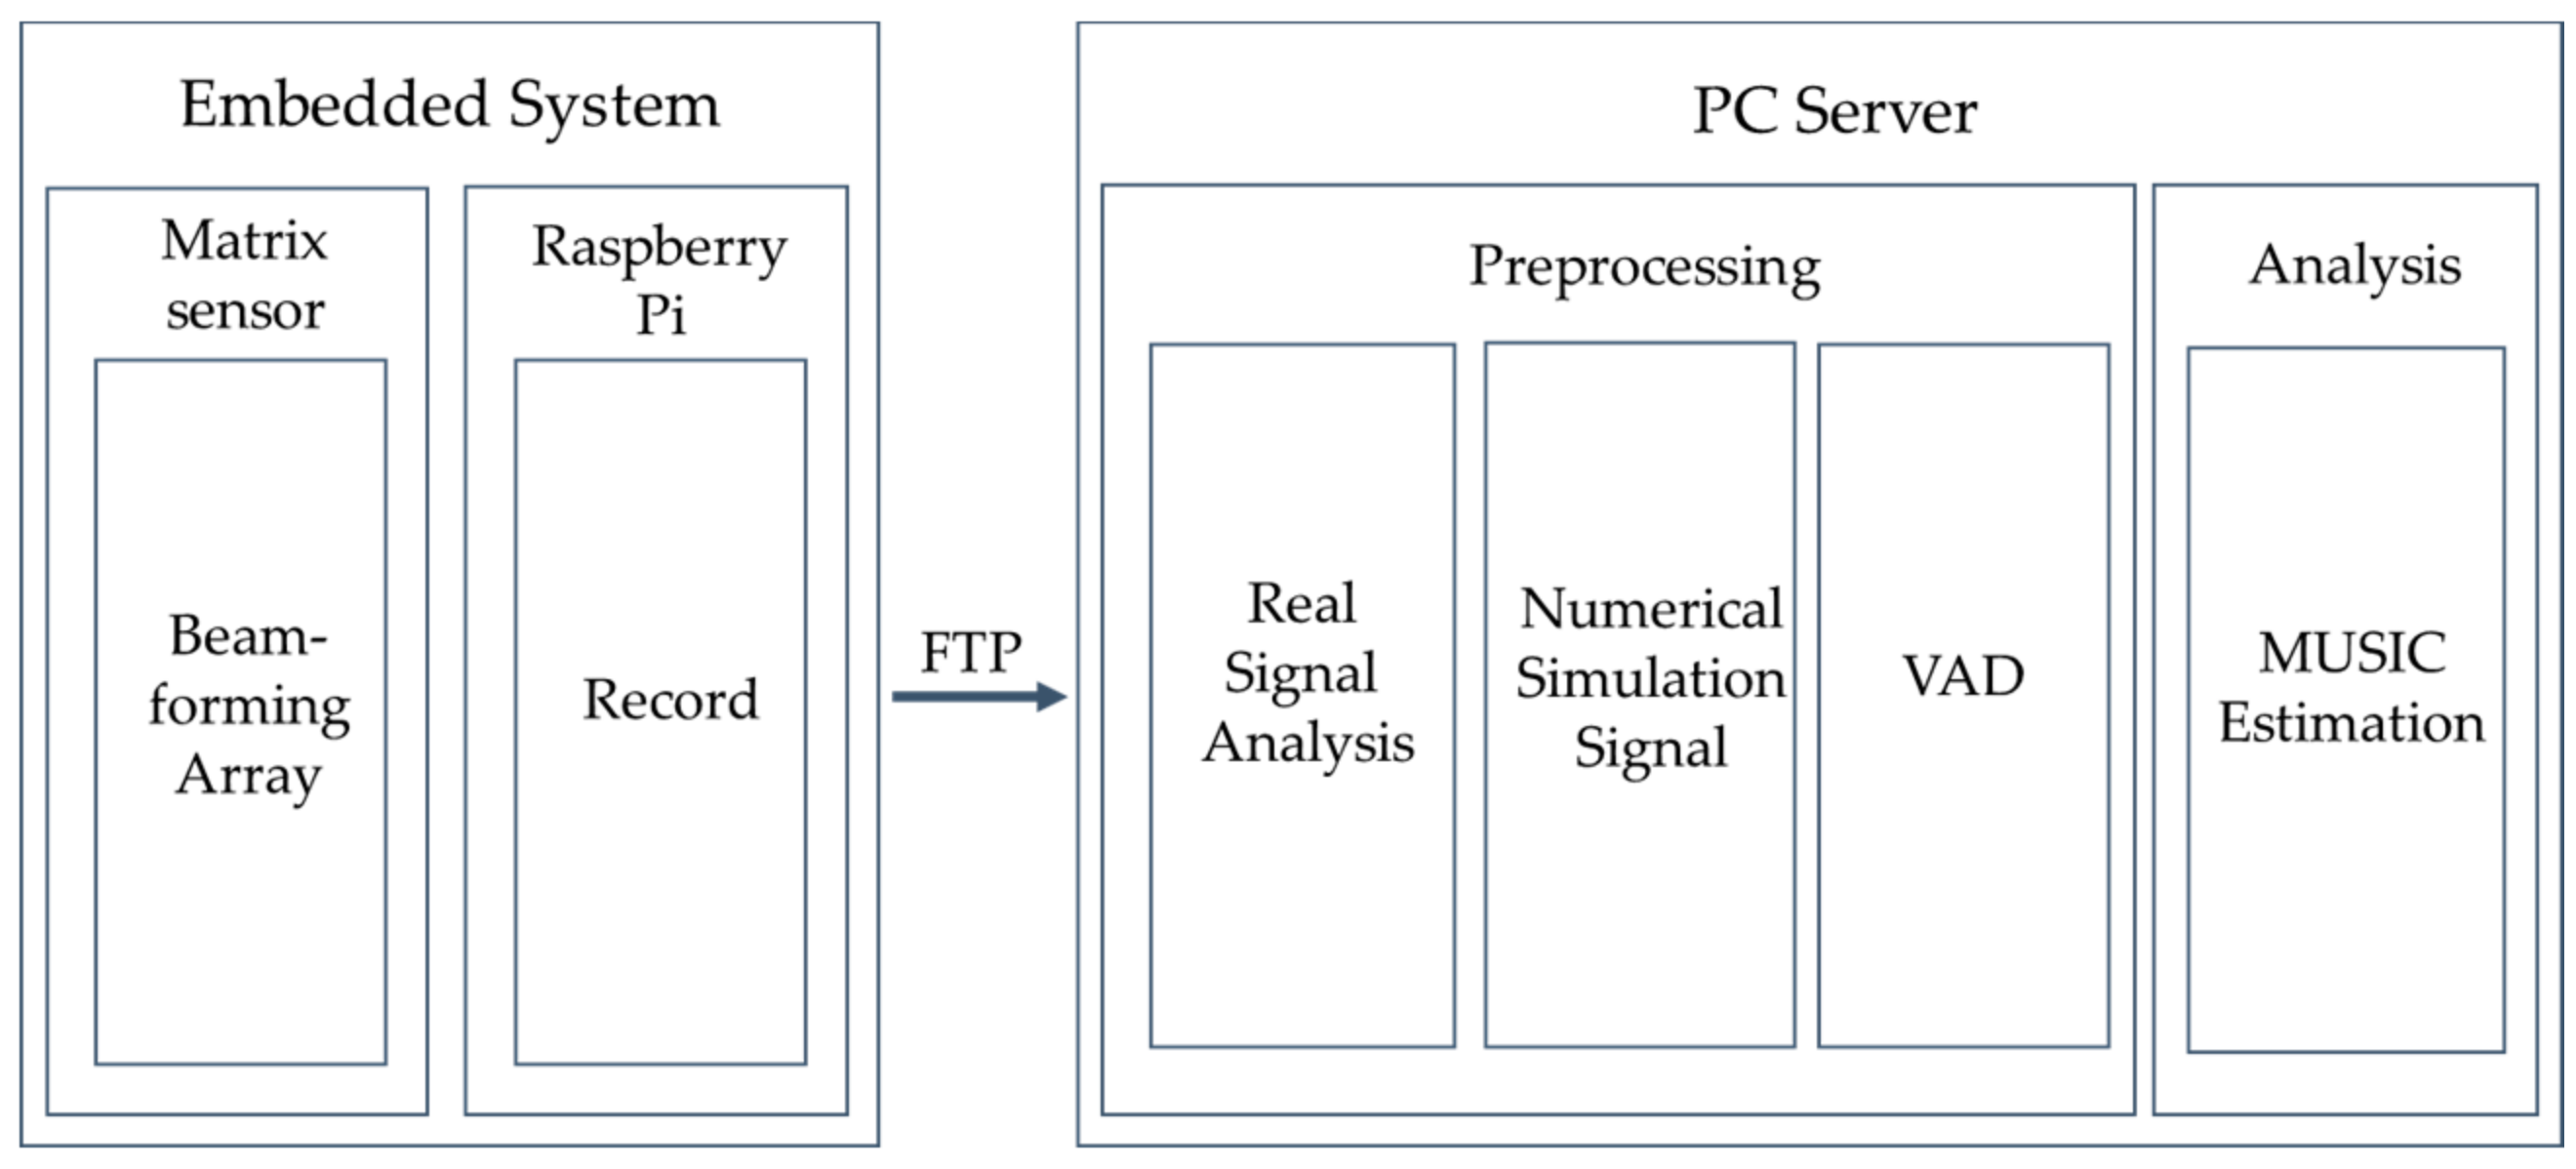
Figure 2.
The structure of the proposed method for noise reduction of source direction estimation.

Figure 3.
The spherical coordinates of 1 kHz sound source locations: (a) ; (b) ; (c) .
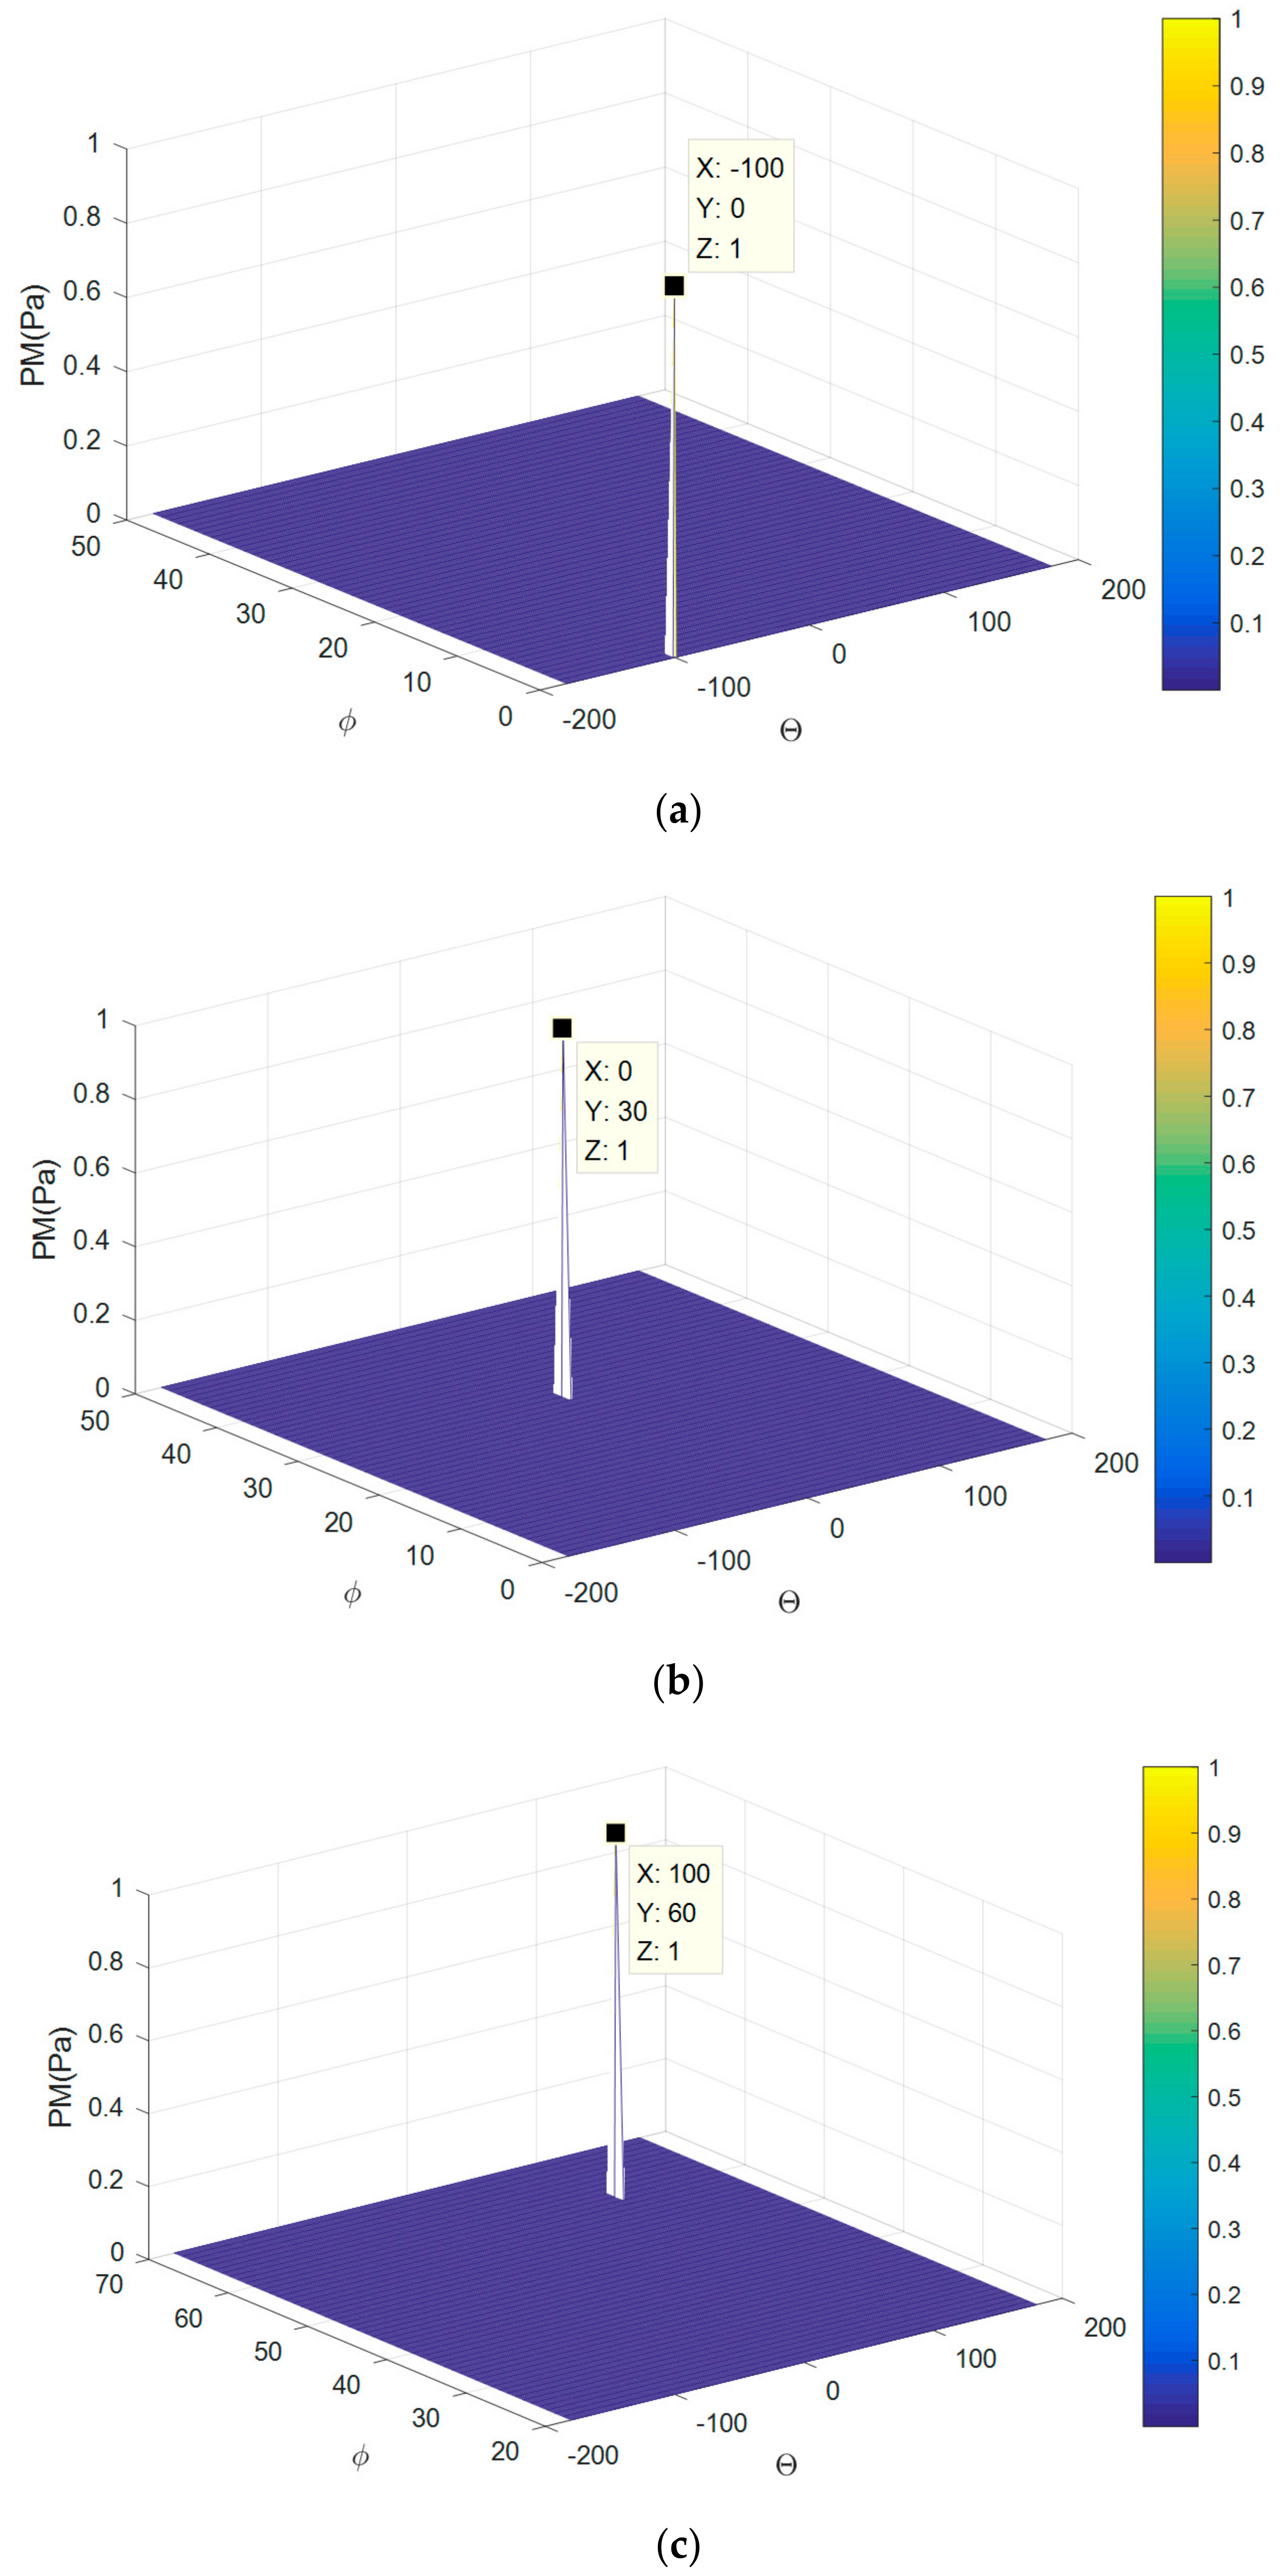
Figure 4.
The CNC milling chatter circumstances are detected at a high frequency between 3.4–4.5 kHz (a) resonance frequencies of data1; (b) resonance frequencies of data2; (c) resonance frequencies of data2; (d) resonance frequencies of data4.
Figure 4.
The CNC milling chatter circumstances are detected at a high frequency between 3.4–4.5 kHz (a) resonance frequencies of data1; (b) resonance frequencies of data2; (c) resonance frequencies of data2; (d) resonance frequencies of data4.


Figure 5.
The input of time domain multi-tone signals with different SNRs. (a) SNR = 12 dB; (b) SNR = 6 dB; (c) SNR = 0 dB.
Figure 5.
The input of time domain multi-tone signals with different SNRs. (a) SNR = 12 dB; (b) SNR = 6 dB; (c) SNR = 0 dB.
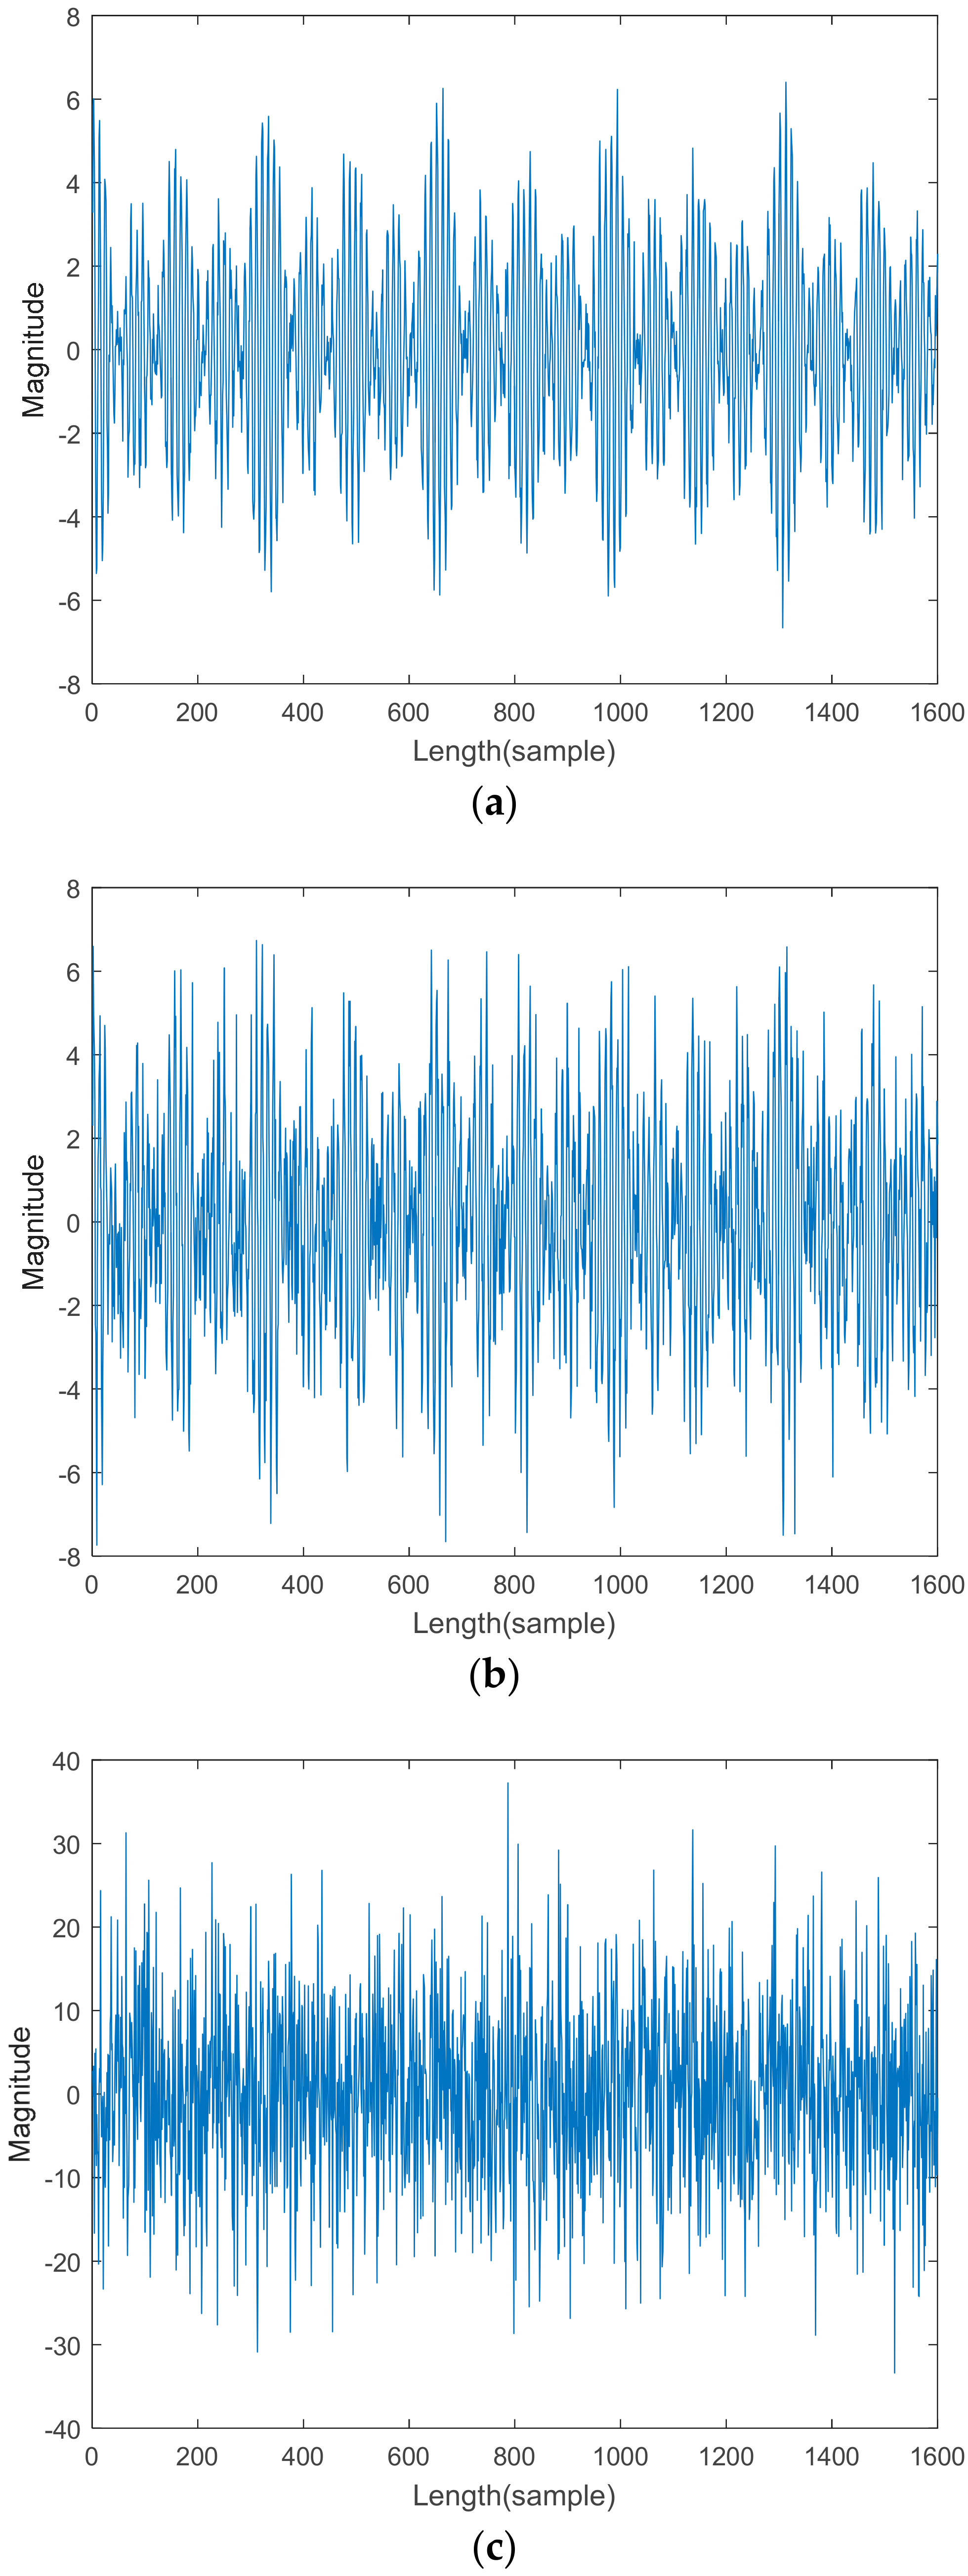
Figure 6.
Source (θ, φ) = (−100, 30) estimation in high noise environments with (a) SNR = 12 dB, (b) SNR = 6 dB, and (c) SNR = 0 dB for the original MUSIC method and (d) SNR = 12 dB, (e) SNR = 6 dB, and (f) SNR = 0 dB for the VAD + MUSIC method.
Figure 6.
Source (θ, φ) = (−100, 30) estimation in high noise environments with (a) SNR = 12 dB, (b) SNR = 6 dB, and (c) SNR = 0 dB for the original MUSIC method and (d) SNR = 12 dB, (e) SNR = 6 dB, and (f) SNR = 0 dB for the VAD + MUSIC method.


Table 1.
The settings of CNC milling operation.
| Spindle Speed (rpm) | Depth of Cut (mm) | Feed Rate (mm/min) | |
|---|---|---|---|
| Data1 | 4000 | 1 | 600 |
| Data2 | 4000 | 5 | 600 |
| Data3 | 4000 | 5 | 500 |
| Data4 | 8000 | 5 | 500 |
© 2018 by the authors. Licensee MDPI, Basel, Switzerland. This article is an open access article distributed under the terms and conditions of the Creative Commons Attribution (CC BY) license (http://creativecommons.org/licenses/by/4.0/).
Share and Cite
MDPI and ACS Style
Wang, P.-L.; Tsai, Y.-T. Numerical Analysis of CNC Milling Chatter Using Embedded Miniature MEMS Microphone Array System. Inventions 2018, 3, 5. https://doi.org/10.3390/inventions3010005
AMA Style
Wang P-L, Tsai Y-T. Numerical Analysis of CNC Milling Chatter Using Embedded Miniature MEMS Microphone Array System. Inventions. 2018; 3(1):5. https://doi.org/10.3390/inventions3010005
Chicago/Turabian StyleWang, Pang-Li, and Yu-Ting Tsai. 2018. "Numerical Analysis of CNC Milling Chatter Using Embedded Miniature MEMS Microphone Array System" Inventions 3, no. 1: 5. https://doi.org/10.3390/inventions3010005