1. Introduction
The world has lately undergone a global decarbonisation and decentralisation effort that still continues to this day. Microgrids (MGs) are expected to form a part of this effort, in the context of transforming the traditional operation of electricity systems towards a more decentralised approach. Typically, MGs are comprised of low voltage (LV) distribution systems with distributed energy resources (DER) (micro-turbines, fuel cells, photovoltaics, etc.) together with storage devices (flywheels, energy capacitors and batteries) and flexible loads. These systems can be operated both in a non-autonomous (i.e., when interconnected to the grid) and an autonomous way (i.e., when in islanded mode) [
1]. The operation of micro-sources in the network can provide distinct benefits to the overall system performance, if managed and coordinated efficiently, as suggested by the literature. In fact, MGs can have a diverse role in the future smart grids and based on their control capabilities they can perform the following functions [
2]:
disconnect from the grid and operate autonomously if required;
alleviate grid disturbances;
serve as a grid resource for faster system response and recovery;
strengthen grid resilience and increase security of supply.
Given their increased controllability and the benefits they could potentially offer to the system operation, MGs can be found in various voltage levels from low to medium voltage distribution systems, depending on the application. Typical examples of implemented MGs include laboratory-scale applications utilised for various research purposes, such as to investigate the benefit of DER [
3], to demonstrate the advantages of hybrid alternating current/direct current (AC/DC) MGs [
4] and to present the components of MGs and experiences arising from their operation [
5]. Real-world MG systems can be used, in practice, to supply remote users without the possibility of grid-connection. For example, Ref. [
6] presents real-world MGs currently installed in Canada, Greece, Portugal, Italy, Germany, Japan and China. Typical energy resources of these MGs are diesel generators, hydro-generation, photovoltaic (PV) arrays, wind turbines, batteries, flywheels and supercapacitors of various ratings.
Significant amounts of research have lately been devoted in the optimal design and operation of MGs. For instance, Ref. [
7] proposes an optimal operation scheme of MGs through the utilisation of agents and a central energy management system to determine the optimal dispatch for the various devices involved. The authors of [
7] expand their work on [
8], where they consider the optimal operation of multi-microgrids by additionally investigating how different demand response programs affect the operational cost and the peak load shaving. In fact, since increasing trends of peak loads are a significant challenge by the power systems, the authors of [
9] deal with electricity consumption optimization and analyse through various scenarios how distributed energy resources can affect the load curve. Other research papers delve into the component level and propose appropriate control schemes for the MG components. For example, both [
10,
11] suggest communication-based schemes for intelligent component control, while [
12] proposes the use of a multi-dimensional droop control for controlling wind turbines in an MG. Other research works analyse both from a technical and economic perspective real-world MG systems. For example, research presented in [
13] analyses an actual standalone MG installed on Kythnos island, Greece and specifically investigates the techno-economic aspects of replacing diesel generators by fuel cells, an electrolyser and a conventional hydrogen storage tank. In the same vein, Ref. [
14] also analyses two implemented MGs, one autonomous and one interconnected, both located in a seaside area near Athens, Greece. The aim of the work is to investigate the benefit from integrating additional DERs.
In the context of the real-world applications, numerous MG systems have recently emerged in developing countries due to the under-developed power systems typically found in rural areas (e.g., India, Middle-East Asia, Africa, etc.), which result in a significant amount of world population lacking access to electricity. In fact, the International Energy Agency World Energy Outlook report indicates that one in six people in the world lack access to electricity [
15], and this number becomes even higher in developing countries where, on average, no more than 55% of the rural areas’ population enjoy the benefits of electrical power [
16]. There are a number of reasons for this problem, with some of them being the limited funds given by governments for electrifying such areas and also the distance from main substations that characterises them and significantly increases the initial investment cost. Off-grid applications have, therefore, been favoured, making MGs the preferred option due to the abundance of renewable energy sources and technologies currently available.
To this end, this paper focuses on the economical assessment of an autonomous MG meant to serve a real application of a residential network consisting of two houses located in the small island of Kea, Greece, and towards this direction provides an assessment of various design candidates. The problem is formulated as a multi-objective optimisation aiming at sizing the generators to cover for the given loads, while ensuring that
(i) the proposed design is the least-cost option; and
(ii) the penetration of the selected renewable generator exceeds a pre-specified limit (i.e., 25%). Battery energy storage systems (BESS) are additionally considered as a means of driving down the requirement for a conventional generator burning fuel (i.e., a diesel generator) in periods of low renewable energy output. The microgrid under consideration is evaluated from a techno-economic point of view utilising HOMER Pro software [
17] (version 3.7.6, Homer Energy LLC, Boulder, CO, USA), and specifically considering the Net Present Cost (NPC) as a metric to compare the various design options.
The analysis presented hereafter has a two-fold role, (i) to design the MG under consideration leading to the least-cost option being utilised; and (ii) to indicate the special characteristics of MG operation aiming at demonstrating the need for algorithms and tools with the capability to capture various effects. In the context of a future, highly meshed smart grid, where MGs could have an active role in ensuring reliable and uninterruptible operation, the capability to capture fast dynamics can indeed be a crucial aspect, effectively increasing the security of supply.
The paper is organised as follows:
Section 2 presents the network under consideration,
Section 3 discusses the mathematical formulation utilised in the optimisation procedure, and
Section 4 includes a summary of the data loaded into the software.
Section 5 presents simulation results including a thorough sensitivity analysis along with a discussion of the limitations that the utilised software exhibits. Finally, in
Section 6, conclusions are drawn.
2. Structure of the Proposed Microgrid
The microgrid considered in this study will be utilised to serve the demand needs of two cottages located in Kea, Greece. The reason for selecting to construct a microgrid relates to the fact that no distribution network currently exists in the site’s location, therefore significant capital expenditure would be required for a dedicated line towards the site. An autonomous microgrid would, of course, need some capital expenditure, but it would benefit over the option of constructing a line to the closest distribution substation from the perspective that energy consumption would afterwards come for free during the project lifetime. On top of this, a microgrid relying mostly on renewable energy sources would facilitate the reduction of CO emissions, hence it would create better environmental conditions, which is a non-negligible factor in the path towards a decarbonised world.
The autonomous system under consideration consists of photovoltaic (PV) panels combined with BESS and a diesel generator to account for periods of prolonged lack of sunshine; this is illustrated in
Figure 1.
2.1. Electrical Loads
The site consists of two luxurious cottages, used mostly for summer holidays. For this reason, the peak load of the site varies significantly between winter and summer, but also between weekdays and weekends. The surface of each cottage is 75 m
2; even though the size is fairly small, the peak load is excessive of the typical consumption for such a cottage, as the residences include high power loads. Specifically, the various loads existing in each house are presented in
Table 1. Note that all loads are treated as AC loads in this application.
Using the numbers shown in
Table 1, the total daily energy consumption of both houses is estimated to be 53 kWh and 23 kWh during summer and winter, respectively. As the loads vary significantly, the load curves have been created by the software to account for this daily and seasonal variation matching the peak load (specified by the user). Note that HOMER Pro uses scaled data to achieve this; i.e., it multiplies each of the baseline data values by a common factor that results in an annual average value equal to the specified by the user to match the peak load.
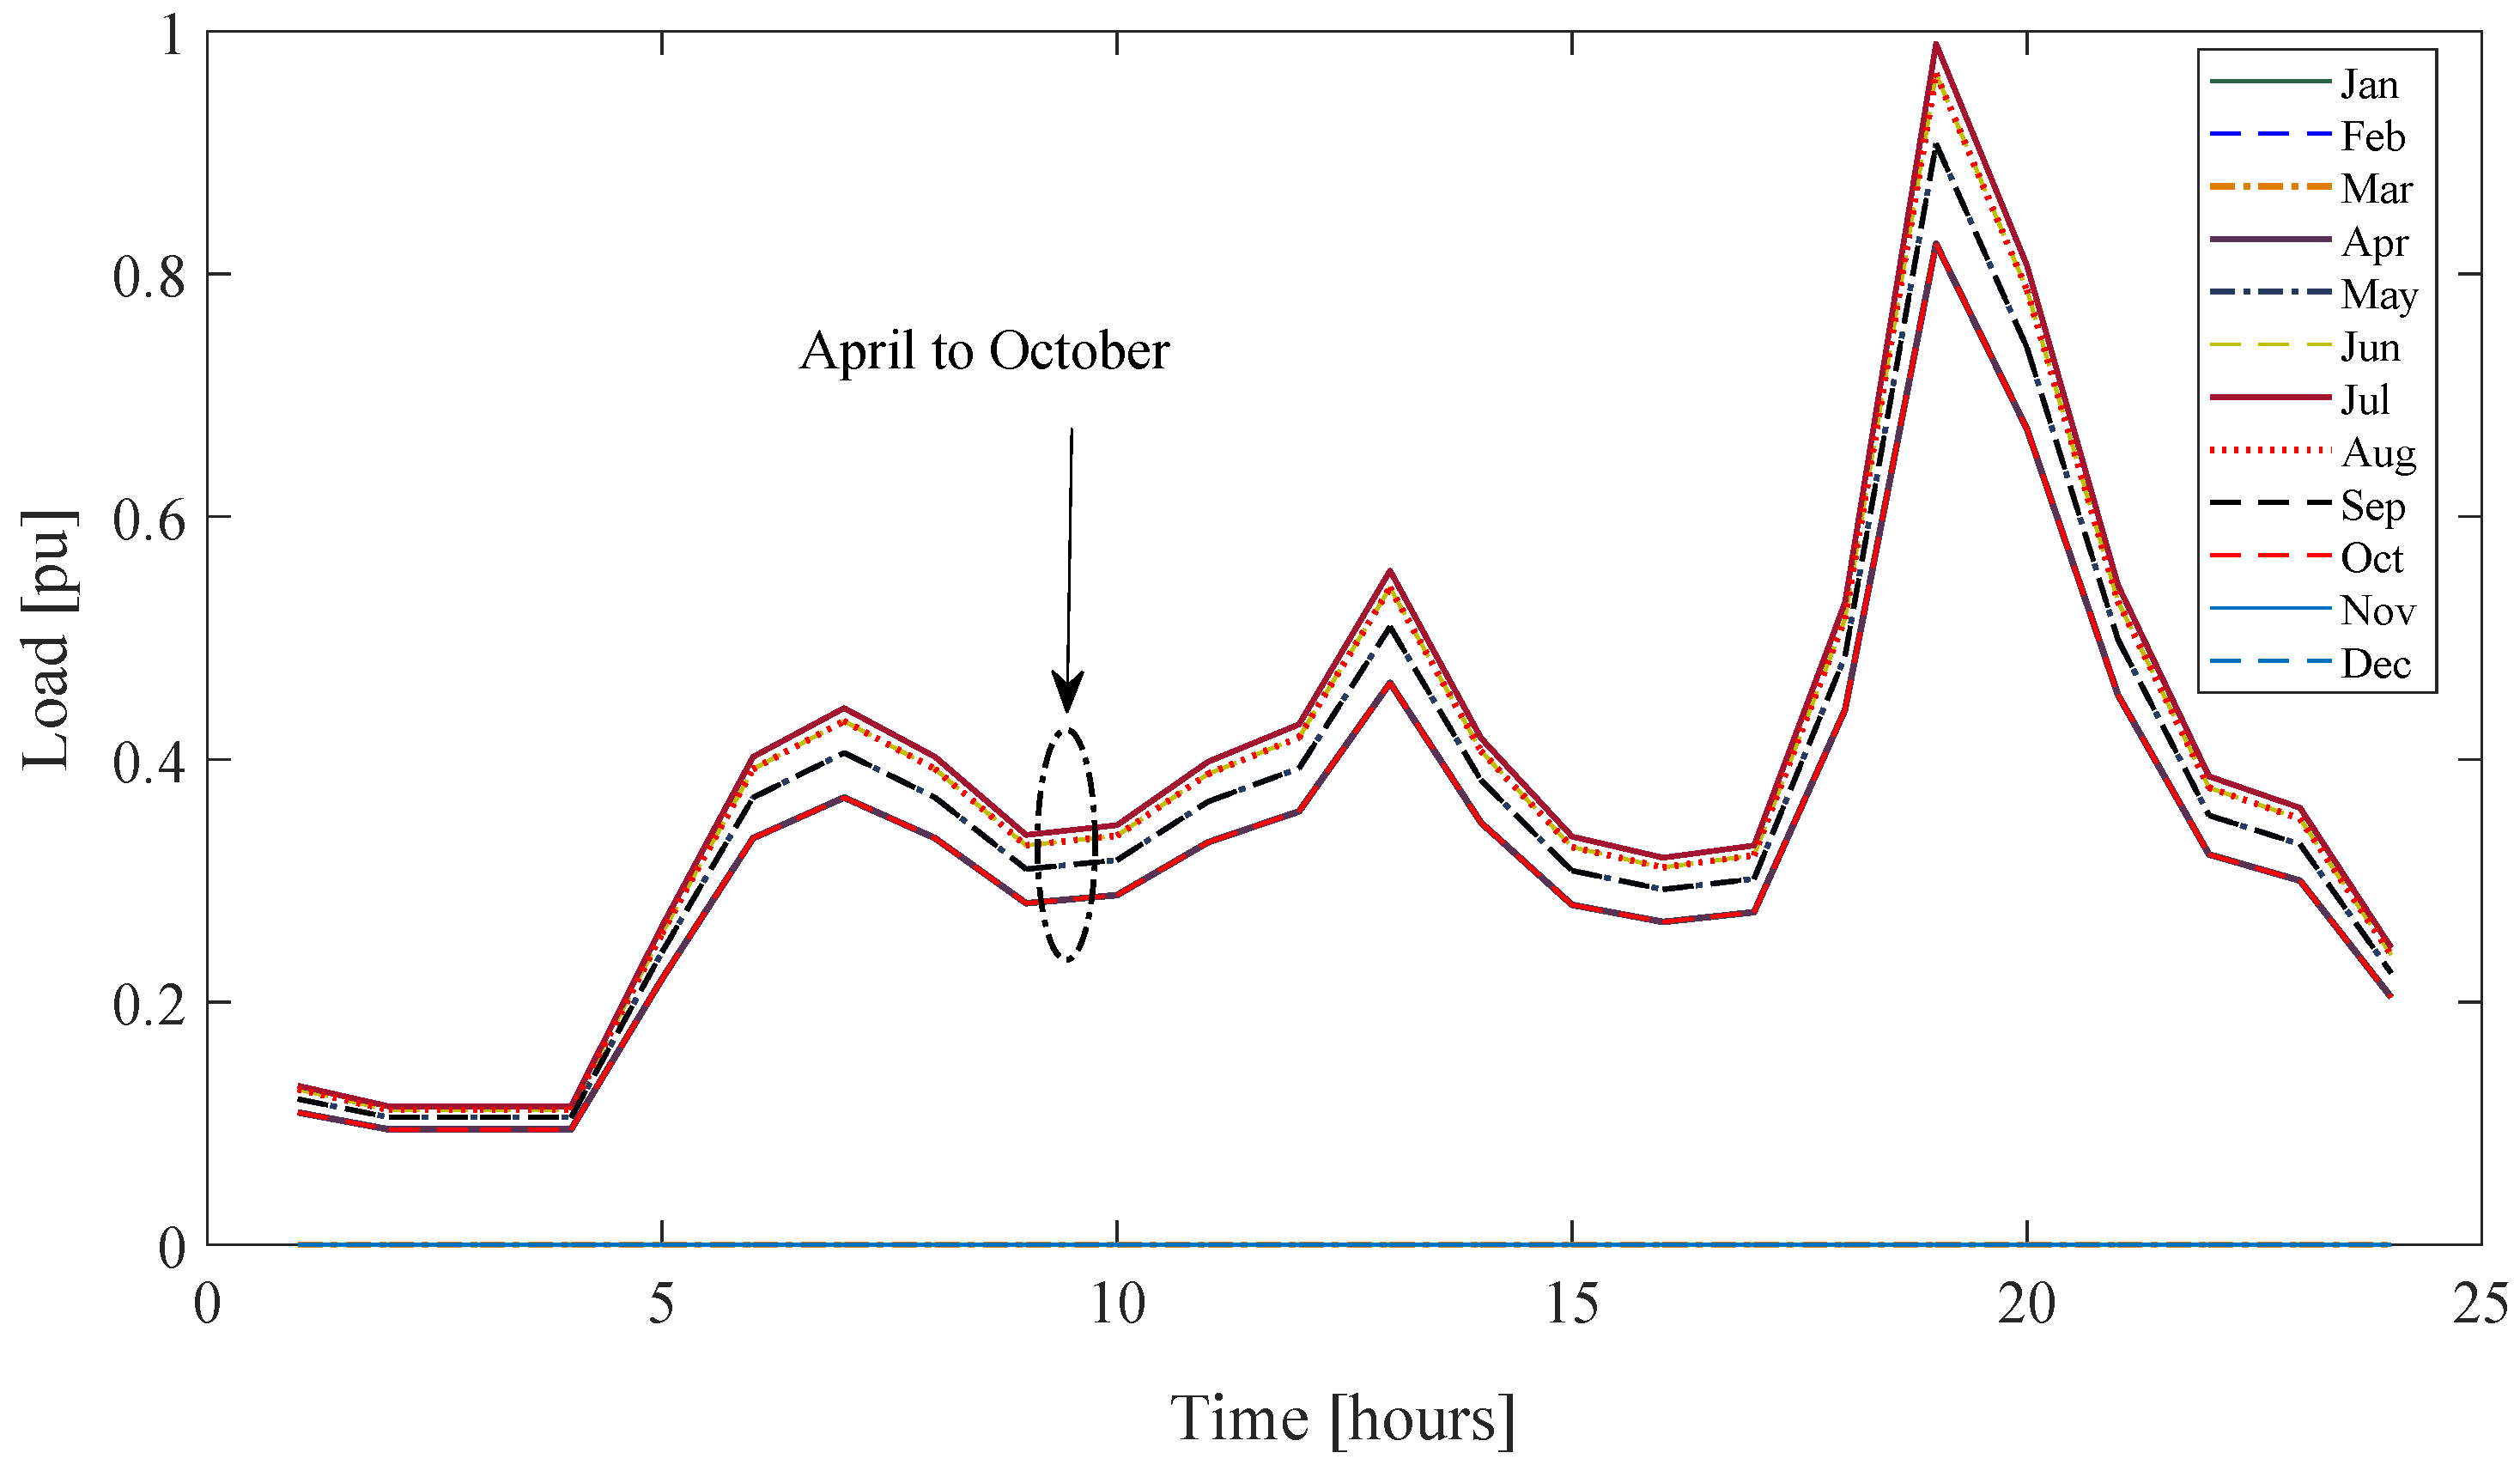
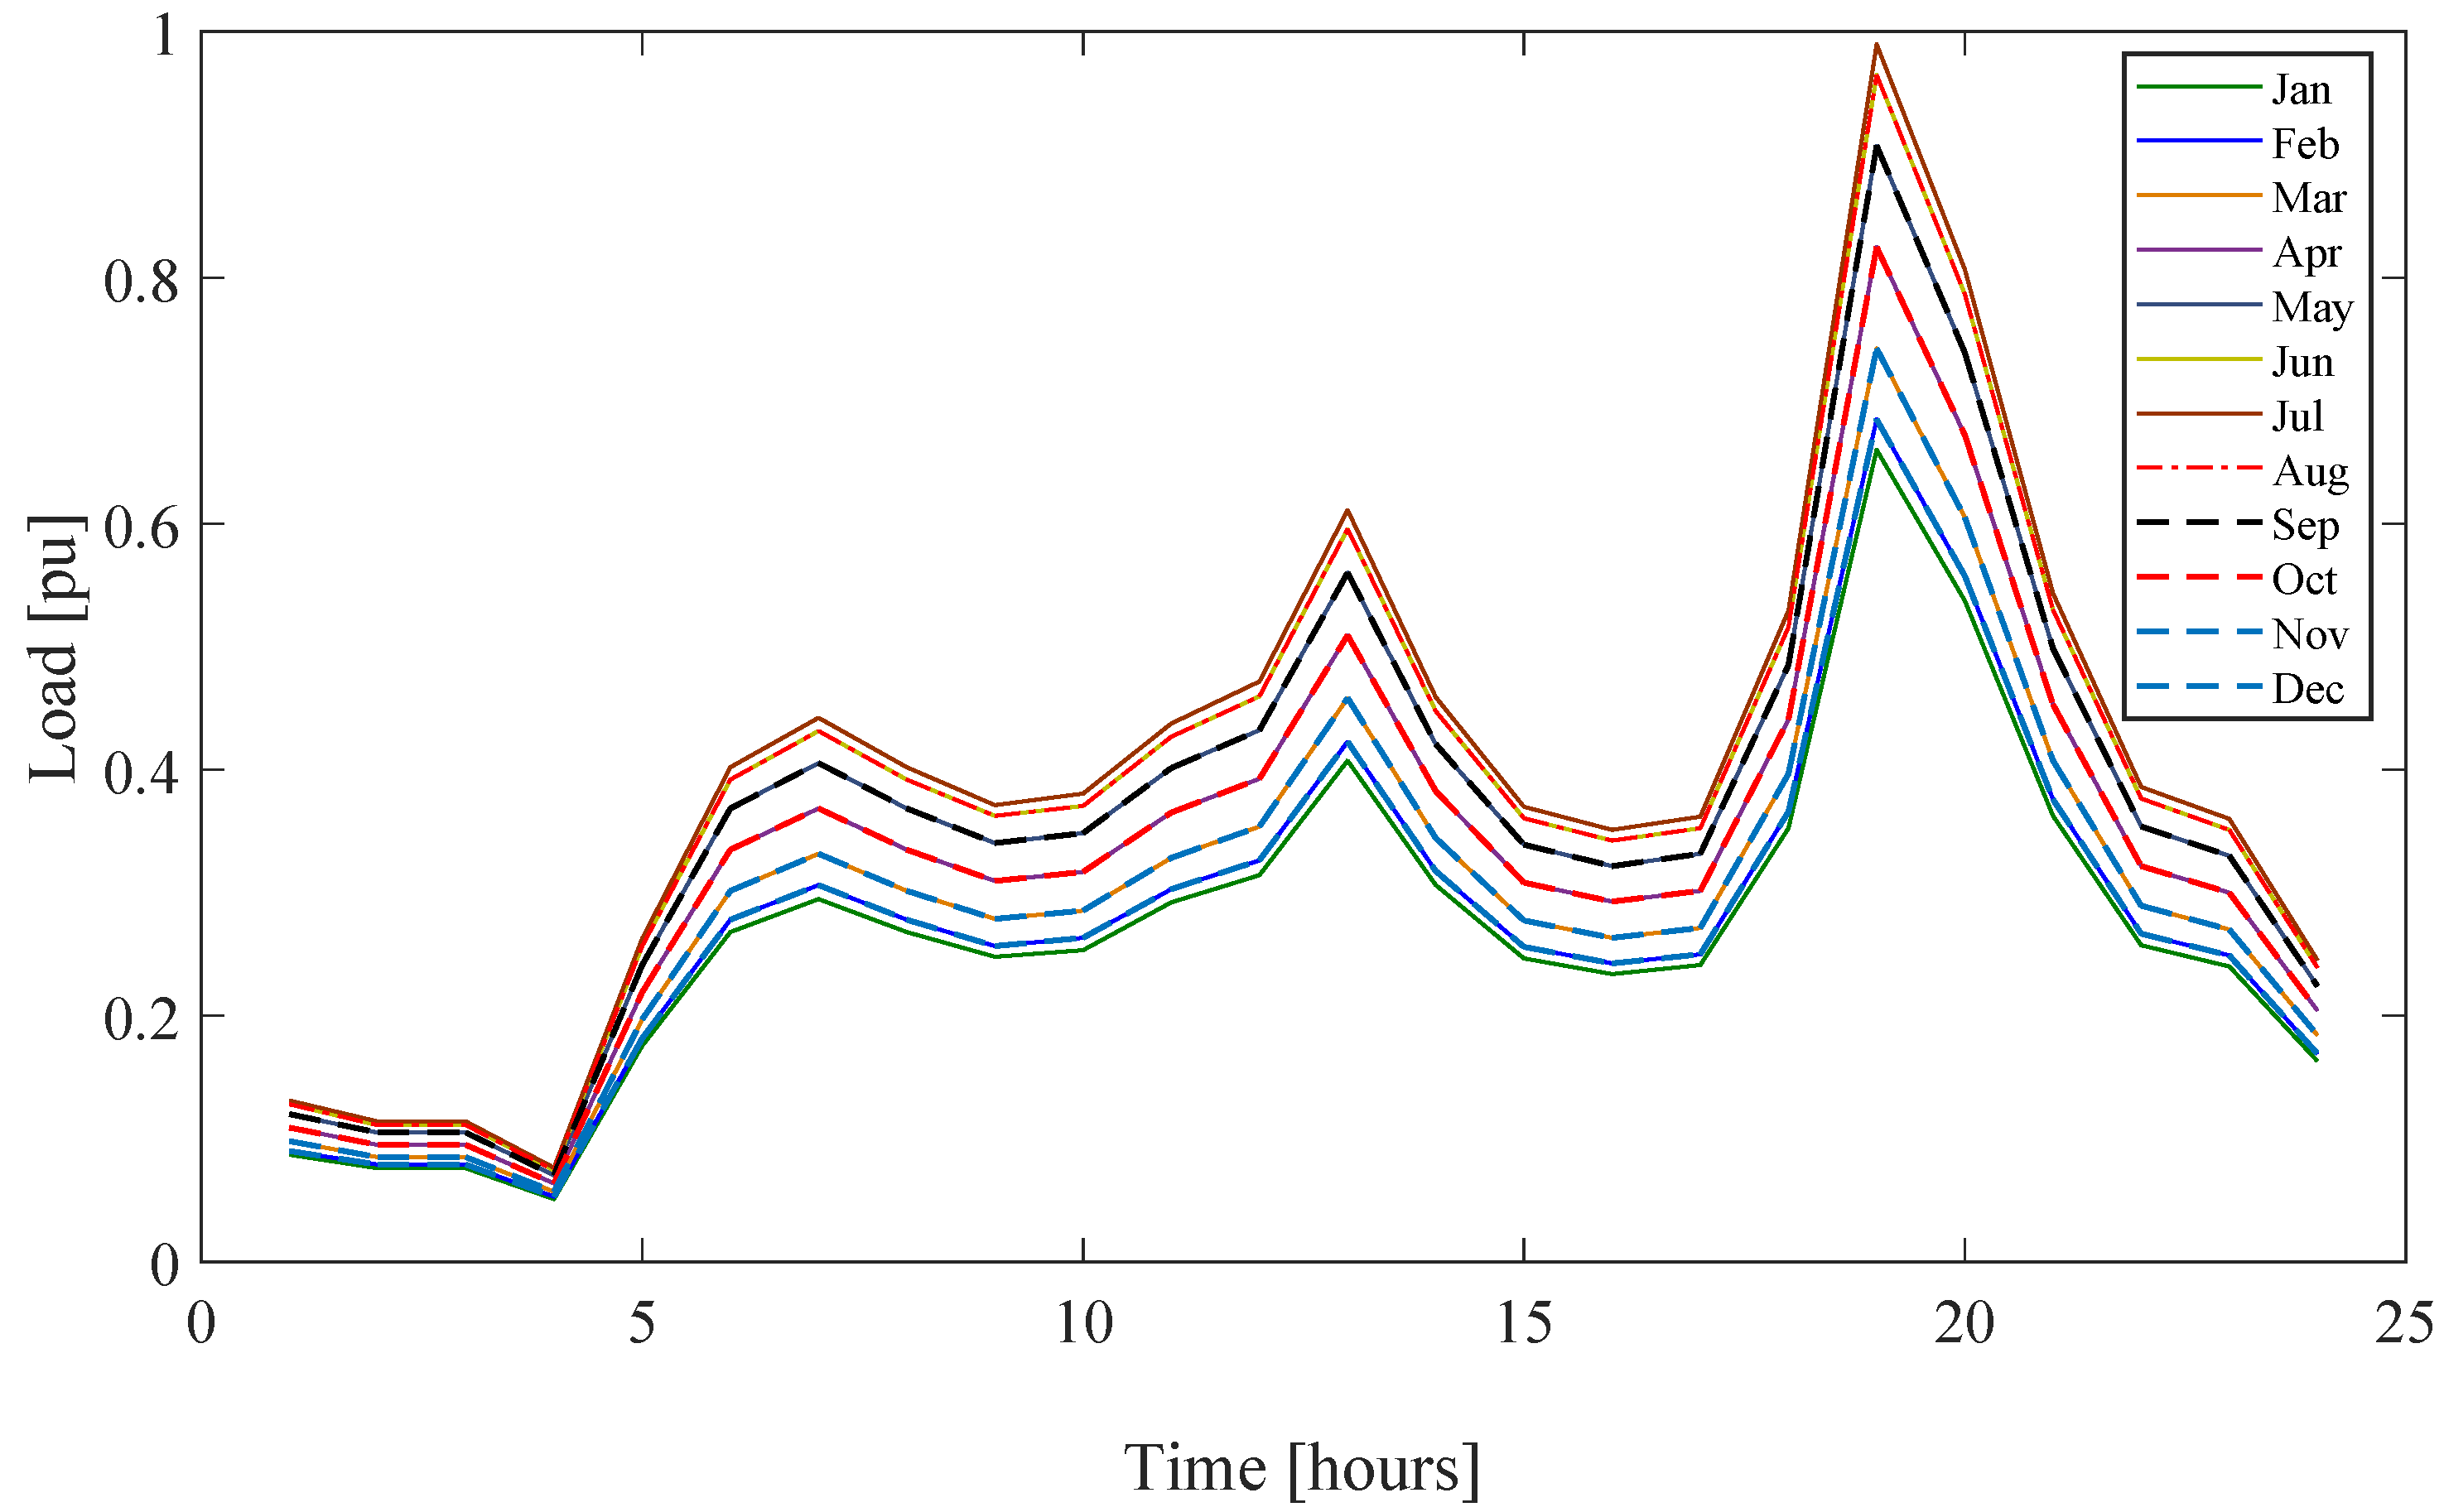
The load curves are illustrated in an hourly basis in
Figure 2 and
Figure 3 for weekdays and weekends, respectively. It is evident that, in both load curves, there are two distinct load peaks of 0.6 p.u. and 1.0 p.u. occurring around 12:00 p.m. and 8:00 p.m., respectively. This is a result of simultaneous switching of loads (probably of high power), which could include, for example, air-conditioning units and an oven at 12:00 p.m.–1:00 p.m., and hairdryer and washing machine at 7:00 p.m.–8:00 p.m.
It is worth stating here that the load curves for weekdays are non-zero only for the summer period (i.e., April to October). On the contrary, the load curves for weekends are always non-zero for all the months of the year. This due to the fact that the residences under study are supposed to be predominantly summer cottages, while occasional weekend visits are expected to occur during the winter period. For this reason and due to the fact that the residences are located in Greece, the overall demand is shown to be higher during the summer months. The incremental difference between each month of the year is around 0.015 pu, with January and July being the least and most demanding months, respectively.
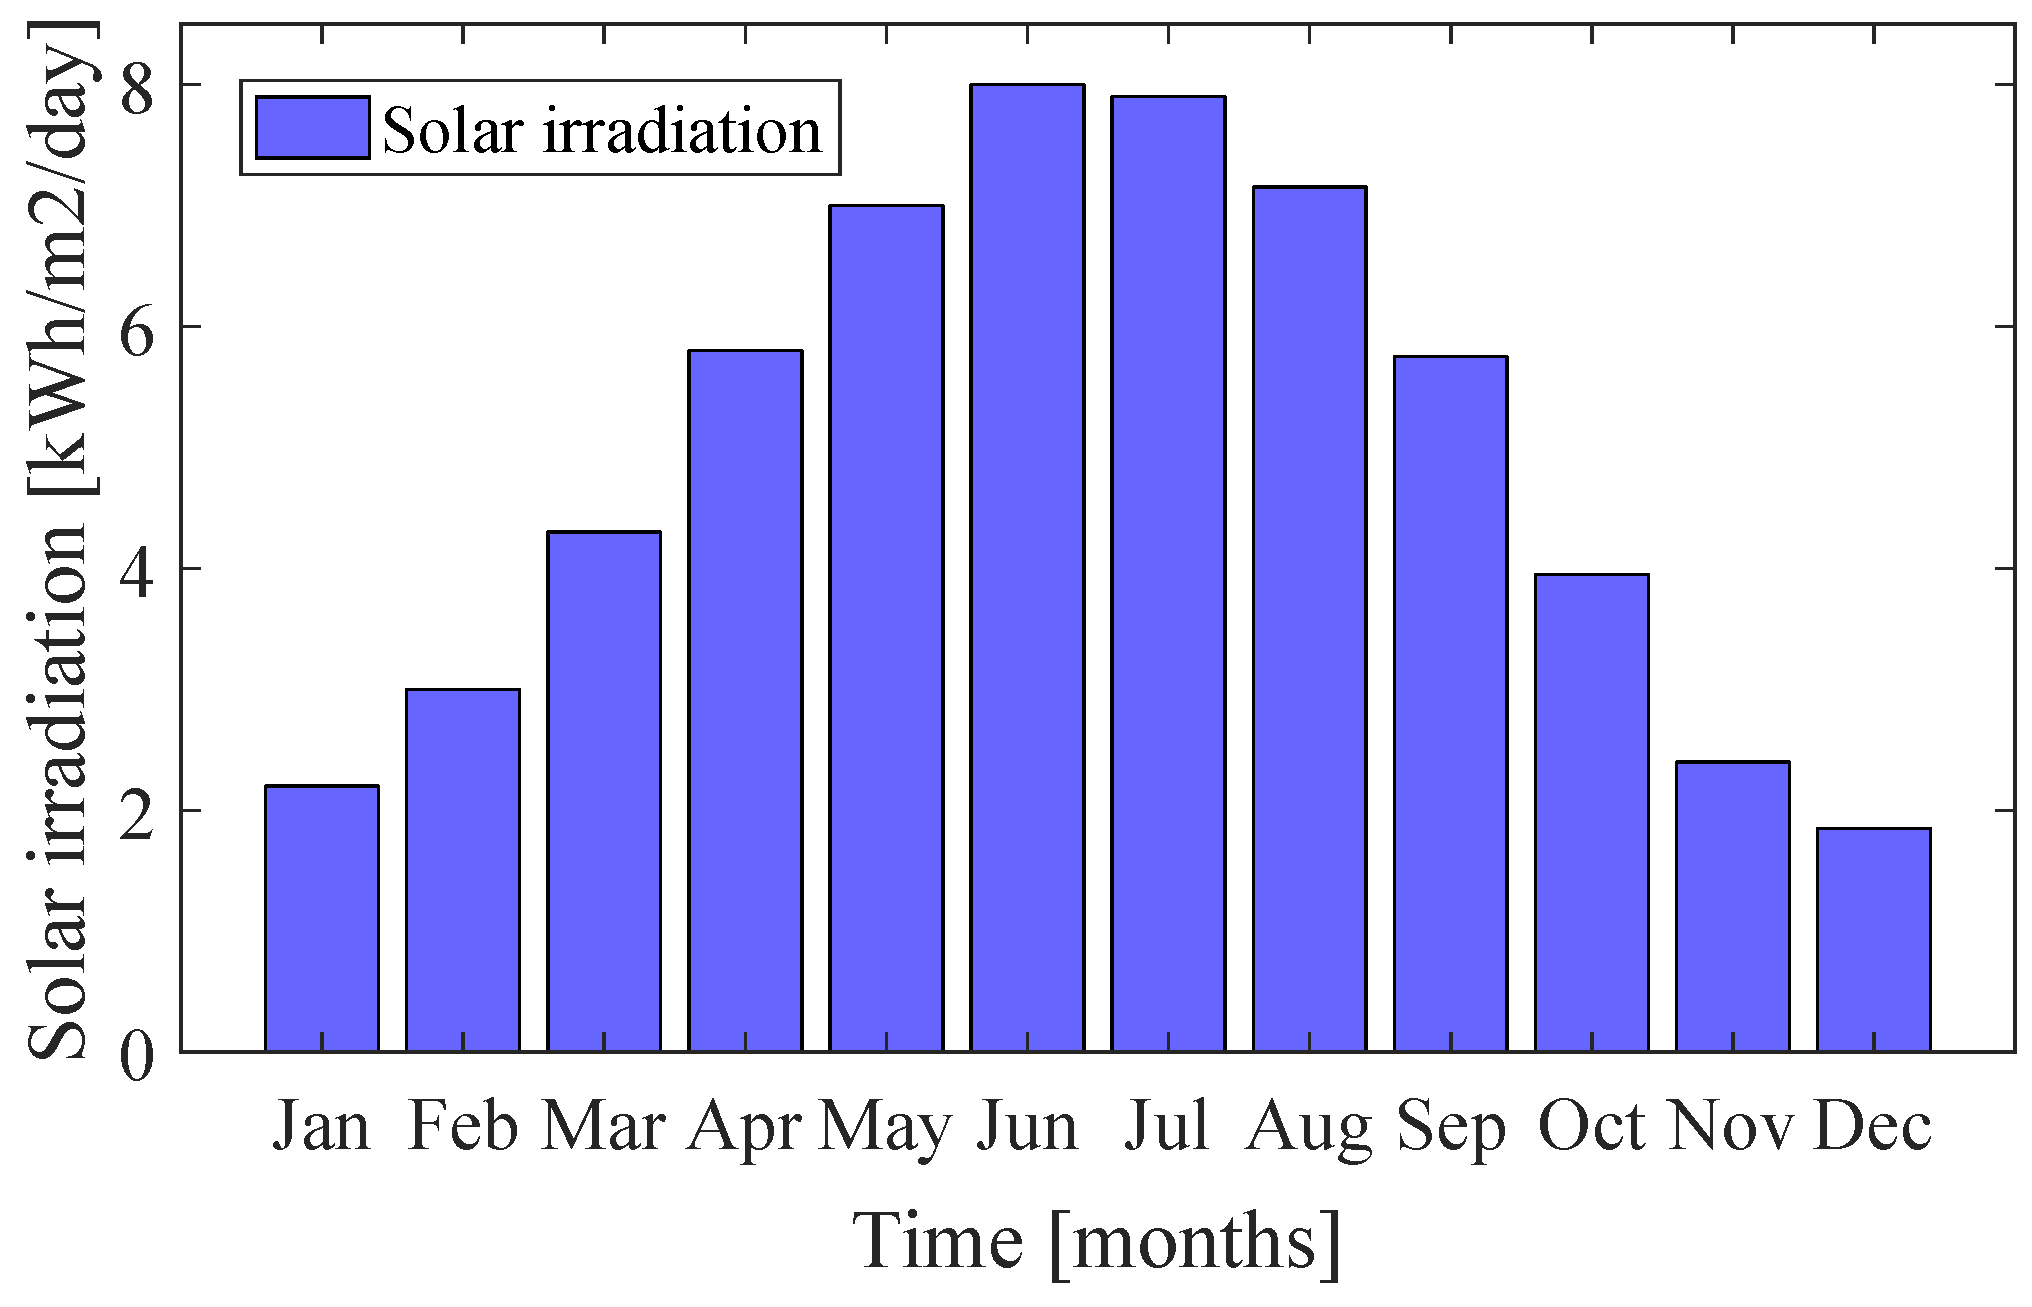
2.2. Solar Irradiation
The optimisation software utilised includes a library with the solar resources worldwide, as obtained by NASA’s data [
18]. By entering the latitude and longitude corresponding to Kea, the solar resource shown in
Figure 4 has been generated. The scaled annual average solar irradiation is 4.94 kWh/m
2/d.
2.3. BESS
BESS has been considered in the design as a means of reducing the utilisation of the diesel generator in periods of prolonged low sunshine. Obviously, storage devices come at an initial capital expenditure; however, the operating cost of storage is essentially zero, whereas the diesel generator consumes fuel. The price of diesel is considered in the sensitivity analysis aiming to demonstrate the benefit of using storage devices.
Various types of storage devices exist in the market (e.g., batteries, flywheels, air-compressors, etc.); however, an appropriate type for low to medium voltage applications is batteries due to their low capital cost and high efficiency [
19]. Specifically, due to the load patterns typically found in autonomous microgrids, in which consumption occurs with a certain shift from the hours of solar production, the most appropriate type of battery would be deep-cycle batteries. These batteries have the advantage that their efficiency and lifetime is not significantly compromised with continuous use. Of the various types of deep-cycle batteries currently existing, lead-acid and lithium-ion batteries are mostly found in power system applications. The main advantage of lithium-ion batteries is their higher efficiency towards the end of the lifetime (78% compared to 70% that lead-acid baterries achieve) and also higher energy density [
20]. However, their cost is more than double the cost of lead-acid batteries [
21]. Both types of batteries have been considered in the optimisation procedure, so that the optimal choice is determined among the two.
2.4. Converter
A converter is required to effectively connect the AC and DC sides of the MG. HOMER Pro allows for defining a cost curve of the converter, as it searches for the optimal system design (see
Section 4 for more details on the costs of the various system components).
3. Mathematical Formulation of the Problem
The objective function of HOMER Pro is the minimisation of the total Net Present Cost (NPC—also known as life-cycle cost). NPC is the present value of all the costs the system incurs (including costs for installation and operation of all components) over its lifetime, minus the present value of all the revenue it earns over its lifetime. Costs include capital costs, replacement costs, operation and maintenance (O&M) costs, fuel costs, and the costs of buying power from the grid (i.e., not applicable in this case though). Revenues include salvage value and grid sales revenue, which, in this case, is zero as there is no connection to the utility grid.
The objective function is mathematically expressed by Equation (
1), which expresses the MG system cost as represented by the NPC in financial terms. The minimisation procedure is constrained by inequalities (2)–(5):
Regarding the costs for each element, Equation (6) applies for all of the planning horizon:
The salvage, which represents the only source of revenue following the end of the planning horizon, is given by Equation (7):
The PV fraction shown in Equation (3) can be calculated by Equation (8) below:
The operating reserve,
and
, is loaded into Equations (9) and (10) to ensure a reliable power system during sudden increases of the loads or decreases of the PV generation. It is noted that HOMER Pro calculates the minimum operating reserve on the AC and DC buses separately through Equations (9) and (10):
It has now become apparent that the best candidate solution would be the one that results in the lower total NPC at the start of the project, while satisfying all constraints (i.e., inequalities (2)–(5)). The following sections demonstrate and discuss the best design solution.
5. Results
As already explained, the autonomous MG has been simulated by HOMER Pro in order to assess its operational and economic characteristics. HOMER Pro has the advantage of being able to perform thousands of simulations in a few seconds due to its simplified, non-derivative optimisation. In this case, 1943 candidate solutions were assessed taking into account various system designs (i.e., utilisation of diesel generators, different types of batteries, etc.) to calculate the option with the least NPC at the start of the project. From the total number of simulated solutions, only 1497 were found to be feasible; feasible is considered to be a solution capable of satisfying the objectives, which means that 446 solutions were eliminated due to the constraints (i.e., Equations (2)–(5)). HOMER Pro eliminates all infeasible solutions (e.g., due to not having power sources, lacking converters, etc.) and sorts all feasible solutions according to total NPC. An hourly time series simulation for every possible system design was considered for an 10-year planning horizon.
Table 3 indicates the eight best-performing system architectures and their respective costs. It can be observed that the optimal solution corresponds to a PV plant with capacity of 15.3 kW, a 17 kW diesel generator, 57 kWh of lead-acid batteries, and a converter with a power rating of 6.93 kW (i.e., design D1). Design D1 yields a total net present cost (NPC) equal to £ 56,264. The distribution of costs across the different components is shown in
Table 4. It is worth mentioning that no lithium-ion batteries were incorporated in the best solution due to their increased cost, even though they are characterised by better efficiency and lifetime figures (see
Table 2).
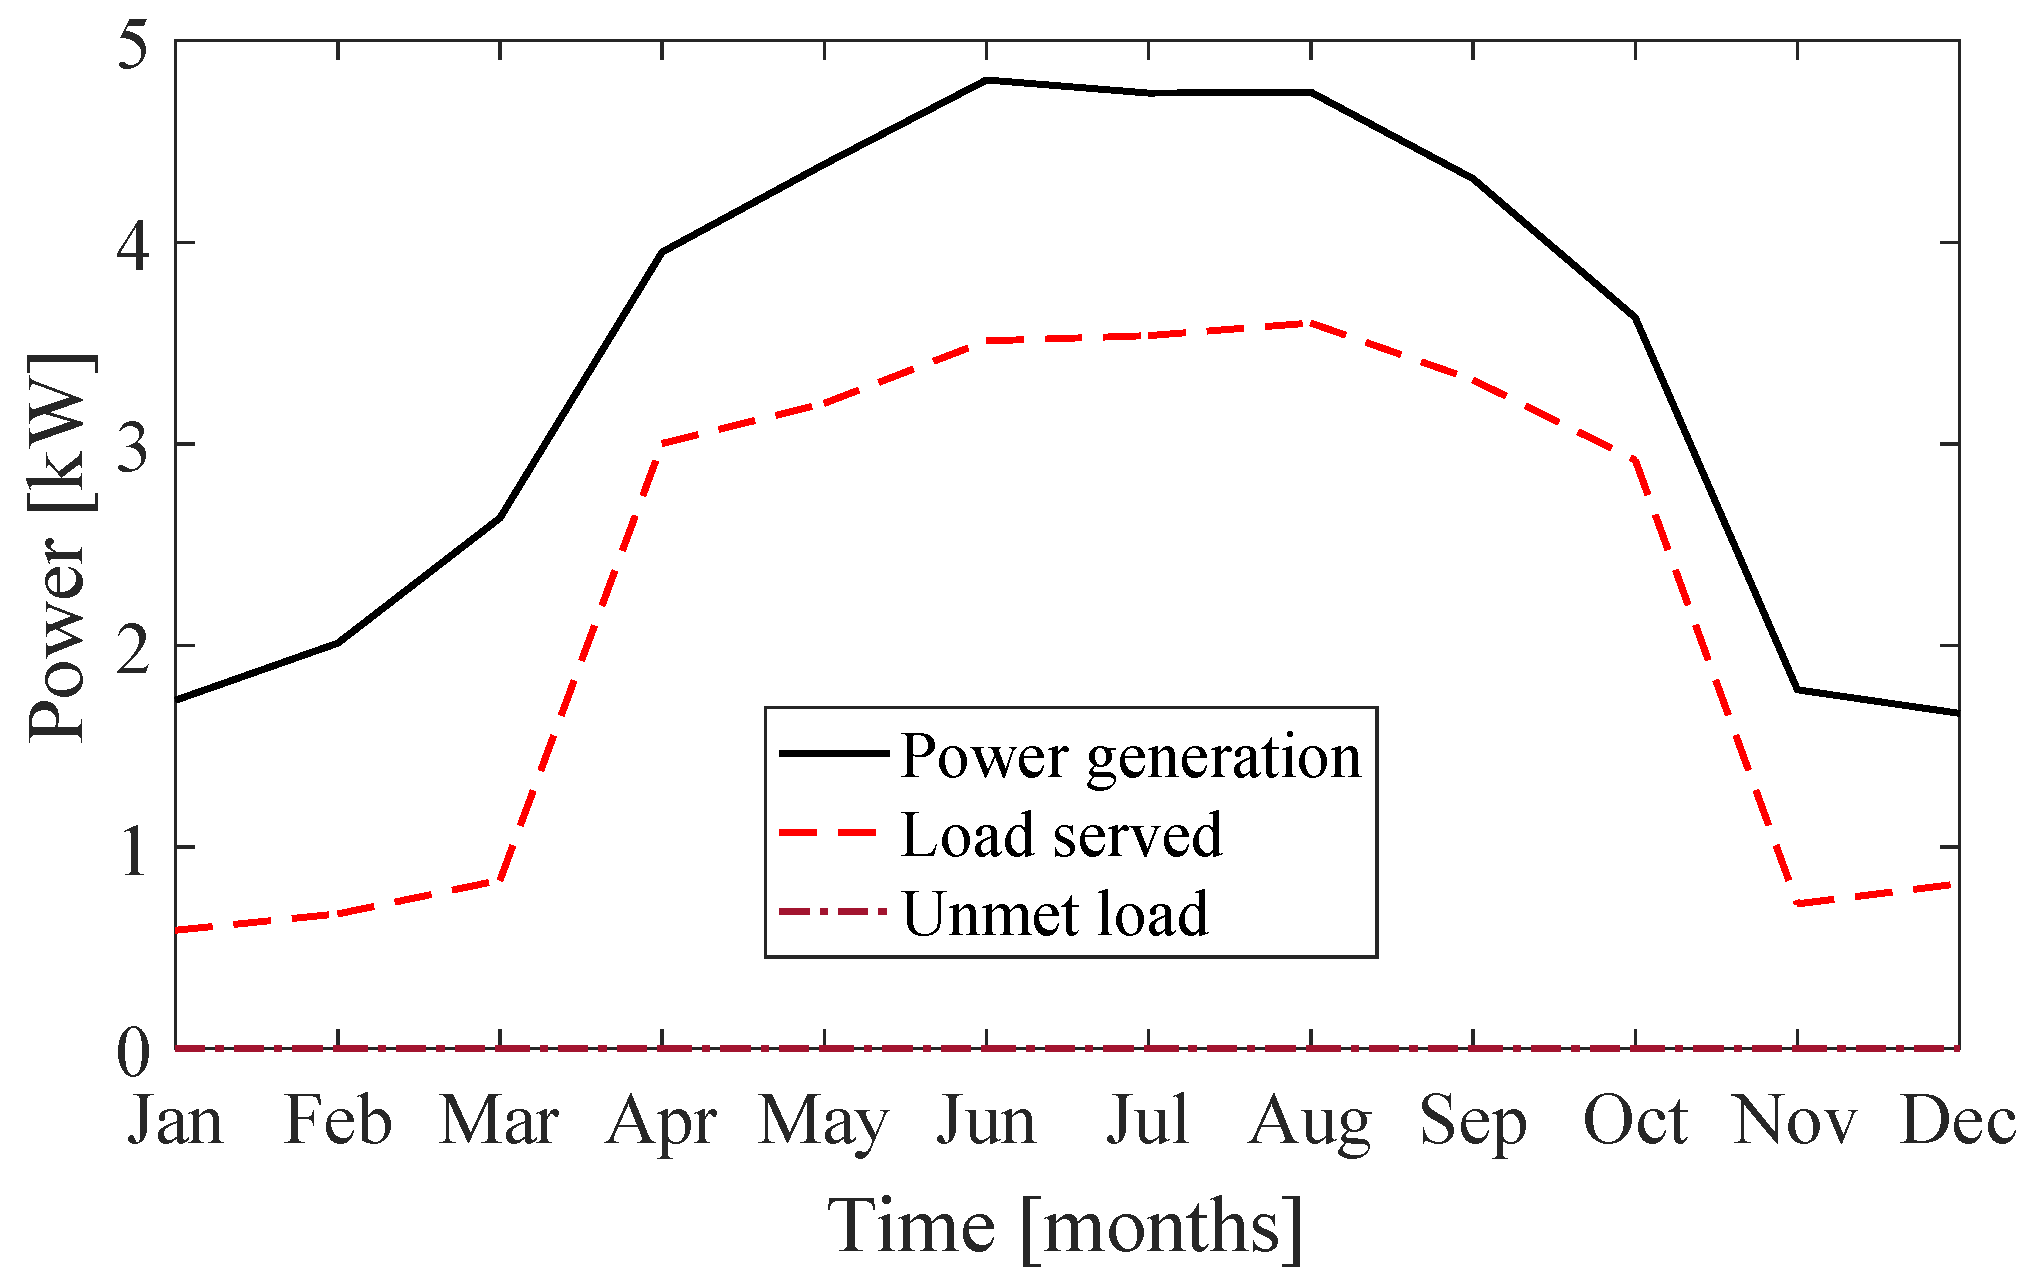
With regard to satisfying the constraints while keeping the total NPC to the feasible minimum, the unmet load is essentially zero (illustrated in
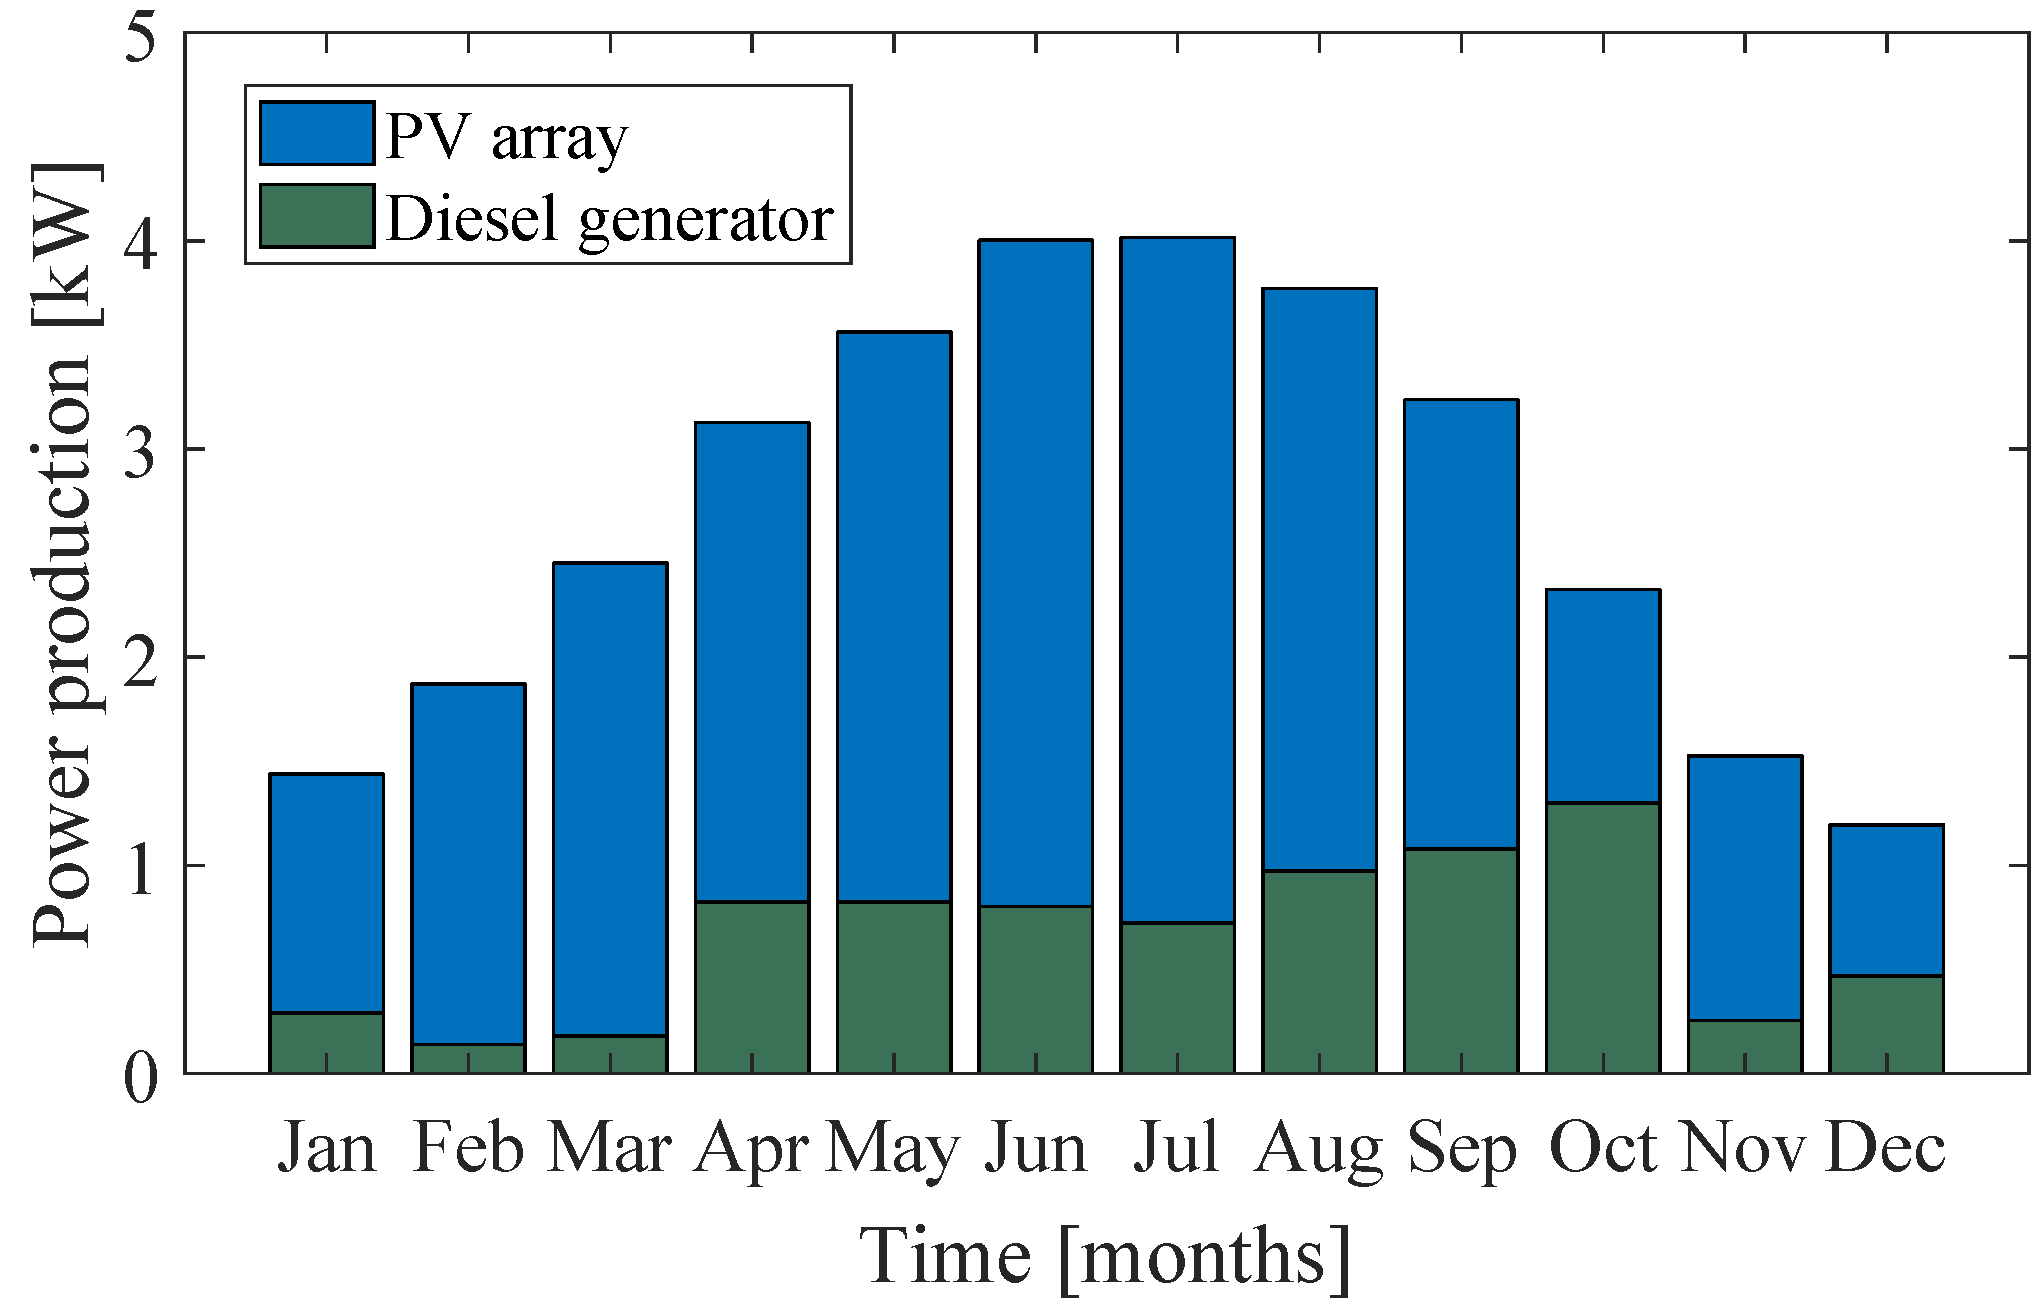
Figure 5 along with the total electrical load served and the total renewable power output). Additionally, the PV penetration appears to be as high as 70.6% (see
Table 3 and
Figure 6 for more details on the power production).
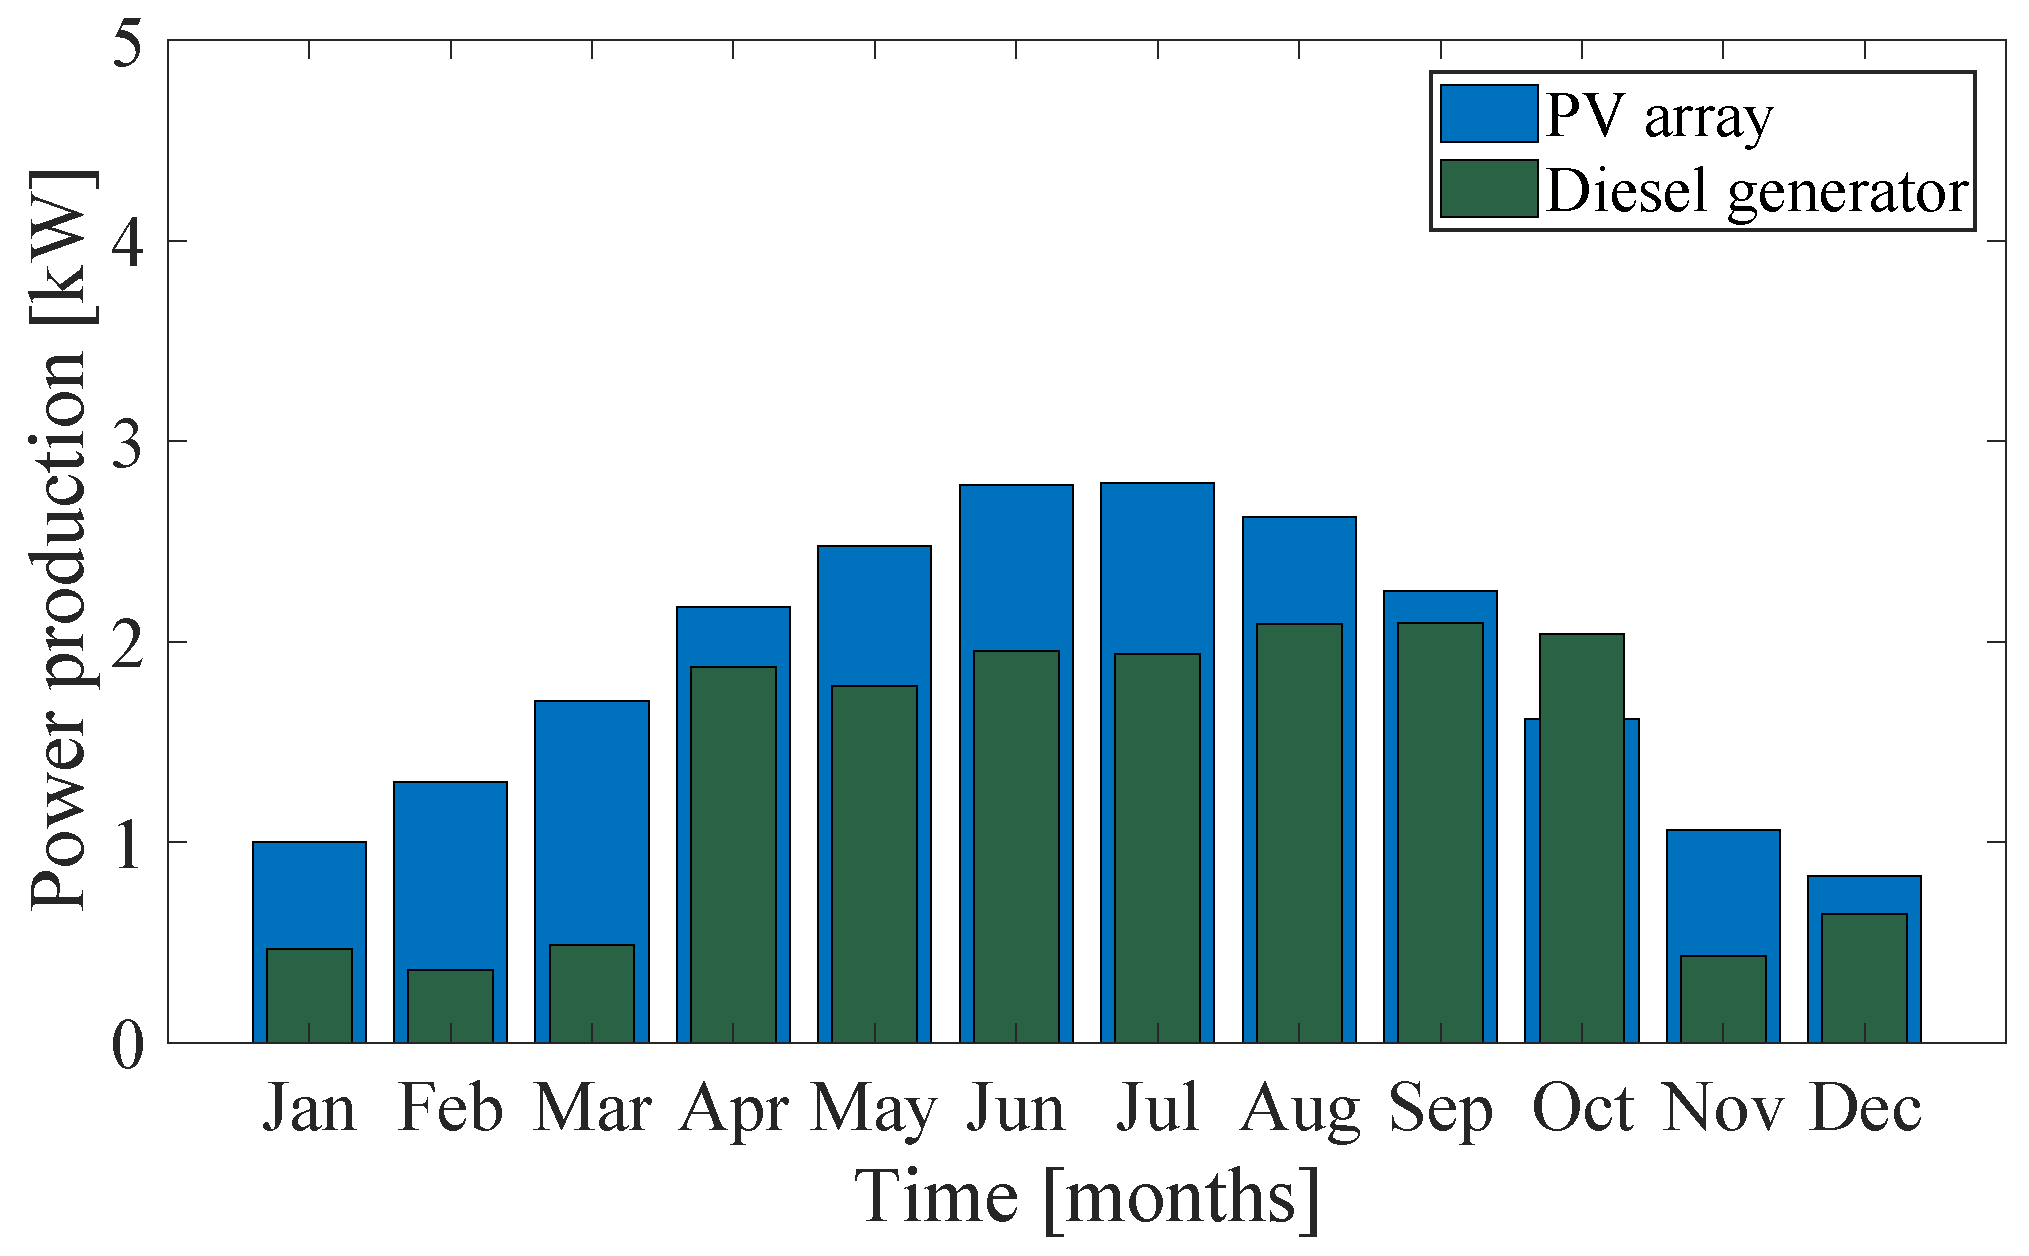
A very interesting candidate is design D2. It can be observed that the overall cost is approximately 20% higher (i.e., due to the capital cost of batteries), which is, however, achieved by selecting much smaller PV and batteries ratings, but a higher converter rating that allows more power to be transferred from the DC side (i.e., batteries and renewable energy source) to the loads of the AC side. Additionally, this design incorporates Li-ion batteries probably due to their higher efficiency figure, which is essential given that much lower capacities of the various equipment have been utilised. The monthly average power production for design D2 is illustrated in
Figure 7. It can be observed that the penetration of renewable energy is much lower, even being lower than the diesel generator in a single instance (i.e., during October). Of course, this result is expected since the renewable penetration does not exceed 40%, which is higher than the imposed constraint of 25% though. Regarding the unserved load, it is zero utilising design D2 as well.
As far as the rest of the investigated system designs is concerned, designs lacking a diesel generator (i.e., designs D3 and D5) require oversized PV arrays and batteries (approximately double rating compared to design D1). Therefore, they exhibit higher total NPC, which is sensible given that there is a strict constraint requiring zero load shedding, and as such excessive rating of the PV array is required for ensuring that the batteries are sufficiently charged to cover the demand during periods of low or no sunshine. Moreover, design D7, which includes no batteries, is characterised by a slightly higher PV array rating, but much higher total NPC, which relates to higher diesel fuel consumption. This is an interesting result, as it demonstrates the financial benefit storage devices have in such projects. Furthermore, design D8, consisting of a standalone diesel generator, results in the highest total NPC due to the amount of diesel fuel required over the planning horizon of the project (i.e., 10 years); therefore, a hybrid solution exhibits better economic performance.
In addition to the above, design D4 consists of a diesel generator and Li-ion batteries; it would be anticipated that when a diesel generator is selected as the power source, no batteries would be utilised, as every kWh produced by the diesel generator comes at a certain cost. However, HOMER Pro incorporates an efficiency curve into the model of the diesel generator, according to which operation with higher output results in higher efficiency. As such, the optimiser selects to allow some energy excess rather than operate with lower efficiency figures. This energy excess is used to charge the small amount of batteries incorporated in the design. Finally, a rather interesting result lies in the rating of the diesel generator. It can be observed that the rating is constant at 17 kW irrespective of the system architecture. This is because the selected diesel generator component (i.e., ‘Autosize Genset’) sizes itself, until it can meet the given load irrespective of the hours it may be required to run (i.e., depending on the other generators existing in the system).
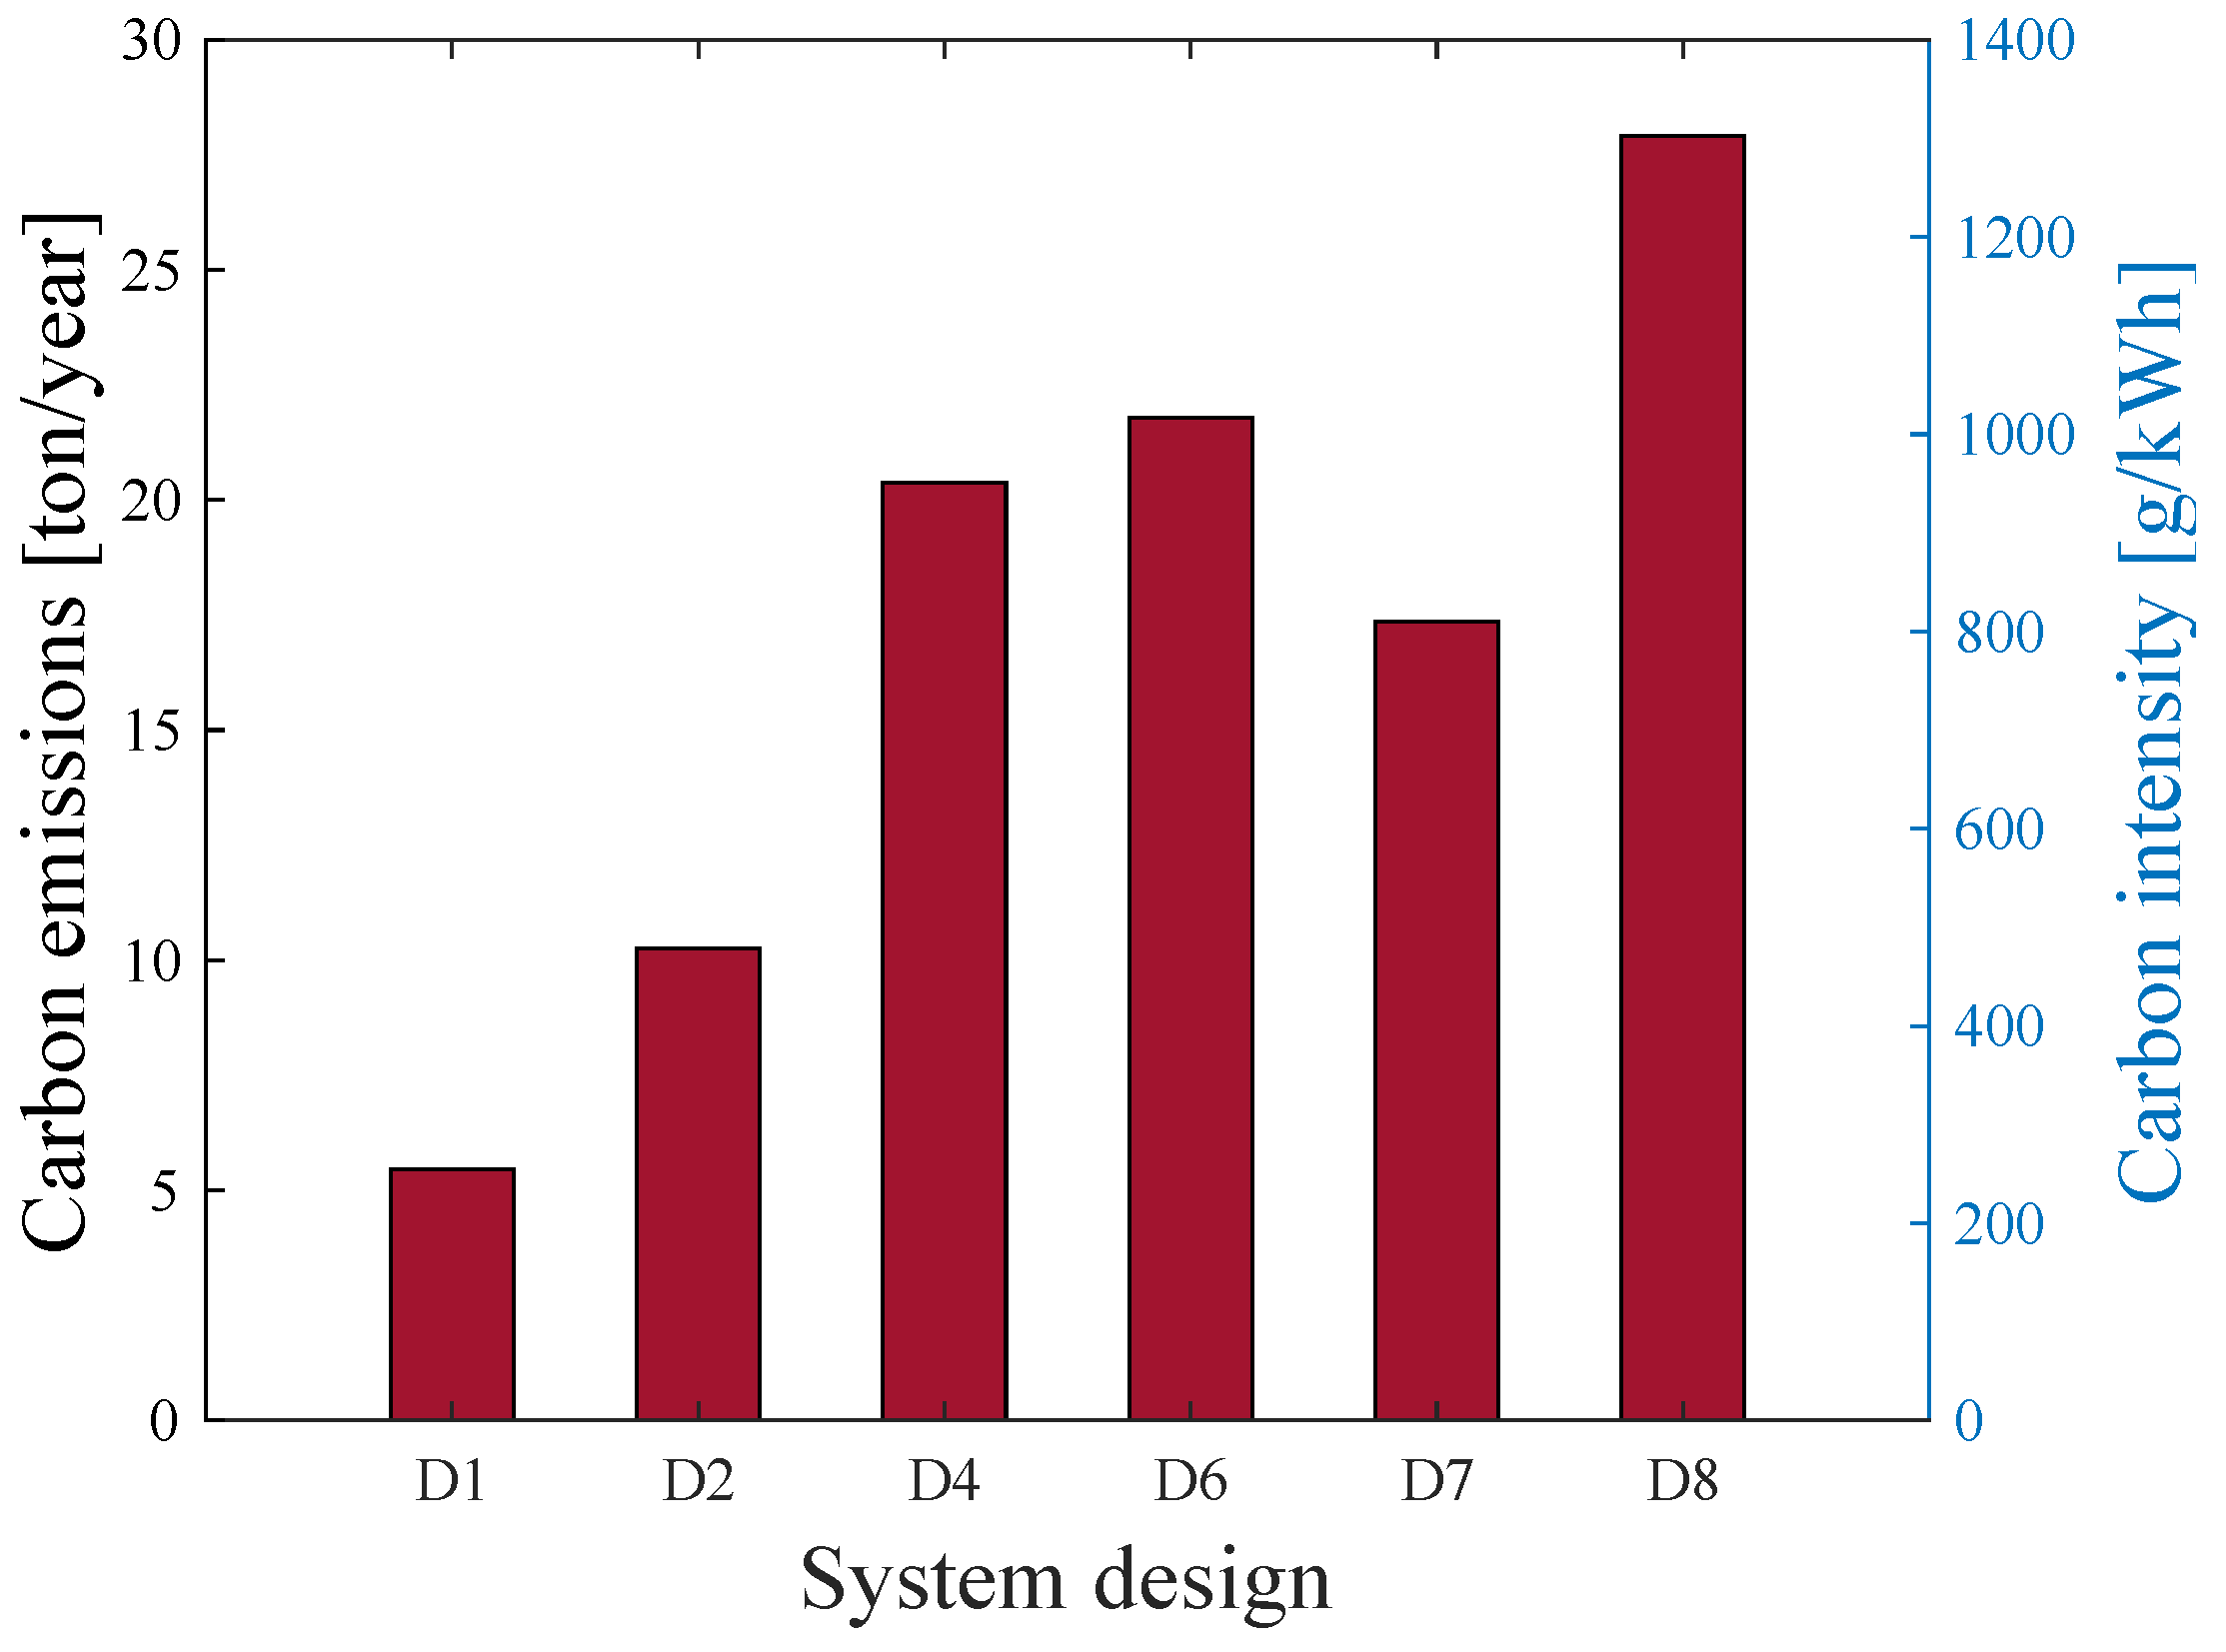
In the context of a future, largely decarbonised world, it is considered of utmost importance to take into account the CO
2 emissions from each system design.
Figure 8 illustrates the carbon emissions and relevant carbon intensity for all designs incorporating a diesel generator. It can be observed that the optimal system design, D1, exhibits the least CO
2 emissions as well as carbon intensity indice, and, in general, design D8 with the standalone diesel generator has the higher carbon emissions (similarly, carbon intensity). This leads to the conclusion that, for the given application, a hybrid system design, comprised of a PV array and batteries, significantly reduces the carbon emissions along with the total NPC. Especially for an islanded application like the one under consideration, this is a very noteworthy result.
5.1. Sensitivity Analysis
A sensitivity analysis has been performed to evaluate the impact of the diesel fuel price only in the optimal system design. Five values were considered: 0.90 £/ℓ, 1.00 £/ℓ, 1.10 £/ℓ, 1.20 £/ℓ, and 1.30 £/ℓ. The total number of simulations performed is 9553, of which 2230 were found to be infeasible.
Table 5 summarises the results obtained for the various diesel prices loaded into the software. There is a clear trend regarding the total NPC, which increases as the diesel price increases. It can also be seen that, as the diesel price increases, the sizing of the PV plant and the converter increase as well; this is sensible given that the optimiser is trying to reduce the expenditure in fuel, hence increasing the renewable fraction.
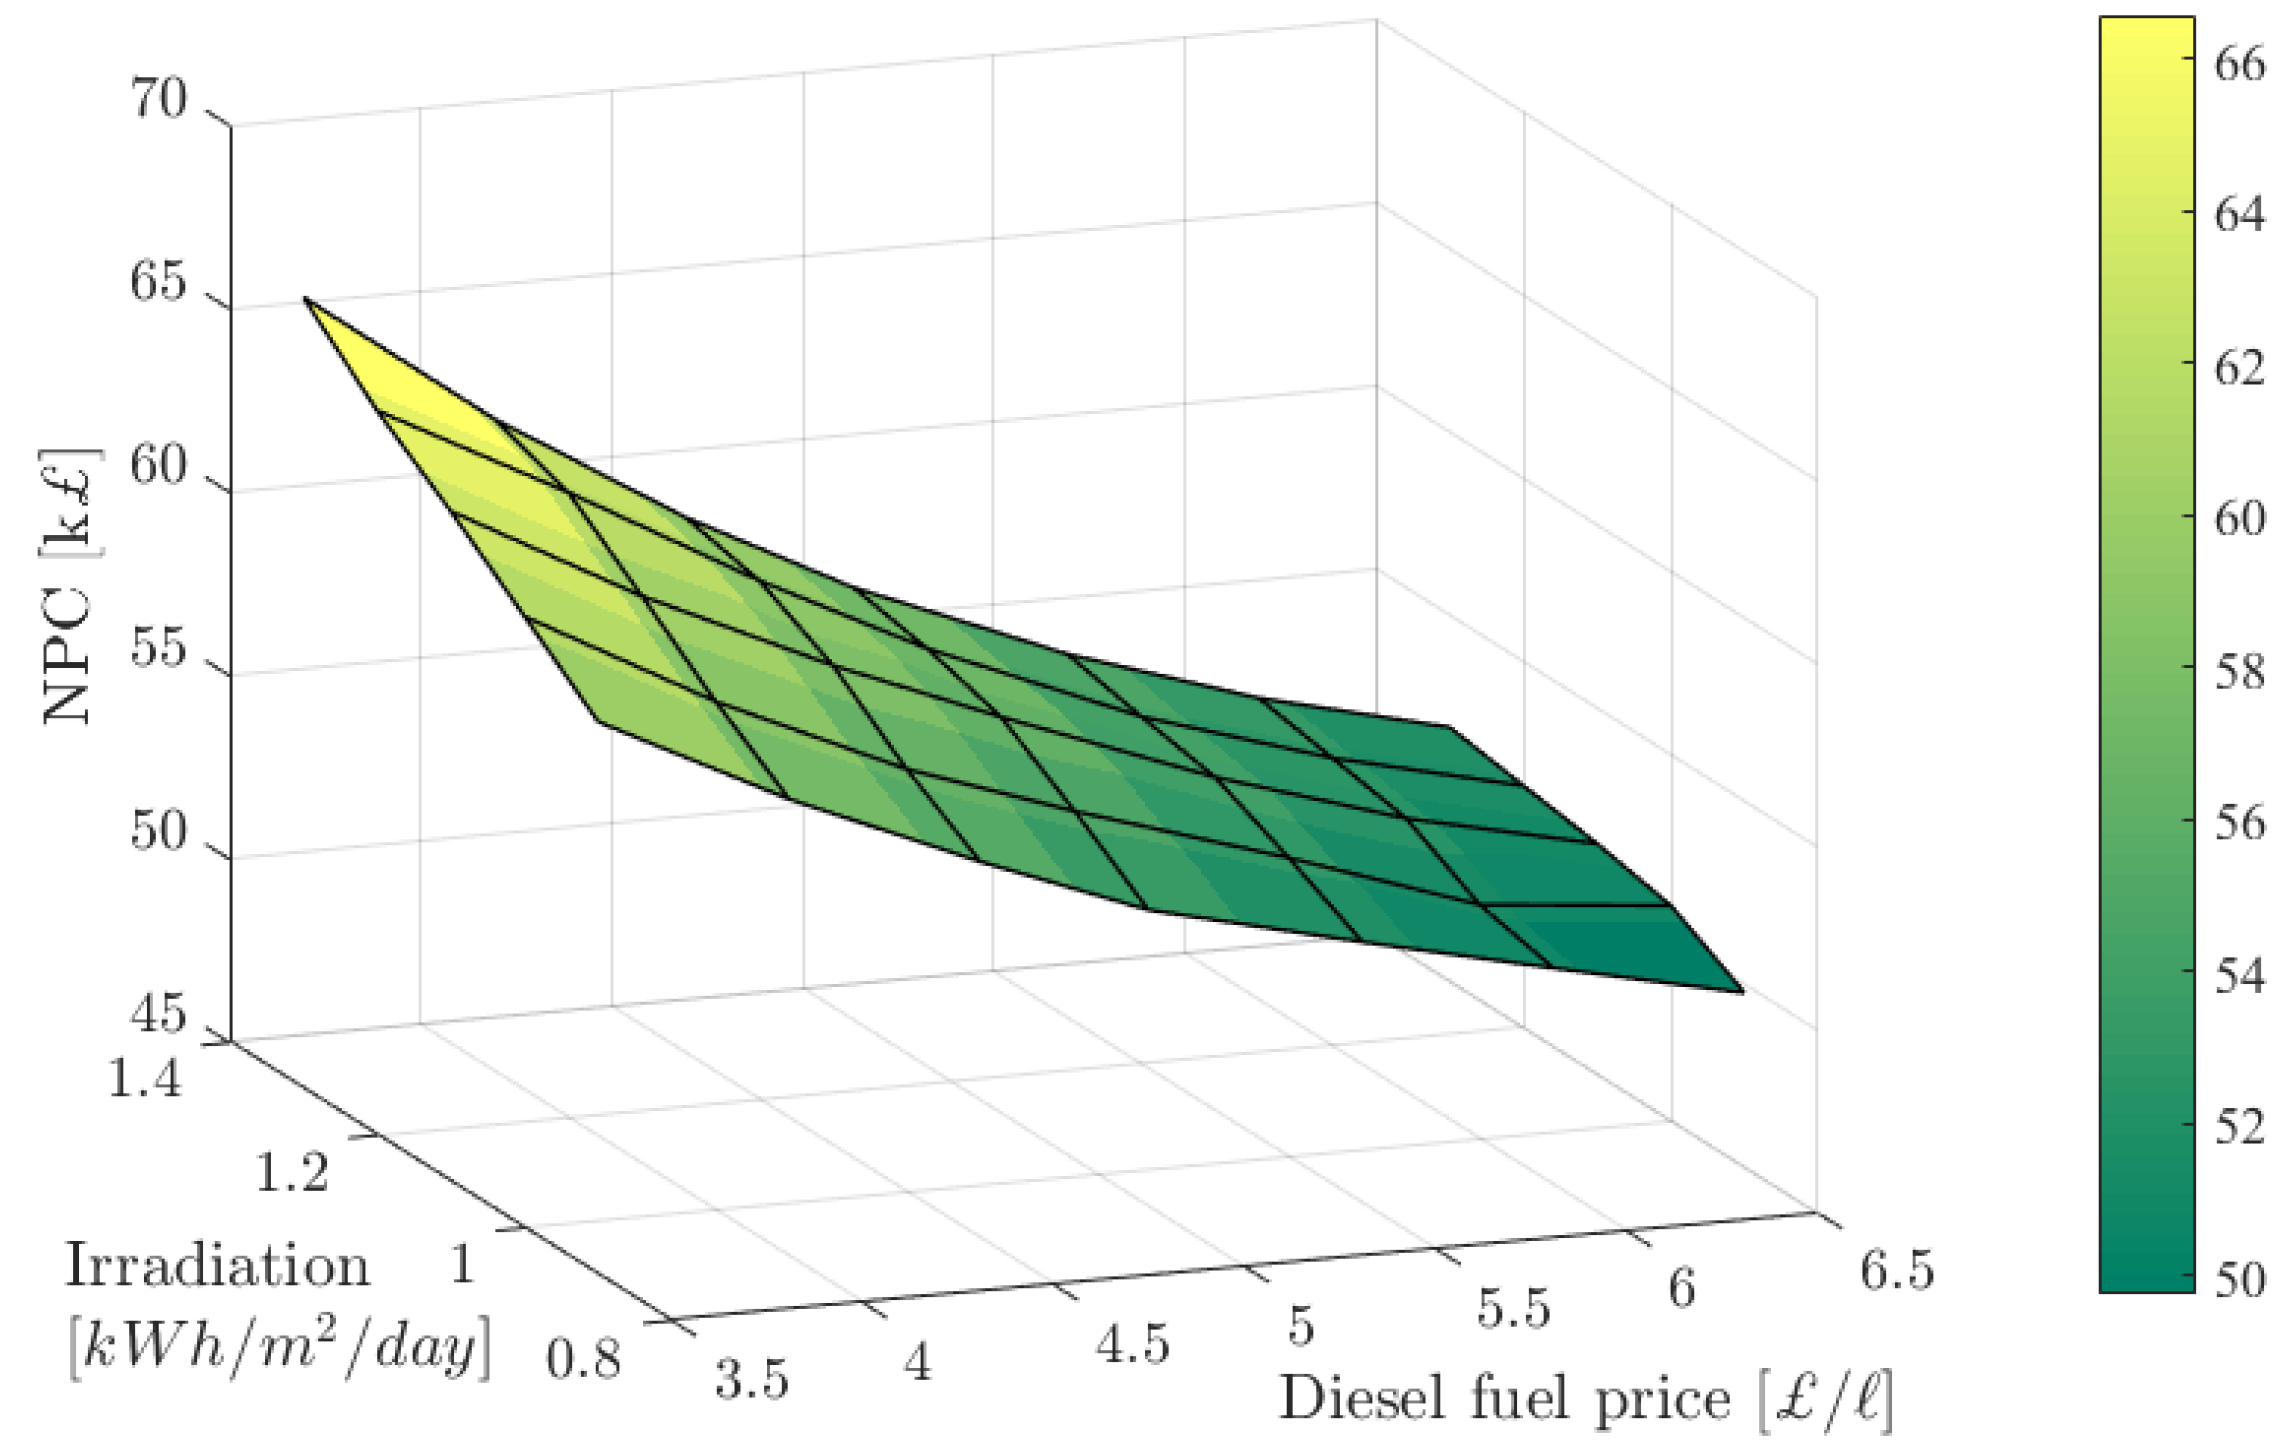
At this point, a more complicated sensitivity analysis was performed to evaluate the combined impact of two variables, diesel fuel price and solar irradiation (since these two variables dictate the conventional and non-conventional generation respectively). The selected values are tabulated in
Table 6. The optimiser has conducted 70,765 simulations, and only 53,125 have been found to satisfy the imposed constraints (i.e., Equations (2)–(5)).
Figure 9 indicates that increased solar irradiation and decreased fuel prices can lead to significantly reduced total NPC.
5.2. Discussion on the HOMER Pro Optimisation Platform
In the previous paragraphs, optimisation results obtained by HOMER Pro were presented demonstrating the optimal system design for the autonomous MG under consideration, as well as a thorough sensitivity analysis referring to fuel price and solar resource variation. HOMER Pro exhibits computational effectiveness due to its non-derivative optimisation, leading to significantly reduced computational times when performing the aforementioned simulations. Specifically, using an Intel® CoreTM i5 2.50 GHz (Intel Corporation, Santa Clara, CA, USA), the simulation for the optimal system design takes 20 s, whereas, for the two sensitivity analyses, it takes 200 and 1950 s respectively throughout thousands of simulations.
However, the optimisation performed in HOMER Pro is highly simplistic resulting in the loss of vital information. Firstly, HOMER Pro does not capture voltage and frequency variations due to the lack of an AC optimal power flow (OPF) algorithm. Hence, no transients can be analysed. This can be especially critical in studying the integration of intermittent power generation into the future power systems. Furthermore, since a detailed AC OPF algorithm is not included, no contingencies can be considered in the analysis (e.g., loss of lines, sudden load increase or generation loss, etc.). This again proves to be crucial in investigating stability issues, which future power systems may face when the penetration of intermittent generation is high. In fact, HOMER Pro does not include power flow equations at all; therefore, no line losses can be captured, which could also be critical in analysing distribution systems. The same applies for reactive power consumption.
Even though HOMER Pro does have some advantages when designing small-scale microgrid networks (mainly used for residential or community purposes as in the case study presented here), the aforementioned points indicate that it lacks the capability to perform a deep investigation of more complex systems which require stability analysis, capture of losses and reactive power production, etc. In a subsequent publication, an enhanced design tool utilising a fully developed AC OPF algorithm will be proposed to address the limitations listed above.
6. Conclusions
This paper was concerned with the design of an autonomous microgrid system intended for use in a residential application. For ensuring a highly accurate solution, the loads were analysed and appropriate load curves were constructed for a 12-month period. The primary objective was the minimisation of the total NPC of the overall system, while no load shedding was allowed amongst a few other technical constraints. The optimisation procedure evaluated thousands of design choices ranging from various capacities of the selected energy resources and converter as well as two types of batteries combining different technical characteristics and capital costs. The analysis concluded that, for the given loads, the best system design is the one comprised of a PV array with a capacity of 15.3 kW, a 17 kW diesel generator, 57 kWh of lead-acid batteries, and a converter with a power rating of 6.93 kW; the total NPC of this system equals £56,264. Additionally, the carbon emissions were calculated, and the study indicated that the optimal system design corresponds also to the system with the least carbon emissions; this is a non-negligible factor towards improving the environmental conditions. The optimal solution supports the argument that, for such applications with no possibility of grid connection, a hybrid system constitutes a cheaper and enviromentally friendly solution compared to the solution comprising of a standalone diesel generator. Additionally, a sensitivity analysis relating to diesel prices and solar irradiation was performed. The analysis concluded that these two parameters are characterised by an inversely proportional relationship, while showing that diesel fuel price increase leads to an increase of the PV array and converter rating.
Finally, a theoretical discussion aimed at shedding light on some limitations of the commercially available optimisation tool used in this study (i.e., HOMER Pro). A subsequent publication will present an enhanced design tool including a fully developed AC OPF that addresses all limitations discussed.

 ,
, 


