Experimental Investigation of Impact Localization in Composite Plate Using Newly Developed Imaging Method


Department of Mechanical Engineering, University of South Carolina, 300 Main Street, Columbia, SC 29208, USA
*
Author to whom correspondence should be addressed.
Inventions 2018, 3(3), 59; https://doi.org/10.3390/inventions3030059
Submission received: 3 August 2018
/
Revised: 21 August 2018
/
Accepted: 22 August 2018
/
Published: 27 August 2018
(This article belongs to the Special Issue Structural Health Monitoring and Their Applications Across Industry)
Abstract
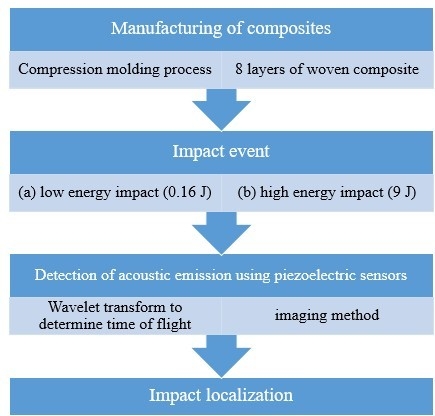
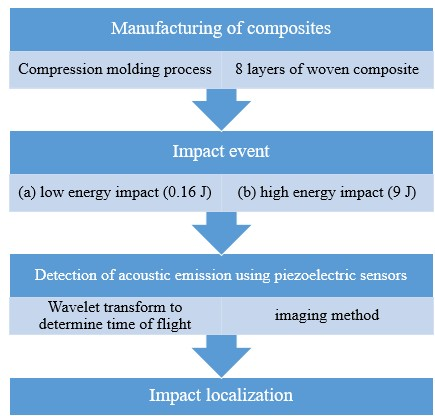
:This paper focuses on impact localization of composite structures, which possess more complexity in the guided wave propagation due to the anisotropic behavior of composite materials. In this work, a composite plate was manufactured by using a compression molding process with proper pressure and temperature cycle. Eight layers of woven composite prepreg were used to manufacture the composite plate. A structural health monitoring (SHM) technique was implemented with piezoelectric wafer active sensors (PWAS) to detect and localize the impact on the plate. There were two types of impact event that were considered in this paper (a) low energy impact event (b) high energy impact event. Two clusters of sensors recorded the guided acoustic waves generated from the impact. The acoustic signals were then analyzed using a wavelet transform based time-frequency analysis. The proposed SHM technique successfully detected and localized the impact event on the plate. The experimentally measured impact locations were compared with the actual impact locations. An immersion ultrasonic scanning method was used to visualize the composite plate before and after the impact event. A high frequency 10 MHz 1-inch focused transducer was used to scan the plate in the immersion tank. Scanning results showed that there was no visible manufacturing damage in the composite plate. However, clear impact damage was observed after the high-energy impact event.
1. Introduction
Advanced composites are increasingly being used in many applications [1,2,3,4]. However, the prognosis of their long-term behavior is still an active area of research. The ability to predict functional life depends on characterizing and predicting the evolution of the material state of the structure (e.g., distributed damage development, accumulation, and interaction) which affect global property (strength and stiffness) degradation and eventual failure. The lack of monitoring of that local damage often results in empiricism, limiting innovation in the use of composite materials. Therefore, appropriate nondestructive inspection (NDI) and structural health monitoring (SHM) technique are in urgent need of composites structure [5,6,7]. The maintenance costs associated with the aging infrastructure are becoming an ongoing concern. In addition to the maintenance cost, downtime of those structures makes the economy more inviable. SHM may alleviate this economy barrier by (a) assessing the state of the structure beforehand and do the on-site maintenance with minimum downtime and (b) ensuring increased safety and reliability while reducing maintenance costs. For new structures, the embedded sensors and sensing systems from the design stage are likely to reduce the overall life-cycle cost [8]. SHM has been implemented for composites using a built-in sensor network [8,9,10] and real-time pipeline integrity monitoring [11].
The acoustic events can result from many different sources such as (a) the impact of a foreign object (bird strike, debris hit) [12]; (b) fatigue crack generation in the structures [13]; (c) matrix cracking, fiber breakage and/or delamination of the composites. The detection, localization, and sizing of the damage from all these events is an essential area of SHM [14,15,16]. These acoustic events mostly generate the waves in an ultrasonic regime [17]. These waves propagate in the structures and carry the information of the acoustic events. Taking these factors into account, we propose the research question of: how can one capture these waves and extract damage-related information?
Undetected impact damage has a long track record of causing severe failure to composite structures. The impact damage from airport debris have caused Concord to fly miserably and have led to disasters. Hitting by debris or any foreign object is very common for moving structures, and after any such hits, the structure should be adequately inspected especially near the impact location. Therefore, this impact location must be identified by an appropriate acoustic source localization method. After identifying the impact region, a more careful active SHM should be performed to conclude the severity of the damage caused by such impact [18,19]. Active SHM has been implemented to quantify the damage [20], and a non-contact approach has been implemented in pipeline defects [21]. However, these studies mainly focused on aluminum alloys.
In this research, a comprehensive study has been carried out starting from manufacturing the composite plate to final impact detection and localization using the SHM approach. A composite plate was manufactured from woven carbon fabric prepreg by using a compression molding process. An SHM was implemented to detect and localize the impact event by using permanently bonded piezoelectric wafer active sensors in the manufactured composite plate. We found that the experimental measurements were in adequate agreement with the actual impact localization. The manufactured composite plate was tested nondestructively using immersion ultrasonic scanning. The scanning results showed that the plate had a minimal to no manufacturing defect that could affect the impact detection and localization.
2. Composite Plate Manufacturing Using Compression Molding Process
Polyphenylene Sulfide (PPS) fabric prepreg (TC1100) from TenCate Cetex was used to manufacture the thermoplastic composite (TPC) plate. The PPS prepreg was a pre-consolidated reinforced laminate with continuous woven carbon fibers. TC1100 was a pre-consolidated reinforced laminate (RTL), utilizing continuous woven carbon fibers (Carbon T300 3K).
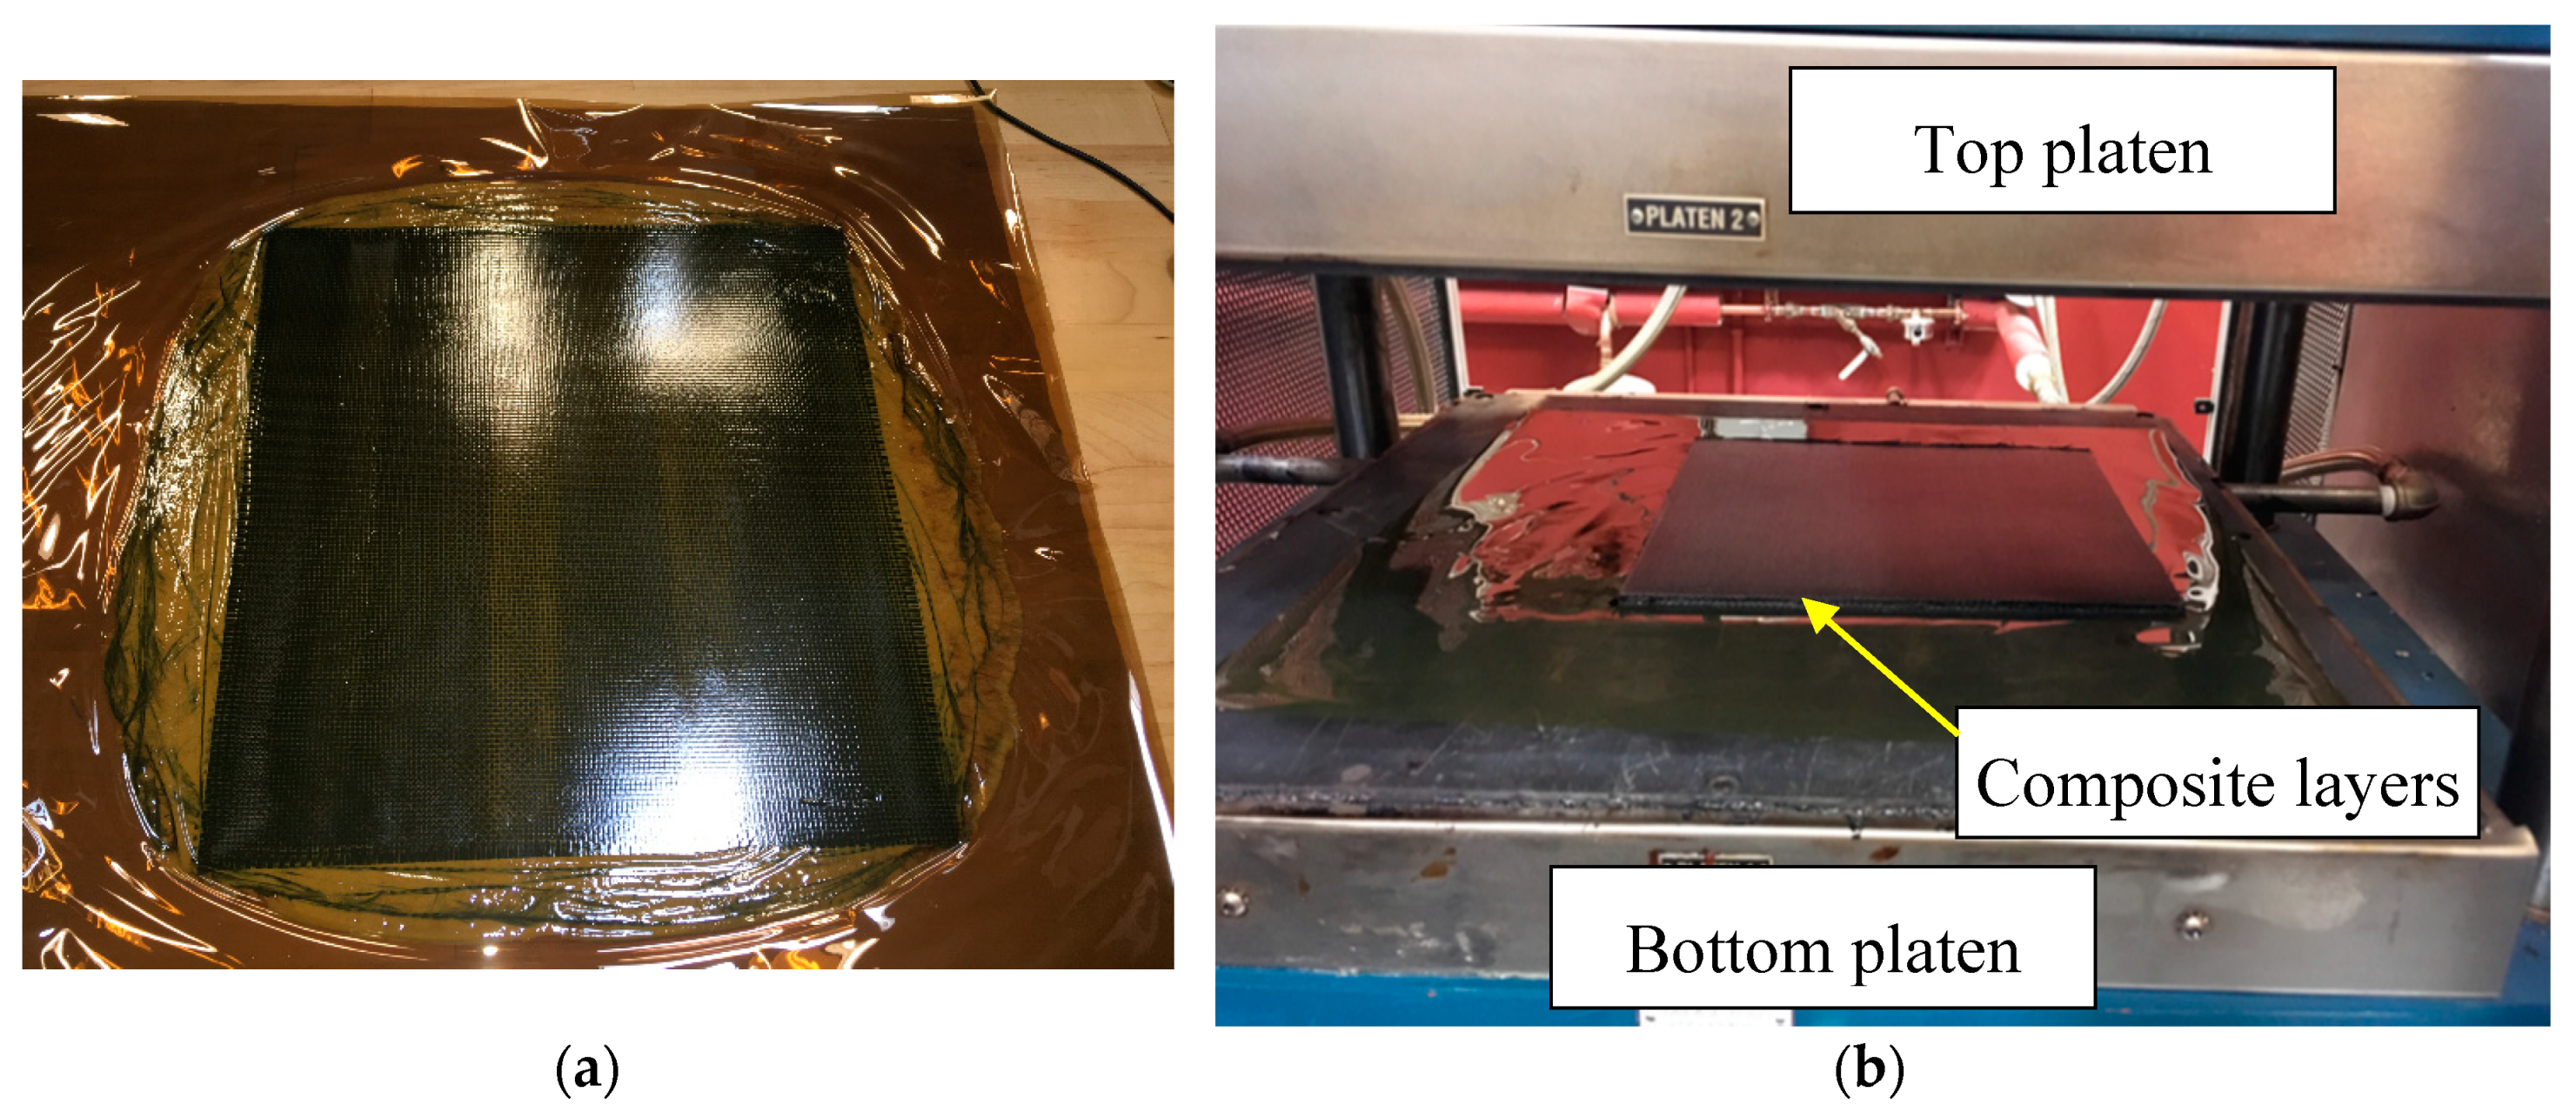
The prepreg was cut to the desired shape (square in this case) with a dimension of 305 mm by 305 mm (12 inches by 12 inches). Each cutting section served as a layer. Eight layers of woven fabric were then stacked upon each other to form a laminate. Two thin protective films of plastics with a very high melting point were used on top and bottom of the stack up (Figure 1a). The laminate of eight layers was then placed between two flat platens of the compression-molding machine, as shown in Figure 1b. The melting temperature of the PPS fabric was 536 0F. A cure cycle must contain a temperature higher than the melting point for proper melting and the flow of the resin. Figure 2a shows a standard cure cycle used for this laminate. A constant pressure of 150 psi was applied during the cure cycle. Heating was adjusted in the compression-molding chamber for raising the laminate temperature to 610 0F within 45 min. Then the temperature of the laminate dwelled at 610 0F for 30 min. At the end of dwell time, the laminate was air cooled from 610 0F to room temperature in 30 min. After the cure cycle completed in about 2 h, the laminate was taken out from the platen. The extra resin flow at the edges of the laminate was trimmed. Figure 2b shows the final composite laminate after the trimming process. The resulting plate had a thickness of 1.6 mm. The dimension of the final composite plate was 387 mm by 276 mm (11.3 inches by 10.9 inches).
3. Impact Detection and Localization Using Structural Health Monitoring Technique
The impact is a common damage situation that can occur in real-life structures. In this experiment, a structural health monitoring (SHM) technique is implemented to detect and localize the impact. Six lead zirconate titanate (PZT) piezoelectric wafer active sensors (PWAS) are permanently bonded to the composite plate. Each PWAS transducer is 7-mm in diameter and 0.5-mm in thickness [22].
3.1. Developing Imaging Method
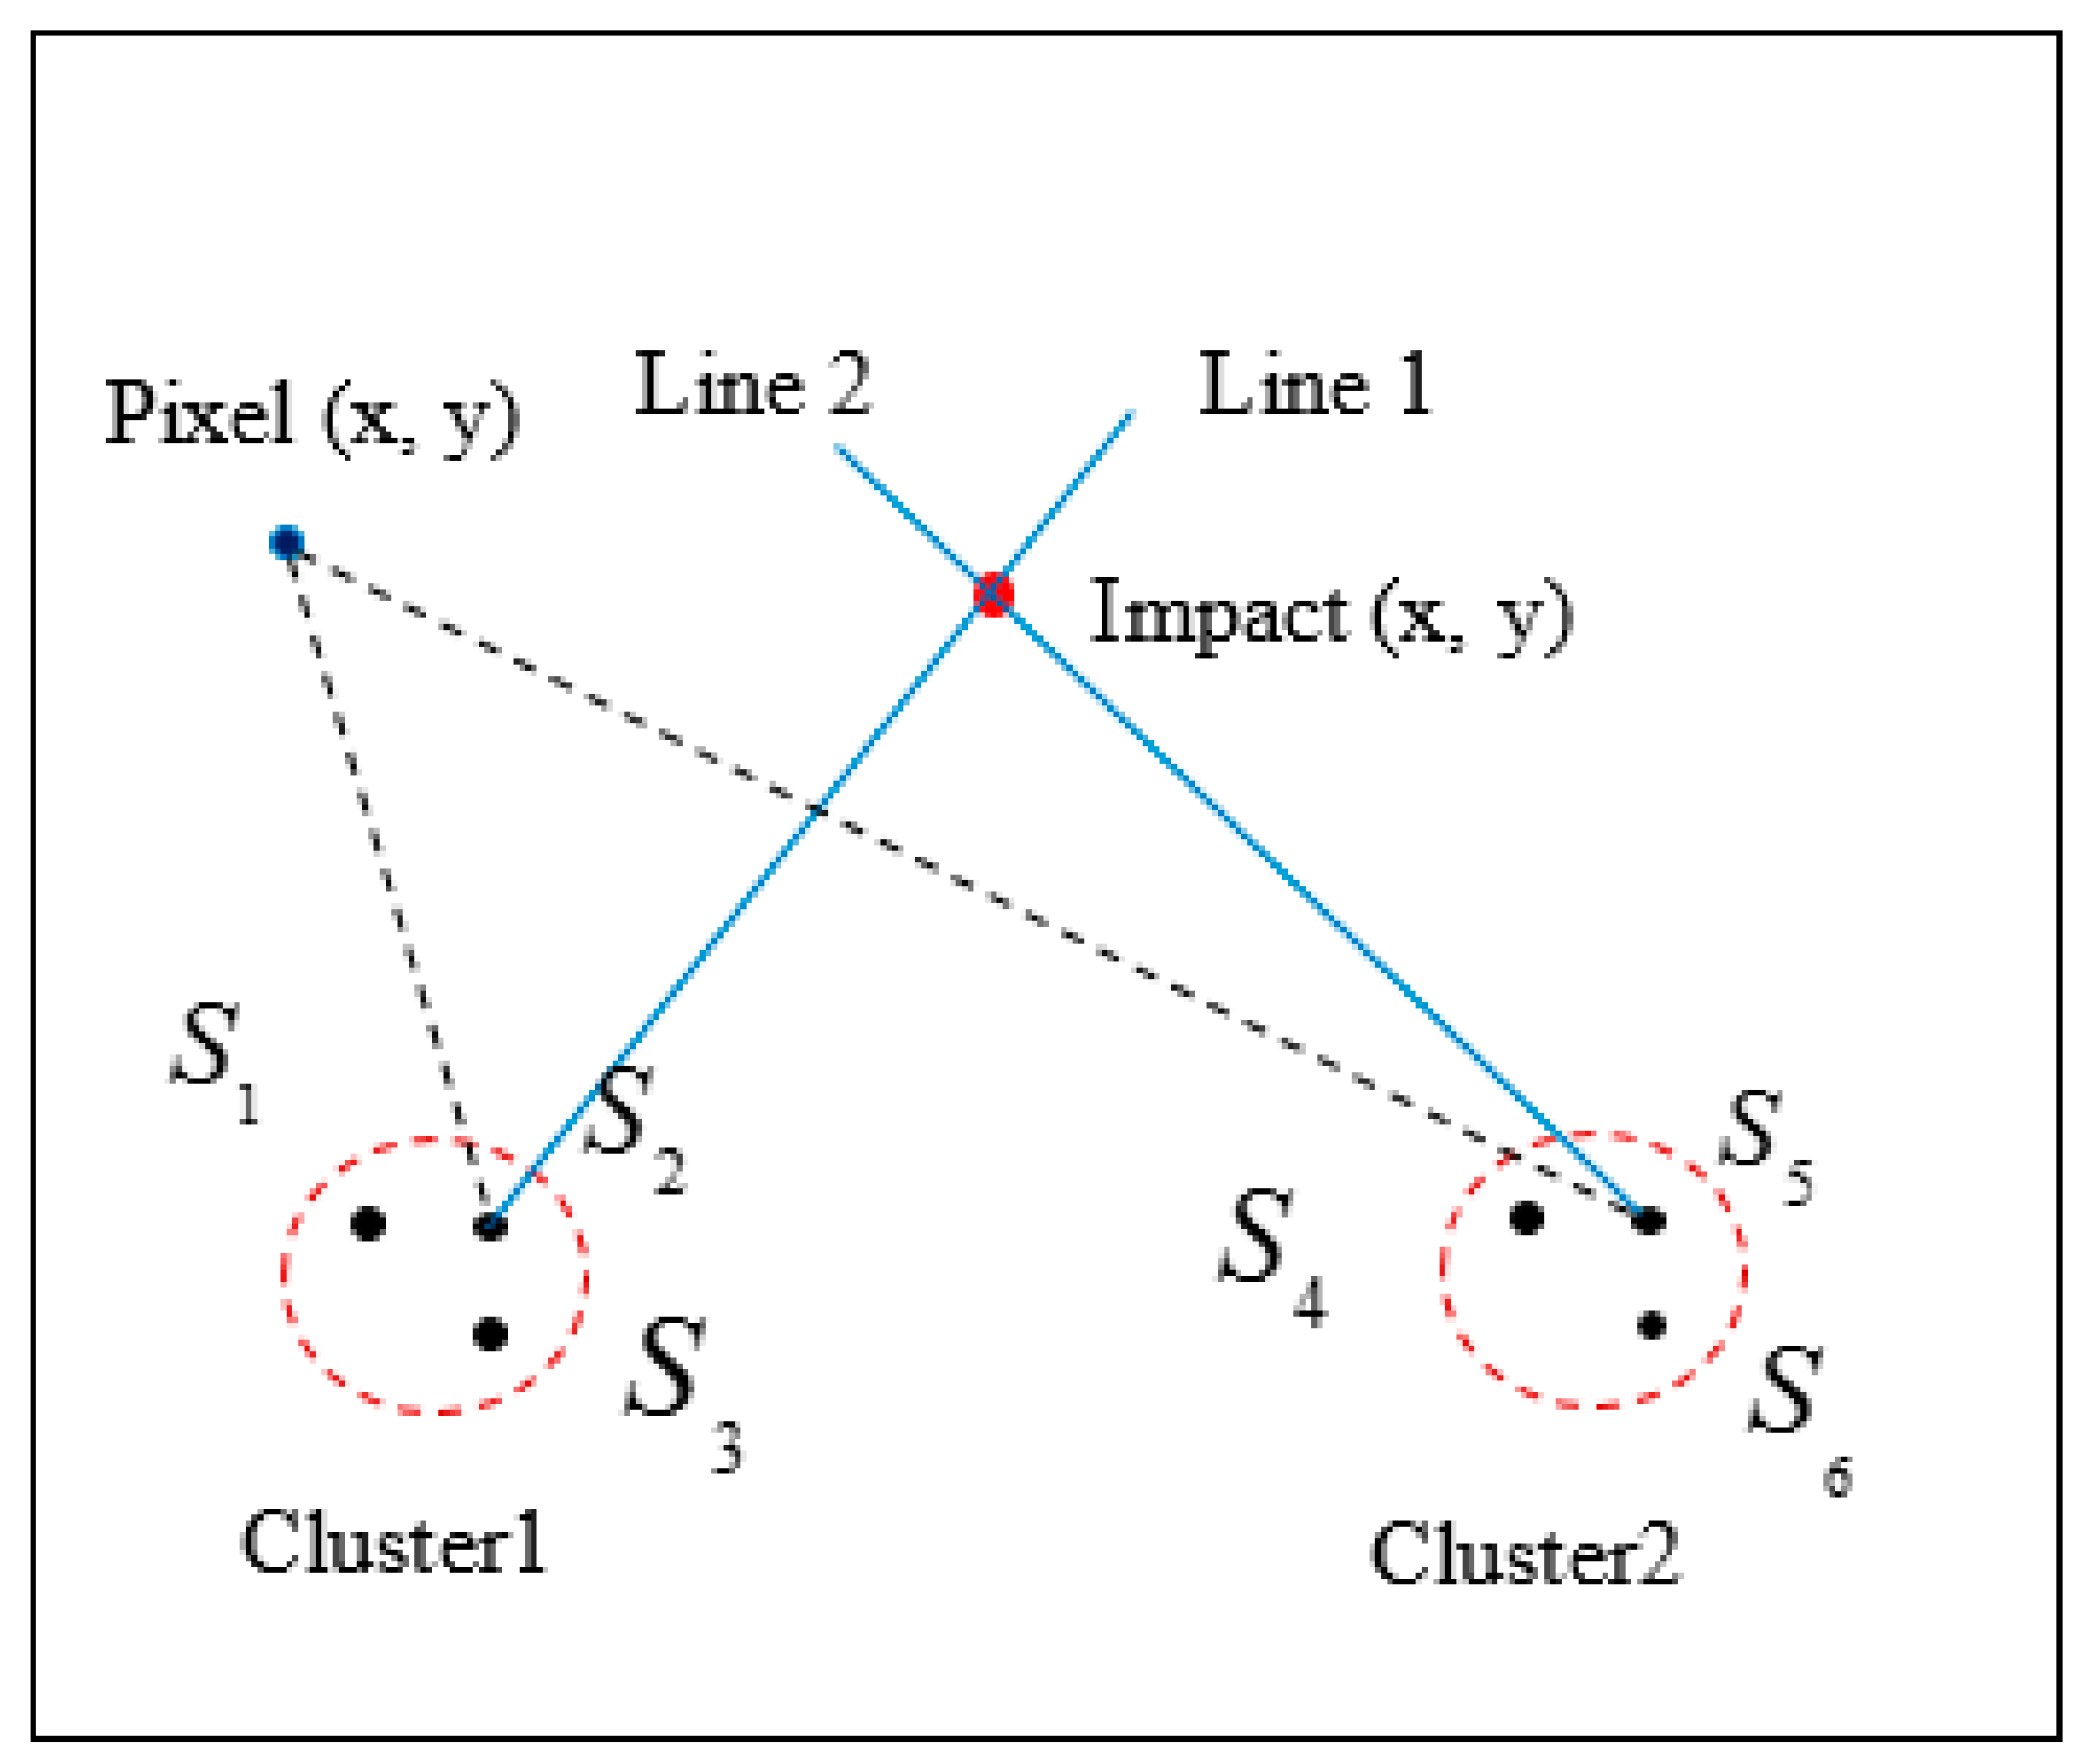
We developed a new imaging method of acoustic source localization in anisotropic plates due to the impact event. In this method, two clusters of sensors (every cluster has three sensors) were used to localize the impact points as shown in Figure 3. To localize the impact point using imaging methods, we divided the region of interest into small pixels. The first step of this imaging approach was to determine the slope values for every cluster based on the time of flight of impact signals received by the clusters sensors [23,24]
where and are slope values of Cluster1 and Cluster2. is the difference in time of flight between sensors and .
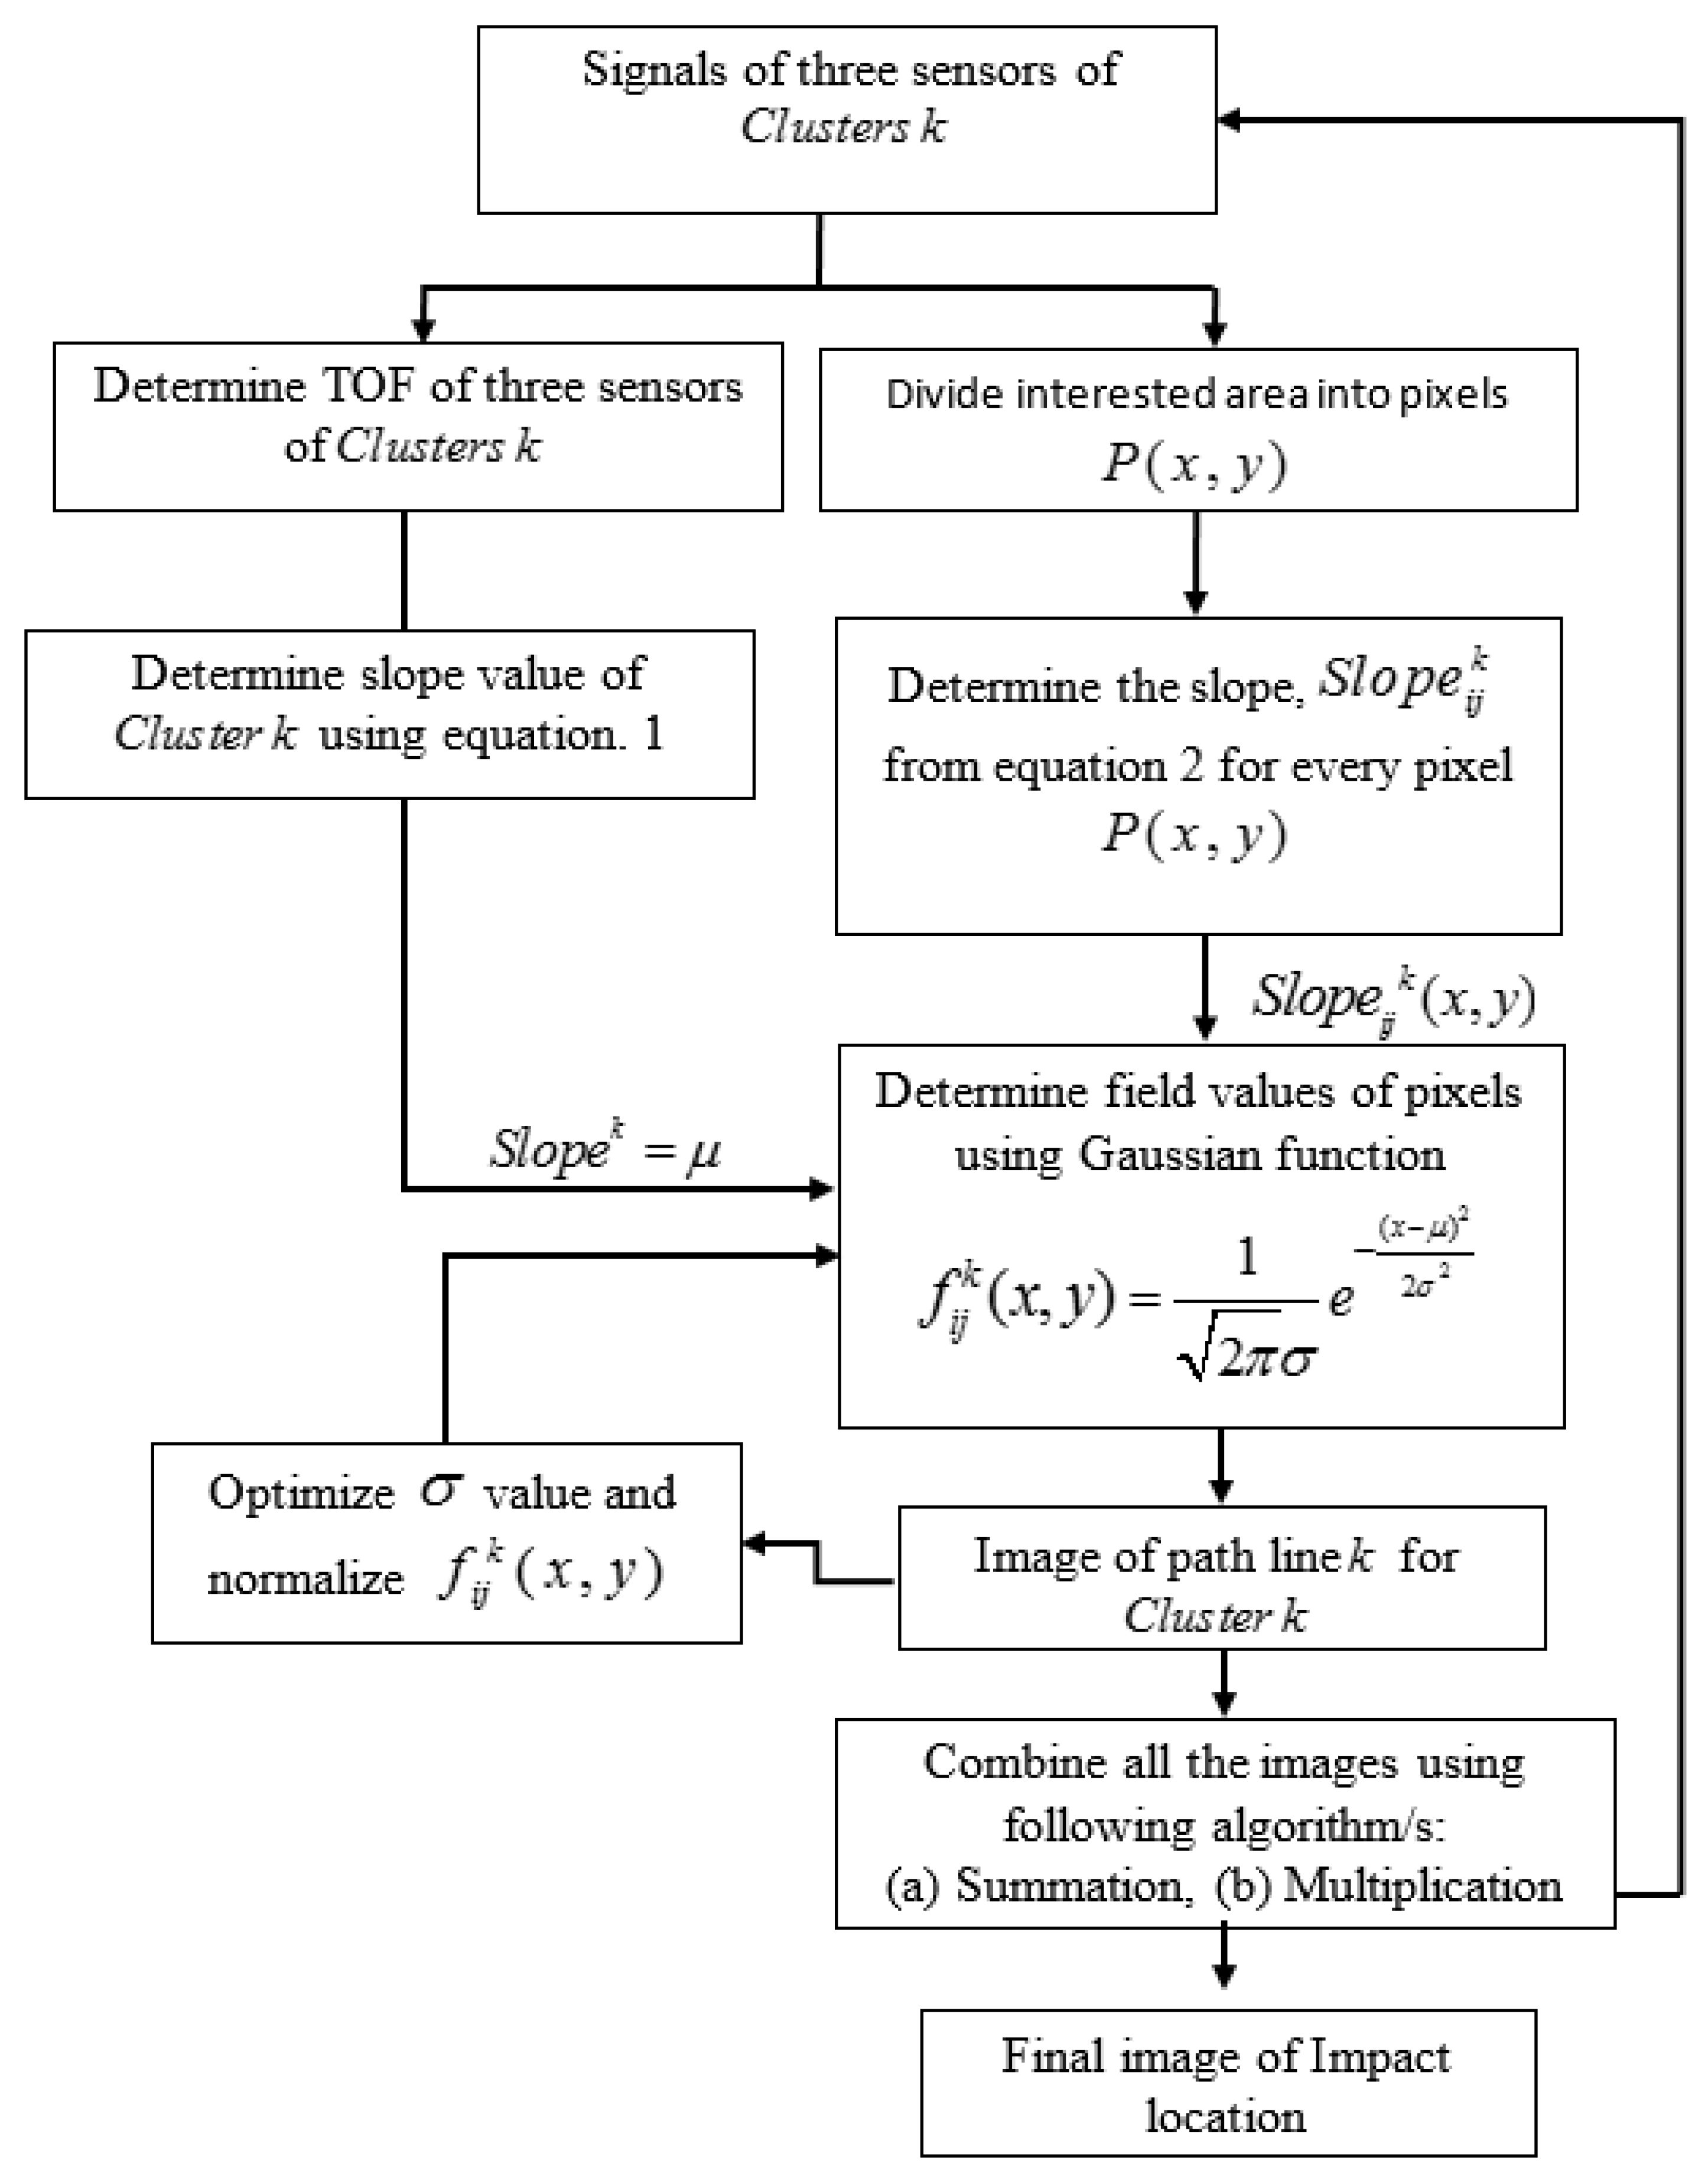
The second step was to determine the slope values for every pixel of the interested area for a particular sensing path line of a particular cluster as follow
where are the coordinates of sensors (in Cluster1) and (in Cluster2) respectively. To determine the pixels field values for every individual path, we used the Gaussian distribution equation
where is the field value of every pixels of the image for a particular sensing path line (for a particular cluster), represents the slope value at each pixels for the sensing path line of , represents the slope value for the sensing path line of which can be determined experimentally based on the time of flight values of cluster sensors. The standard deviation, which describes the variability or dispersion of a data set, was taken as a function of the slope value. In this work, the values were taken between 0.02–1 (the value needs to be increased with increasing slope value and vice versa). The represents the order of used cluster. To fuse all the images from different sensing paths, summation and/or multiplication algorithm were used [10,25] following the equations below:
where are the total field values of each pixels using a summation or multiplication algorithm. represents the total number of sensing path lines which equal to the total number of clusters. In this work, we have used two clusters. Two-line paths from each cluster are mapped over the pixels and intersected at the impact point as shown the Figure 3. Figure 4 shows the detail procedures of the imaging method.
3.2. SHM Experimental Setup for Impact Detection and Localization
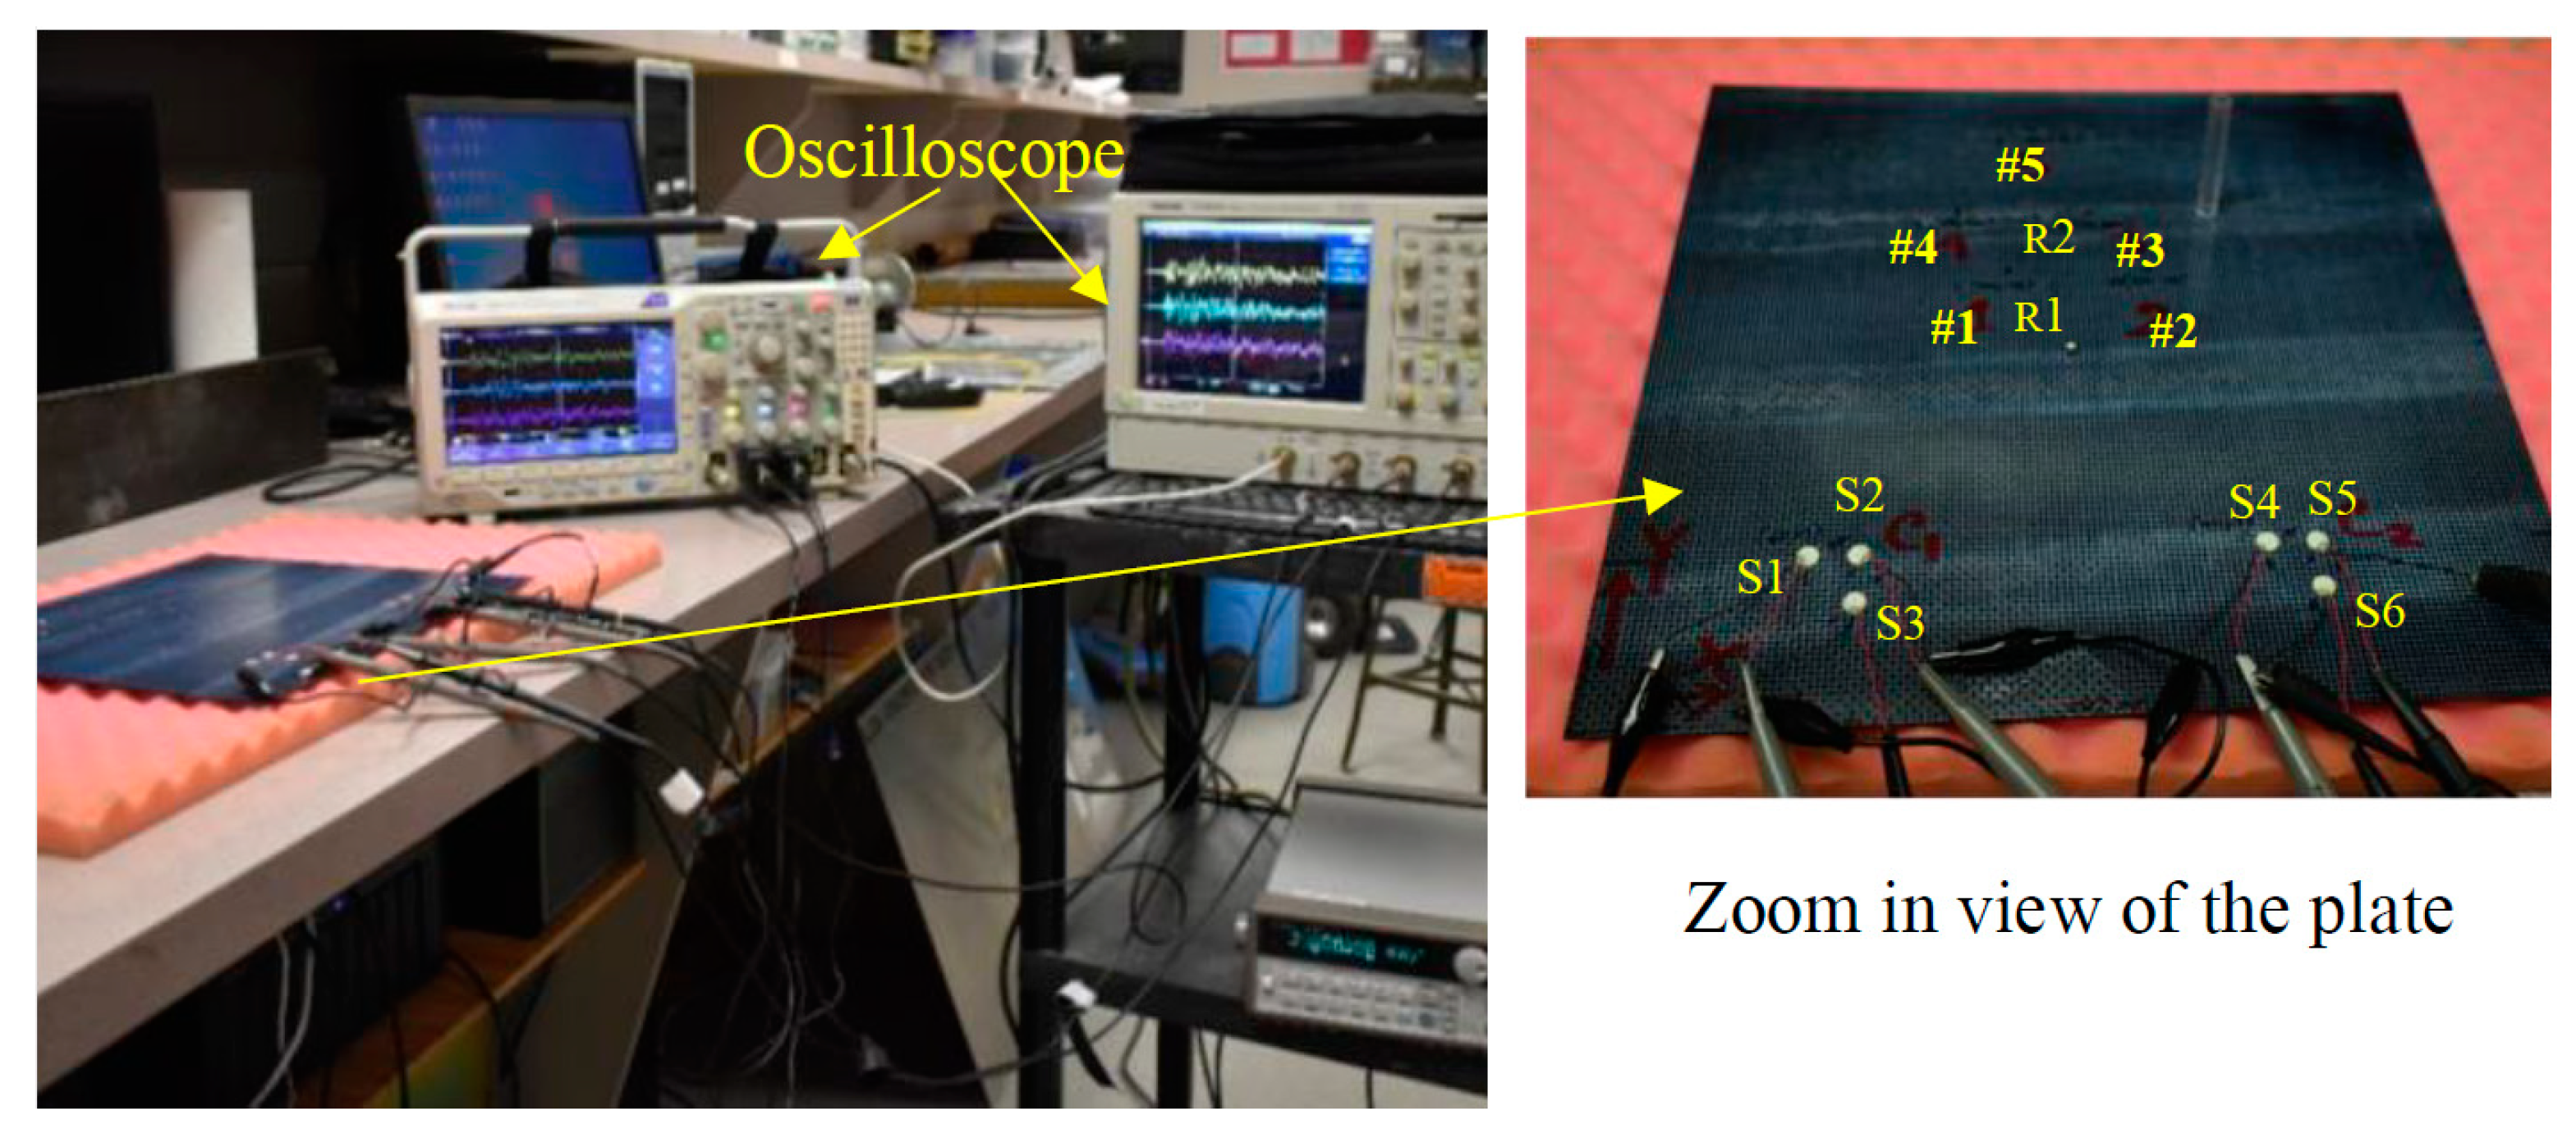
The experimental setup is shown in Figure 5. Two clusters of PWAS sensors were used as named Cluster1 (at coordinate location (60, 53)) and Cluster2 (at coordinate location (197, 53)). In each cluster, there were three PWAS transducers placed at 90 deg. Orientation. The configuration of these sensors are especially useful when one does not know the exact material properties of the plate. This method can accurately predict the location of the impact by analyzing the received signals by the sensors without knowing the material properties. Signals from an impact location were received through six sensors using two oscilloscopes (Figure 5).
3.3. Low-Energy Impact Method
The plate was subjected to impact by a steel ball at five different locations. The diameter of the steel ball was 4.5 mm. The weight of the steel ball was 0.33 kg. The steel ball was freely impacted from 0.05 m height following a special guide fixture to create 0.16 J impact of energy. The five impact locations were marked by #1, #2, #3, #4, and #5 in Figure 5. At each location, three impact events were created to check the repeatability of the test. When the steel ball hit the plate, it generated acoustic emissions. The energy of acoustic emission (AE) propagated as guided waves in the plate. The guided waves produced stress and strain waves in a plate. The permanently bonded PWAS transducers captured the strain waves. Since the six PWAS transducers were located at different distances, the time of flights (TOF) of the received signals was different.
3.3.1. Experimental Signal Analysis and Impact Detection
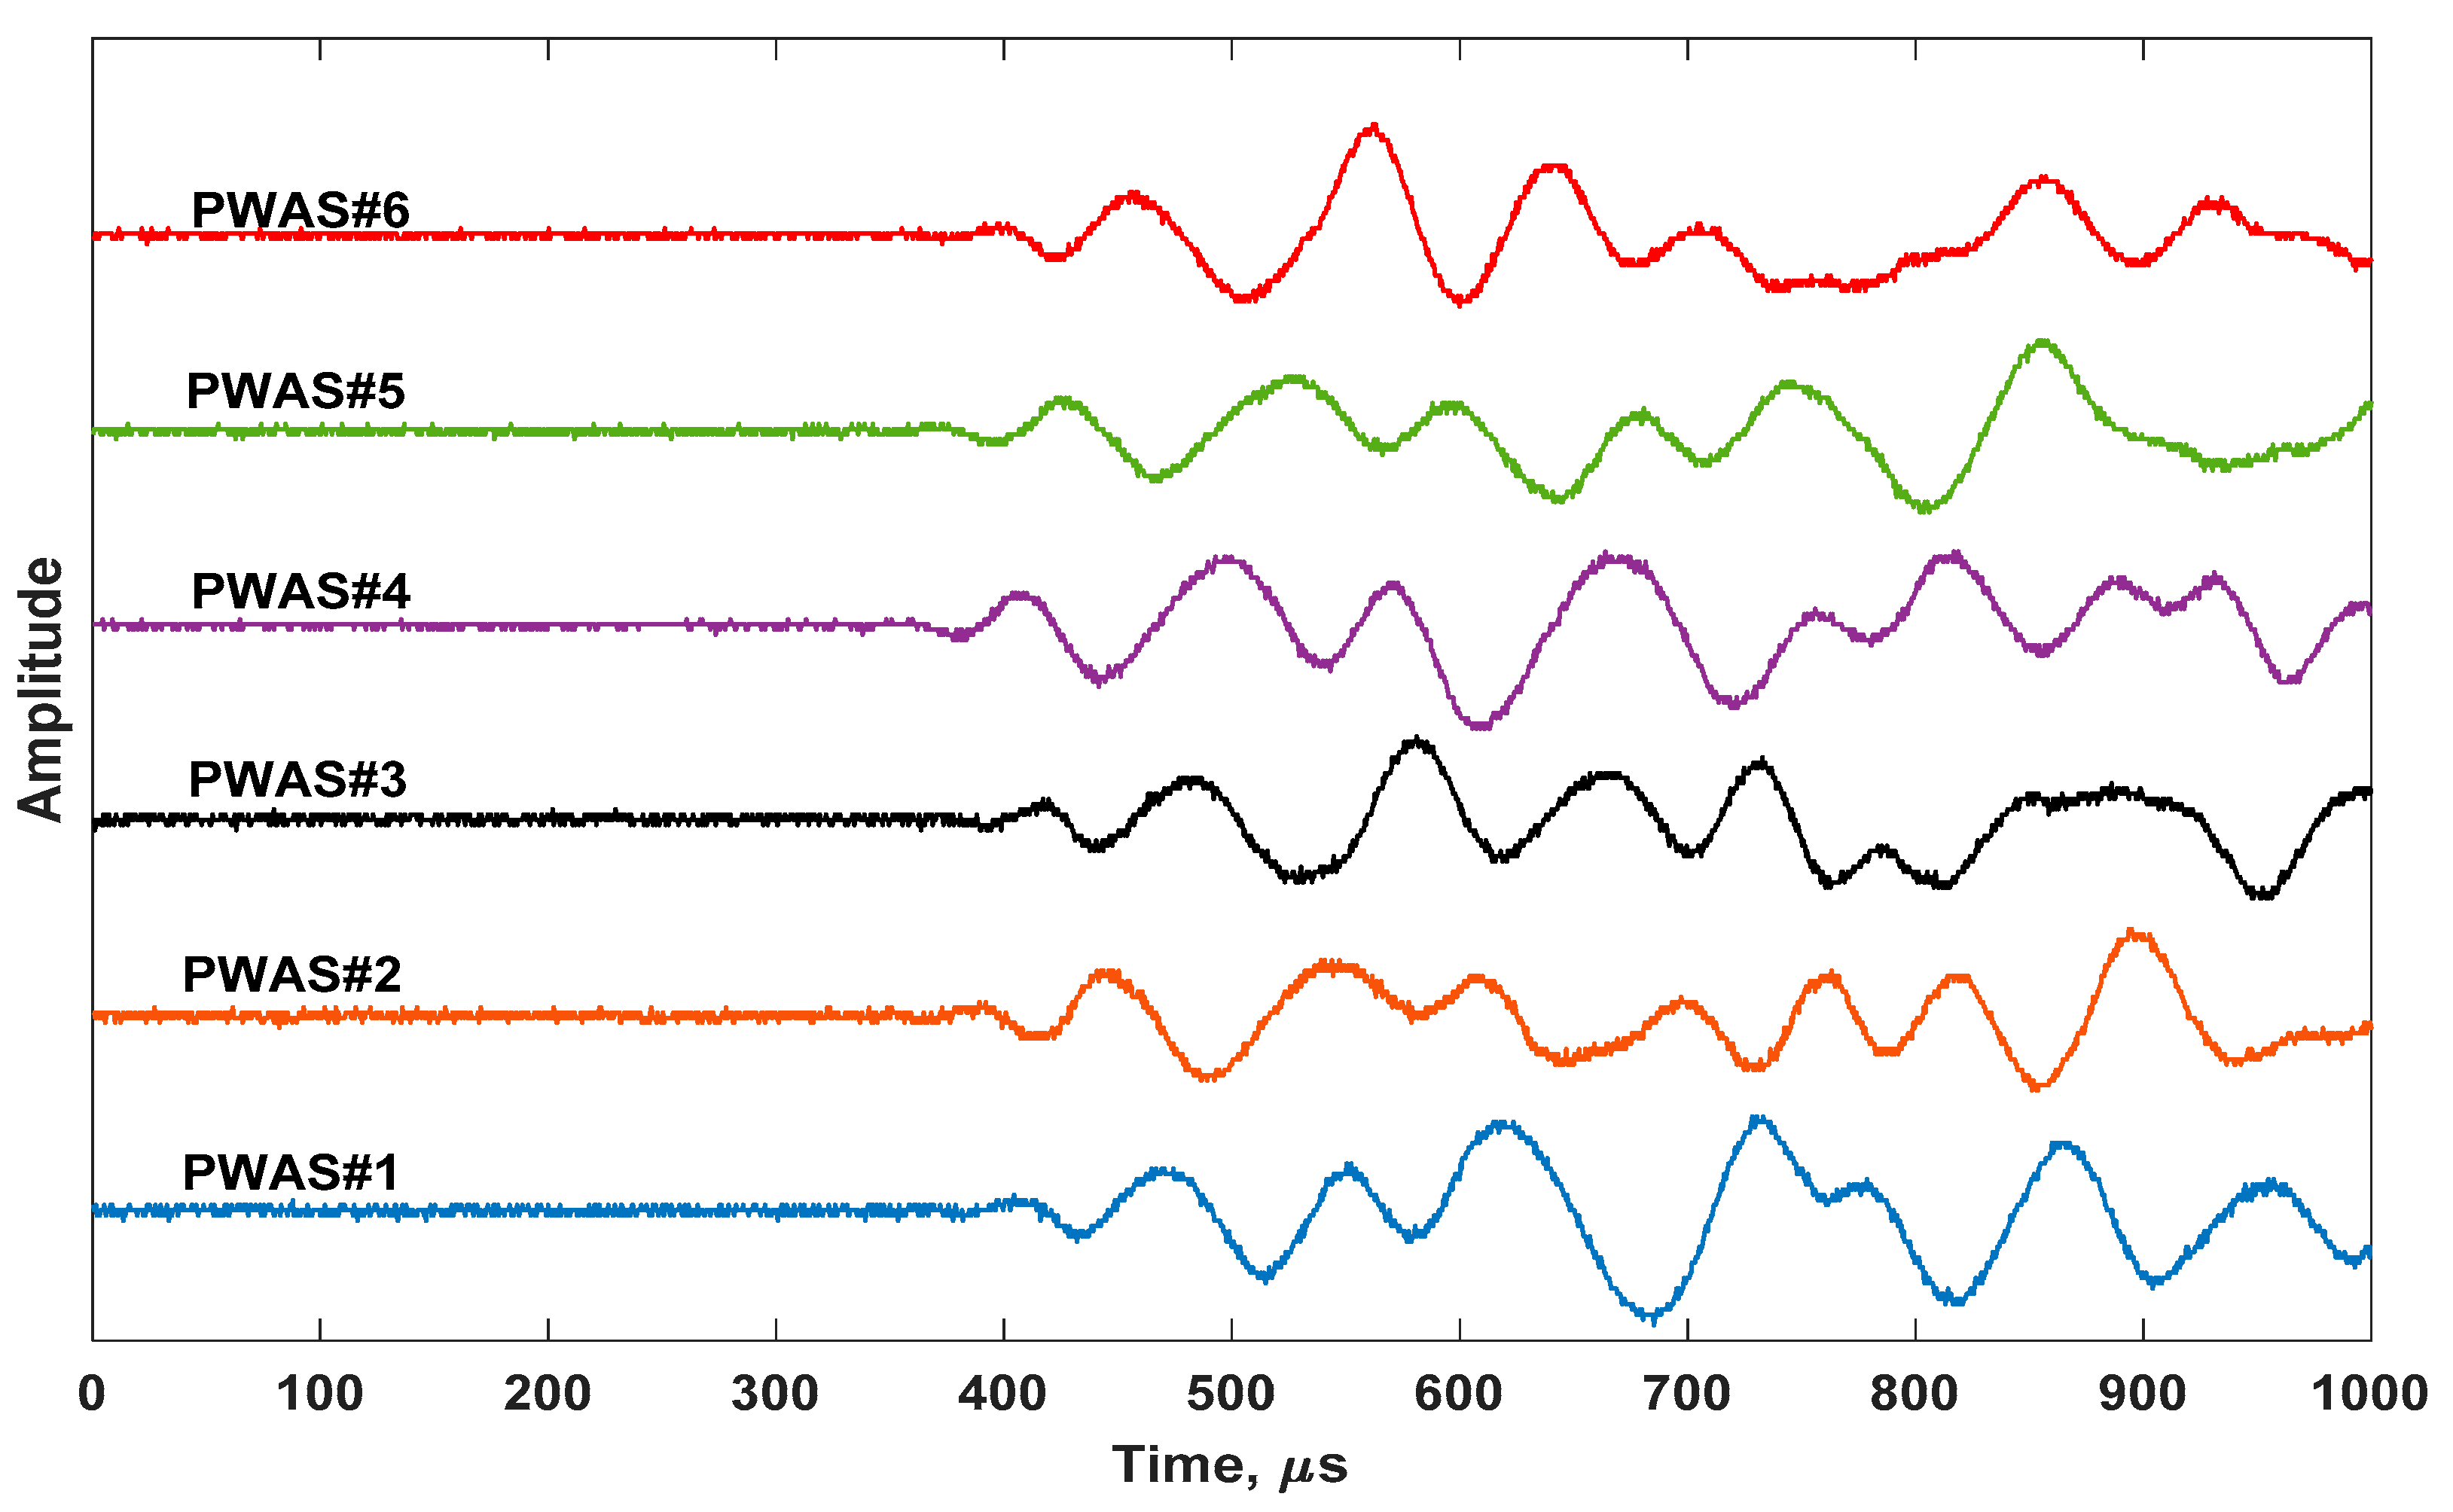
The six signals from the six sensors are illustrated in Figure 6. Figure 6 corresponds to the signals received from impact location #3. Only the low-energy impact at location #3 is presented here as a representative result. These signals received by the sensors indicate that there was an impact event. In this experiment, low energy impact (height was intentionally kept low) was used to show how sensitive the proposed SHM system is. In the case of high energy impact, it would be much easier to detect the impact event since it would produce higher amplitude AE signals.
3.3.2. Low-Energy Impact Localization
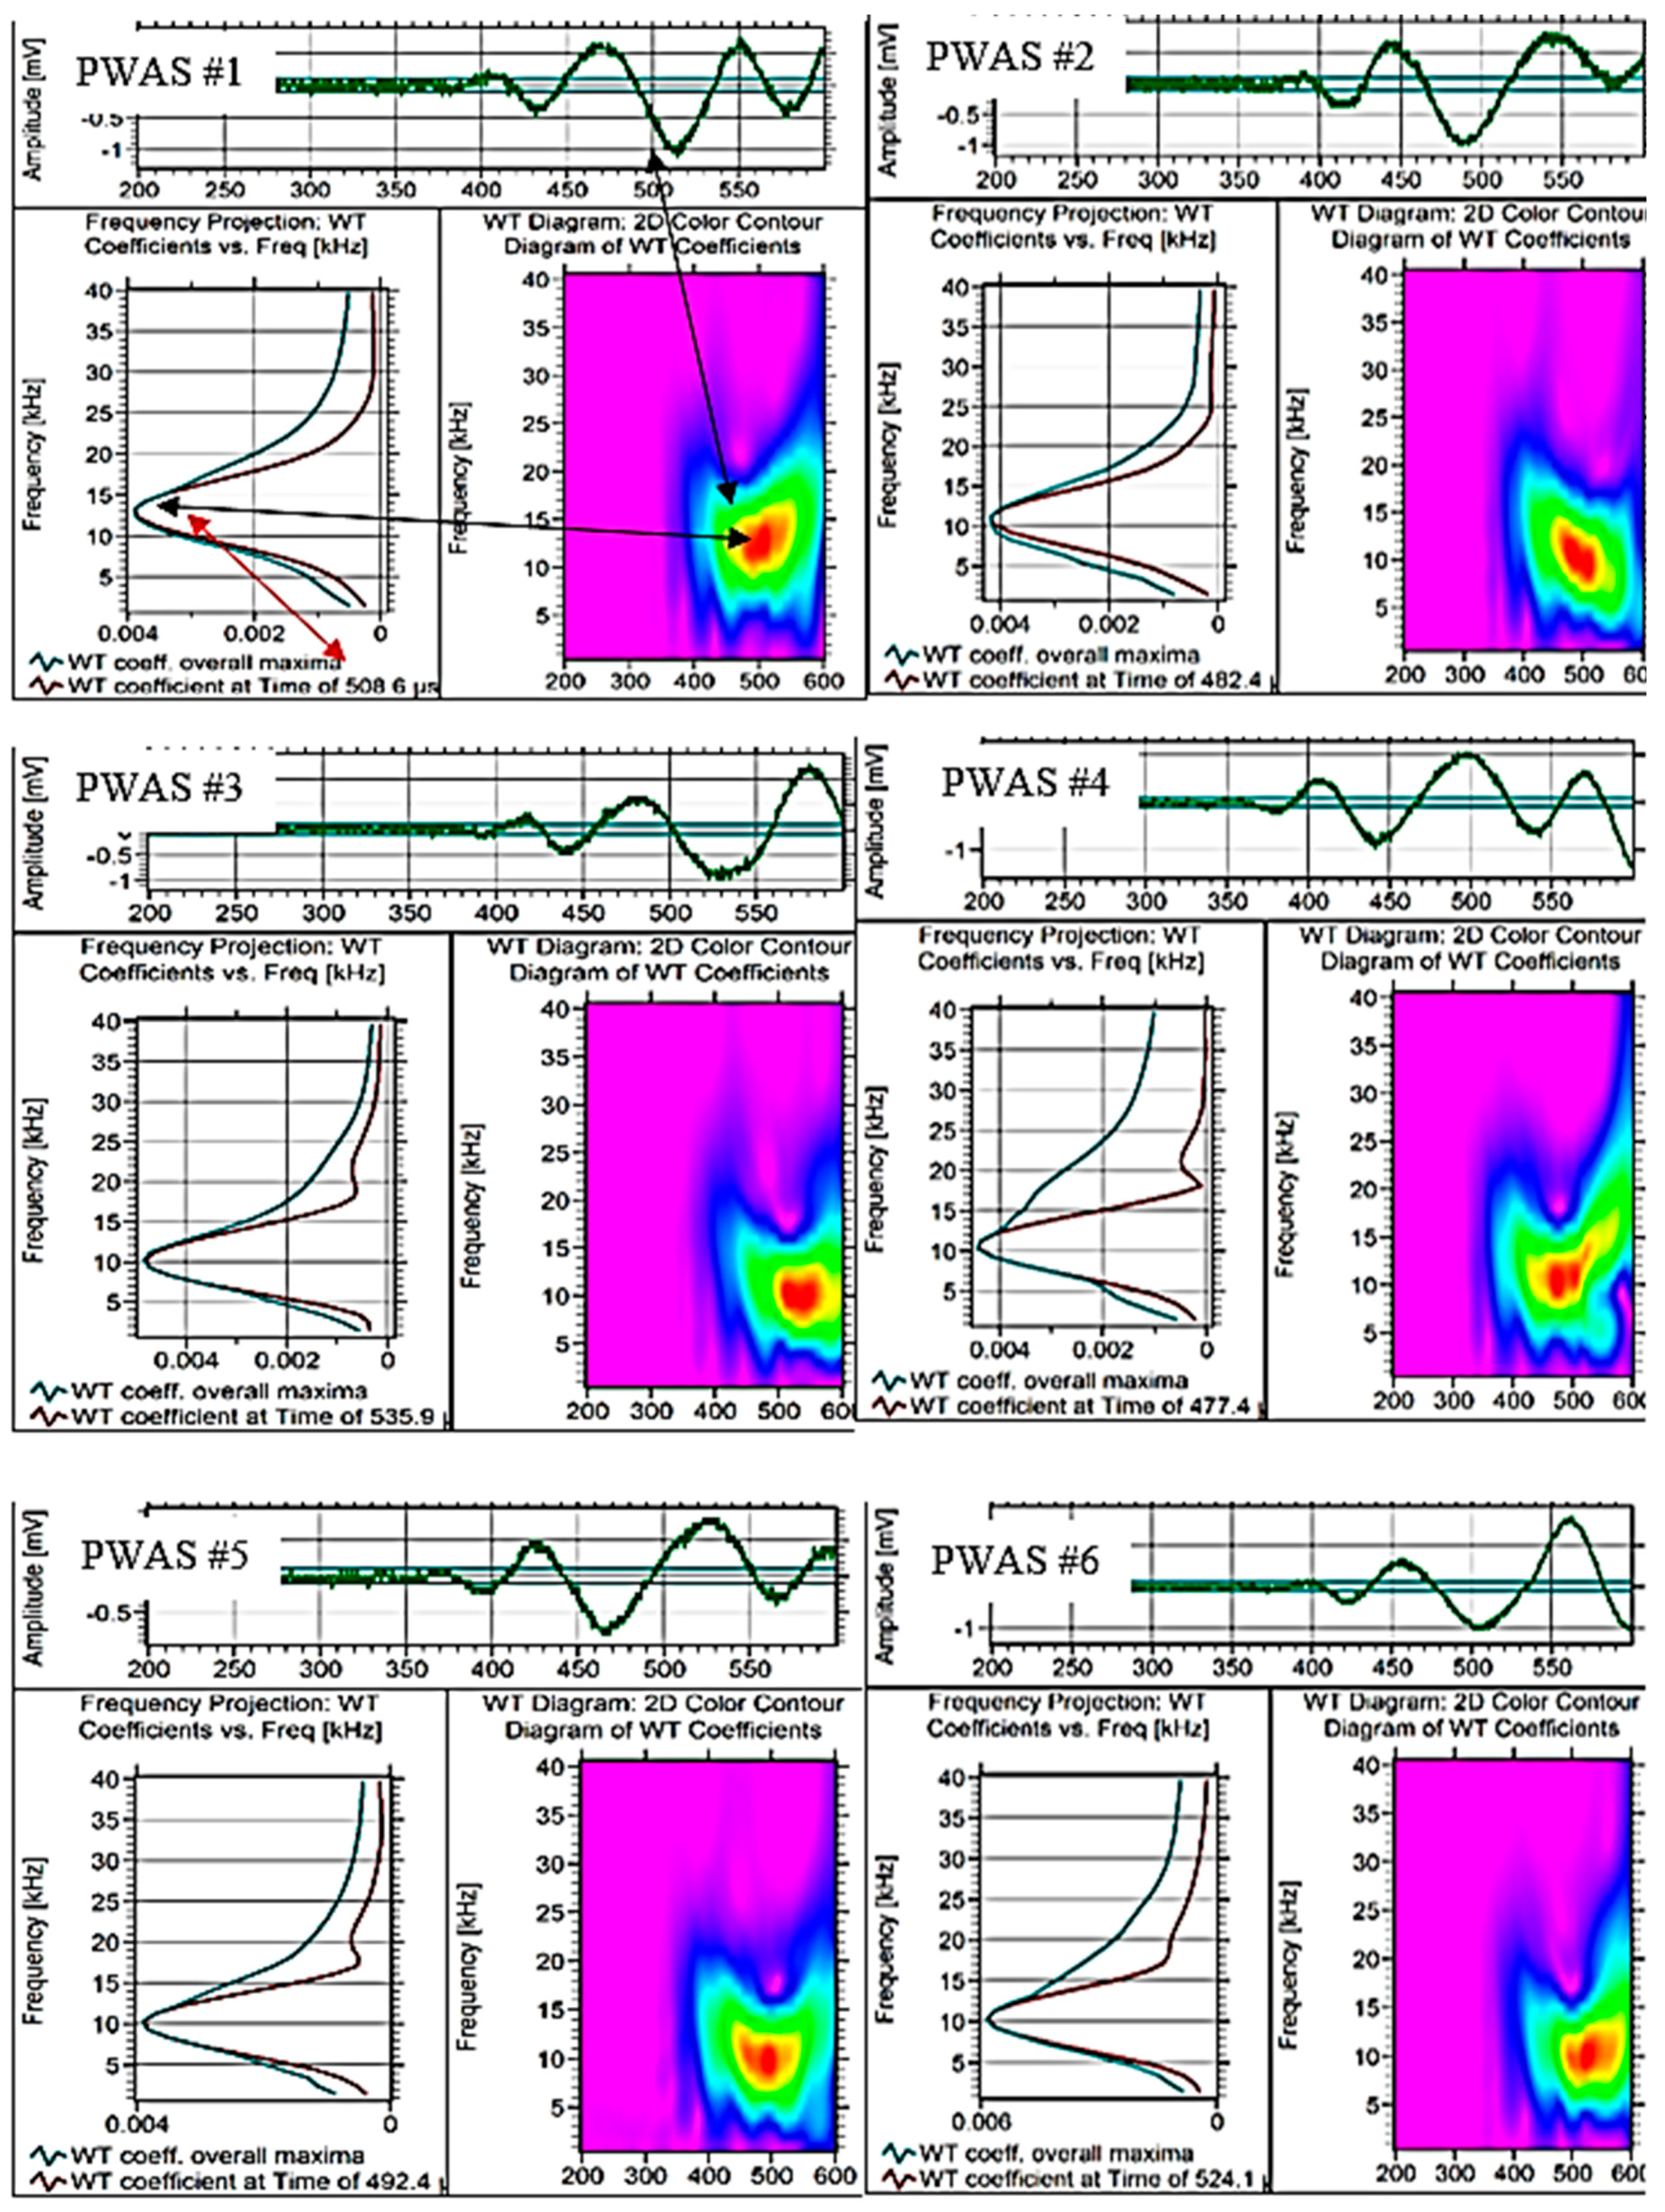
To localize the impact event in the plate, it is essential to determine the time-of-flight correctly. Just by looking at the time-domain signals, it is often hard to determine the time of flight (TOF). The accurate way is to use a signal processing method to determine TOF. A wavelet transform based method was used in this paper to determine the TOF. The wavelet transform based method is demonstrated in Figure 7. As an example, two PWAS signals received from impact event #3 are considered.
In wavelet transform (WT), adjustable windows can keep a better track of time and frequency information as compared to short-time Fourier transform (STFT), another popular method. WT can zoom in on short bursts and zoom out to detect long, slow oscillations by auto adjustment of the windows. Since the nature of the signal is unknown during an impact, WT provides more accurate information from the time-frequency analysis. A freeware Vallen software (version) [26] was used to perform WT on the signals. This program has a Gabor function as the “mother” wavelet.
The WT diagrams in Figure 7 show the frequency-time plot using the WT. It shows the amplitude mapping over various frequencies and time. At each time and frequency, a WT coefficient variation can be plotted as shown on the bottom-left of each box. An overall maximum of the WT coefficient has been plotted. The time at which the WT profile matches the overall WT maxima provide the TOF. This process has been repeated for all PWAS signals to determine the TOFs.
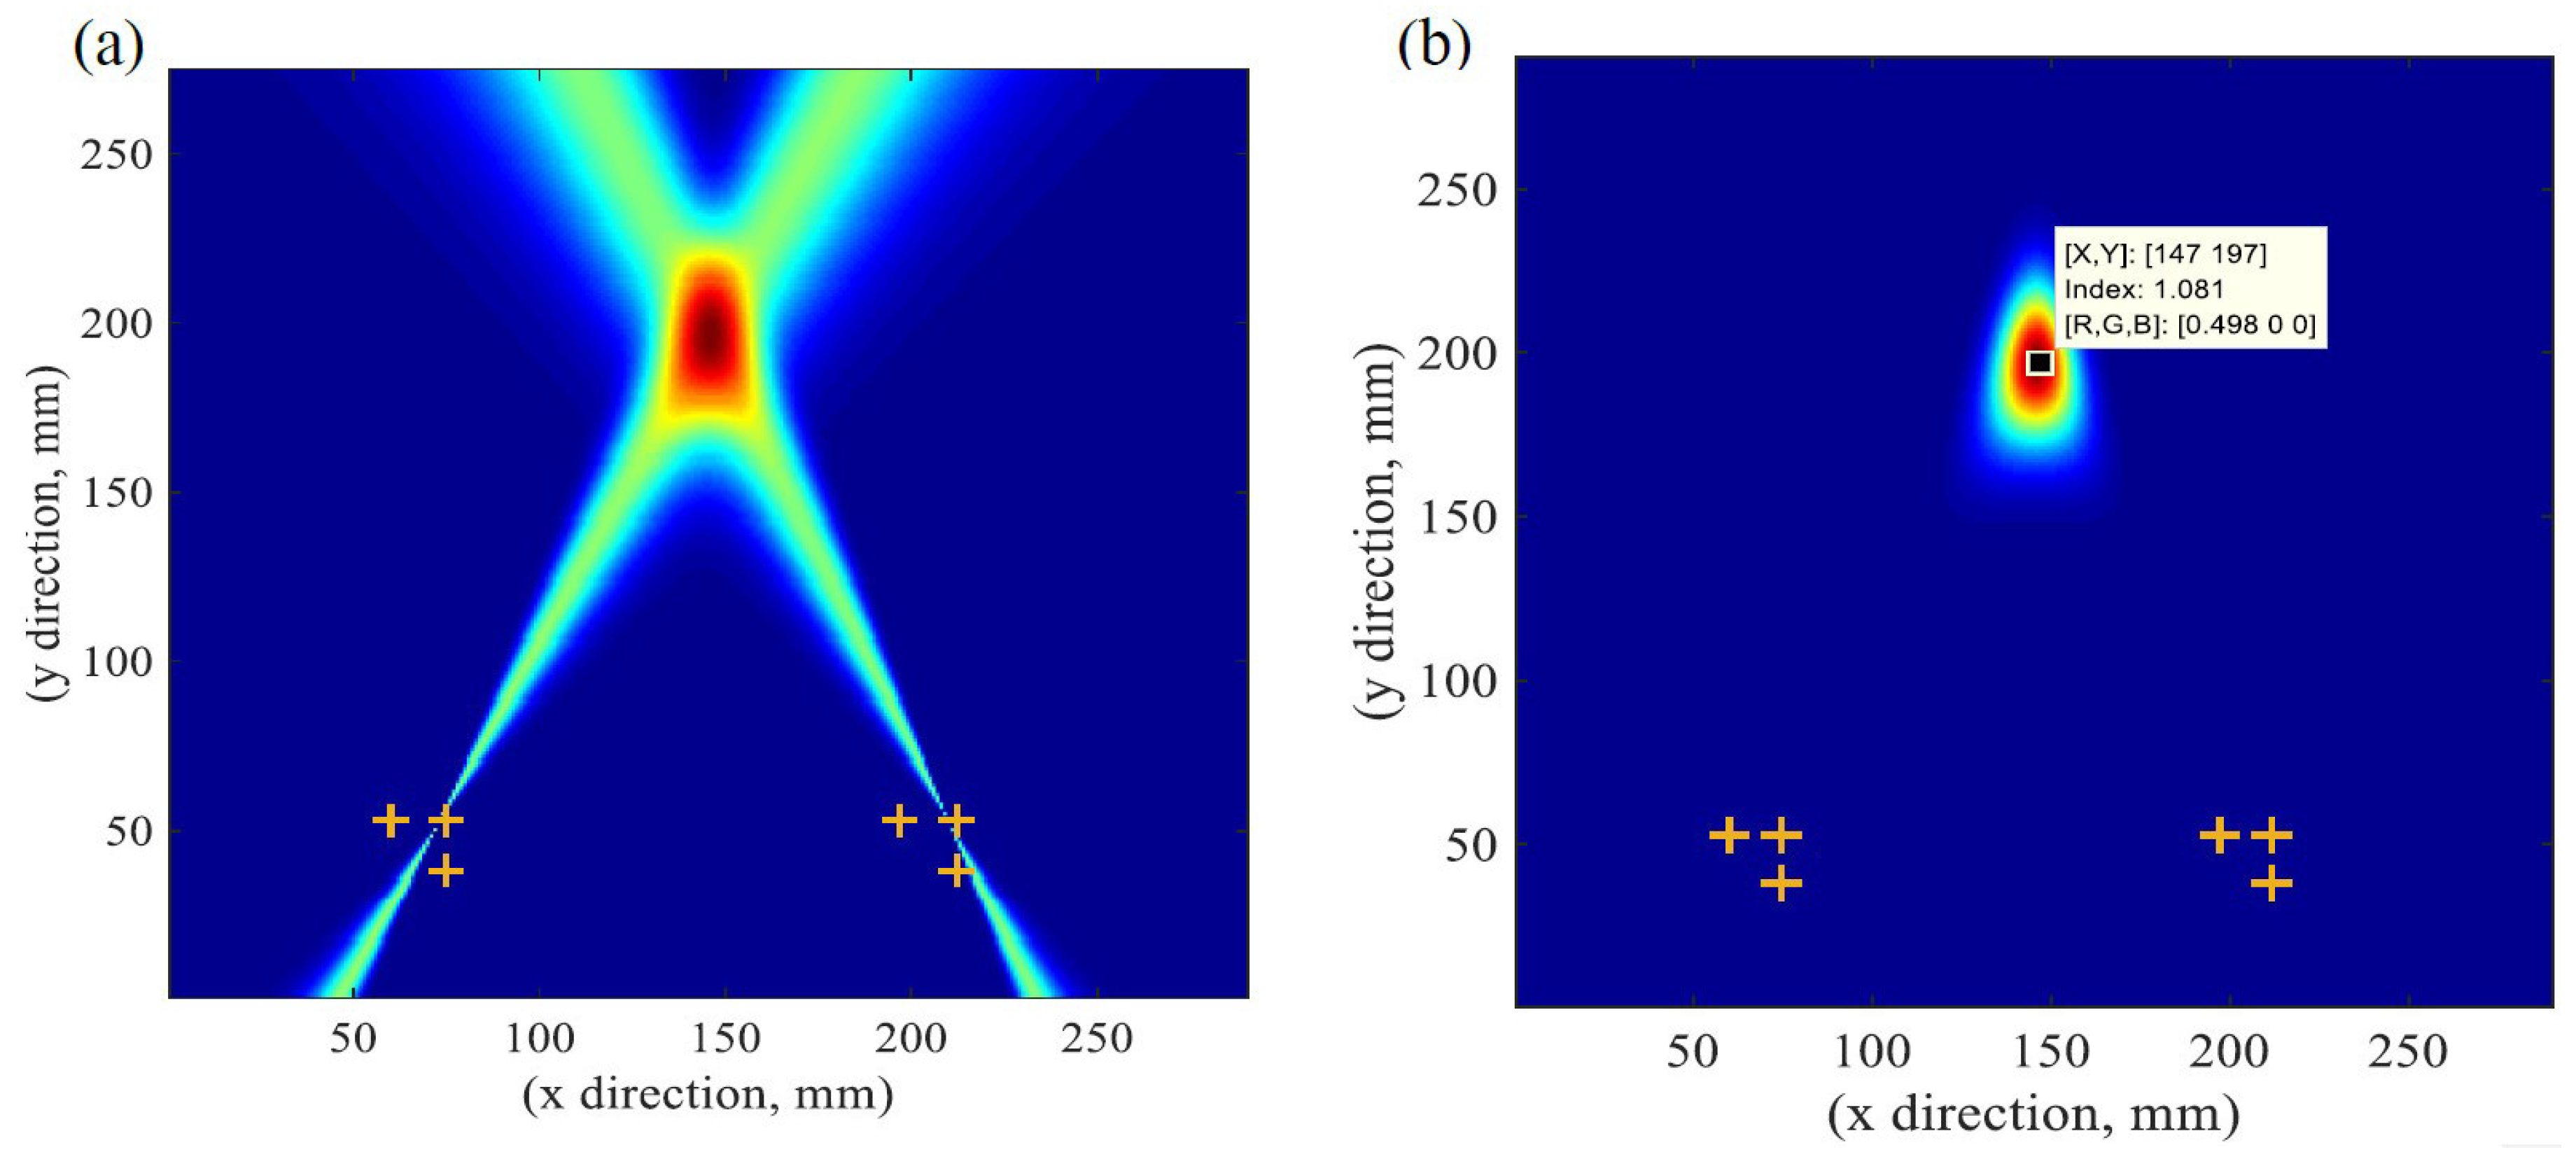
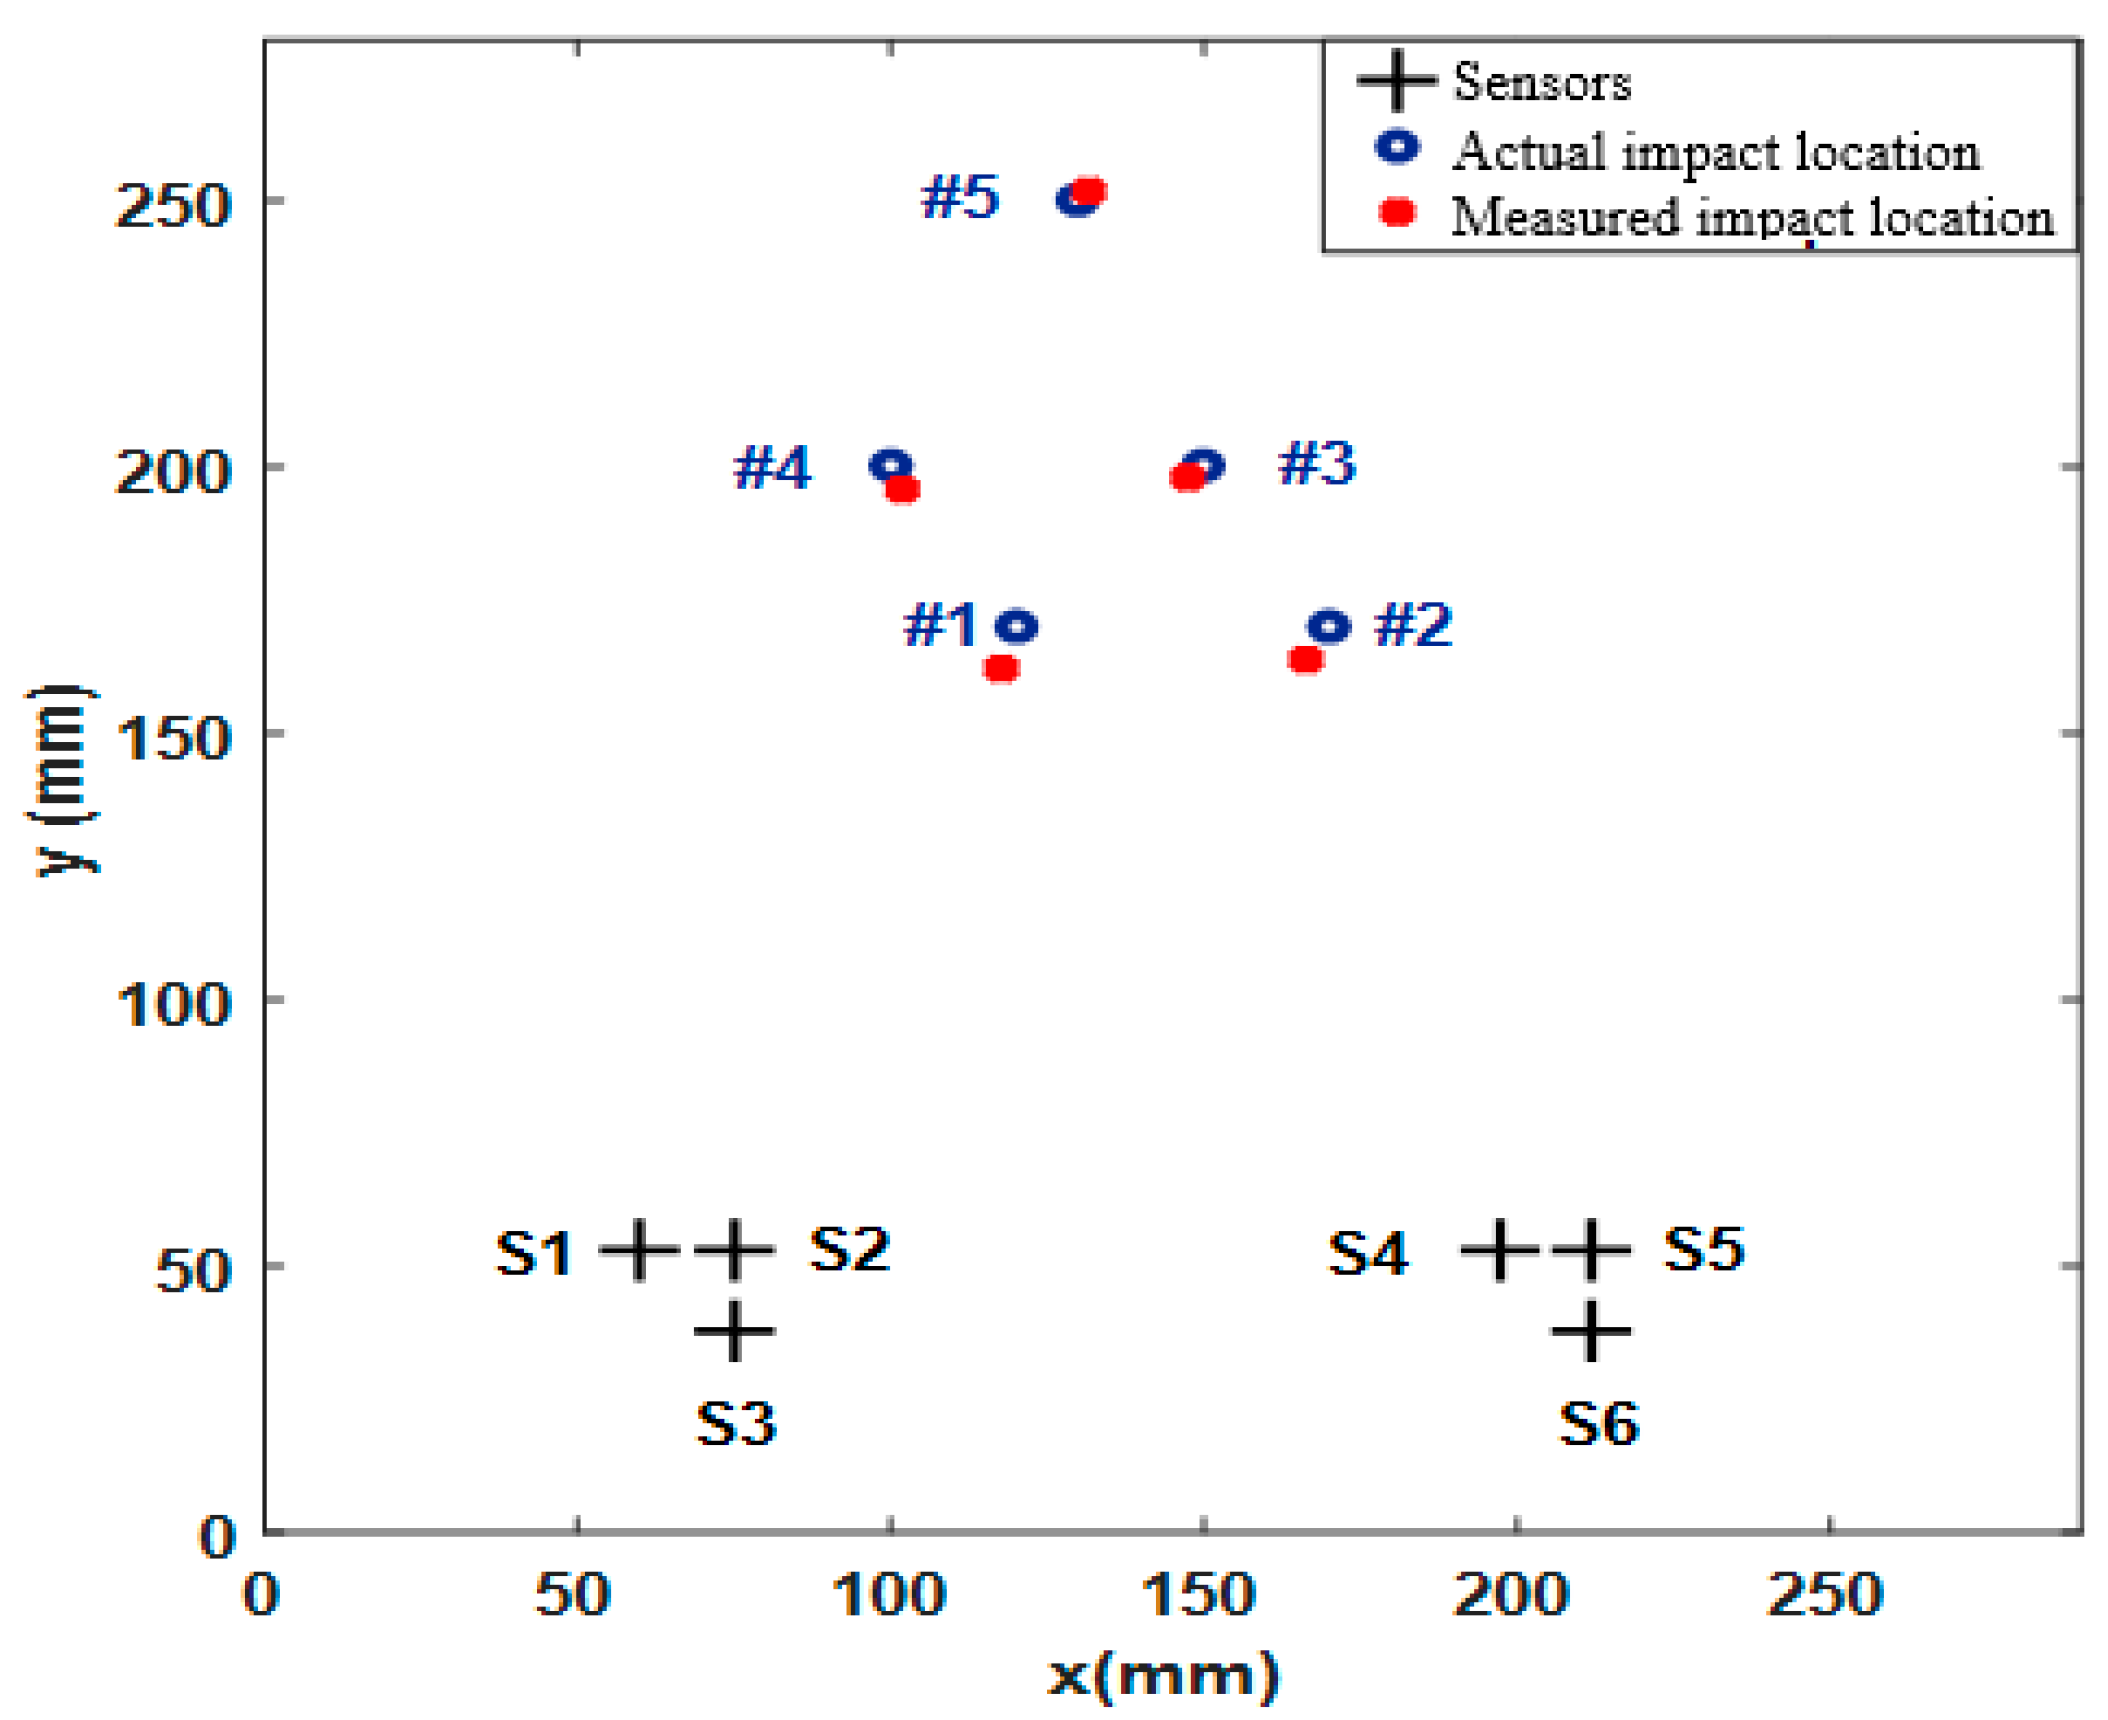
Once the TOFs for all the AE signals were known, a localization algorithm was used to determine the impact location. The imaging method is described in the earlier section (Section 3.1). The results from the imaging method are illustrated in Figure 8. The experimental measurement and the actual impact location is summarized in Table 1. The visual representation of the actual impact location and measured impact location is shown in Figure 9. It shows that the experimentally measured impact locations are in good agreement with the actual impact location.
3.4. High-Energy Impact Method
In this section, impact localization was done due to high energy impact. The plate was subjected to impact by a sharp point cylinder at two different locations. These locations are marked by R1 and R2. The projectile diameter of the sharp point cylinder is 4.5 mm. The weight of the cylinder is 0.920 kg. The sharp point cylinder was freely impacted from 1 m height following a special guide fixture to create 9 J impact energy. The six signals from the six sensors are illustrated in Figure 10. Figure 10 corresponds to the signals received from impact location R1.
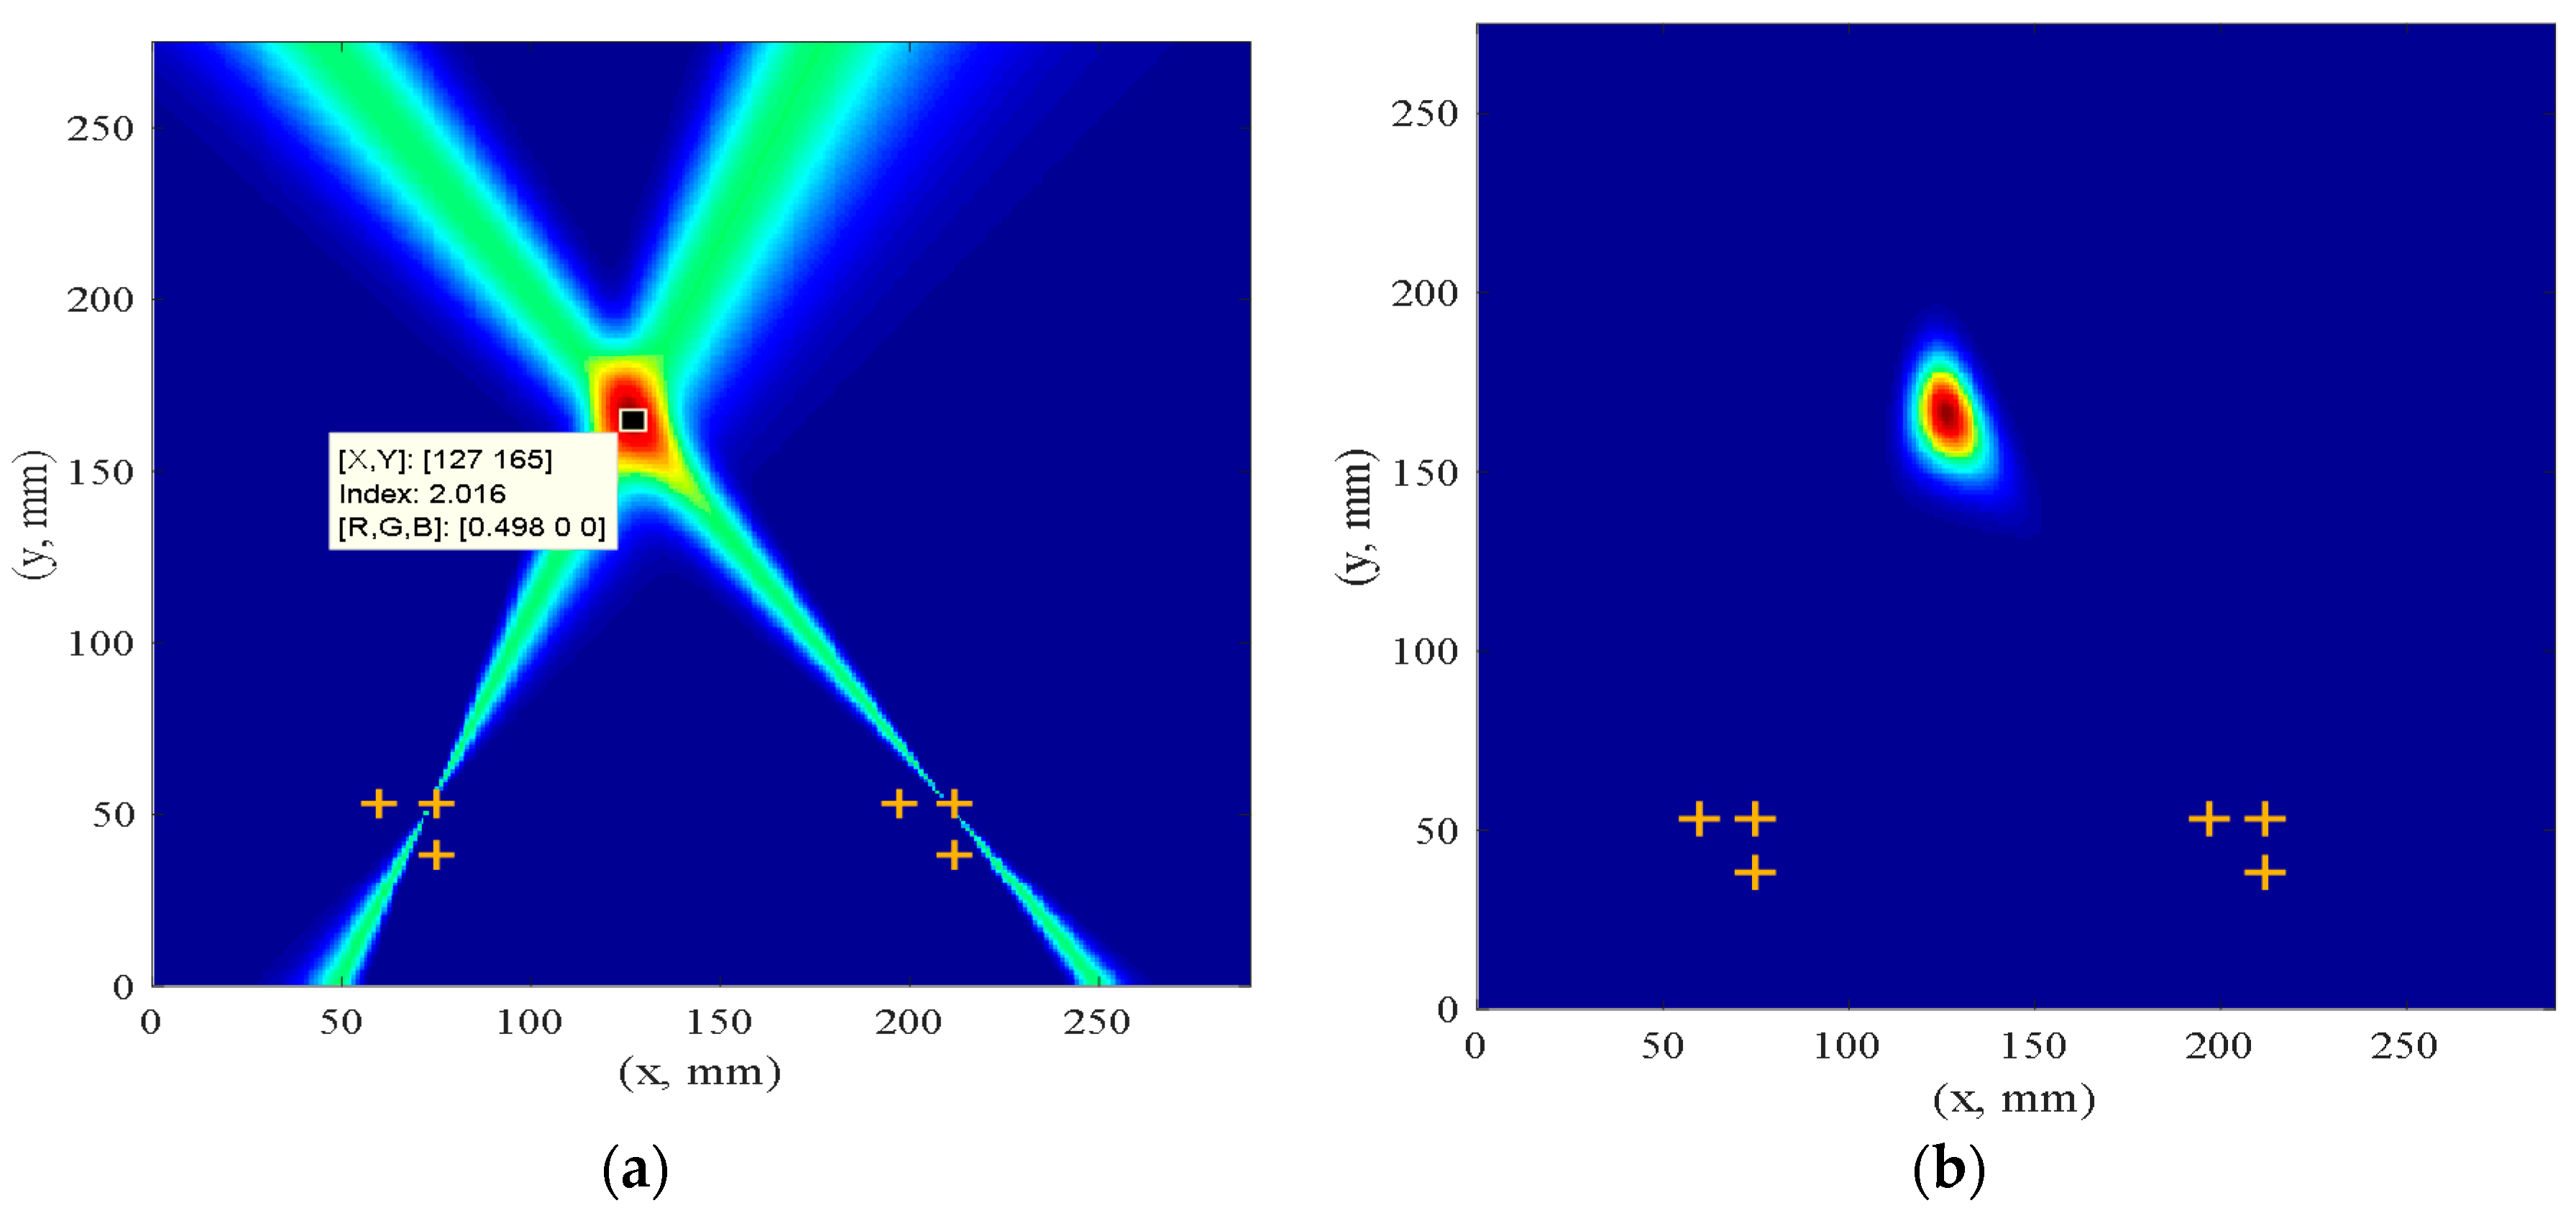
A wavelet transform based method was used to determine the TOF as described in the previous section (Section 3.3.2). Figure 11 illustrates the impact location of high-energy impact using the developed imaging method. The experimental measurement and the actual impact location is summarized in Table 2. It can be observed from Table 2 that the impact location determined by the current approach is very accurate compared to the actual impact location.
4. Nondestructive Inspection (NDI) of the Composite Plate Using Immersion Ultrasonic Testing
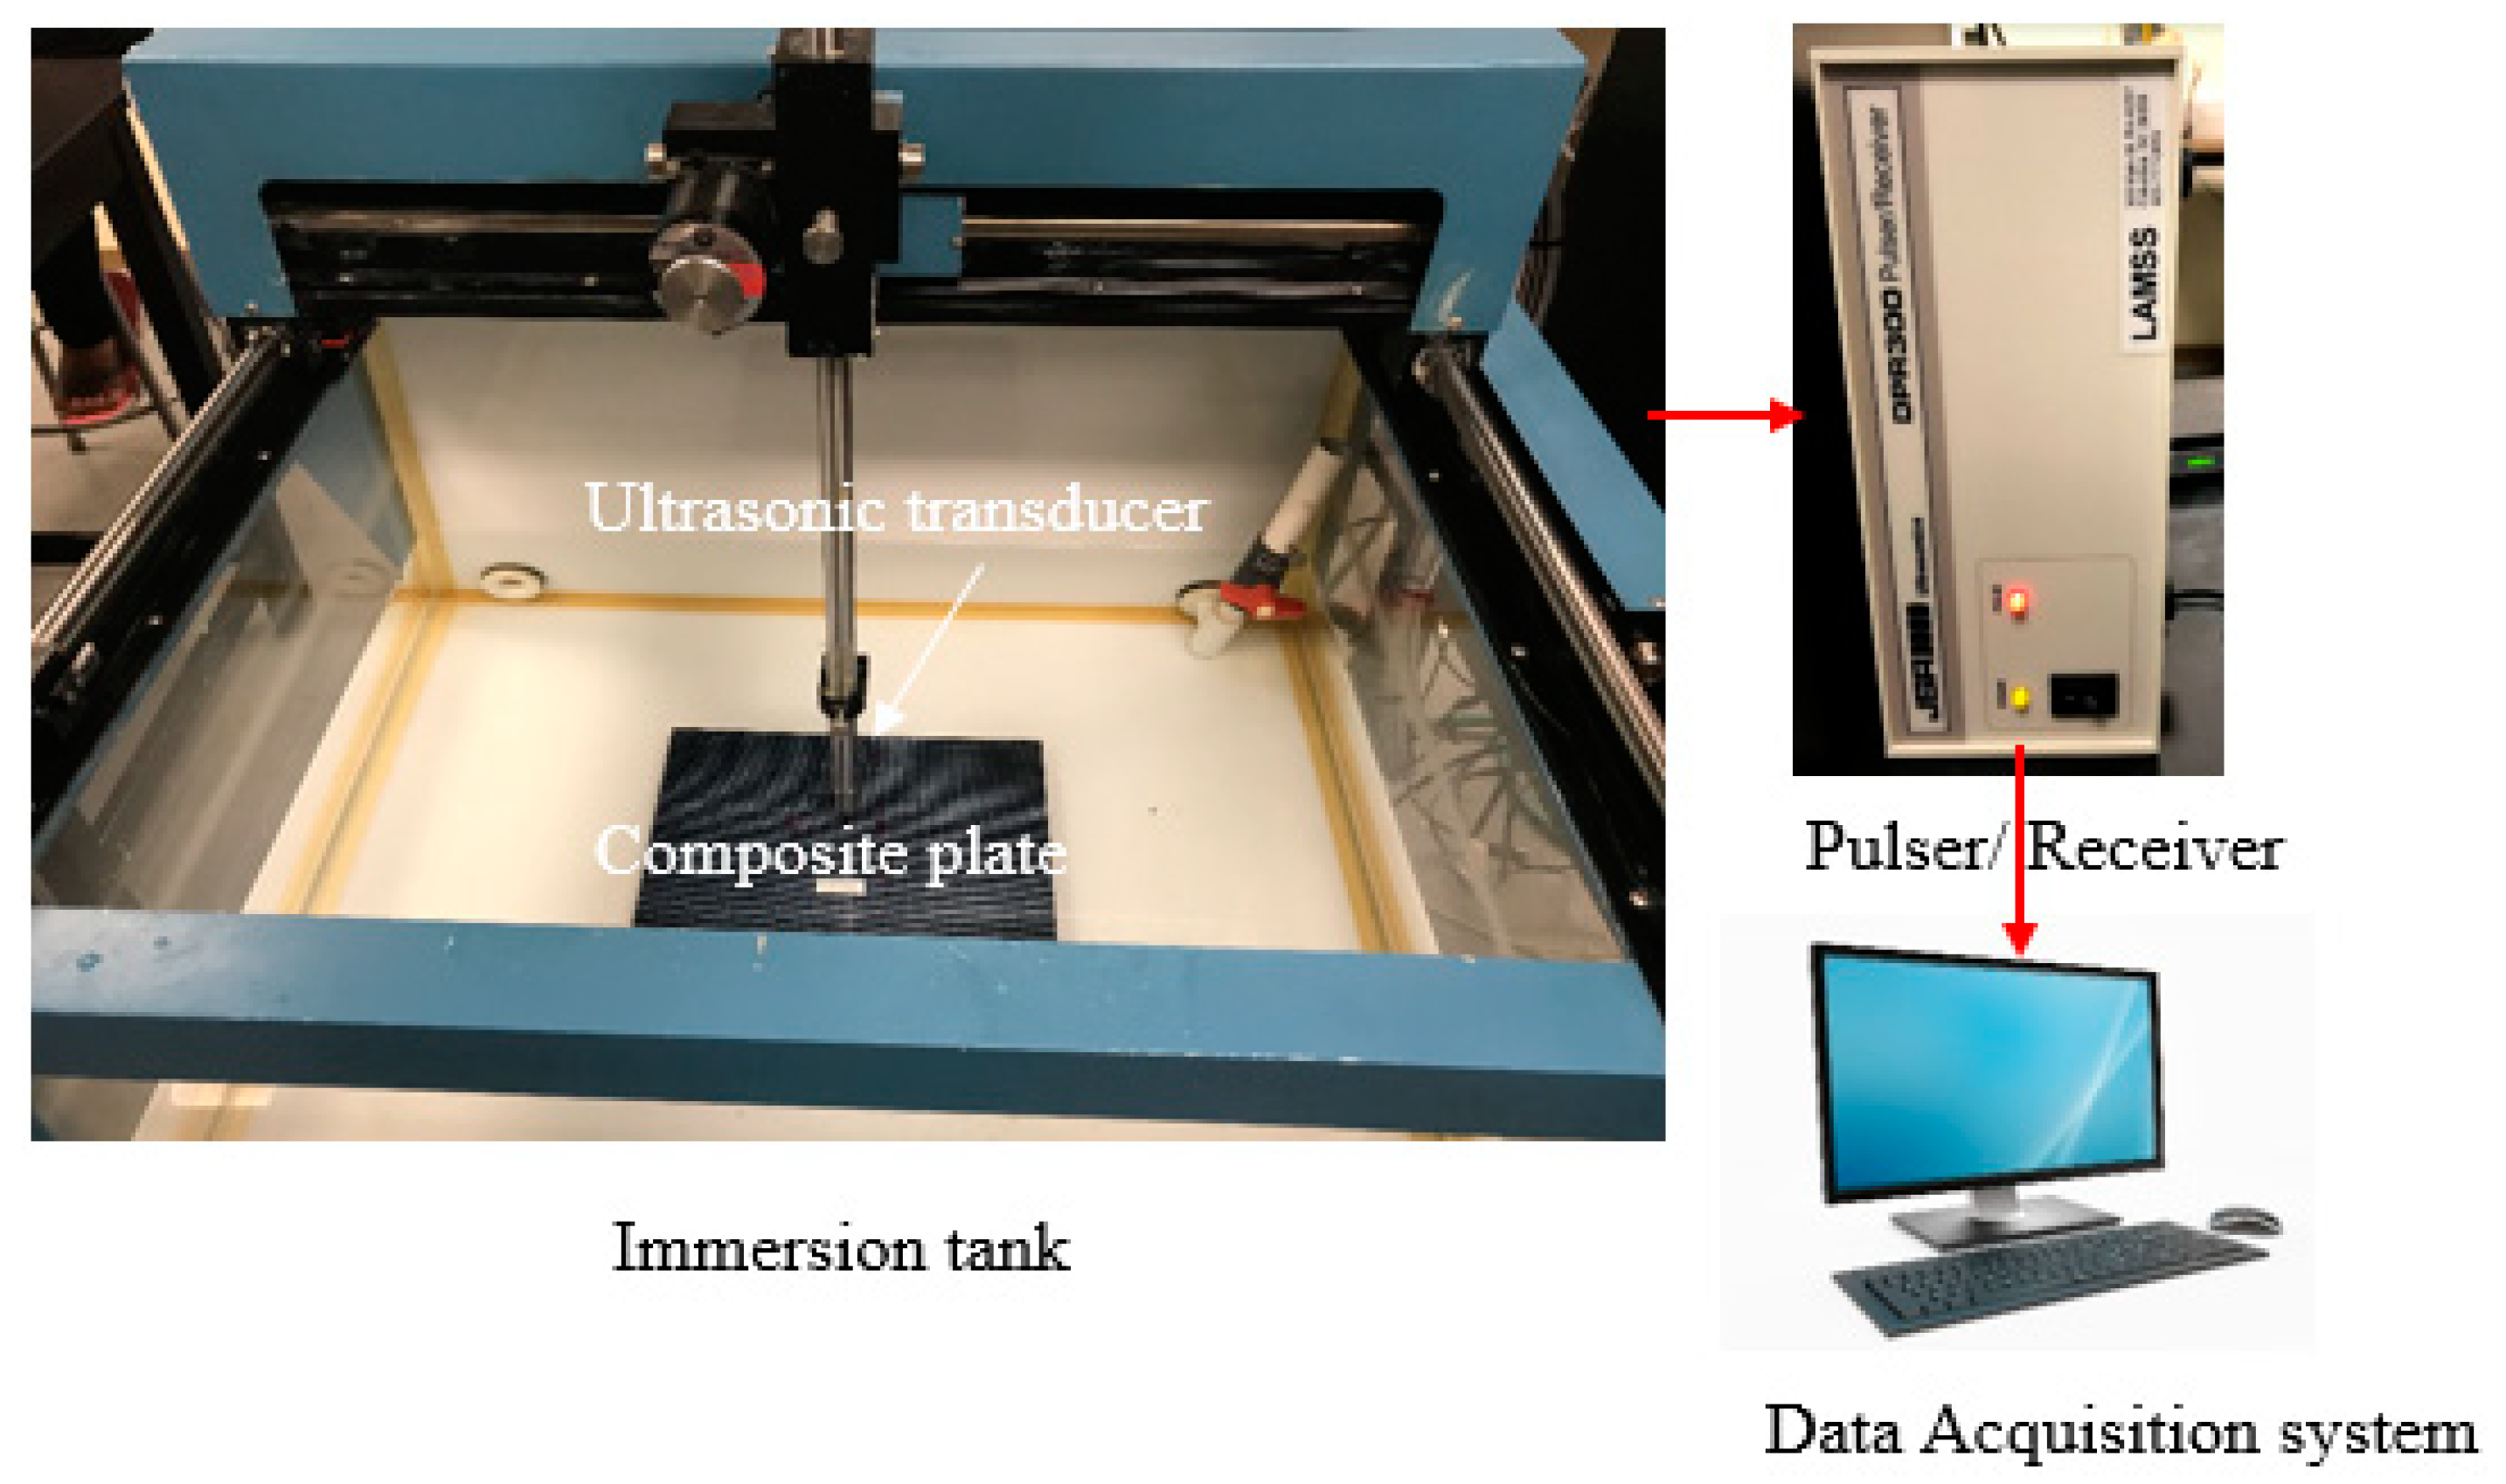
An ultrasonic nondestructive inspection (NDI) was performed on the manufactured composite plate before and after the impact event. The purpose of this NDI was to verify whether there was any major flaws, delamination or defects during the manufacturing process and to visualize the damage after the impact. An immersion ultrasonic scanning was performed on the plate, which can detect defects or delamination across its thickness. The ultrasonic immersion tank was used to inspect the composite specimen. This device could be used to identify the internal porosity, detect and size of delamination and other types of defects.
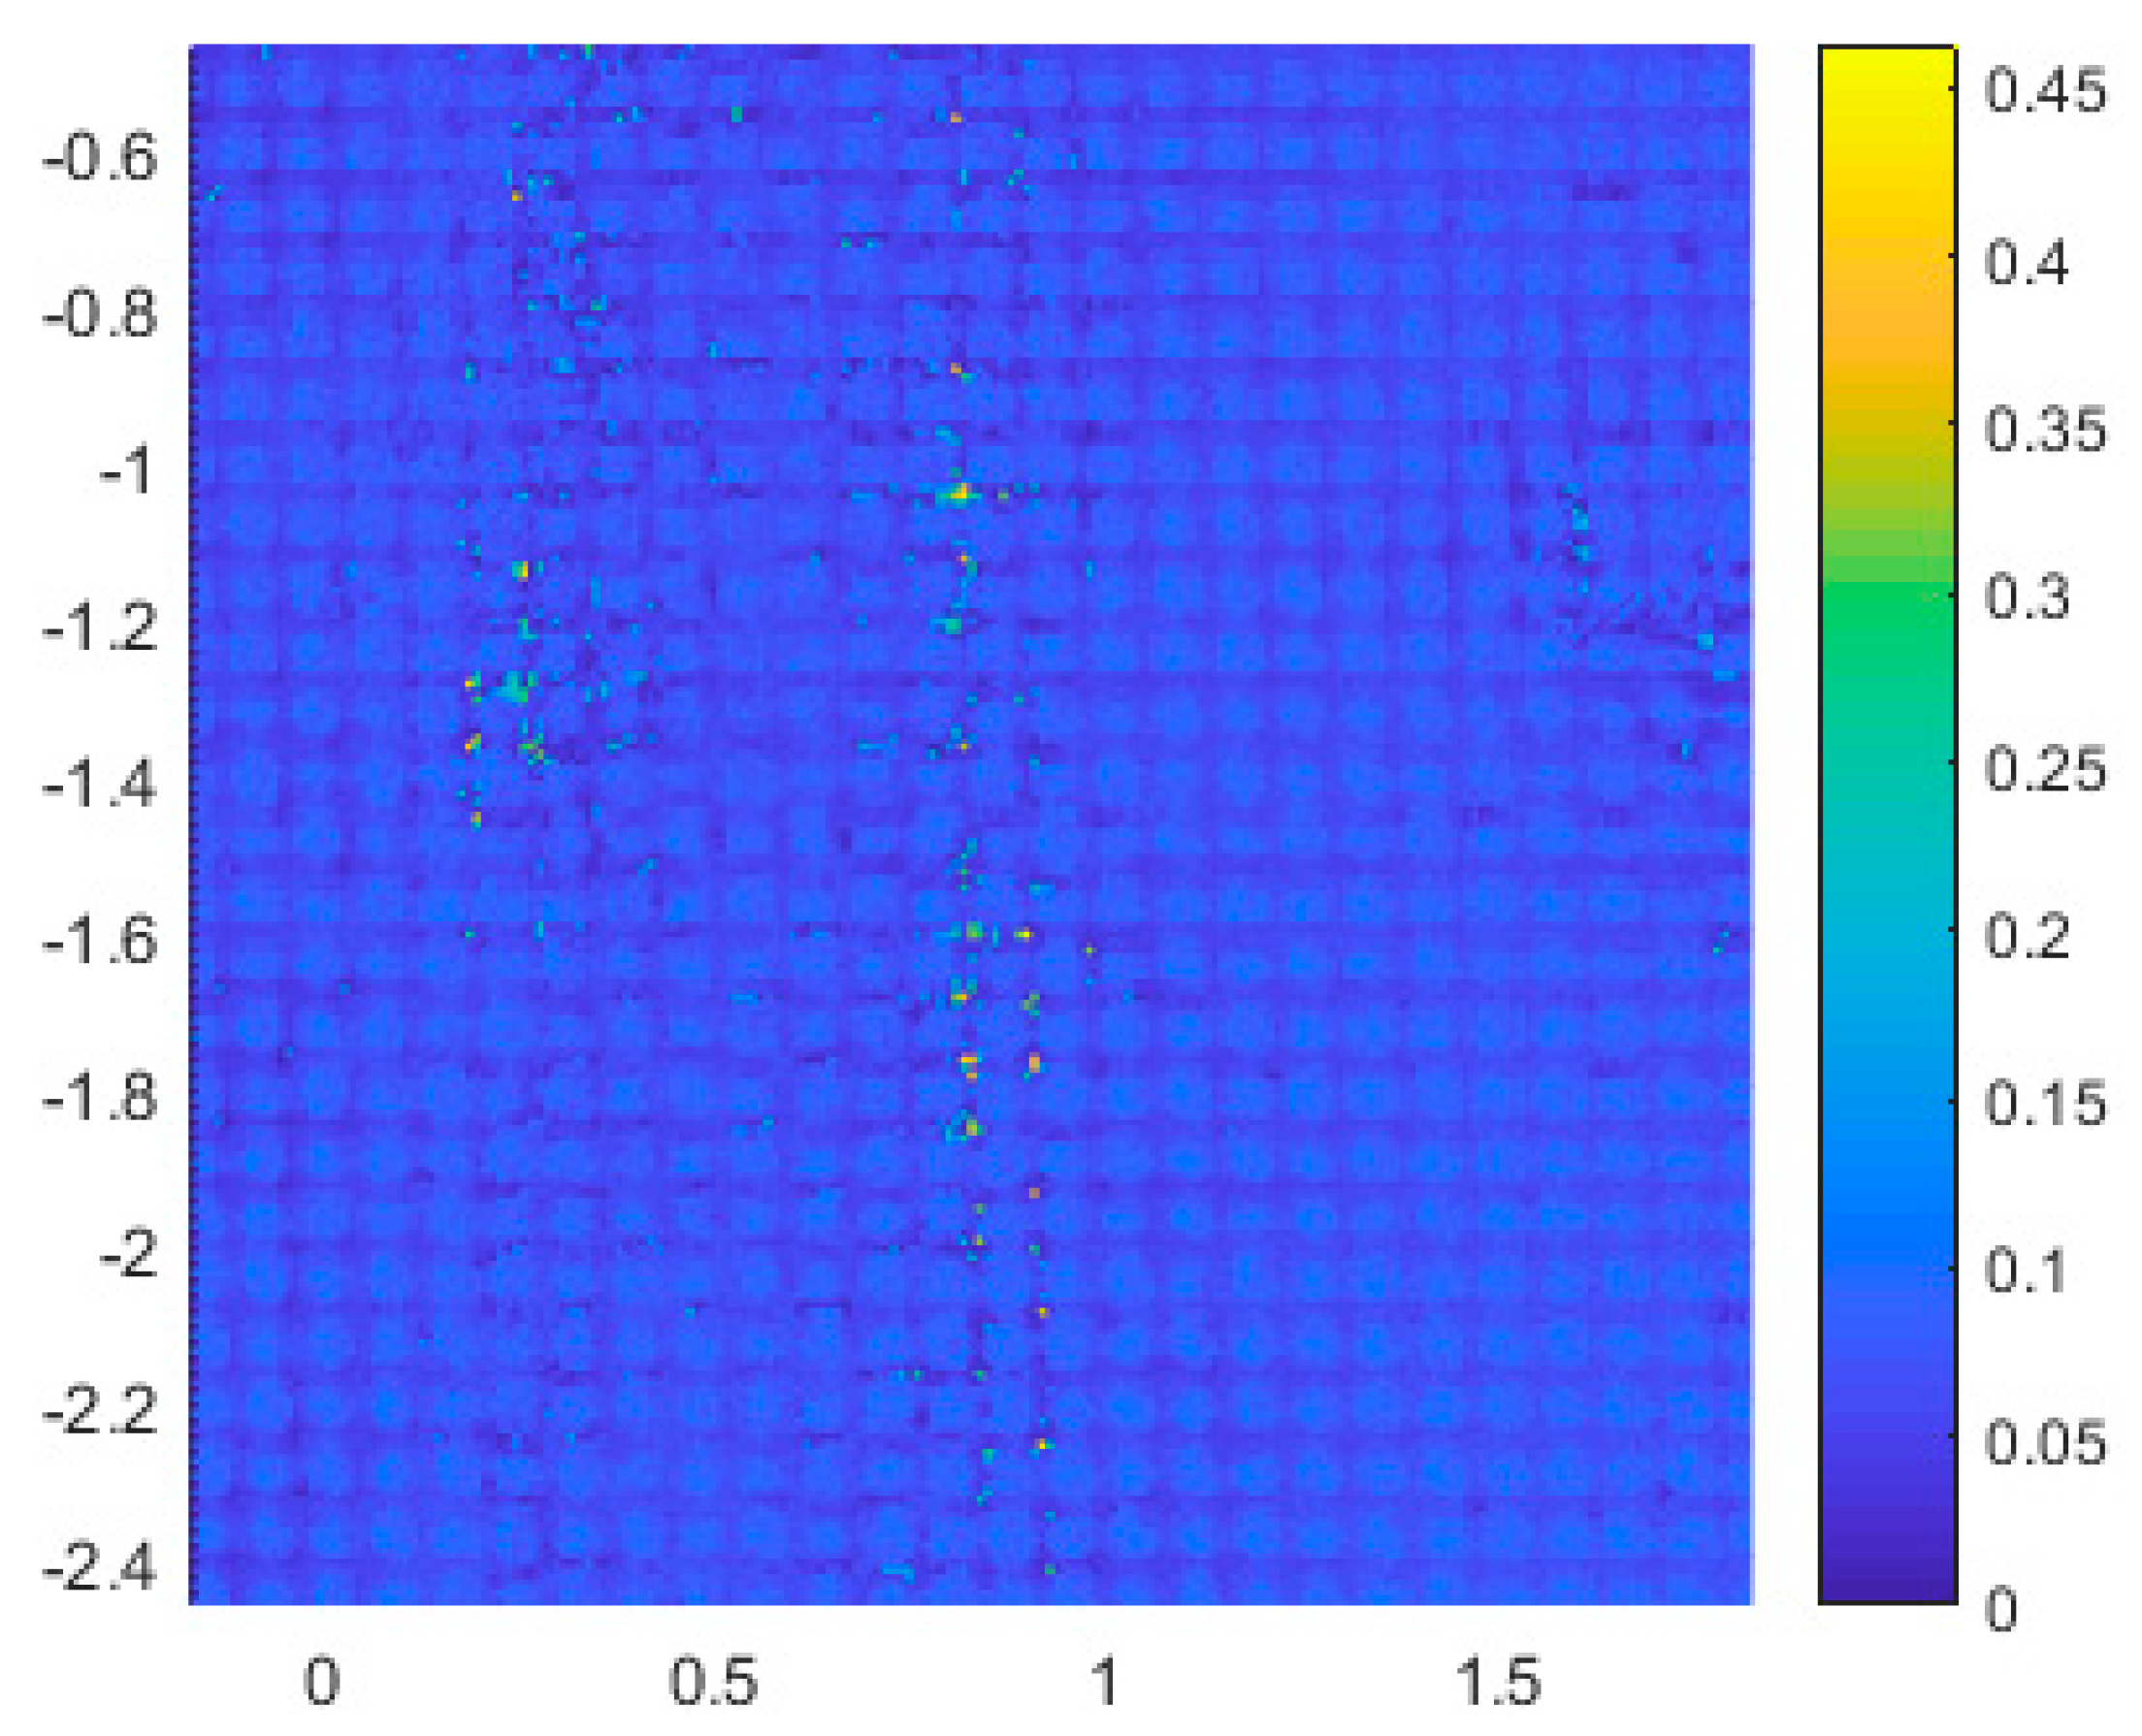
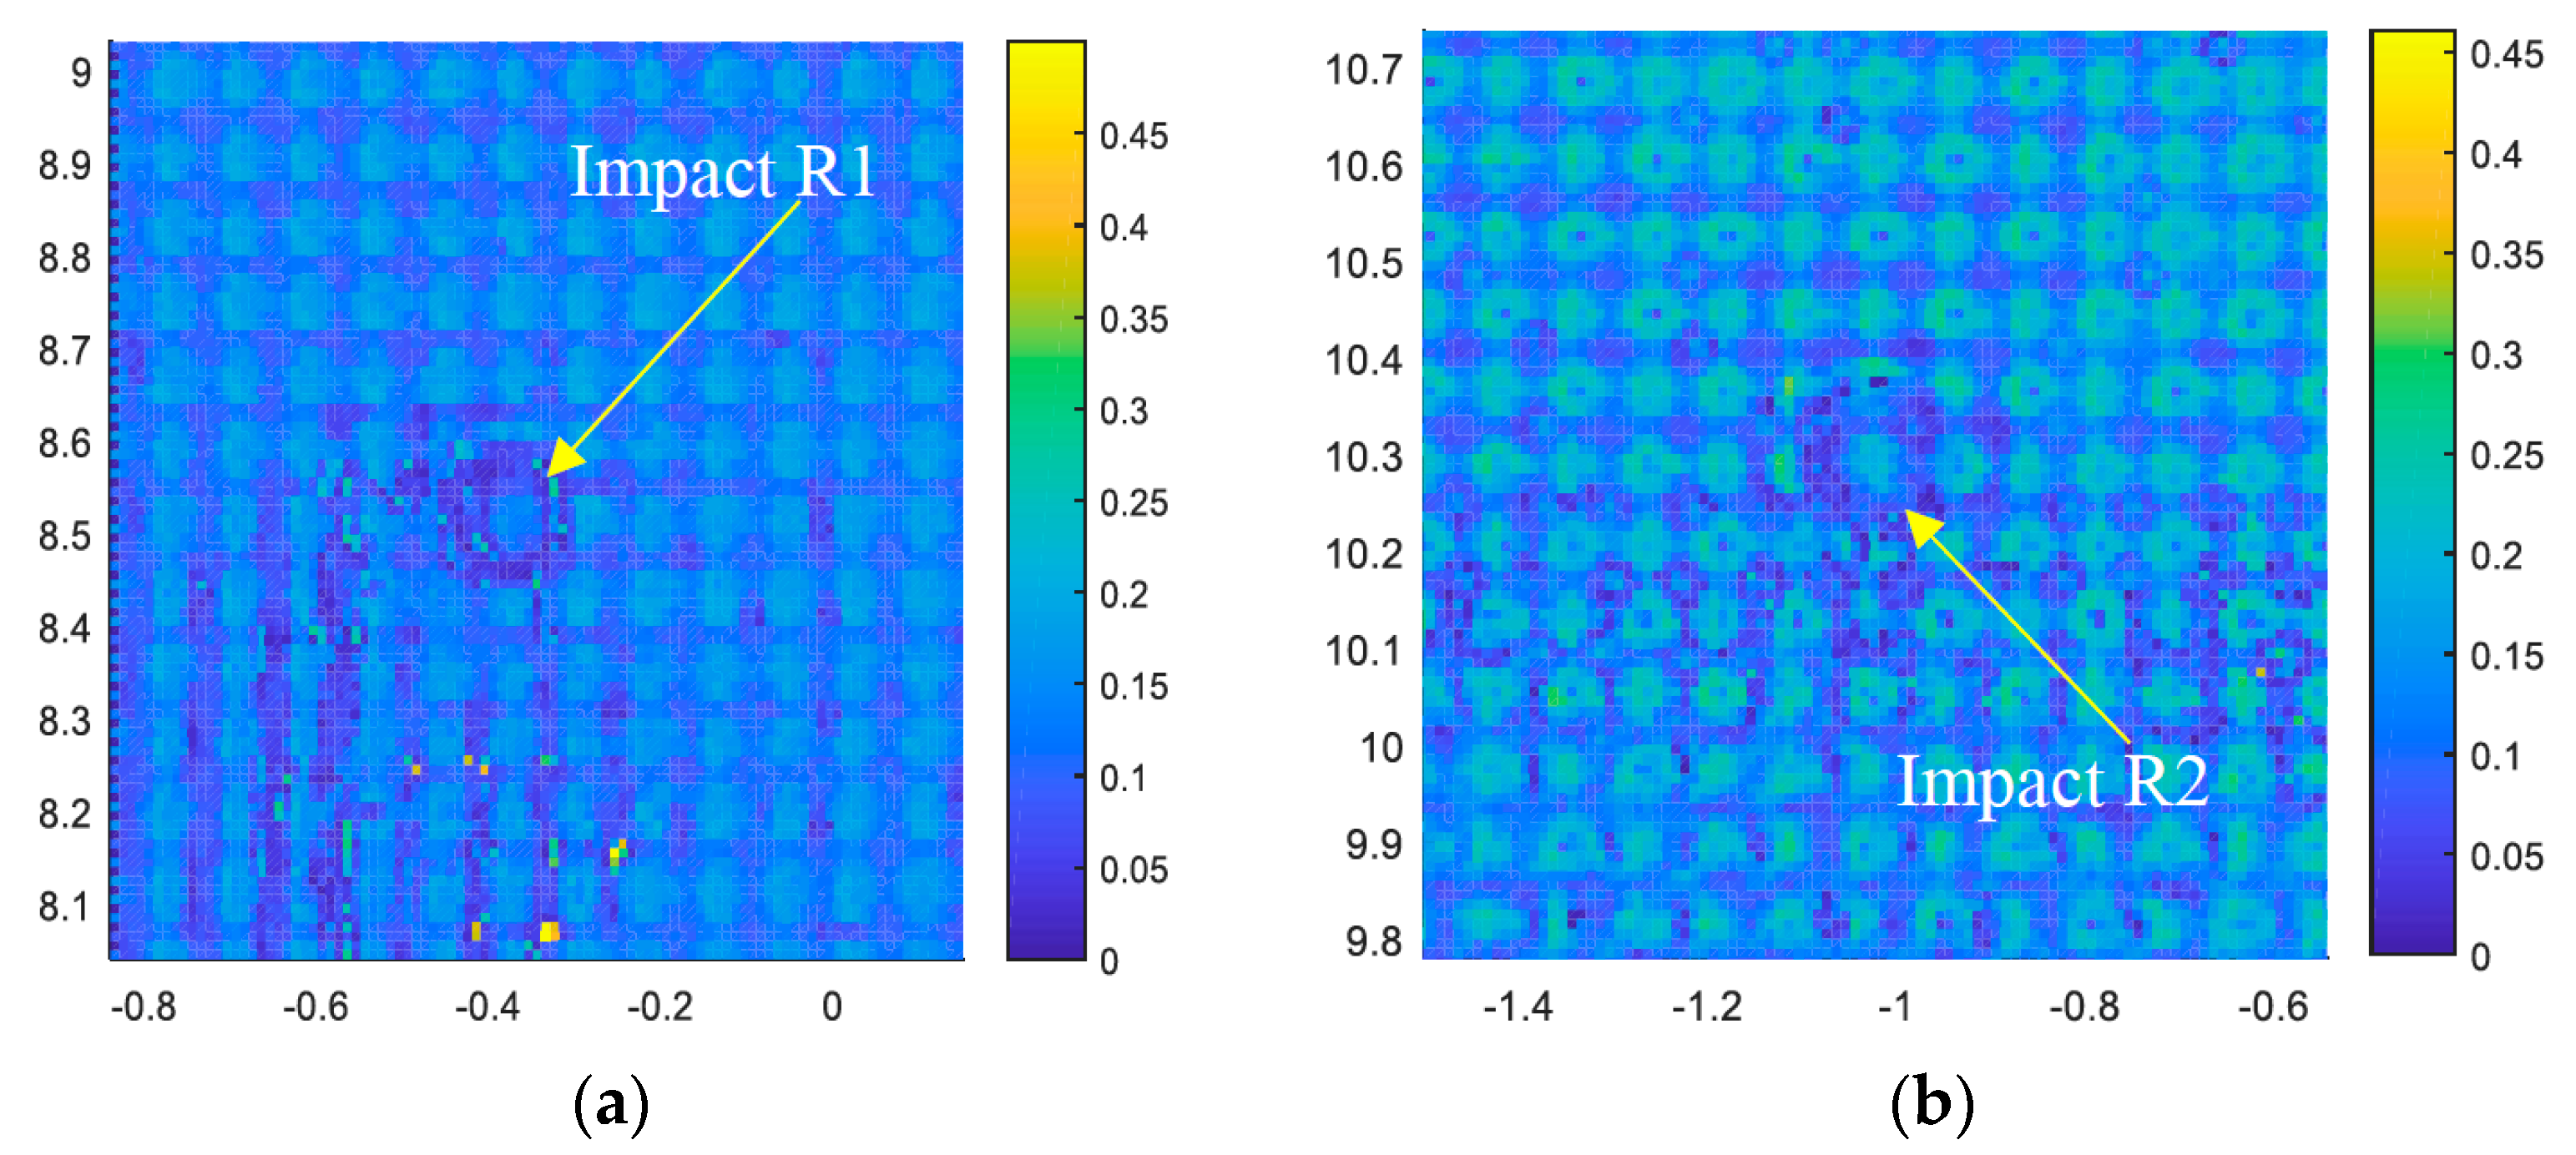
In immersion testing, the transducer is placed in the water, above the test object, and a beam of sound is projected. The experimental setup of immersion ultrasonic testing is shown in Figure 12. A 10 MHz 0.37-inch diameter-1-inch focused transducer was used for pulse-echo measurement. A pulser/receiver was connected to the transducer. Pulser/receiver simultaneously transmits and receives the signal. A data acquisition system was used to collect the data. The scan area of the composite plate is shown in Figure 13. A 2-inch by 2-inch area was scanned first for detecting the manufacturing damage and flaws in the composite plates. Figure 14 shows the C-scan image before the impact event. It can be seen clearly from the figure that there are no significant manufacturing defects, damage or flaws in the composite plate. Figure 15 shows the C-scan image after the high-energy impact event. There are two high-energy impact events at location R1 and R2. A 1-inch by 1-inch area was scanned first for visualizing the defect due to a high-energy impact event. Figure 15a,b shows the evidence of impact damage at R1 and R2 location. The size of the impact damage is around 2.5 mm in diameter. From Figure 15a, slight delamination can also be observed around the impact location.
5. Conclusions
A compression molding process with a proper cure cycle can be used for manufacturing a composite plate without any significant internal defect. We found that the manufactured plate had a minimal to no defect that can affect the impact detection and localization. Piezoelectric wafer active sensors can be permanently bonded to the composites to detect and localize an impact event. A wavelet transform based signal processing can accurately determine the time of flight of the acoustic signals. The proposed SHM technique can be successfully implemented in practice to monitor impact damage. We found that the experimental measurements are in good agreement with actual impact localization. An immersion ultrasonic scanning method can be used for fast inspection of internal damage in a manufactured plate. There was no significant manufacturing damage. After the high-energy impact, a clear impact damage was observed in the C-scan image.
Author Contributions
In this article the formal analysis was done by M.F.H. and M.Y.B. Experimental investigation was done by A.M. The details methodology was provided by M.F.H., A.M., M.Y.B. and V.G. The Writing, review & editing was done by M.F.H.
Acknowledgments
Support from the National Aeronautics and Space Administration (NASA) and USC McNair center are thankfully acknowledged.
Conflicts of Interest
The authors declare no conflicts of interest.
References
- Zabihi, O.; Ahmadi, M.; Nikafshar, S.; Preyeswary, K.C.; Naebe, M. A technical review on epoxy-clay nanocomposites: Structure, properties, and their applications in fiber reinforced composites. Compos. Part B Eng. 2018, 135, 1–24. [Google Scholar] [CrossRef]
- Molent, L.; Forrester, C. The lead crack concept applied to defect growth in aircraft composite structures. Compos. Struct. 2017, 166, 22–26. [Google Scholar] [CrossRef]
- Haider, M.F.; Majumdar, P.K.; Angeloni, S.; Reifsnider, K.L. Nonlinear anisotropic electrical response of carbon fiber-reinforced polymer composites. J. Compos. Mater. 2017. [Google Scholar] [CrossRef]
- Rassel, R.; Adkins, J.M.; Baker, J.; Rabbi, F.; Reifsnider, K. Relationship of dielectric property change to composite material state degradation. Compos. Sci. Technol. 2014, 105, 160–165. [Google Scholar]
- Ciampa, F.; Meo, M. A new algorithm for acoustic emission localization and flexural group velocity determination in anisotropic structures. Compos. A Appl. Sci. Manuf. 2010, 41, 1777–1786. [Google Scholar] [CrossRef]
- Kundu, T. Acoustic source localization. Ultrasonics 2014, 54. [Google Scholar] [CrossRef] [PubMed]
- Kessler, S.S.; Spearing, S.M.; Soutis, C. Damage detection in composite materials using Lamb wave methods. Smart Mater. Struct. 2002, 11, 269. [Google Scholar] [CrossRef]
- Giurgiutiu, V. Structural Health Monitoring with Piezoelectric Wafer Active Sensors, 2nd ed.; Academic Press: Oxford, MS, USA, 2014. [Google Scholar]
- Qing, X.P.; Beard, S.J.; Kumar, A.; Ooi, T.K.; Chang, F.-K. Built-in Sensor Network for Structural Health Monitoring of Composite Structure. J. Intell. Mater. Syst. Struct. 2006, 18, 39–49. [Google Scholar] [CrossRef]
- Michaels, J.E.; Michaels, T.E. Guided wave signal processing and image fusion for in situ damage localization in plates. Wave Motion 2007, 44, 482–492. [Google Scholar] [CrossRef]
- Bergman, J.; Chung, H.; Janapati, V.; Li, I.; Kumar, A.; Kumar-Yadav, S.; Chapman, D.; Nissan, A.; Sarrafi-Nour, R. Evaluation of the Real-Time Active Pipeline Integrity Detection System for Corrosion Quantification; NACE International: Houston, TX, USA, 2016. [Google Scholar]
- Tobias, A. Acoustic-emission source location in two dimensions by an array of three sensors. Non-Destr. Test. 1976, 9, 9–12. [Google Scholar] [CrossRef]
- Bhuiyan, M.Y.; Giurgiutiu, V. The signatures of acoustic emission waveforms from fatigue crack advancing in thin metallic plates. Smart Mater. Struct. 2017, 27, 1–15. [Google Scholar] [CrossRef]
- Ebrahimkhanlou, A.; Salamone, S. A probabilistic framework for single-sensor acoustic emission source localization in thin metallic plates. Smart Mater. Struct. 2017, 26, 95026. [Google Scholar] [CrossRef]
- Frieden, J.; Cugnoni, J.; Botsis, J.; Gmür, T. Low energy impact damage monitoring of composites using dynamic strain signals from FBG sensors—Part I: Impact detection and localization. Compos. Struct. 2012, 94, 438–445. [Google Scholar] [CrossRef]
- Ciampa, F.; Meo, M. Impact detection in anisotropic materials using a time reversal approach. Struct. Health Monit. 2012, 11, 43–49. [Google Scholar] [CrossRef] [Green Version]
- Salamone, S.; Bartoli, I.; di Leo, P.; di Scala, F.L.; Ajovalasit, A.; D’Acquisto, L.; Rhymer, J.; Kim, H. High-velocity impact location on aircraft panels using macro-fiber composite piezoelectric rosettes. J. Intell. Mater. Syst. Struct. 2010, 21, 887–896. [Google Scholar] [CrossRef]
- Kundu, T.; Das, S.; Martin, S.A.; Jata, K.V. Locating point of impact in anisotropic fiber reinforced composite plates. Ultrasonics 2008, 48, 193–201. [Google Scholar] [CrossRef] [PubMed]
- Jiao, J.; He, C.; Wu, B.; Fei, R.; Wang, X. A new acoustic emission source location technique based on wavelet transform and mode analysis. Front. Mech. Eng. China 2006, 1, 341–345. [Google Scholar] [CrossRef]
- Haider, M.F.; Bhuiyan, M.Y.; Poddar, B.; Lin, B.; Giurgiutiu, V. Analytical and experimental investigation of the interaction of Lamb waves in a stiffened aluminum plate with a horizontal crack at the root of the stiffener. J. Sound Vib. 2018, 431, 212–225. [Google Scholar] [CrossRef]
- Baghalian, A.; Tashakori, S.; Senyurek, V.Y.; McDaniel, D.; Fekrmandi, H.; Tansel, I.N. Non-contact quantification of longitudinal and circumferential defects in pipes using the surface response to excitation (SuRE) method. Int. J. Progn. Health Manag. 2017, 8, 1–8. [Google Scholar]
- Haider, M.F.; Giurgiutiu, V.; Lin, B.; Yu, L. Irreversibility effects in piezoelectric wafer active sensors after exposure to high temperature. Smart Mater. Struct. 2017, 26, 095019. [Google Scholar] [CrossRef]
- Kundu, T. A new technique for acoustic source localization in an anisotropic plate without knowing its material properties. In Proceedings of the 6th European Workshop on Structural Health Monitoring, Dresden, Germany, 3–6 July 2012. [Google Scholar]
- Migot, A.; Giurgiutiu, V. Impact localization on a composite plate with unknown material properties using PWAS transducers and wavelet transform. In Proceedings of the ASME 2017 International Mechanical Engineering Congress and Exposition, Tampa, FL, USA, 3–9 November 2017; pp. 1–8. [Google Scholar]
- Wang, C.H.; Rose, J.T.; Chang, F.-K. A synthetic time-reversal imaging method for structural health monitoring. Smart Mater. Struct. 2004, 13, 415–423. [Google Scholar] [CrossRef]
- Vallen-System, GmbH. Munich, Germany. 2001. Available online: http://www.vallen.de/wavelet/index.html (accessed on 24 August 2018).
Figure 1.
Composite layers (a) with thin protective films (b) in the compression-molding machine.

Figure 2.
(a) Cure cycle for the PPS prepreg; (b) Final composite plate.

Figure 3.
Mapping of two lines from each cluster to show the intersection at the impact location (black dotted lines from each cluster mapped on the pixel and blue solid lines intersected at the impact location).
Figure 3.
Mapping of two lines from each cluster to show the intersection at the impact location (black dotted lines from each cluster mapped on the pixel and blue solid lines intersected at the impact location).

Figure 4.
Flowchart of the developed imaging method.

Figure 5.
Experimental setup for impact detection and localization on the composite plate.

Figure 6.
Piezoelectric wafer active sensors (PWAS) recorded acoustic signals due to low-energy impact at location #3 (150, 200) mm.
Figure 6.
Piezoelectric wafer active sensors (PWAS) recorded acoustic signals due to low-energy impact at location #3 (150, 200) mm.

Figure 7.
Wavelet transform of the PWAS recorded signals to determine the time of flight (TOF) (for low-energy impact location #3).
Figure 7.
Wavelet transform of the PWAS recorded signals to determine the time of flight (TOF) (for low-energy impact location #3).

Figure 8.
Imaging results of localization low-energy impact at point #3 (150, 200) mm using imaging methods; (a) summation method; (b) multiplication method (+ sign corresponding to different sensors location).
Figure 8.
Imaging results of localization low-energy impact at point #3 (150, 200) mm using imaging methods; (a) summation method; (b) multiplication method (+ sign corresponding to different sensors location).

Figure 9.
Experimentally measured low-energy impact location and actual impact location on the manufactured composite plate.
Figure 9.
Experimentally measured low-energy impact location and actual impact location on the manufactured composite plate.

Figure 10.
PWAS recorded acoustic signals due to the high-energy impact at location #R1 (128, 167 mm).
Figure 10.
PWAS recorded acoustic signals due to the high-energy impact at location #R1 (128, 167 mm).
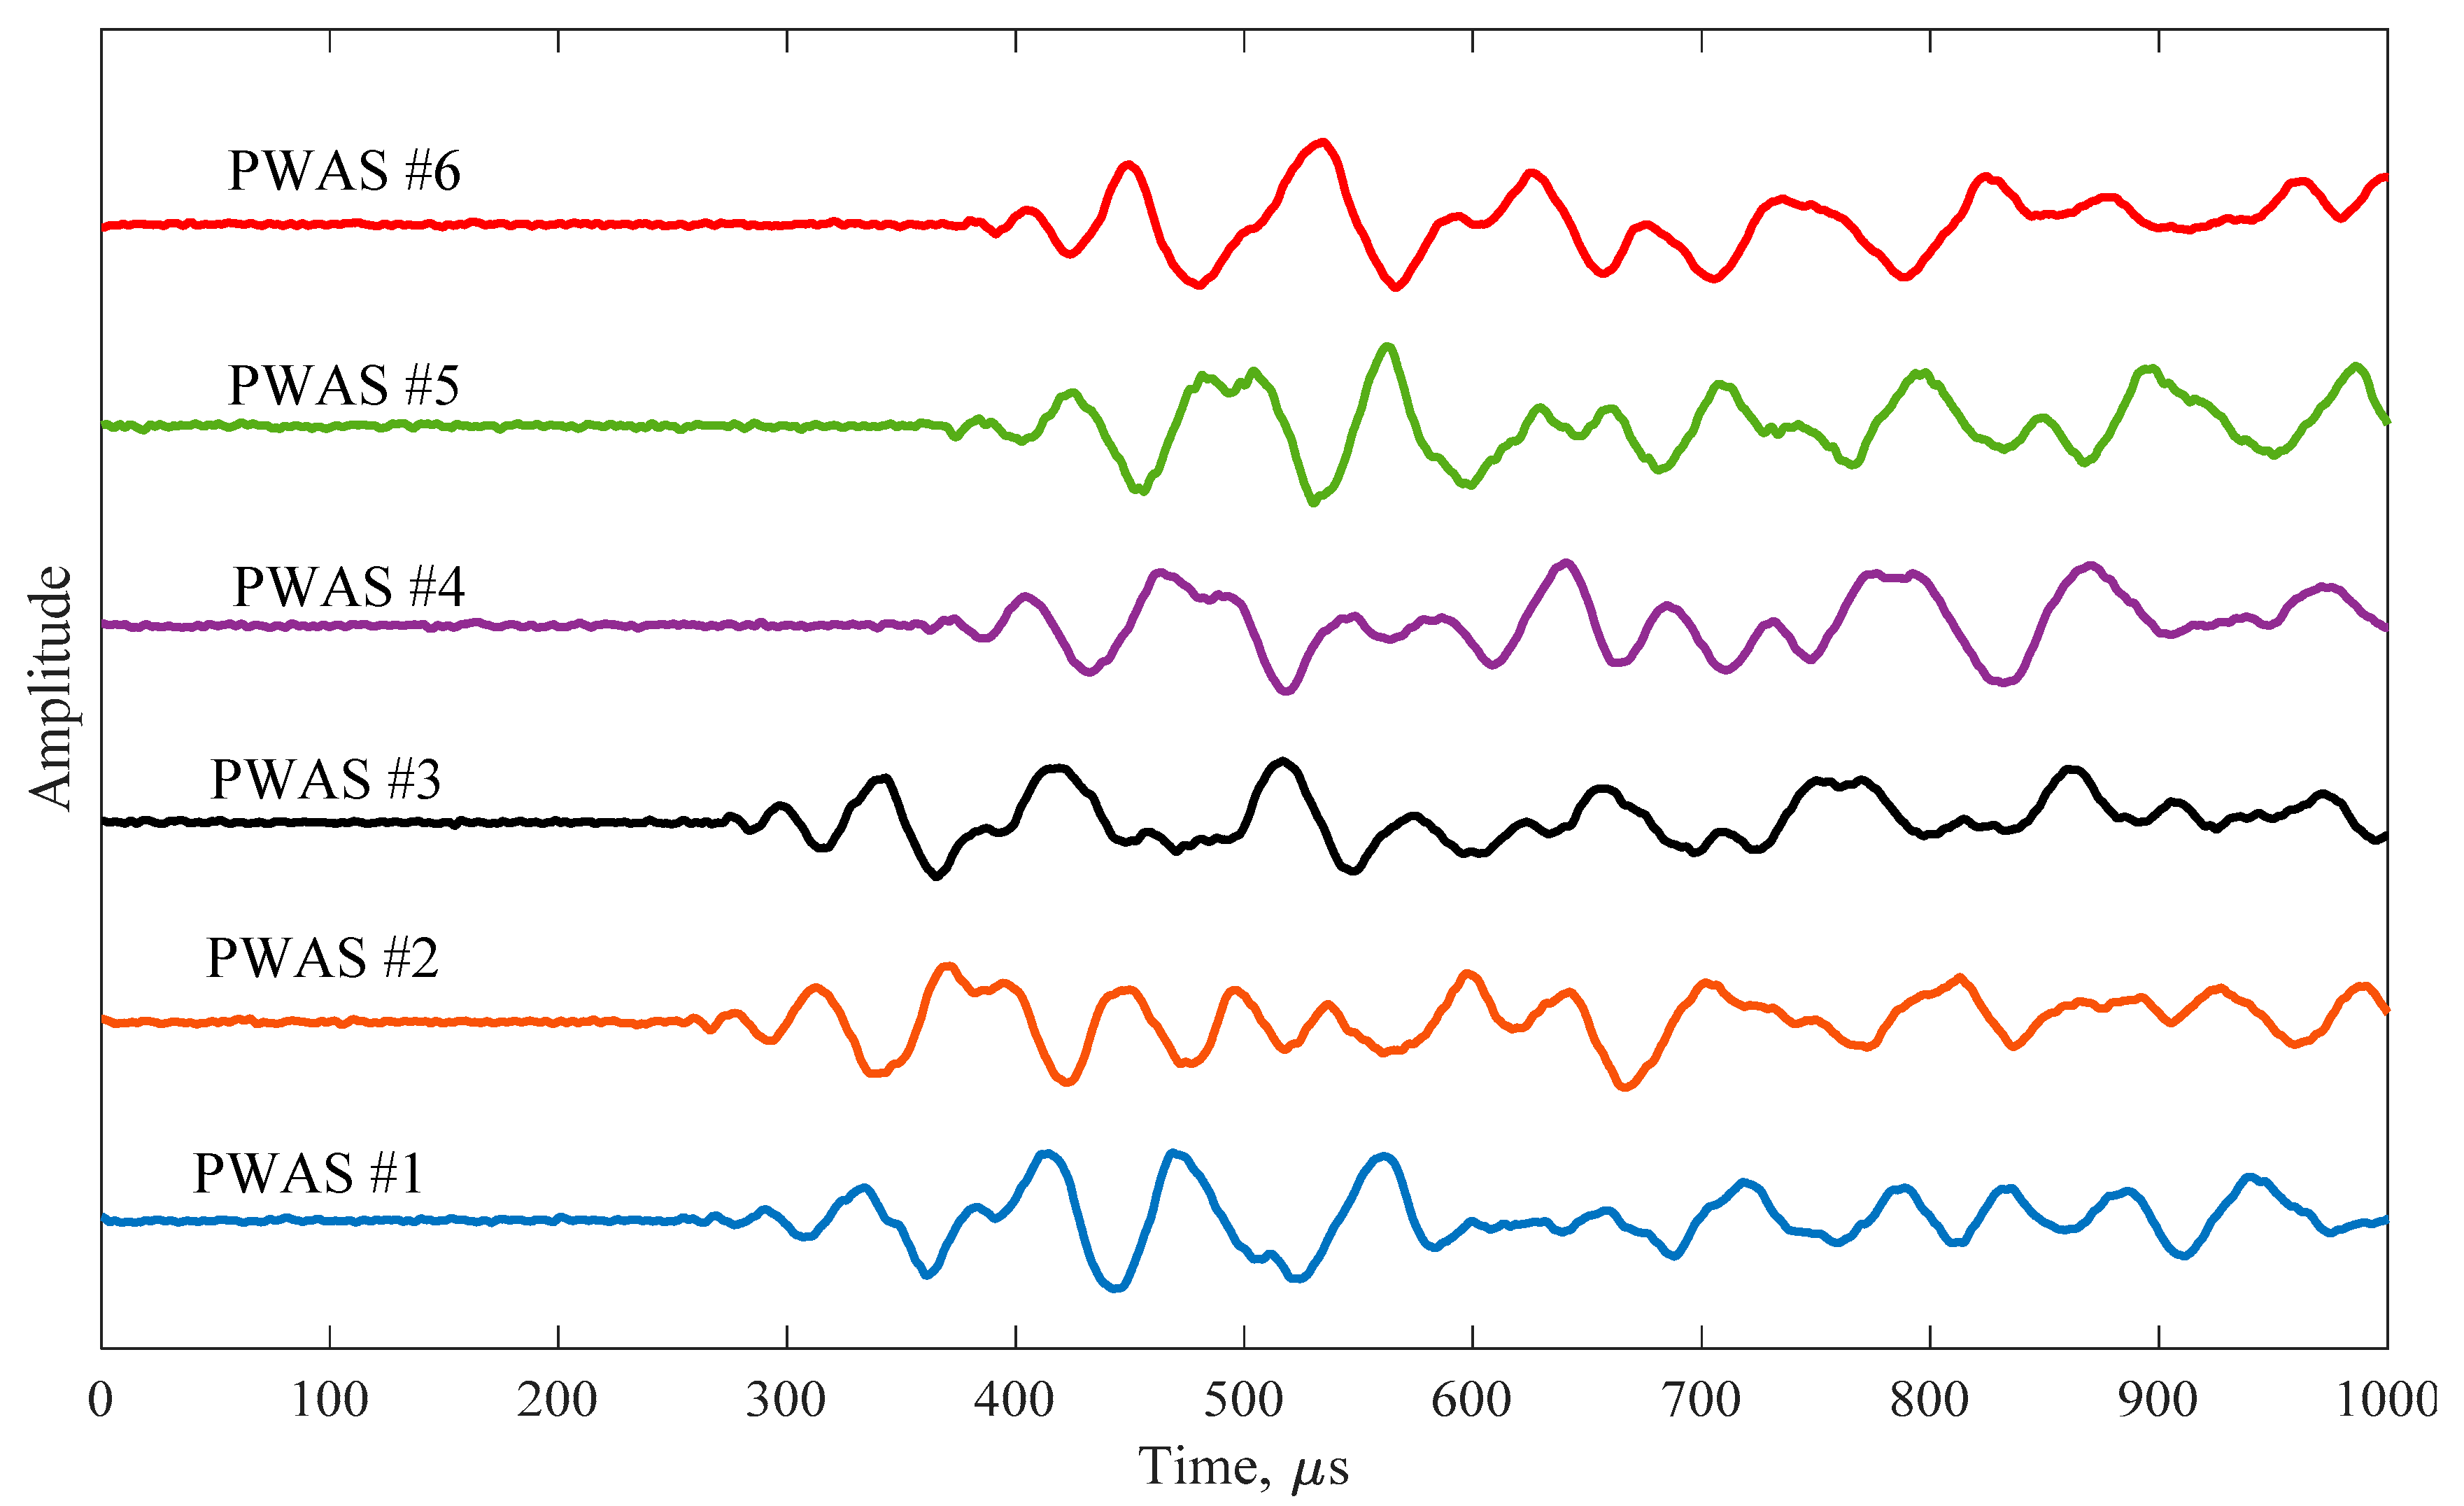
Figure 11.
Imaging results of localization high-energy impact at point #R1 (128, 167) mm using imaging methods; (a) summation method; (b) multiplication method (+ sign corresponding to different sensors location).
Figure 11.
Imaging results of localization high-energy impact at point #R1 (128, 167) mm using imaging methods; (a) summation method; (b) multiplication method (+ sign corresponding to different sensors location).

Figure 12.
Experimental setup for the ultrasonic inspection of composite plate under water.

Figure 13.
Scan area of the composite plate for immersion ultrasonic inspection.

Figure 14.
C-scan image of the composite plate for manufacturing defect inspection.

Figure 15.
C-scan image of the composite plate after high-energy impact event (a) impact at R1 location (b) impact at R2 location.
Figure 15.
C-scan image of the composite plate after high-energy impact event (a) impact at R1 location (b) impact at R2 location.


Table 1.
Experimental measurement vs. actual location of the low-energy impact.
| Impact Event | Actual Location (x, y) mm | Measured Location (x, y) mm | % of Error (Based on Sensor Cluster1) |
|---|---|---|---|
| #1 | (120, 170) | (117.7, 161.9) | 6.7% |
| #2 | (170, 170) | (166, 163.8) | 4.8% |
| #3 | (150, 200) | (147.4, 197.8) | 1.9% |
| #4 | (100, 200) | (101.8, 195.5) | 2.7% |
| #5 | (130, 250) | (131.7, 251.6) | 0.9% |
Table 2.
Experimental measurement vs. actual location of the high-energy impact.
| Impact Event | Actual Location (x, y) mm | Measured Location (x, y) mm | % of Error (Based on Sensor Cluster1) |
|---|---|---|---|
| #1 | (128, 167) | (127, 165) | 2.4% |
| #2 | (147, 207) | (146, 204) | 2.8% |
© 2018 by the authors. Licensee MDPI, Basel, Switzerland. This article is an open access article distributed under the terms and conditions of the Creative Commons Attribution (CC BY) license (http://creativecommons.org/licenses/by/4.0/).
Share and Cite
MDPI and ACS Style
Faisal Haider, M.; Migot, A.; Bhuiyan, M.Y.; Giurgiutiu, V. Experimental Investigation of Impact Localization in Composite Plate Using Newly Developed Imaging Method. Inventions 2018, 3, 59. https://doi.org/10.3390/inventions3030059
AMA Style
Faisal Haider M, Migot A, Bhuiyan MY, Giurgiutiu V. Experimental Investigation of Impact Localization in Composite Plate Using Newly Developed Imaging Method. Inventions. 2018; 3(3):59. https://doi.org/10.3390/inventions3030059
Chicago/Turabian StyleFaisal Haider, Mohammad, Asaad Migot, Md Yeasin Bhuiyan, and Victor Giurgiutiu. 2018. "Experimental Investigation of Impact Localization in Composite Plate Using Newly Developed Imaging Method" Inventions 3, no. 3: 59. https://doi.org/10.3390/inventions3030059