Pulling Exercises for Strength Training and Rehabilitation: Movements and Loading Conditions


1
Institute for Biomechanics, ETH Zürich, 8049 Zürich, Switzerland
2
Leopold-Ruzicka-Weg 4, 8093 Zürich, Switzerland
*
Author to whom correspondence should be addressed.
J. Funct. Morphol. Kinesiol. 2017, 2(3), 33; https://doi.org/10.3390/jfmk2030033
Submission received: 8 July 2017
/
Revised: 5 September 2017
/
Accepted: 6 September 2017
/
Published: 19 September 2017
Abstract
:The back is an extremely common site of injury among both athletes and sedentary people. Furthermore, low back pain has become prevalent in our society. Maintaining strong back muscles can help prevent future pain or injuries. Here, the aim is therefore to assess the kinetic and kinematic movements of four pulling exercises with different external loading directions. Fifteen healthy subjects were analyzed using a 3D motion capture system. The pulley machine was equipped with a load cell for force data acquisition. The exercises consisted of 8 repetitions each of the lat pulldown (25% and 50% body weight (BW) extra load), the lat pulldown with 45° incline (10% and 25% BW), the seated cable row (25% and 50% BW) and the upright row (standing, 10% and 25% BW). The minimum and maximum curvature angle in the thoracic as well as the lumbar spine was larger during the upright row than during the other exercises. Furthermore, during the upright row, the sagittal moment in the shoulder joint is opposed to the other exercises in the direction of retroversion. Due to the higher lumbar curvature observed in low back patients, to avoid overload, it is not advisable for patients with back pain to perform upright rows.
1. Introduction
Low back pain is arguably one of the most common health problems in the general population, and has been extensively studied in the past few decades [1,2]. Even though low back pain is not a life-threatening disorder, it remains a major health issue in all age groups. It has led to excessive medical expenditures that continue to increase with an aging population [3]. Moreover, low back pain patients are usually limited in their ability to work, which leads to extensive associated social costs [4,5,6]. As an example, a study in Switzerland found that the direct costs of low back pain totaled €2.6 billion, and the total expenditure represented 1.6% to 2.3% of the Gross Domenic Product [7].
More specifically, chronic low back pain represents the most debilitating condition and a leading cause of disability among the active population [8]. It is categorized as chronic pain when it affects one’s quality of life over a period of at least three months. Although studies have shown that low back pain patients still have a good prognosis with conservative management, recurrence is very common [9], and it takes a substantial amount of time to recover completely [10]. However, numerous patients choose to undergo surgery for long-term pain relief [11]. Moreover, studies have reported higher depression and anxiety rates among this cohort [12]. As a result, the recovery process can become more challenging and lengthy.
With a lifetime prevalence of 80%, most people will eventually suffer from back pain [11,13]. Men and women are equally affected, and it has been shown that various factors may contribute to this condition. Low back pain is generally associated with damage to anatomical structures of the back, which can develop over time or result from acute overload. Frequently, muscle strain, ligament or intervertebral disc damage are the underlying causes. Additional factors have been linked to low back pain including age, obesity, low educational attainment or psychological disorders [11]. As outlined above, the onset of the pain is not always sudden, and it is thus difficult to identify the actual cause [14].
In most cases, trunk muscle imbalance is associated with a higher risk of developing back pain [15]. A weak core is unable to protect the spine and the surrounding structures from mechanical stress [16,17]. Developing proper posture and spinal alignment or maintaining mobility during episodes of back pain is critical to stimulating the recovery process. Additionally, a stronger back can moderately enhance power and speed, which can subsequently benefit recreational athletes in all types of activities [18,19,20].
Within this framework, it is clear that the population should strive to maintain a healthy and functional trunk. The conscientious practice of strength exercises for the back and abdominal muscles is not only important to alleviate acute back pain but also to minimize the incidence of recurrence. To this effect, all muscle groups in the trunk have to be trained, focusing on the interplay of antagonist as well as synergistic muscles. For this, pulling exercises using a cable machine in either a seated or standing position are commonly performed exercises.
However, it is essential to perform these moves cautiously as otherwise there is a risk of increasing the injury rate. This is of major concern to the medical community, because there is evidence that proper execution of the exercises is constantly overlooked by recreational athletes [21]. It has been established that, after the shoulders, the back is the second most common site of injury in fitness centers, which is mainly due to major overload or improper execution [22]. The loading and motion of the trunk is already known for classic exercises for the back such as deadlifts, good mornings [23] and back extensions [24]. However, it is firmly believed that variation is key in strength training or injury prevention, and it is therefore best to investigate a variety of complementary exercises.
To our knowledge, analyses of pulley exercises for the back have mainly focused on maximal power output or electromyographic (EMG) activity [25,26,27,28]. For instance, the global muscle contraction under the different activity stimuli was studied, and it was revealed that all selected exercises activate the latissimus dorsi and trapezius, but to varying degrees [29]. The cable row was found to involve the highest latissimus dorsi activity, whereas the upright row would trigger high firing activity in the upper trapezius [29]. Additionally, the kinetics and kinematics of the seated row in elite athletes was described but only included limited biomechanical associations [30]. A detailed analysis of the trunk motion and loading during different pulling exercises is lacking.
Therefore, the present study focuses on a group of complementary pulling exercises as follows: the latissimus (lat) pulldown, the 45° lat pulldown, the seated cable row and the upright row (Figure A1, Figure A2, Figure A3 and Figure A4). The aim is to quantify and compare the motion as well as the maximum external joint moments in the shoulder joint in all anatomical planes as well as on the range of motion of the spine during these exercises.
2. Methods
2.1. Subjects
A total of eight males and seven females were recruited for this study (aged 23 ± 2 years, mass 67.9 ± 11.3 kg, height 176 ± 9 cm). The inclusion criteria were as follows: aged 18–45 years, physically active (>3 h/week), and familiar with the selected exercises. Candidates were excluded if they were injured, sick or under medical treatment at the time of the experiment. Participants were asked to wear athletic shorts. Women were additionally required to wear a bikini top. The study was approved by the Ethics Committee of ETH Zürich (EK 2016-N-78), and prior to the study, all participants gave written informed consent.
2.2. Measurement Procedures
All measurements were performed using a Technogym Ercolina Rehab adjustable cable pulley station (Isotonic Line, Technogym Ltd., Cesena, Italy) in the Motion Analysis Laboratory at ETH Zürich. To define the joint centers for the skin marker model, the subjects first performed standardized basic motion tasks (BMT) [31]. After a specific five-minute warm-up session using warm up sets of the exercises, each subject received standard instructions and performed two sets of eight repetitions for the four selected pulling exercises: the lat pulldown (LP), the lat pulldown with 45° incline (45LP), the seated cable row (SR) and the upright row (UR). The UR was performed in a standing position, whereas the other exercises were performed seated.
For the SR and LP, the first set was performed with a load equal to 25% of the subject’s bodyweight (BW), and the second set was performed with a load equal to 50% of the subject’s BW. For the LP45 and the UR, the load was 10% BW for the first set and 25% BW for the second set. A break of 1–2 min was allowed between each set and each exercise to avoid undesired effects of fatigue.
2.3. Data Acquisition
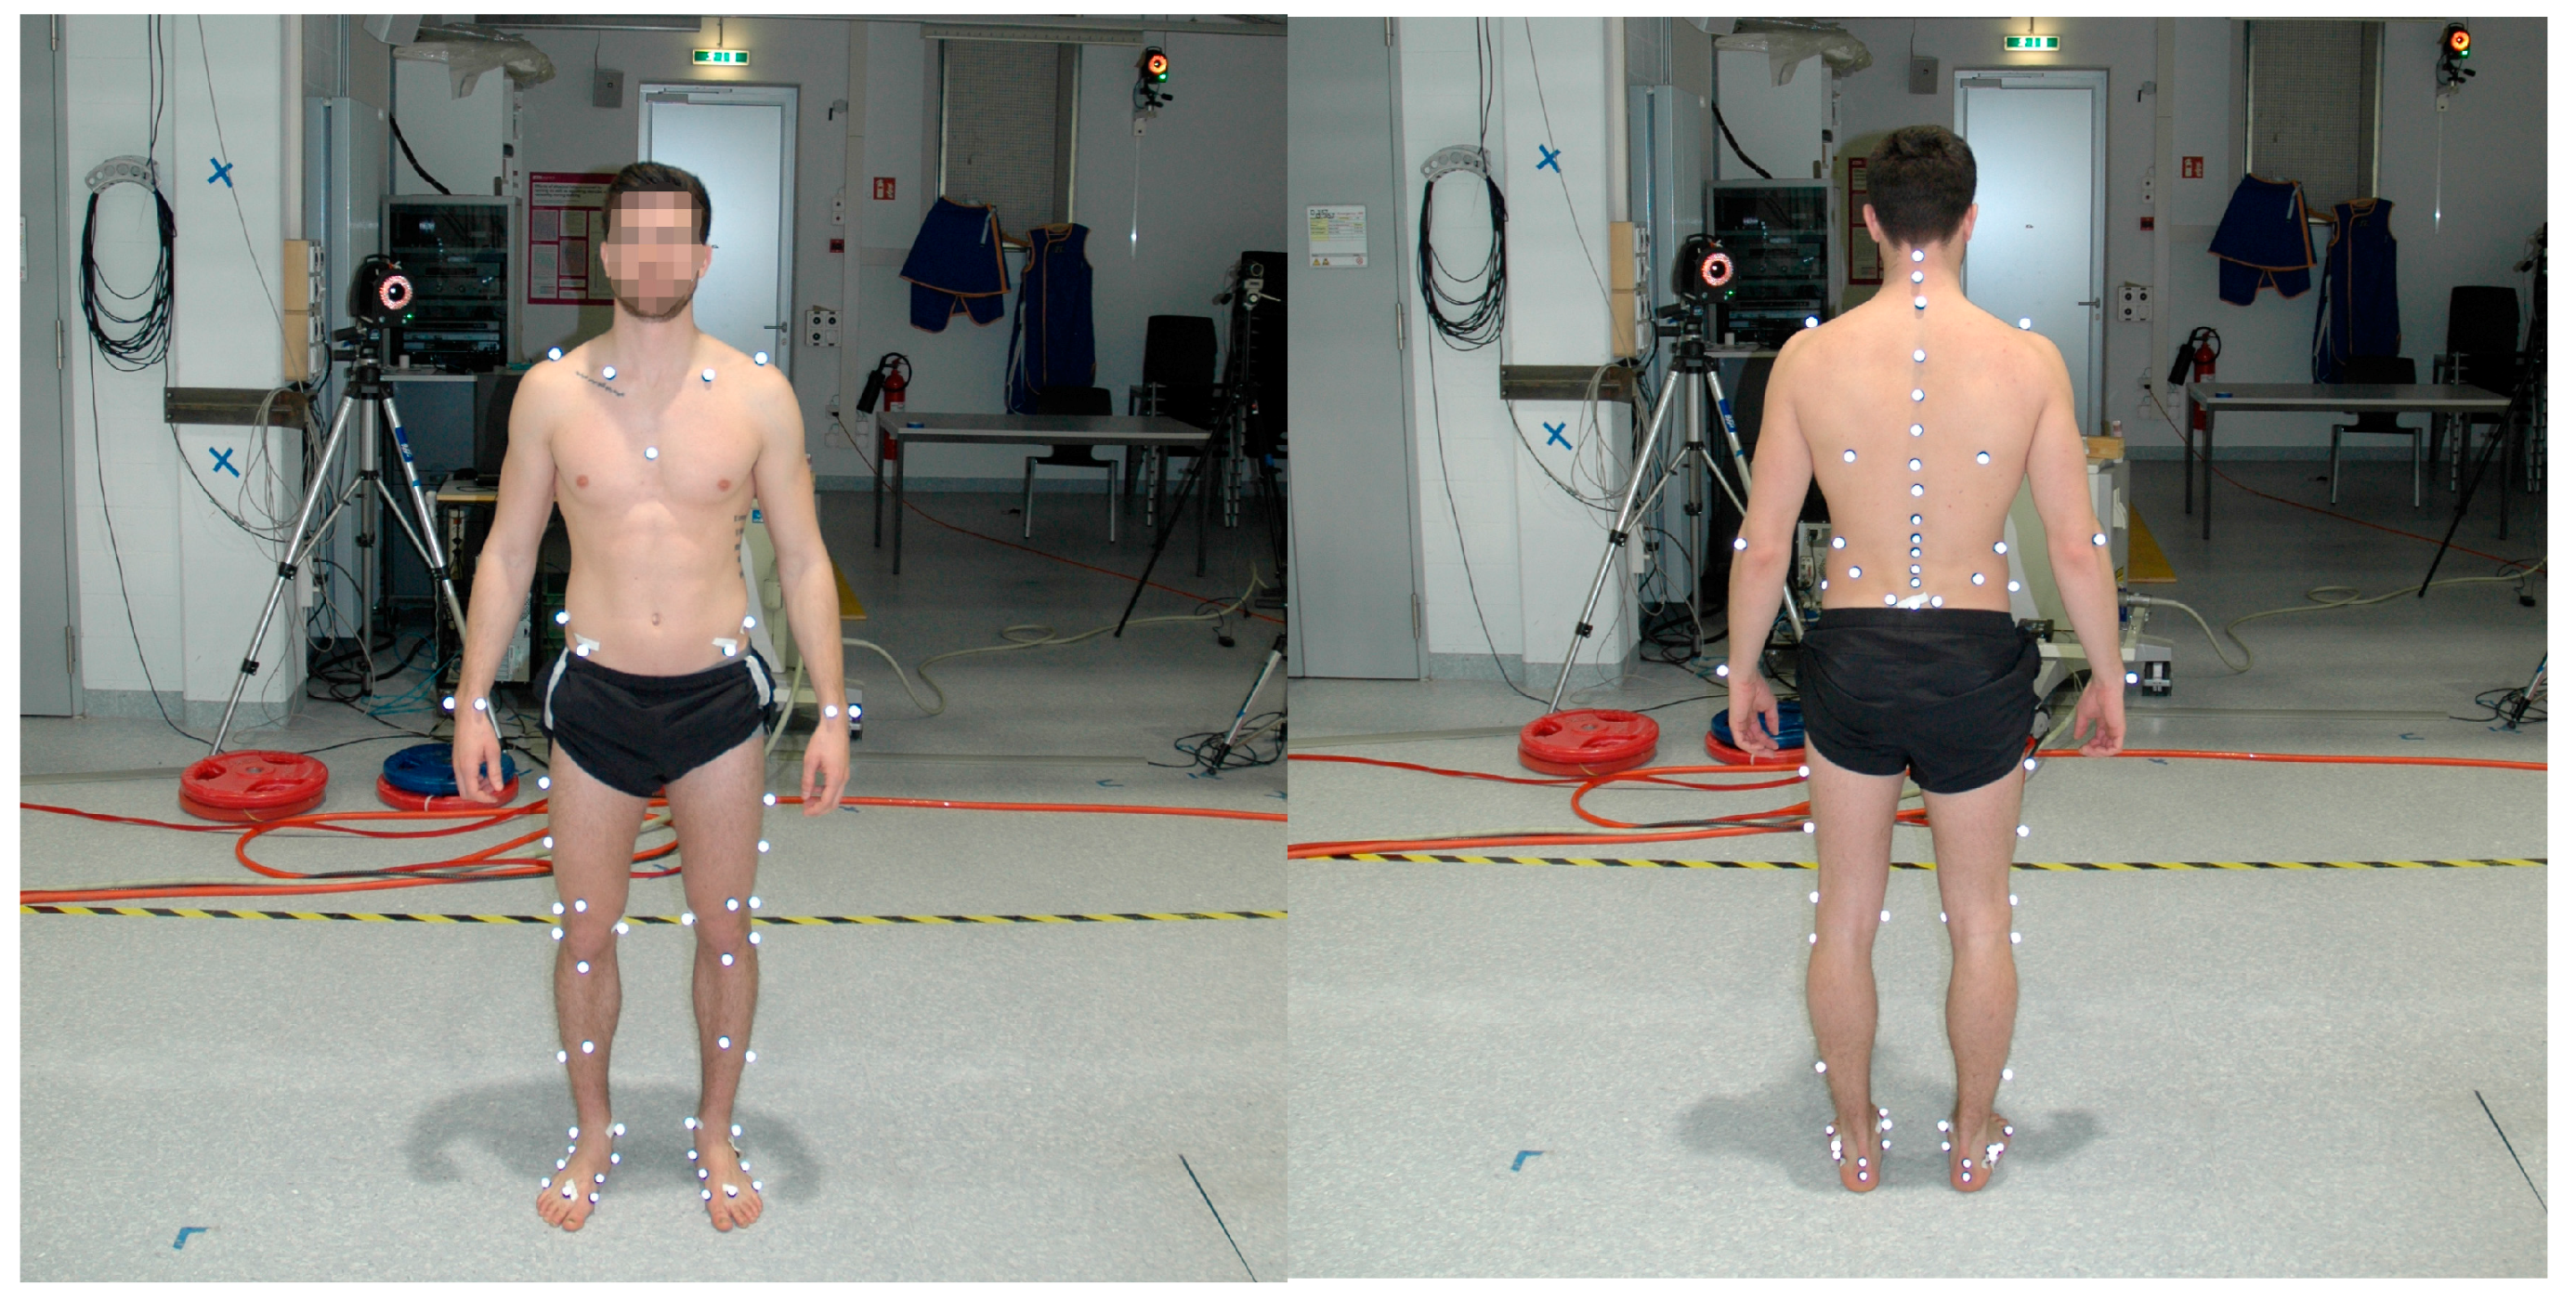
To capture the kinematics, an opto-electronic motion capture system (Vicon, Oxford Metrics Group, Oxford, UK) was used. This system relies on 22 infrared cameras that operate at a frequency of 100 Hz. The skin markers were placed with double-sided skin-friendly tape according to List et al. [31]; 55 markers from the basic set were located on the legs, arms and trunk, and 22 markers were placed on the back (Figure A5). The markers were very light in weight and did not modify the subject’s normal range of motion or influence the movements.
To generate kinetic data, a 1-kN load cell operating at 2000 Hz (SM-1000N, Interface Inc., Arizona, AZ, USA) was placed in series between the handle and the cable. Additionally, markers were distributed along the cable during the exercises to determine the precise direction of the force. This complete procedure permits comprehensive data collection for the ensuing inverse dynamics evaluation.
2.4. Data Processing and Analysis
All the kinematic data was reconstructed using Nexus (2.4, Vicon Motion Systems, Oxford Metrics Groups, Oxford, UK) and further analyzed using Matlab (MathWorks, USA, 2012a and 2015a). The kinetic data was integrated in the Matlab evaluation, and the joint moments were calculated using a quasi-static inverse dynamic approach [32,33].
Each exercise was divided into eight different cycles corresponding to the eight repetitions. The start point of each sequence was defined as the position with the shortest muscle length. Consequently, each cycle first contained an eccentric phase followed by a concentric phase. For all calculations, the average value over the eight repetitions of each individual subject was used and time-normalized.
Segments of the trunk were defined based on redundant marker clouds and corresponding relative angles were calculated. The shoulder joint was defined according to Rab [34]. Following that, the means and standard deviation (SD) were computed for the range of motion (ROM) of the shoulder joint. The ROM was defined as the difference between the smallest and largest inter-segmental angles. The standing trial was used as a basis to compute the relative positions of the two segments. For the spine, a segmental [31] and curvature approach [31,35,36] was used, and the curvature angle [37] was calculated.
Additionally, using an inverse dynamics approach, the maximum joint moments in the shoulder were calculated for the three anatomical planes and were normalized to the participant’s BW. Since only a central load cell registers kinetic data, the force was assumed to be evenly split between both shoulders, and the mean value of both shoulder joint moments was then used for further calculation. Positive values indicated flexion, adduction or internal rotation moments.
The differences in the angles of curvature were statistically investigated for the four selected exercises. For the statistical testing independent samples t-tests and analyses of variance (one-way ANOVA [38]) with Bonferroni correction were used. These tests require normal distribution and homogeneity of variances of the data. This was tested using a Kolmogorow-Smirnow test. The significance level was set at p < 0.05. In order to analyze the reliability, the ICC(3,k) values were used. We assumed 0.75–0.9 as “good reliability” and values above 0.9 as “excellent reliability” [39]. All statistical analyses were performed using IBM SPSS software (Zürich, Switzerland, version 23).
3. Results
3.1. Kinematics
The ROM of the curvature angles of the thoracic spine and the lumbar spine was the same for all exercises (Table 1 and Table A2). The reliability of the minimal, maximal and ROM of the curvature was “excellent” in 45 cases and “good” in 3 cases (Table A8). Furthermore, the additional extra weight did not influence the curvature angles. The minimum and maximum curvature angles in the thoracic spine and the lumbar spine were larger during UR compared to LP, 45LP and SR. In the thoracic region, the data indicated that the angle of curvature reached its peak at the end of the eccentric muscle contraction (Figure 1).
For all exercises, rotation in the shoulder joint was primarily observed in the sagittal plane. The 45 LP yielded a greater sagittal ROM than all other exercises (Table A1). The UR exhibited the greatest ROM in the frontal plane and the least ROM in the transverse plane. Overall, the loading conditions did not have a significant impact on the ROM of the shoulder joint. The p-values and (χ2) are presented in Table A3.
3.2. Kinetics
The maximum moments in the shoulder joint in the three anatomical planes are detailed in Table 2. Significant differences in the peak joint moments were found in the majority of cases. The SRs exhibited the highest moments in the sagittal plane. In the frontal plane, the traditional LP was the only exercise to provoke large moments (Table 2).
The maximum total moments in the shoulder joint did not correlate directly with the extra load. The sagittal, frontal and transverse moments mainly differed significantly when comparing the different exercises using the same load. On the sagittal plane, where the largest moments were typically reported, the UR was the only movement that induced an extension moment (Table 2). In the transverse plane, the LP and 45LP generated an external rotation moment due to the larger-than-shoulder-width grip and the subsequent external shoulder rotation (Table 2).
The shoulder joint moments with respect to the shoulder joint angle are illustrated in Figure 2, Figure 3 and Figure 4. Predominantly, a load increase led to an analogous amplification of the moment, namely, an upward shift in the moment curve. Remarkably, large differences between the concentric and eccentric phases could be observed in the three anatomical planes for all exercises (Figure 2, Figure 3 and Figure 4). Except during URs, higher moments were achieved during the concentric loading phase. The p-values and (χ2) are presented in the Table A4, Table A5, Table A6 and Table A7.
4. Discussion
The loading conditions in the shoulder joint, as well as the movement of the trunk, during four different strength training exercises for the back were analyzed. The ROM of the curvature angle did not differ between the exercises. The maximal curvature and its corresponding angle are exercise-dependent, and may vary substantially. In this study, higher curvature angles during URs were attained in the lumbar and thoracic regions. It has been previously established that higher lumbar shear forces are related to a vast increase in the risk of injury [40]. Since strong erector muscles have been associated with lower shear forces [41], patients should ensure that these muscles are robust and stable enough before performing URs. Maintaining an appropriate lordotic curvature in the lumbar region will help reap the benefits of this exercise and lower the risk of injury. The standing position required for this exercise likely plays a crucial role in the increased curvature (Figure 1). Subjects who participate in these exercises should especially be careful during eccentric muscle contraction when the curvature angle reaches its peak (Figure 1). Recreational athletes tend to loosen tension in the core muscles during the eccentric phase and then rely on the passive resistance and weight of the upper limbs, which explains the higher trunk flexion.
Full range of motion has been associated with greater strength and muscle gains [42,43,44]. In this context, the LP and 45LP can be considered superior to the other exercises with regard to conditioning. From a biomechanical perspective, a complete ROM is also desirable because it helps target solely the region of interest and reduces the impact on other body parts. Regarding the ROM in the lower and upper back, no significant differences in ROM were observed among the exercises. The rotation between the lumbar and the thoracic segment was more pronounced in the sagittal plane; however, little inter-segmental motion was observed (mean < 10°).
On the three anatomical planes, the moments in the shoulder joint resulted in different directions depending on the movement (Figure 2, Figure 3 and Figure 4). This implies different agonist muscles and, consequently, different loading patterns. Remarkably, no accurate load-dependency was exposed in the results, and significant differences were thus observed between most exercises. As an illustration, due to the constrained movement, SRs only exhibited consequential moments in the sagittal plane, Other exercises could not emulate the extension moments in the sagittal plane that were obtained during URs (Figure 2). Drawing conclusions from these data, it can be assumed that the four exercises can complement each other in this respect.
Doma et al. [25] reported similar ROM in the back during the LPs. The results of Schellenberg et al. [23] also confirmed our findings regarding the ROM in the thoracolumbar spine. Deadlifts and good mornings were investigated by these authors, and both studies exhibited similar results as observed in the present work, namely, an extra load did not significantly influence the ROM.
A limitation of this study is the substantial inter-subject variability for the shoulder moments and the spinal curvature. Therefore, the means have to be considered carefully. The intra-subject variability was typically smaller than the inter-subject variability.
The four selected exercises showed different loading patterns, and our data indicated that these exercises allow for a complete back workout and could assuredly be included in a lower back pain prevention program or a strength training workout routine. To the best of our knowledge, healthy subjects could benefit from a program that combines these different exercises and, consequently, train through a full range of motion in the three principal directions. However, depending on the aim of the workout (e.g., targeting a precise lumbar curvature or minimizing the loading in a particular part of the back), these exercises can also be selected individually. Due to the higher lumbar curvature observed during URs, lower back pain patients may be advised to not perform this exercise during phases of acute pain, and to perform the exercise carefully—and thus with a proper stabilization of the spine—in order to avoid higher loads.
Acknowledgments
The technical support of Marco Hitz and Peter Schwilch is much appreciated.
Author Contributions
Silvio Lorenzetti: Design of the study, writing of the manuscript; Romain Dayer: Collection of the data, evaluation of the data, writing of the manuscript; Michael Plüss: Statistical evaluation of the data, working on the revisions; Renate List: Design of the study, writing of the manuscript.
Conflicts of Interest
The authors declare no conflict of interest.
Appendix A
Figure A1.
Experimental setup and execution of the lat pulldown. The subject with a complete “IfB marker set” is shown List et al. 2013 [31].
Figure A1.
Experimental setup and execution of the lat pulldown. The subject with a complete “IfB marker set” is shown List et al. 2013 [31].
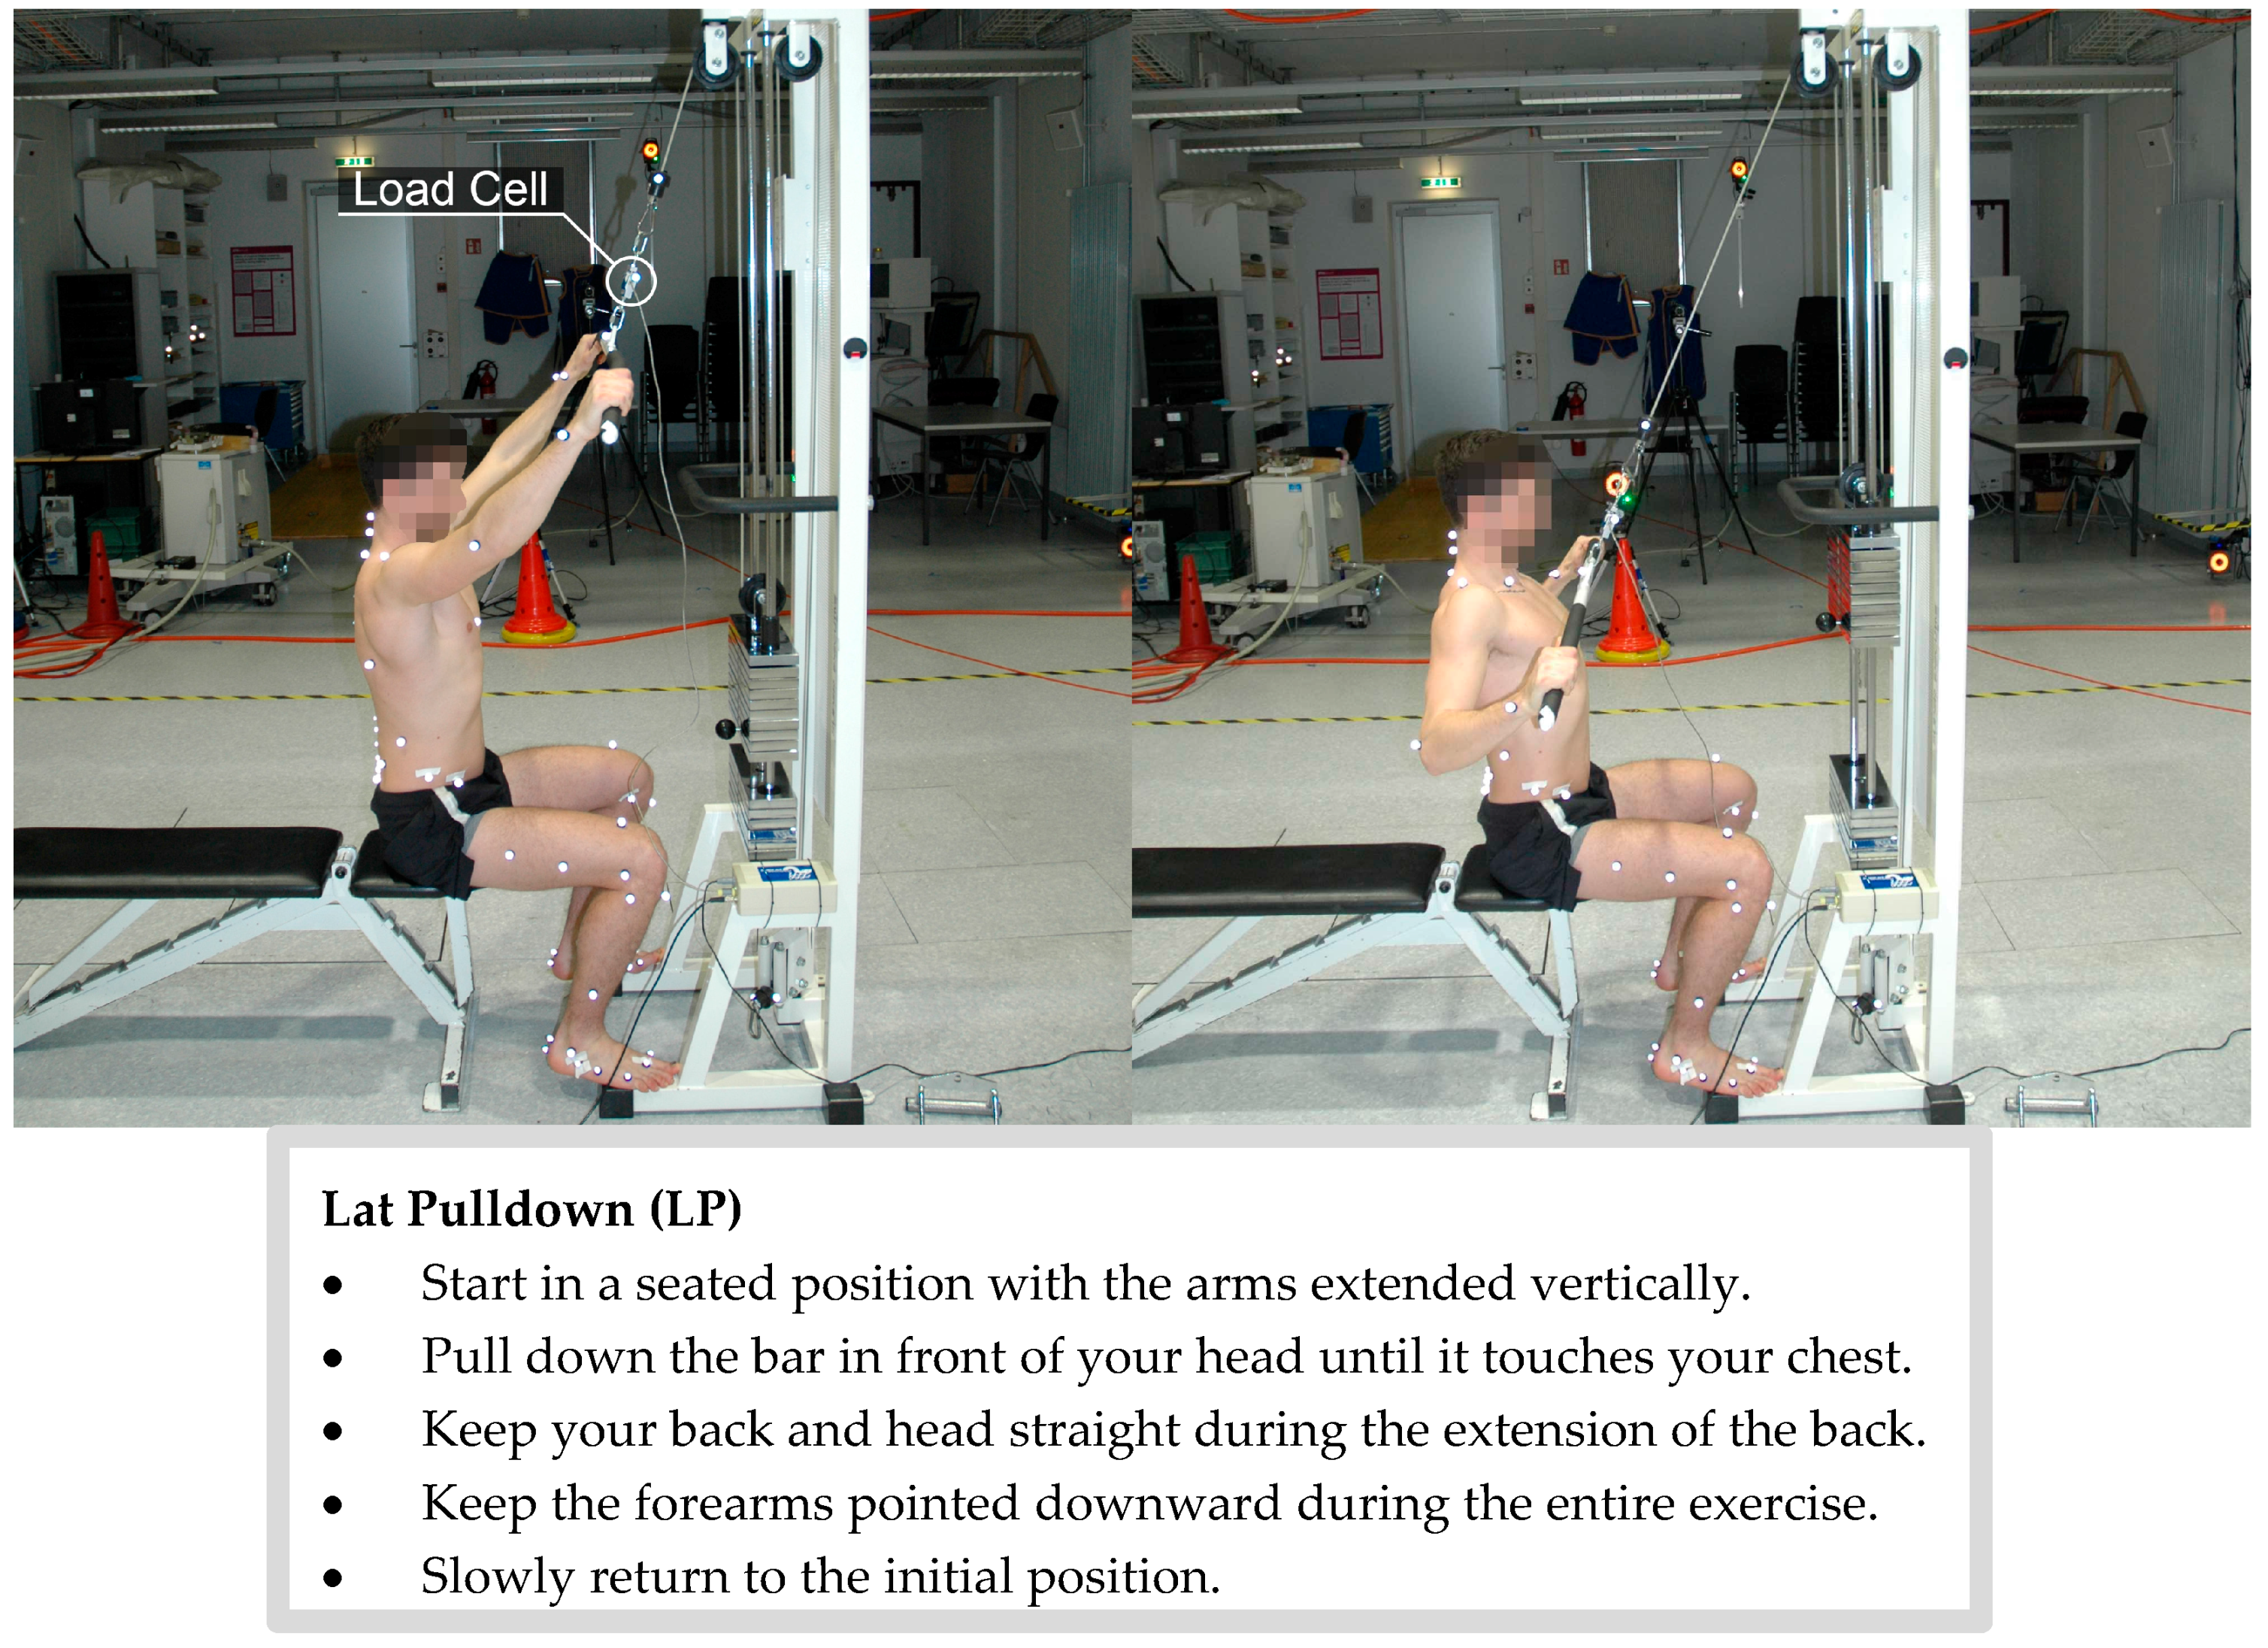
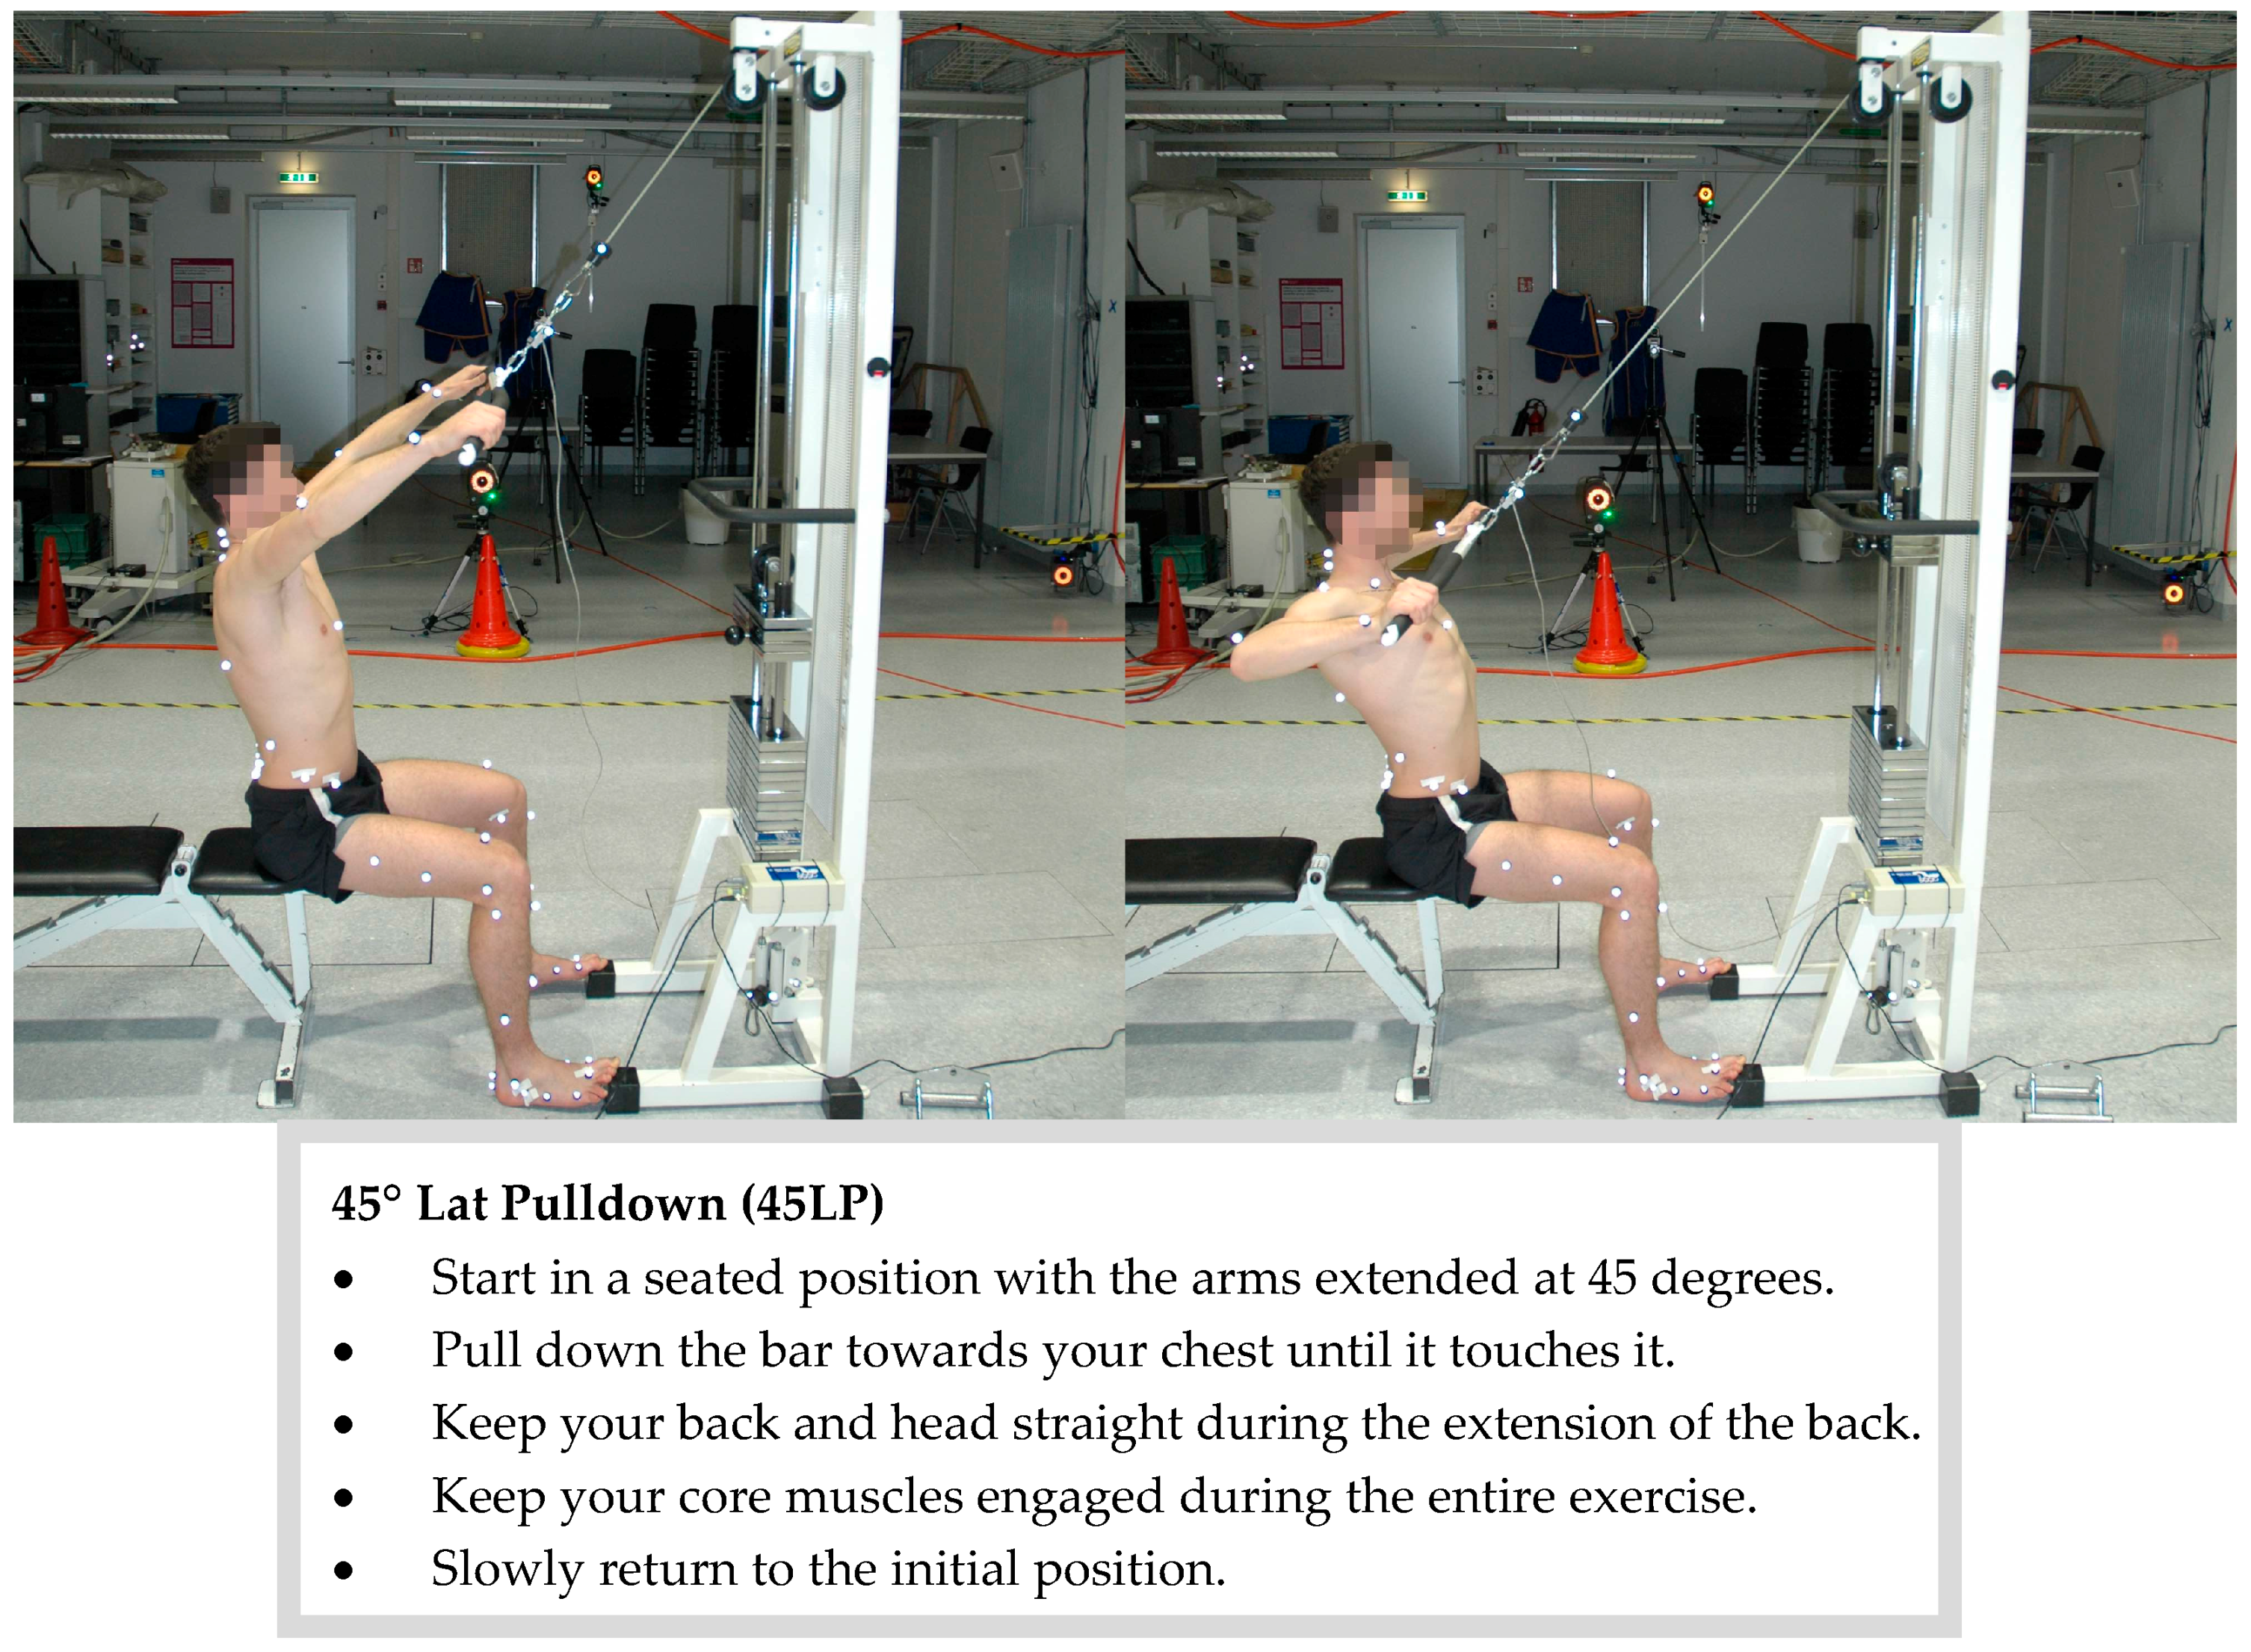
Figure A2.
Experimental setup and execution of the 45° lat pulldown. The subject with a complete IfB marker set is shown.
Figure A2.
Experimental setup and execution of the 45° lat pulldown. The subject with a complete IfB marker set is shown.

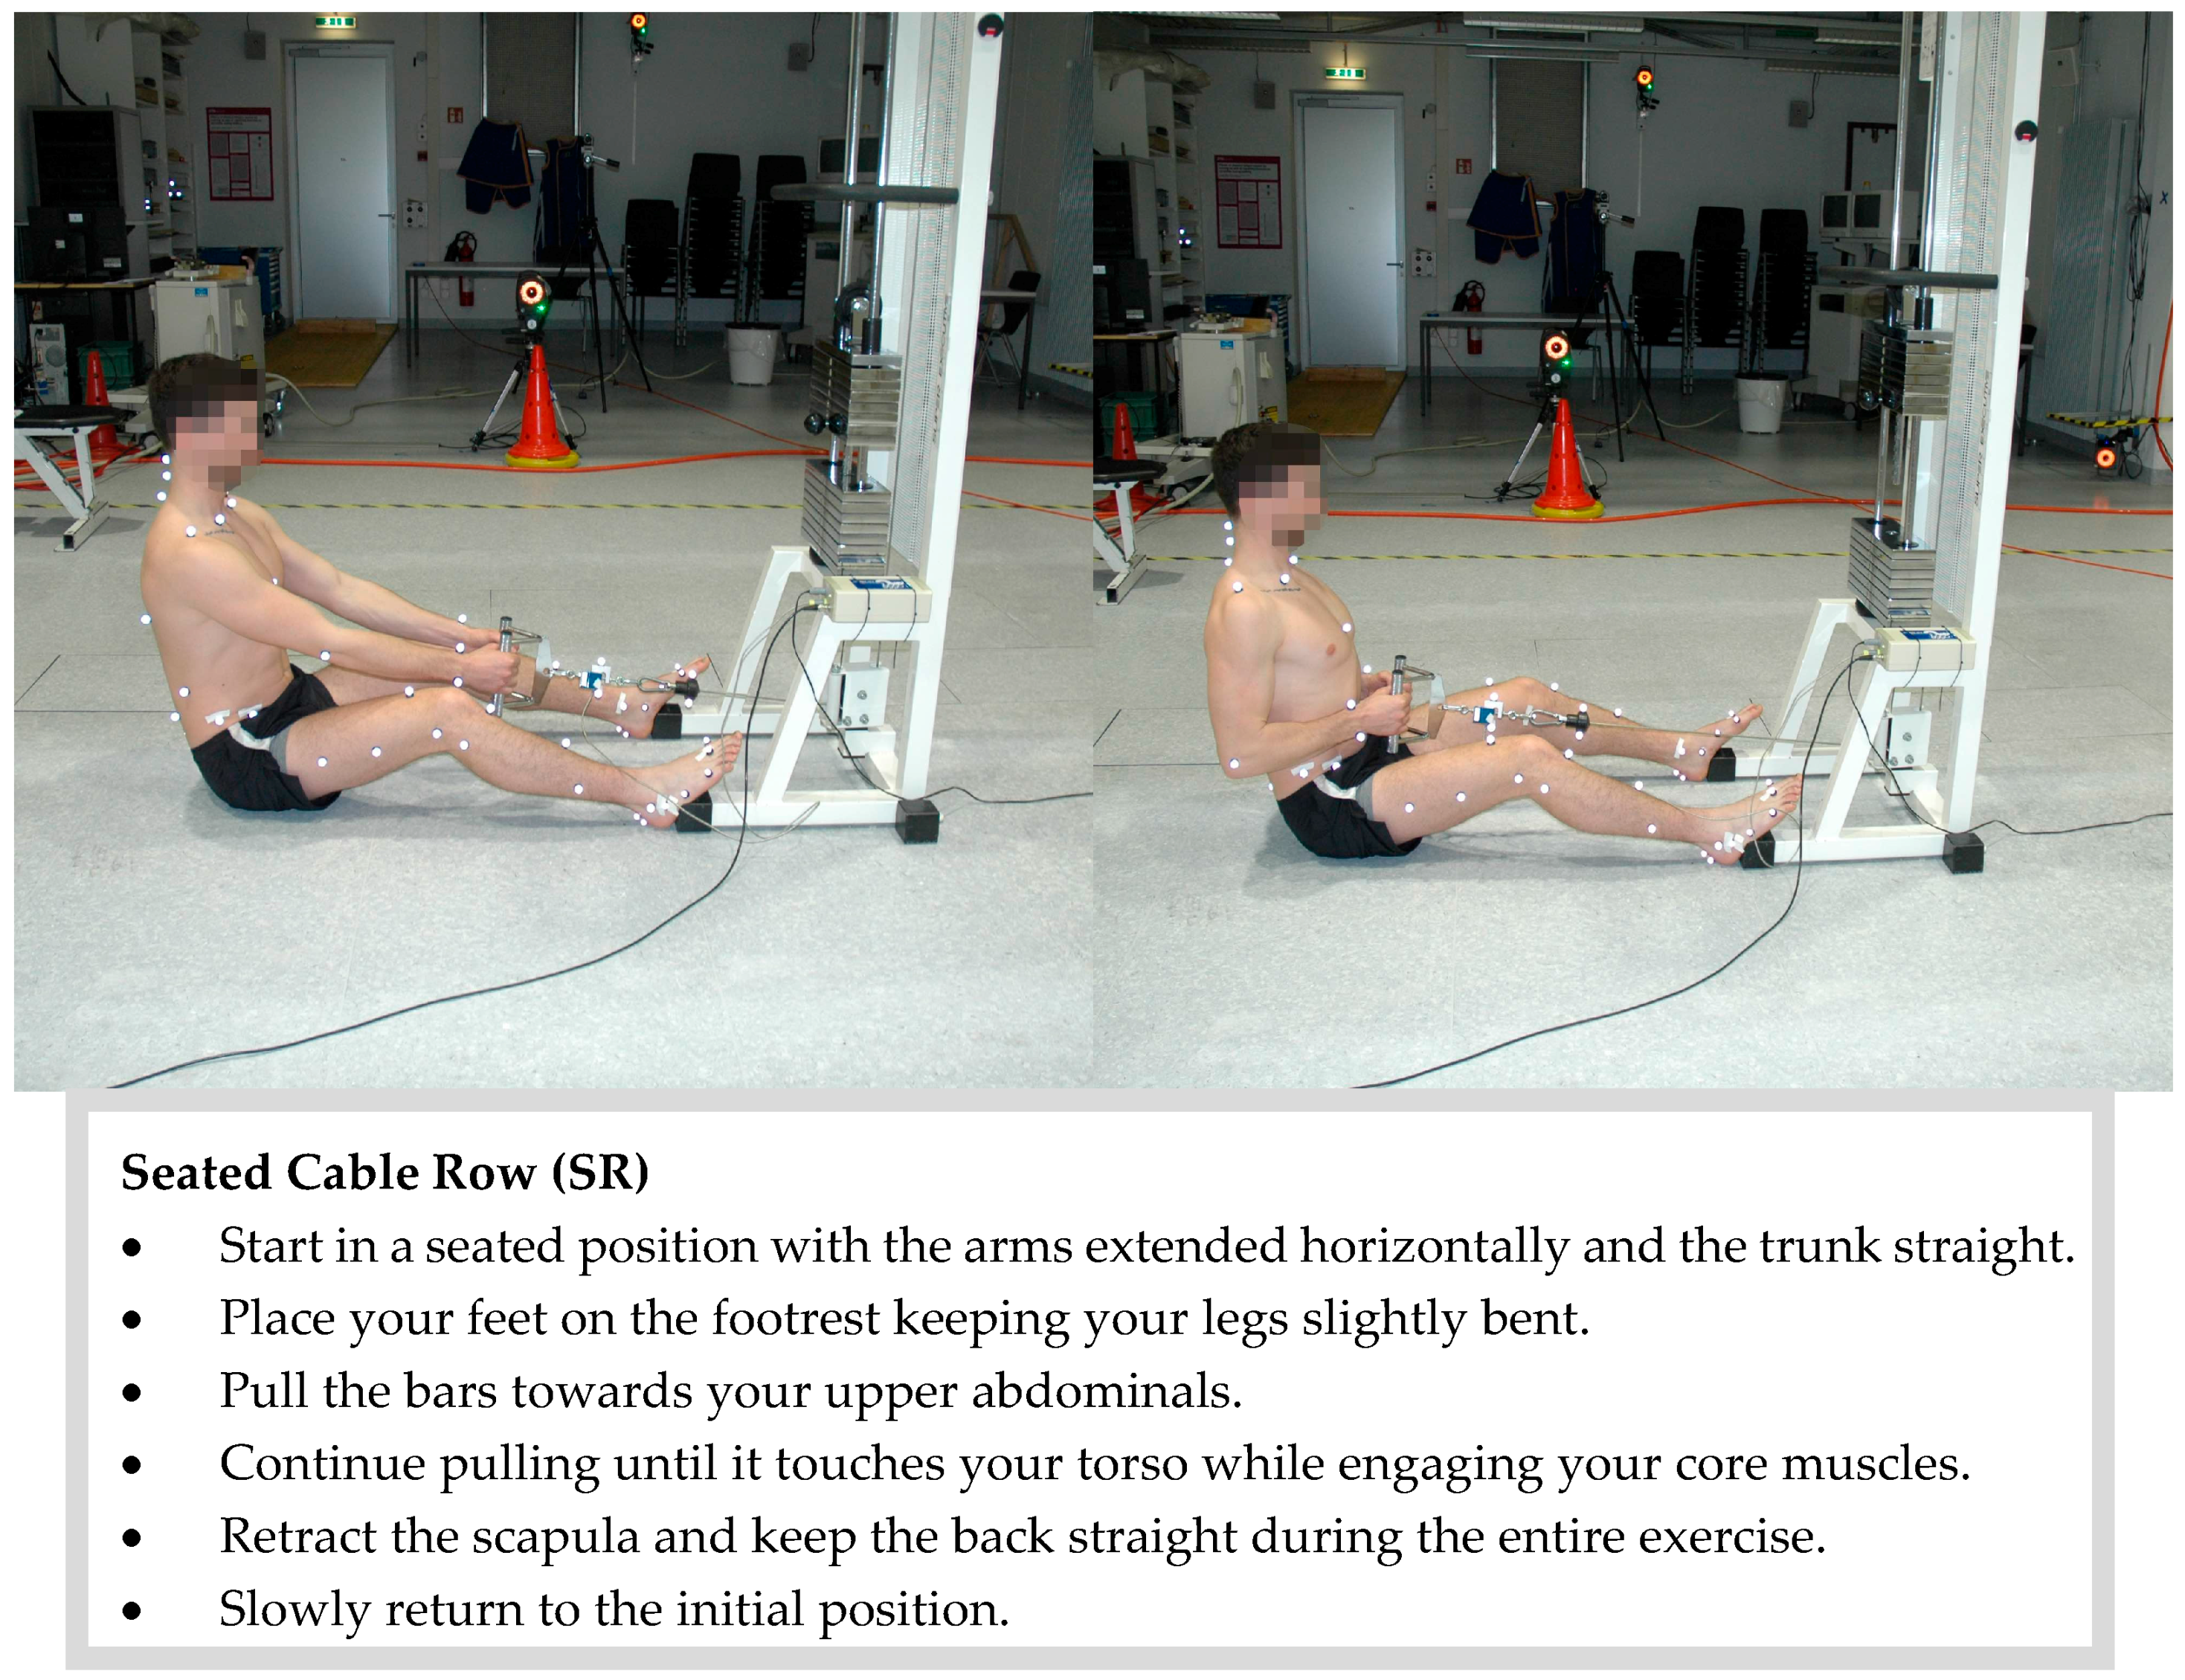
Figure A3.
Experimental setup and execution of the seated cable row. The subject with a complete IfB marker set is shown.
Figure A3.
Experimental setup and execution of the seated cable row. The subject with a complete IfB marker set is shown.

Figure A4.
Experimental setup and execution of the upright row. The subject with a complete IfB marker set is shown.
Figure A4.
Experimental setup and execution of the upright row. The subject with a complete IfB marker set is shown.
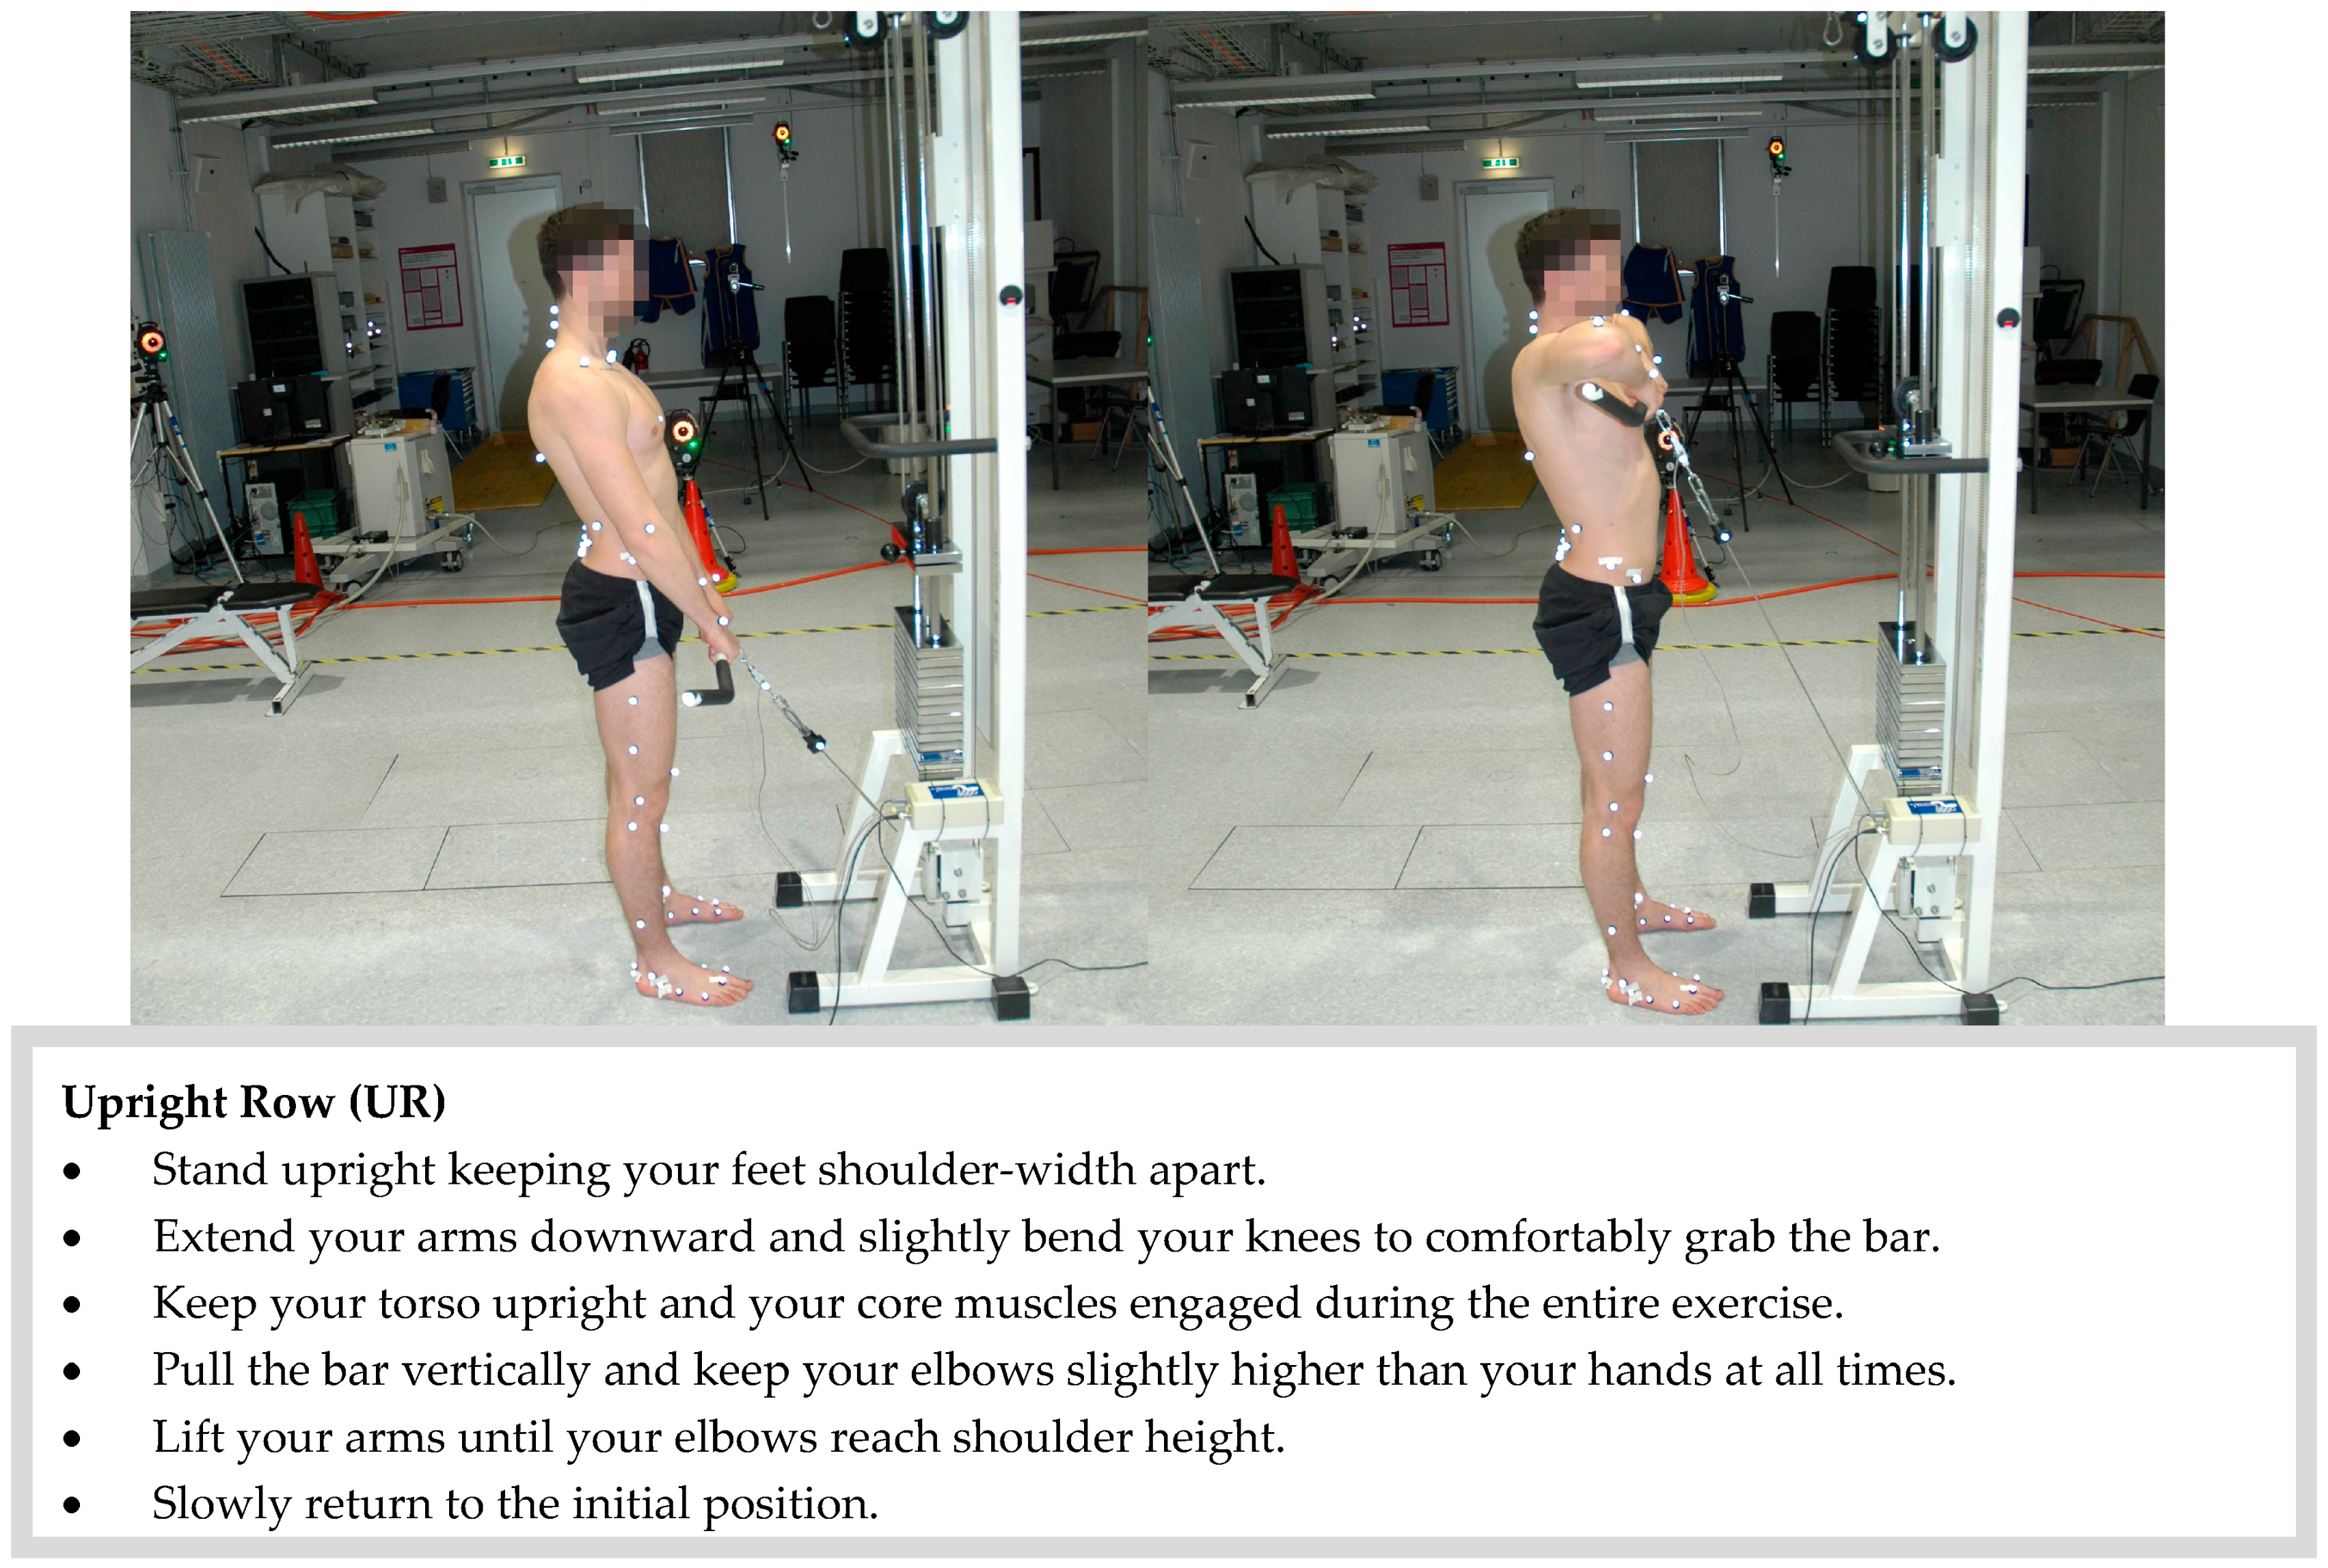
Figure A5.
Subject with complete IfB marker set. On the left side: 55 markers on the legs, pelvis, shoulders and arms. On the right side: 22 markers on the back.
Figure A5.
Subject with complete IfB marker set. On the left side: 55 markers on the legs, pelvis, shoulders and arms. On the right side: 22 markers on the back.


Table A1.
Range of motion (ROM) and standard deviation in the segments of the spine and in the shoulder joint for all subjects. Body weight (BW).
Table A1.
Range of motion (ROM) and standard deviation in the segments of the spine and in the shoulder joint for all subjects. Body weight (BW).
| Segmental Motion | Lat Pulldown | 45° Lat Pulldown | Seated Cable Row | Upright Row | |||||
|---|---|---|---|---|---|---|---|---|---|
| 25% BW | 50% BW | 10% BW | 25% BW | 25% BW | 50% BW | 10% BW | 25% BW | ||
| ROM Lumbar Rel thoracic Back (°) | Sagittal | 5.2 ± 1.2 | 9.6 ± 4.5 | 7.2 ± 3.4 | 7.2 ± 3.2 | 3.8 ± 1.4 | 5.5 ± 2.3 | 4.2 ± 1.6 | 6.7 ± 3.9 |
| Frontal | 2.1 ± 0.7 | 2.6 ± 1.0 | 1.9 ± 0.4 | 2.1 ± 0.5 | 2.0 ± 0.4 | 2.3 ± 0.8 | 1.6 ± 0.4 | 2.1 ± 0.7 | |
| Transverse | 1.4 ± 0.4 | 2.1 ± 0.5 | 1.3 ± 0.4 | 1.5 ± 0.3 | 1.0 ± 0.3 | 1.2 ± 0.5 | 1.2 ± 0.3 | 1.5 ± 0.5 | |
| ROM Shoulder Joint (°) | Sagittal | 172.9 ± 9.6 | 158.9± 15.3 | 218.8 ± 46.2 | 191.1 ± 33.3 | 78.7 ± 19.9 | 82.3 ± 10.4 | 114.9 ± 14.6 | 106.4 ± 20.0 |
| Frontal | 88.4 ± 10.6 | 86.7± 11.0 | 58.8 ± 14.8 | 69.7 ± 14.2 | 16.8 ± 5.3 | 13.1 ± 3.6 | 102.2 ± 10.6 | 100.1 ± 13.9 | |
| Transverse | 90.5 ± 13.4 | 85.1± 18.6 | 102.1 ± 8.7 | 104.0 ± 10.0 | 147.0 ± 40.6 | 111.7 ± 58.5 | 45.1 ± 5.9 | 50.3 ± 10.5 | |
Table A2.
Mean and maximum values over all subjects for the curvature in the thoracic and lumbar regions.
Table A2.
Mean and maximum values over all subjects for the curvature in the thoracic and lumbar regions.
| Curvature | Lat Pulldown | 45° Lat Pulldown | Seated Cable Row | Upright Row | |||||
|---|---|---|---|---|---|---|---|---|---|
| 25% BW | 50% BW | 10% BW | 25% BW | 25% BW | 50% BW | 10% BW | 25% BW | ||
| Mean Curvature (1/m) | Thoracic | 1.78 ± 0.73 | 1.85 ± 0.71 | 1.89 ± 0.74 | 1.81 ± 0.76 | 1.83 ± 0.77 | 2.16 ± 0.58 | 2.61 ± 0.62 | 2.63 ± 0.67 |
| Lumbar | 1.63 ± 1.92 | 0.58 ± 2.01 | 1.72 ± 2.01 | 1.46 ± 1.70 | −1.19 ± 1.00 | −0.45 ± 1.27 | 4.94 ± 1.58 | 4.84 ± 1.76 | |
| Max Curvature (1/m) | Thoracic | 2.03 ± 0.70 | 2.20 ± 0.72 | 2.19 ± 0.71 | 2.09 ± 0.71 | 2.09 ± 0.76 | 2.45 ± 0.54 | 2.84 ± 0.60 | 2.85 ± 0.64 |
| Lumbar | 2.16 ± 2.01 | 1.16 ± 2.11 | 2.22 ± 2.18 | 1.96 ± 1.83 | −0.82 ± 1.06 | 0.14 ± 1.43 | 5.46 ± 1.88 | 5.58 ± 2.08 | |
Table A3.
P-values and (χ2) for the maximum, minimum and ROM of the curvature angles in the thoracic and lumbar regions, mean and standard deviation over all subjects—was not analysed.
Table A3.
P-values and (χ2) for the maximum, minimum and ROM of the curvature angles in the thoracic and lumbar regions, mean and standard deviation over all subjects—was not analysed.
| P-Values and (χ2) | Lat Pulldown | 45° Lat Pulldown | Seated Cable Row | Upright Row | ||
|---|---|---|---|---|---|---|
| Max Curvature Angle (°) | Thoracic | LP | - | |||
| 45LP | 1.000 (0.001) | - | ||||
| SR | 1.000 (0.020) | 1.000 (0.014) | - | |||
| UR | 0.000 (0.258) | 0.000 (0.250) | 0.006 (0.168) | - | ||
| Lumbar | LP | - | ||||
| 45LP | 1.000 (0.001) | - | ||||
| SR | 0.237 (0.083) | 0.473 (0.049) | - | |||
| UR | 0.000 (0.509) | 0.000 (0.475) | 0.000 (0.643) | - | ||
| Min Curvature Angle (°) | Thoracic | LP | - | |||
| 45LP | 1.000 (0.000) | - | ||||
| SR | 1.000 (0.028) | 0.932 (0.032) | - | |||
| UR | 0.001 (0.219) | 0.000 (0.219) | 0.073 (0.107) | - | ||
| Lumbar | LP | - | ||||
| 45LP | 1.000 (0.000) | - | ||||
| SR | 0.591 (0.047) | 0.755 (0.037) | - | |||
| UR | 0.000 (0.561) | 0.000 (0.543) | 0.000 (0.656) | - | ||
| ROM Curvature Angle (°) | Thoracic | LP | - | |||
| 45LP | 1.000 (0.016) | - | ||||
| SR | 1.000 (0.014) | 0.343 (0.052) | - | |||
| UR | 1.000 (0.028) | 1.000 (0.000) | 0.283 (0.083) | - | ||
| Lumbar | LP | - | ||||
| 45LP | 1.000 (0.007) | - | ||||
| SR | 0.796 (0.051) | 1.000 (0.018) | - | |||
| UR | 1.000 (0.003) | 1.000 (0.000) | 1.000 (0.016) | - | ||
Table A4.
P-values and (χ2) for normalized absolute values of sagittal moments over all subjects—was not analysed.
Table A4.
P-values and (χ2) for normalized absolute values of sagittal moments over all subjects—was not analysed.
| P-Values and (χ2) | LP25 | LP50 | 45LP10 | 45LP25 | SR25 | SR50 | UR10 | UR25 |
|---|---|---|---|---|---|---|---|---|
| LP25 | - | |||||||
| LP50 | - | - | ||||||
| 45LP10 | - | - | - | |||||
| 45LP25 | 0.002 (0.404) | - | - | - | ||||
| SR25 | 0.056 (0.149) | - | - | 0.000 (0.532) | - | |||
| SR50 | - | 0.608 (0.010) | - | - | - | - | ||
| UR10 | - | - | 0.000 (0.817) | - | - | - | - | |
| UR25 | 0.581 (0.131) | - | - | 0.236 (0.233) | 0.000 (0.356) | - | - | - |
Table A5.
P-values and (χ2) for normalized absolute values of frontal moments over all subjects—was not analysed.
Table A5.
P-values and (χ2) for normalized absolute values of frontal moments over all subjects—was not analysed.
| P-Values and (χ2) | LP25 | LP50 | 45LP10 | 45LP25 | SR25 | SR50 | UR10 | UR25 |
|---|---|---|---|---|---|---|---|---|
| LP25 | - | |||||||
| LP50 | - | - | ||||||
| 45LP10 | - | - | - | |||||
| 45LP25 | 0.000 (0.680) | - | - | - | ||||
| SR25 | 0.000 (0.986) | - | - | 0.000 (0.967) | - | |||
| SR50 | - | 0.000 (0.982) | - | - | - | - | ||
| UR10 | - | - | 0.356 (0.031) | - | - | - | - | |
| UR25 | 0.000 (0.958) | - | - | 0.000 (0.905) | 0.000 (0.668) | - | - | - |
Table A6.
P-values and (χ2) for normalized absolute values of transversal moments over all subjects—was not analysed.
Table A6.
P-values and (χ2) for normalized absolute values of transversal moments over all subjects—was not analysed.
| P-Values and (χ2) | LP25 | LP50 | 45LP10 | 45LP25 | SR25 | SR50 | UR10 | UR25 |
|---|---|---|---|---|---|---|---|---|
| LP25 | - | |||||||
| LP50 | - | - | ||||||
| 45LP10 | - | - | - | |||||
| 45LP25 | 0.000 (0.926) | - | - | - | ||||
| SR25 | 0.000 (0.356) | - | - | 0.000 (0.925) | - | |||
| SR50 | - | 0.008 (0.225) | - | - | - | - | ||
| UR10 | - | - | 0.000 (0.957) | - | - | - | - | |
| UR25 | 0.000 (0.927) | - | - | 0.000 (0.986) | 0.001 (0.756) | - | - | - |
Table A7.
P-values and (χ2) for normalized absolute values of total moments over all subjects—was not analysed.
Table A7.
P-values and (χ2) for normalized absolute values of total moments over all subjects—was not analysed.
| P-Values and (χ2) | LP25 | LP50 | 45LP10 | 45LP25 | SR25 | SR50 | UR10 | UR25 |
|---|---|---|---|---|---|---|---|---|
| LP25 | - | |||||||
| LP50 | - | - | ||||||
| 45LP10 | - | - | - | |||||
| 45LP25 | 0.387 (0.220) | - | - | - | ||||
| SR25 | 0.000 (0.396) | - | - | 0.005 (0.220) | - | |||
| SR50 | - | 0.000 (0.680) | - | - | - | - | ||
| UR10 | - | - | 0.043 (0.139) | - | - | - | - | |
| UR25 | 0.000 (0.899) | - | - | 0.000 (0.861) | 0.000 (0.346) | - | - | - |
Table A8.
ICC(3,k) values of the maximal, minimal and range of motion ROM of the Curvature.
| ICC | LP25 | LP50 | 45LP10 | 45LP25 | SR25 | SR50 | UR10 | UR25 | |
|---|---|---|---|---|---|---|---|---|---|
| Max Curvature Angle (°) | Thoracic | 0.996 | 0.995 | 0.996 | 0.997 | 0.994 | 0.994 | 0.996 | 0.999 |
| Lumbar | 0.988 | 0.981 | 0.995 | 0.991 | 0.997 | 0.96 | 0.998 | 0.997 | |
| Min Curvature Angle (°) | Thoracic | 0.997 | 0.996 | 0.996 | 0.997 | 0.996 | 0.996 | 0.993 | 0.997 |
| Lumbar | 0.993 | 0.983 | 0.995 | 0.992 | 0.998 | 0.995 | 0.998 | 0.996 | |
| ROM Curvature Angle (°) | Thoracic | 0.979 | 0.879 | 0.971 | 0.966 | 0.923 | 0.960 | 0.938 | 0.95 |
| Lumbar | 0.906 | 0.774 | 0.979 | 0.948 | 0.966 | 0.821 | 0.988 | 0.983 | |
References
- Dagenais, S.; Caro, J.; Haldeman, S. A systematic review of low back pain cost of illness studies in the united states and internationally. Spine J. 2008, 8, 8–20. [Google Scholar] [CrossRef] [PubMed]
- Walker, B.F. The prevalence of low back pain: A systematic review of the literature from 1966 to 1998. J. Spinal Disord. 2000, 13, 205–217. [Google Scholar] [CrossRef] [PubMed]
- Crow, W.T.; Willis, D.R. Estimating cost of care for patients with acute low back pain: A retrospective review of patient records. J. Am. Osteopath. Assoc. 2009, 109, 229–233. [Google Scholar] [PubMed]
- Deyo, R.A.; Cherkin, D.; Conrad, D.; Volinn, E. Cost, controversy, crisis-low-back-pain and the health of the public. Ann. Rev. Public Health 1991, 12, 141–156. [Google Scholar] [CrossRef] [PubMed]
- Guo, H.R.; Tanaka, S.; Halperin, W.E.; Cameron, L.L. Back pain prevalence in us industry and estimates of lost workdays. Am. J. Public Health 1999, 89, 1029–1035. [Google Scholar] [CrossRef] [PubMed]
- Walker, B.F.; Muller, R.; Grant, W.D. Low back pain in australian adults: Prevalence and associated disability. J. Manip. Physiol. Ther. 2004, 27, 238–244. [Google Scholar] [CrossRef] [PubMed]
- Wieser, S.; Horisberger, B.; Schmidhauser, S.; Eisenring, C.; Brugger, U.; Ruckstuhl, A.; Dietrich, J.; Mannion, A.F.; Elfering, A.; Tamcan, O.; et al. Cost of low back pain in switzerland in 2005. Eur. J. Health Econ. 2011, 12, 455–467. [Google Scholar] [CrossRef] [PubMed]
- Carpenter, D.M.; Nelson, B.W. Low back strengthening for the prevention and treatment of low back pain. Med. Sci. Sports Exerc. 1999, 31, 18–24. [Google Scholar] [CrossRef] [PubMed]
- Pengel, L.H.M.; Herbert, R.D.; Maher, C.G.; Refshauge, K.M. Acute low back pain: Systematic review of its prognosis. BMJ 2003, 327, 323. [Google Scholar] [CrossRef] [PubMed]
- Kent, P.M.; Keating, J.L. The epidemiology of low back pain in primary care. Chiropr. Osteopat. 2005, 13, 13. [Google Scholar] [CrossRef] [PubMed] [Green Version]
- Andersson, G.B.J. Epidemiological features of chronic low-back pain. Lancet 1999, 354, 581–585. [Google Scholar] [CrossRef]
- Rosenstiel, A.K.; Keefe, F.J. The use of coping strategies in chronic low back pain patients: Relationship to patient characteristics and current adjustment. Pain 1983, 17, 33–44. [Google Scholar] [CrossRef]
- Frymoyer, J.; Cats-Baril, W. An over-view of the incidences and costs of low back pain. Orthop. Clin. N. Am. 1991, 22, 263–271. [Google Scholar]
- Hoy, D.; Brooks, P.; Blyth, F.; Buchbinder, R. The epidemiology of low back pain. Best Pract. Res. Clin. Rheumatol. 2010, 24, 769–781. [Google Scholar] [CrossRef] [PubMed]
- Leino, P.; Aro, S.; Hasan, J. Trunk muscle function and low back disorders: A ten-year follow-up study. J. Chronic Dis. 1987, 40, 289–296. [Google Scholar] [CrossRef]
- Chou, R.; Qaseem, A.; Snow, V.; Casey, D.; Cross, J.T., Jr.; Shekelle, P.; Owens, D.K.; Clinical Efficacy Assessment Subcommittee of the American College of Physicians; American College of Physicians; American Pain Society Low Back Pain Guidelines Panel. Diagnosis and treatment of low back pain: A joint clinical practice guideline from the american college of physicians and the american pain society. Ann. Intern. Med. 2007, 147, 478–491. [Google Scholar] [PubMed]
- McGill, S.M. Low back stability: From formal description to issues for performance and rehabilitation. Exerc. Sport Sci. Rev. 2001, 29, 26–31. [Google Scholar] [CrossRef] [PubMed]
- Hibbs, A.E.; Thompson, K.G.; French, D.; Wrigley, A.; Spears, I. Optimizing performance by improving core stability and core strength. Sports Med. 2008, 38, 995–1008. [Google Scholar] [CrossRef] [PubMed]
- Okada, T.; Huxel, K.C.; Nesser, T.W. Relationship between core stability, functional movement, and performance. J. Strength Cond. Res. 2011, 25, 252–261. [Google Scholar] [CrossRef] [PubMed]
- Shinkle, J.; Nesser, T.W.; Demchak, T.J.; McMannus, D.M. Effect of core strength on the measure of power in the extremities. J. Strength Cond. Res. 2012, 26, 373–380. [Google Scholar] [CrossRef] [PubMed]
- Stone, M.H.; Fry, A.C.; Ritchie, M.; Stoessel-Ross, L.; Marsit, J.L. Injury potential and safety aspects of weightlifting movements. Strength Cond. J. 1994, 16, 15–21. [Google Scholar] [CrossRef]
- Müller, R. Fitness-Center: Verletzungen und Beschwerden Beim Training; Beratungsstelle für Unfallverhütung: Bern, Switzerland, 1999. [Google Scholar]
- Schellenberg, F.; Lindorfer, J.; List, R.; Taylor, W.; Lorenzetti, S. Kinetic and kinematic differences between deadlifts and goodmornings. BMC Sports Sci. Med. Rehabil. 2013, 5, 27. [Google Scholar] [CrossRef] [PubMed]
- Schellenberg, F.; Schmid, N.; Häberle, R.; Hörterer, N.; Taylor, W.R.; Lorenzetti, S. Loading conditions in the spine, hip and knee during different executions of back extension exercises. BMC Sports Sci. Med. Rehabil. 2017, 9, 10. [Google Scholar] [CrossRef] [PubMed]
- Doma, K.; Deakin, G.B.; Ness, K.F. Kinematic and electromyographic comparisons between chin-ups and lat-pull down exercises. Sports Biomech. 2013, 12, 302–313. [Google Scholar] [CrossRef] [PubMed]
- Lehman, G.J.; Buchan, D.D.; Lundy, A.; Myers, N.; Nalborczyk, A. Variations in muscle activation levels during traditional latissimus dorsi weight training exercises: An experimental study. Dyn. Med. 2004, 3, 4. [Google Scholar] [CrossRef] [PubMed]
- McAllister, M.J.; Schilling, B.K.; Hammond, K.G.; Weiss, L.W.; Farney, T.M. Effect of grip width on electromyographic activity during the upright row. J. Strength Cond. Res. 2013, 27, 181–187. [Google Scholar] [CrossRef] [PubMed]
- Signorile, J.E.; Zink, A.J.; Szwed, S.P. A comparative electromyographical investigation of muscle utilization patterns using various hand positions during the lat pull-down. J. Strength Cond. Res. 2002, 16, 539–546. [Google Scholar] [PubMed]
- Handa, T.; Kato, H.; Hasegawa, S.; Okada, J.; Kato, K. Comparative electromyographical investigation of the biceps brachii, latissimus dorsi, and trapezius muscles during five pull exercises. Jpn. J. Phys. Fit. Sports Med. 2005, 54, 159–168. [Google Scholar] [CrossRef]
- Cronin, J.B.; Jones, J.V.; Hagstrom, J.T. Kinematics and kinetics of the seated row and implications for conditioning. J. Strength Cond. Res. 2007, 21, 1265–1270. [Google Scholar] [PubMed]
- List, R.; Gülay, T.; Stoop, M.; Lorenzetti, S. Kinematics of the trunk and the lower extremities during restricted and unrestricted squats. J. Strength Cond. Res. 2013, 27, 1529–1538. [Google Scholar] [CrossRef] [PubMed]
- Lorenzetti, S.; Gülay, T.; Stoop, M.; List, R.; Gerber, H.; Schellenberg, F.; Stüssi, E. Comparison of the angles and corresponding moments in the knee and hip during restricted and unrestricted squats. J. Strength Cond. Res. 2012, 26, 2829–2836. [Google Scholar] [CrossRef] [PubMed]
- Schütz, P.; List, R.; Zemp, R.; Schellenberg, F.; Taylor, W.R.; Lorenzetti, S. Joint angles of the ankle, knee, and hip and loading conditions during split squats. J. Appl. Biomech. 2014, 30, 373–380. [Google Scholar] [CrossRef] [PubMed]
- Rab, G.; Petuskey, K.; Bagley, A. A method for determination of upper extremity kinematics. Gait Posture 2002, 15, 113–119. [Google Scholar] [CrossRef]
- Schmid, S.; Studer, D.; Hasler, C.C.; Romkes, J.; Taylor, W.R.; Brunner, R.; Lorenzetti, S. Using skin markers for spinal curvature quantification in main thoracic adolescent idiopathic scoliosis: An explorative radiographic study. PLoS ONE 2015, 10, e0135689. [Google Scholar] [CrossRef] [PubMed]
- Zemp, R.; List, R.; Gulay, T.; Elsig, J.P.; Naxera, J.; Taylor, W.R.; Lorenzetti, S. Soft tissue artefacts of the human back: Comparison of the sagittal curvature of the spine measured using skin markers and an open upright mri. PLoS ONE 2014, 9, e95426. [Google Scholar] [CrossRef] [PubMed]
- Baaklini, E.; Angst, M.; Schellenberg, F.; Hitz, M.; Schmid, S.; Tal, A.; Taylor, W.R.; Lorenzetti, S. High-heeled walking decreases lumbar lordosis. Gait Posture 2017, 55, 12–14. [Google Scholar] [CrossRef] [PubMed]
- Kao, L.S.; Green, C.E. Analyis of Variance: Is there a difference in means and what does it mean. J. Surg. Res. 2008, 144, 158–170. [Google Scholar] [CrossRef] [PubMed]
- Koo, T.K.; Li, M.Y. A guideline of selecting and reporting intraclass correlation coefficients for reliability research. J. Chirop. Med. 2016, 15, 155–163. [Google Scholar] [CrossRef] [PubMed]
- Norman, R.; Wells, R.; Neumann, P.; Frank, J.; Shannon, H.; Kerr, M. A comparison of peak vs cumulative physical work exposure risk factors for the reporting of low back pain in the automotive industry. Clin. Biomech. 1998, 13, 561–573. [Google Scholar] [CrossRef]
- Potvin, J.R.; Norman, R.W.; McGill, S.M. Reduction in anterior shear forces on the l 4l 5 disc by the lumbar musculature. Clin. Biomech. 1991, 6, 88–96. [Google Scholar] [CrossRef]
- Bloomquist, K.; Langberg, H.; Karlsen, S.; Madsgaard, S.; Boesen, M.; Raastad, T. Effect of range of motion in heavy load squatting on muscle and tendon adaptations. Eur. J. Appl. Physiol. 2013, 113, 2133–2142. [Google Scholar] [CrossRef] [PubMed]
- McMahon, G.E.; Morse, C.I.; Burden, A.; Winwood, K.; Onambélé, G.L. Impact of range of motion during ecologically valid resistance training protocols on muscle size, subcutaneous fat, and strength. J. Strength Cond. Res. 2014, 28, 245–255. [Google Scholar] [CrossRef] [PubMed]
- Pinto, R.S.; Gomes, N.; Radaelli, R.; Botton, C.E.; Brown, L.E.; Bottaro, M. Effect of range of motion on muscle strength and thickness. J. Strength Cond. Res. 2012, 26, 2140–2145. [Google Scholar] [CrossRef] [PubMed]
Figure 1.
Mean curvature angle in the thoracic (left) and lumbar (right) region over one cycle averaged for all subjects.
Figure 1.
Mean curvature angle in the thoracic (left) and lumbar (right) region over one cycle averaged for all subjects.
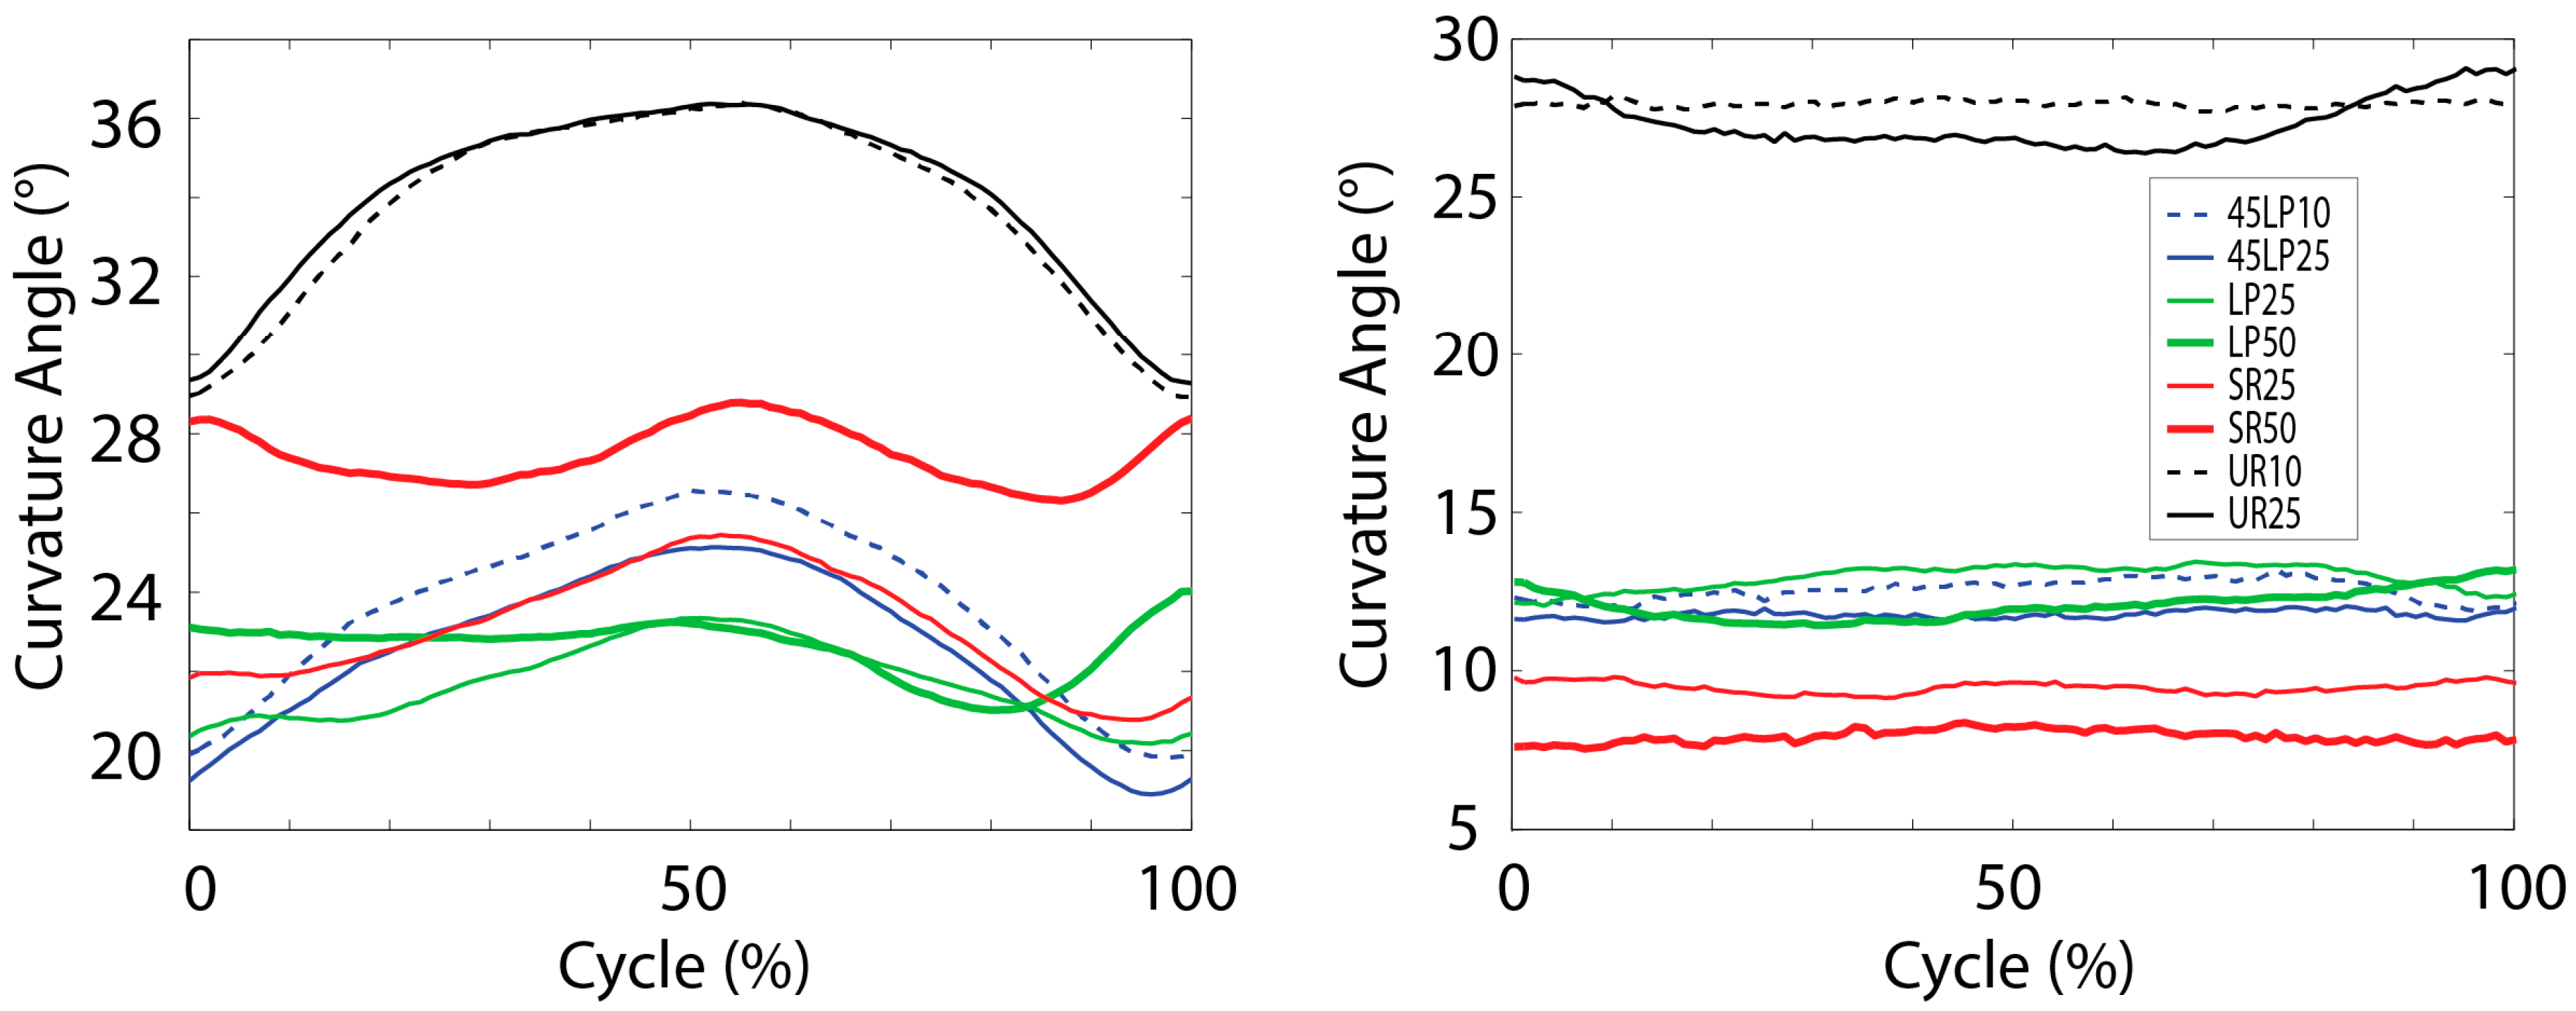
Figure 2.
Normalized moments versus angles in the sagittal plane (flexion (+) and extension (−)) in the shoulder joint, averaged over all subjects.
Figure 2.
Normalized moments versus angles in the sagittal plane (flexion (+) and extension (−)) in the shoulder joint, averaged over all subjects.
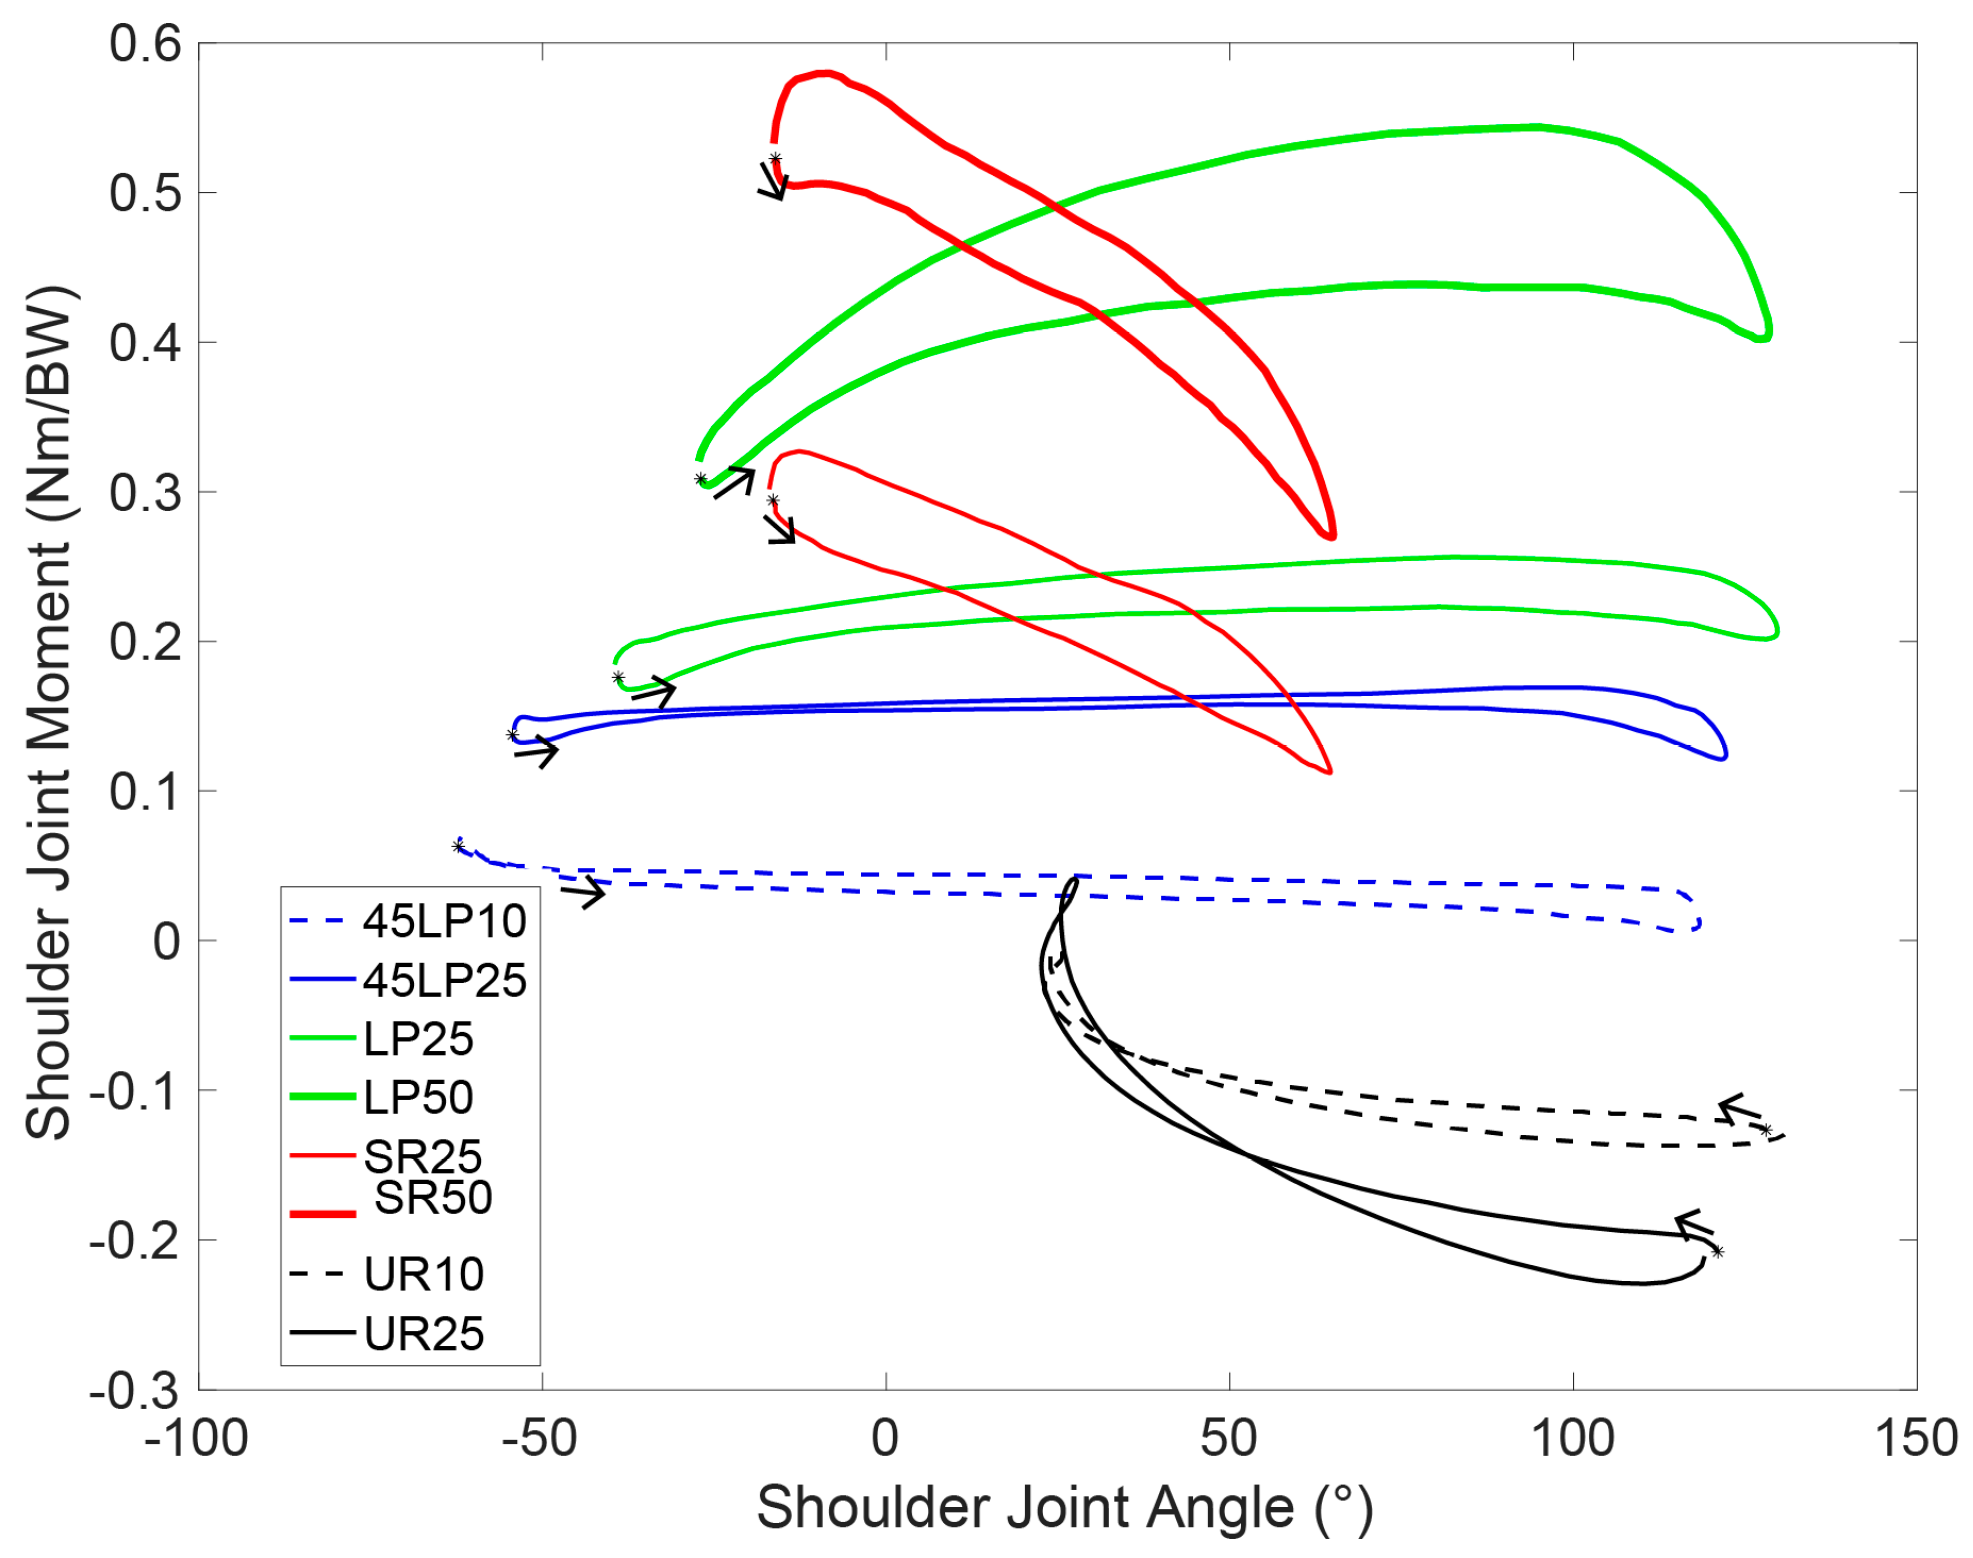
Figure 3.
Normalized moments versus angles in the frontal plane (adduction (+) and abduction (−)) in the shoulder joint, averaged over all subjects.
Figure 3.
Normalized moments versus angles in the frontal plane (adduction (+) and abduction (−)) in the shoulder joint, averaged over all subjects.
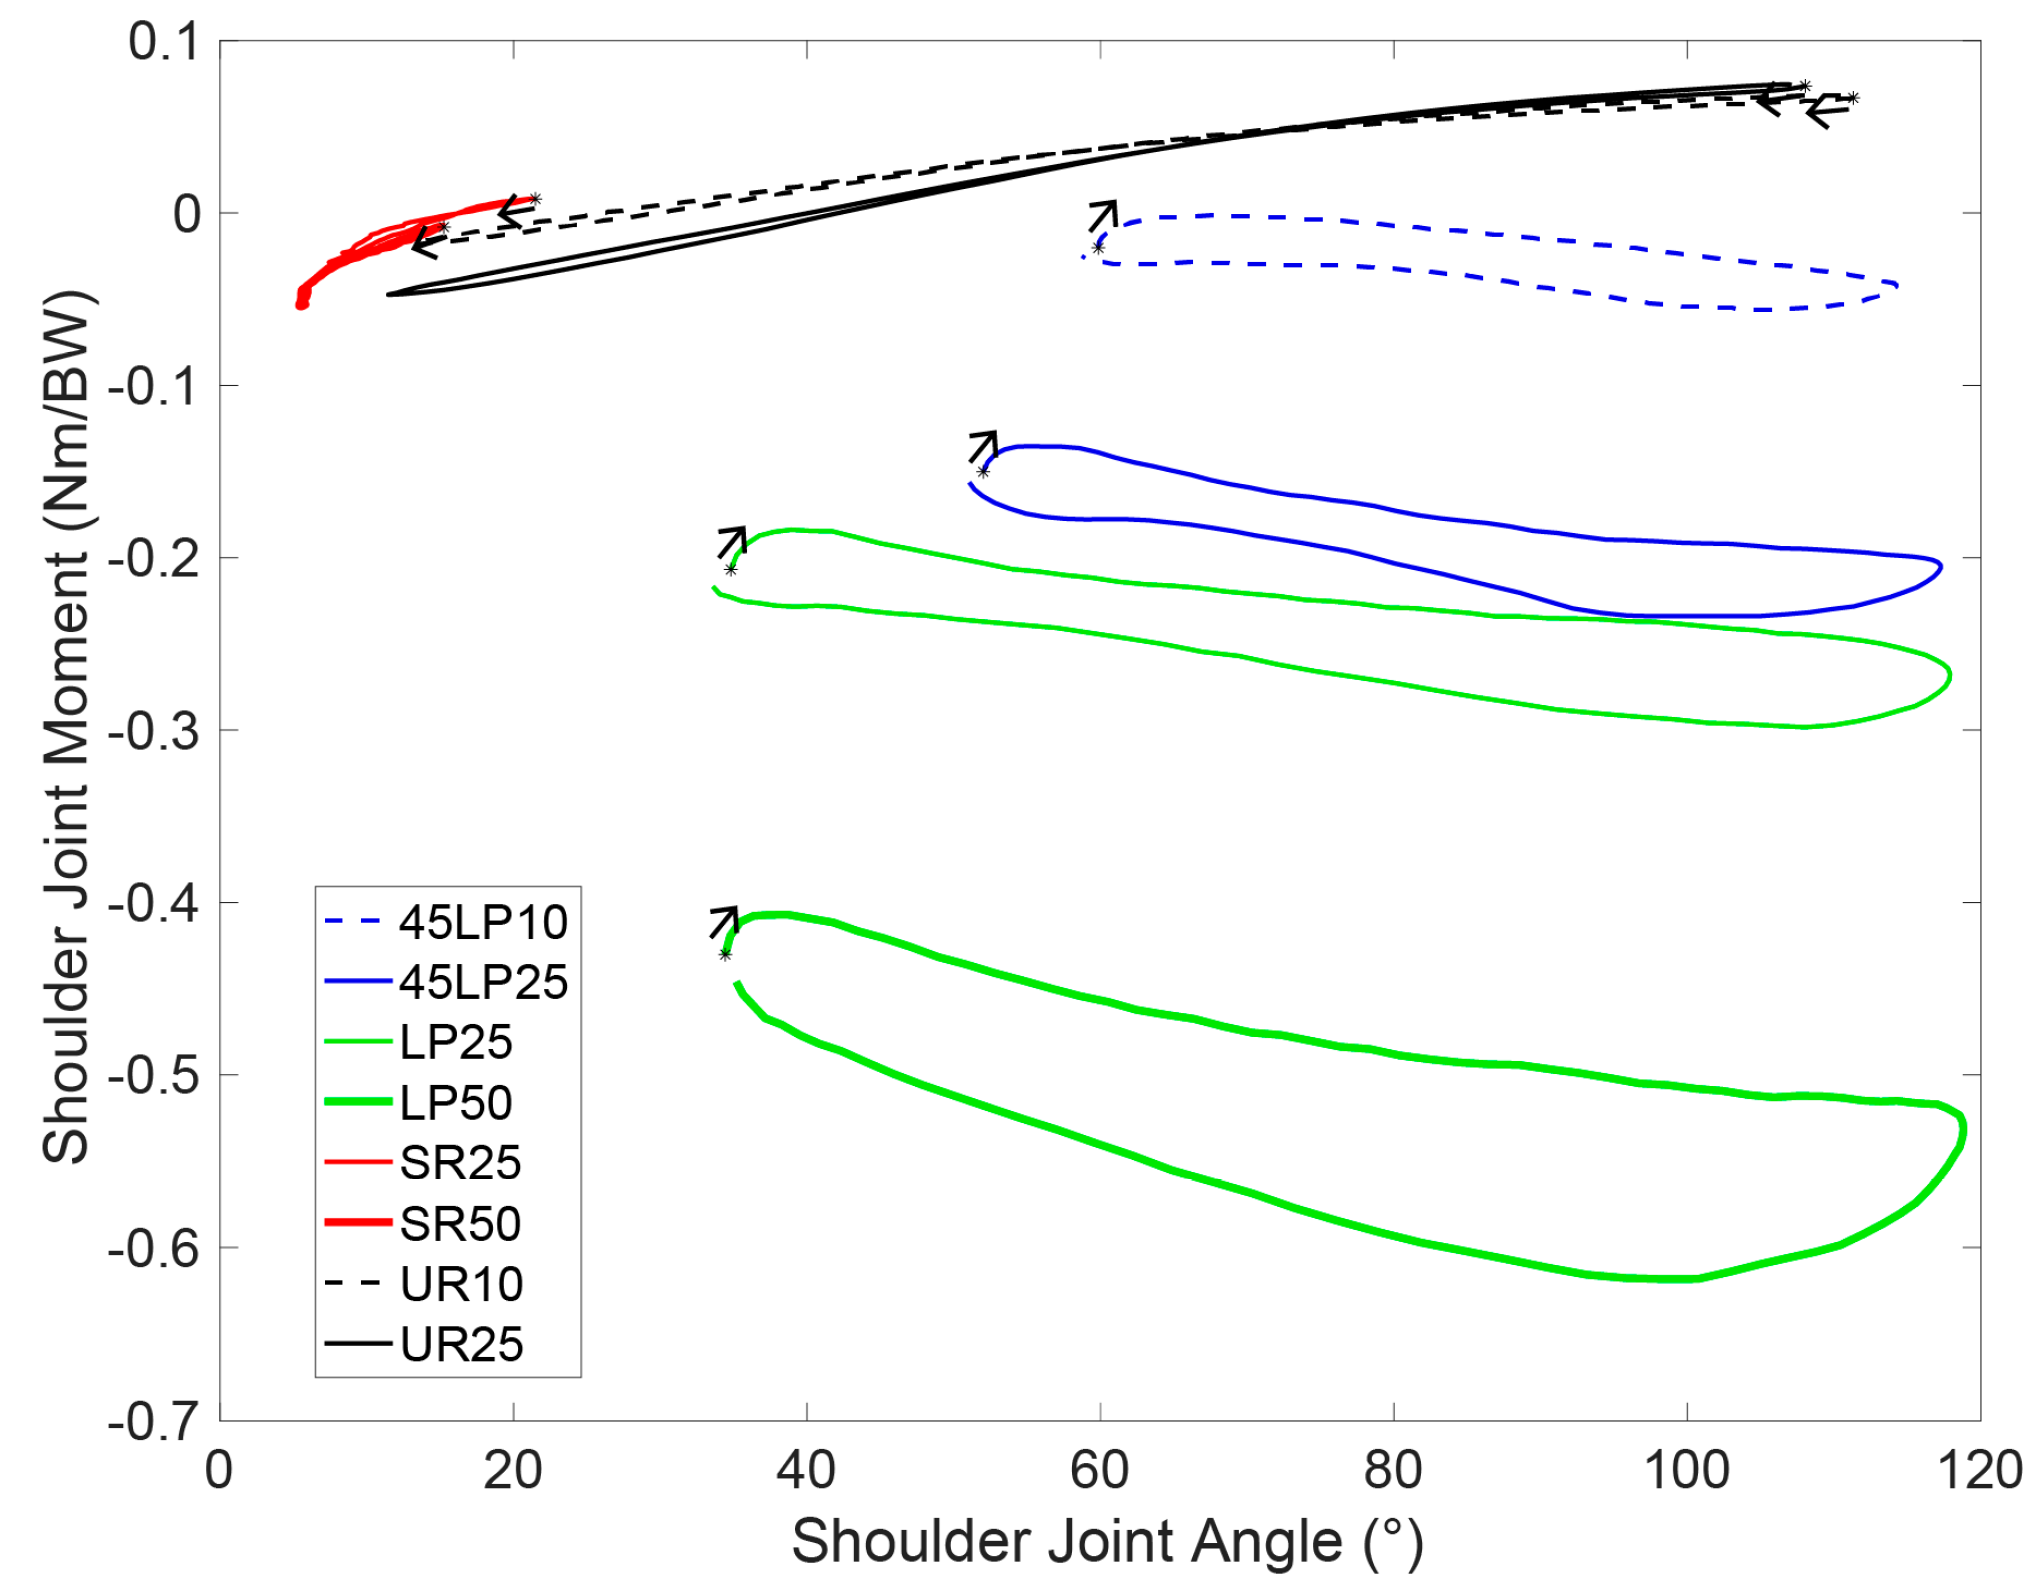
Figure 4.
Normalized moments versus angles in the transverse plane (internal (+) and external (−) in the shoulder joint, averaged over all subjects.
Figure 4.
Normalized moments versus angles in the transverse plane (internal (+) and external (−) in the shoulder joint, averaged over all subjects.
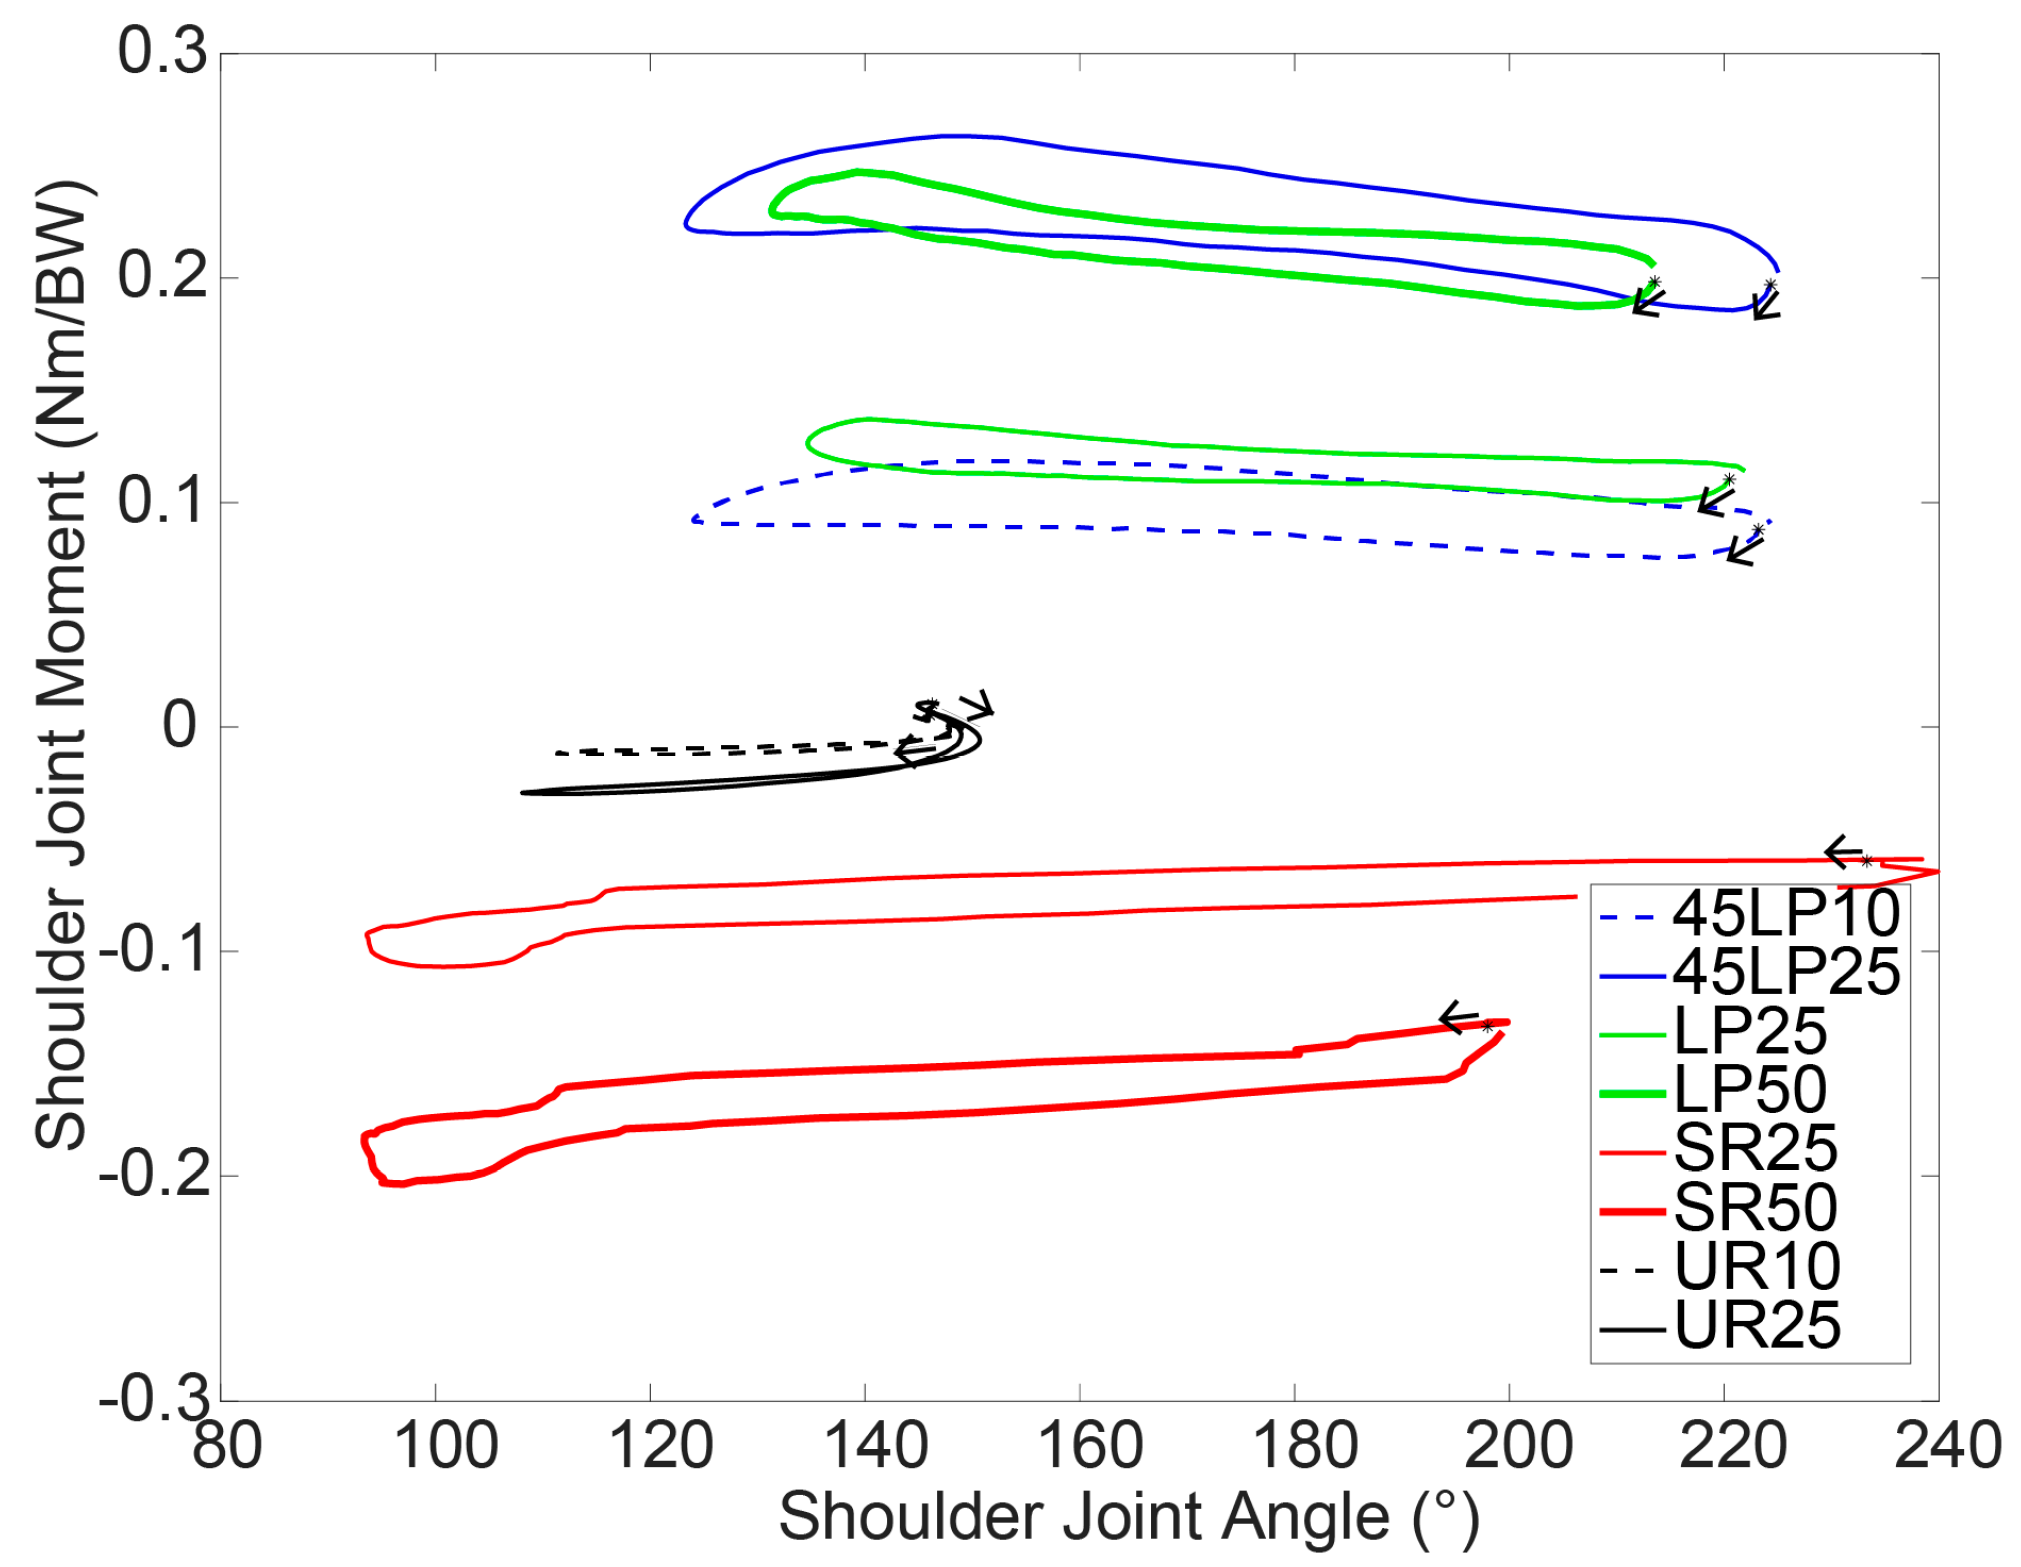
Table 1.
Maximum, minimum and ROM of the curvature angles in the thoracic and lumbar regions, mean and standard deviation over all subjects.
Table 1.
Maximum, minimum and ROM of the curvature angles in the thoracic and lumbar regions, mean and standard deviation over all subjects.
| Curvature Angle | Lat Pulldown | 45° Lat Pulldown | Seated Cable Row | Upright Row | |||||
|---|---|---|---|---|---|---|---|---|---|
| 25% BW | 50% BW | 10% BW | 25% BW | 25% BW | 50% BW | 10% BW | 25% BW | ||
| Max Curvature Angle, (°) | Thoracic | 24.8 ± 9.1 | 27.6 ± 10.7 | 27.5 ± 9.4 | 26.0 ± 9.4 | 26.4 ± 10.6 | 31.5 ± 7.9 | 37.1 *,+,† ± 8.4 | 37.1 *,+,† ± 9.4 |
| Lumbar | 16.1 ± 7.9 | 15.9 ± 6.8 | 15.8 ± 9.7 | 15.0 ± 8.4 | 12.0 ± 7.2 | 11.6 ± 6.5 | 30.7 *,+,† ± 7.6 | 31.1 *,+,† ± 8.0 | |
| Min Curvature Angle, (°) | Thoracic | 18.1 ± 10.0 | 18.3 ± 10.4 | 18.2 ± 10.4 | 17.6 ± 11.0 | 19.4 ± 11.1 | 23.8 ± 9.1 | 27.9 *,+,† ± 8.9 | 28.4 *,+,† ± 9.7 |
| Lumbar | 9.7 ± 7.3 | 8.9 ± 7.2 | 9.4 ± 8.6 | 8.7 ± 7.3 | 7.2 ± 7.4 | 5.3 ± 6.6 | 25.1 *,+,† ± 6.7 | 23.9 *,+,† ± 6.6 | |
| ROM Curvature Angle, (°) | Thoracic | 6.7 ± 3.0 | 9.3 ± 2.2 | 9.3 ± 3.9 | 8.5 ± 3.8 | 7.1 ± 2.8 | 7.7 ± 2.6 | 9.2 ± 2.7 | 8.8 ± 2.7 |
| Lumbar | 6.4 ± 2.2 | 7.0 ± 2.0 | 6.3 ± 2.6 | 6.3 ± 2.5 | 4.8 ± 2.1 | 6.4 ± 2.8 | 5.6 ± 3.0 | 7.2 ± 3.9 | |
*: significantly different from LP; †: significantly different from SR; +: significantly different from LP45.
Table 2.
The means and standard deviation over all subjects of the normalized maximum moments in the shoulder joint in the three anatomical planes.
Table 2.
The means and standard deviation over all subjects of the normalized maximum moments in the shoulder joint in the three anatomical planes.
| Shoulder Joint Moment | Lat Pulldown | 45° Lat Pulldown | Seated Cable Row | Upright Row | |||||
|---|---|---|---|---|---|---|---|---|---|
| 25% BW | 50% BW | 10% BW | 25% BW | 25% BW | 50% BW | 10% BW | 25% BW | ||
| Mmax Shoulder Joint [Nm/BW] | Sagittal | 0.28 +,¶ ± 0.06 | 0.58 ± 0.11 | 0.07 ¶ ± 0.02 | 0.19 *,†,¶ ± 0.05 | 0.34 +,¶ ± 0.09 | 0.60 ± 0.11 | −0.15 + ± 0.02 | −0.24 *,+,† ± 0.04 |
| Frontal | −0.32 +,†,¶ ± 0.02 | −0.64 † ± 0.05 | −0.07 ¶ ± 0.02 | −0.25 *†,¶ ± 0.03 | −0.03 *,+,¶ ± 0.01 | −0.06 * ± 0.02 | 0.07 + ± 0.02 | 0.09 *,+,† ± 0.03 | |
| Transverse | 0.15 +,†,¶ ± 0.02 | 0.26 † ± 0.03 | 0.13 ¶ ± 0.02 | 0.27 *,†,¶ ± 0.02 | −0.11 *,+,¶ ± 0.03 | −0.22 * ± 0.05 | −0.02 + ± 0.01 | −0.04 *,+,† ± 0.01 | |
| Absolute | 0.45 †,¶ ± 0.04 | 0.89 † ± 0.08 | 0.15 ¶ ± 0.02 | 0.41 †,¶ ± 0.03 | 0.34 *,+,¶ ± 0.09 | 0.62 * ± 0.11 | 0.16 + ± 0.01 | 0.25 *,+,† ± 0.03 | |
*: significantly different from LP; †: significantly different from SR; +: significantly different from 45LP; ¶: significantly different from UR.
© 2017 by the authors. Licensee MDPI, Basel, Switzerland. This article is an open access article distributed under the terms and conditions of the Creative Commons Attribution (CC BY) license (http://creativecommons.org/licenses/by/4.0/).
Share and Cite
MDPI and ACS Style
Lorenzetti, S.; Dayer, R.; Plüss, M.; List, R. Pulling Exercises for Strength Training and Rehabilitation: Movements and Loading Conditions. J. Funct. Morphol. Kinesiol. 2017, 2, 33. https://doi.org/10.3390/jfmk2030033
AMA Style
Lorenzetti S, Dayer R, Plüss M, List R. Pulling Exercises for Strength Training and Rehabilitation: Movements and Loading Conditions. Journal of Functional Morphology and Kinesiology. 2017; 2(3):33. https://doi.org/10.3390/jfmk2030033
Chicago/Turabian StyleLorenzetti, Silvio, Romain Dayer, Michael Plüss, and Renate List. 2017. "Pulling Exercises for Strength Training and Rehabilitation: Movements and Loading Conditions" Journal of Functional Morphology and Kinesiology 2, no. 3: 33. https://doi.org/10.3390/jfmk2030033