The Importance of Lean Body Mass for the Rate of Force Development in Taekwondo Athletes and Track and Field Throwers


 and
and 
Abstract
:1. Introduction
2. Materials and Methods
2.1. Experimental Design
2.2. Participants
2.3. Training Background
2.4. Testing Procedures
2.4.1. Countermovement Jumps
2.4.2. Leg Press Rate of Force Development
2.4.3. Leg Extension Rate of Force Development
2.4.4. Muscle Architecture
2.4.5. Body Composition Analysis
2.5. Statistics Procedures
3. Results
4. Discussion
5. Conclusions
Author Contributions
Funding
Acknowledgments
Conflicts of Interest
References
- Aagaard, P.; Simonsen, E.B.; Andersen, J.L.; Magnusson, P.; Dyhre-Poulsen, P. Increased rate of force development and neural drive of human skeletal muscle following resistance training. J. Appl. Physiol. 2002, 93, 1318–1326. [Google Scholar] [CrossRef] [PubMed] [Green Version]
- Maffiuletti, N.A.; Aagaard, P.; Blazevich, A.J.; Folland, J.; Tillin, N.; Duchateau, J. Rate of force development: Physiological and methodological considerations. Eur. J. Appl. Physiol. 2016, 116, 1091–1116. [Google Scholar] [CrossRef] [PubMed]
- Zatsiorsky, V.M.; Lanka, G.E.; Shalmanov, A.A. Biomechanical analysis of shot putting technique. Exerc. Sport Sci. Rev. 1981, 9, 353–389. [Google Scholar] [CrossRef] [PubMed]
- Estevan, I.; Alvarez, O.; Falco, C.; Molina-García, J.; Castillo, I. Impact force and time analysis influenced by execution distance in a roundhouse kick to the head in taekwondo. J. Strength Cond. Res. 2011, 25, 2851–2856. [Google Scholar] [CrossRef] [PubMed]
- Falco, C.; Alvarez, O.; Castillo, I.; Estevan, I.; Martos, J.; Mugarra, F.; Iradi, A. Influence of the distance in a roundhouse kick’s execution time and impact force in taekwondo. J. Biomech. 2009, 42, 242–248. [Google Scholar] [CrossRef] [PubMed]
- Kim, K.Y.; Kim, Y.H.; Im, S.J. Inter-joint coordination in producing kicking velocity of taekwondo kicks. J. Sports Sci. Med. 2011, 10, 31. [Google Scholar] [PubMed]
- Methenitis, S.; Karandreas, N.; Spengos, K.; Zaras, N.; Stasinaki, A.-N.; Terzis, G. Muscle fiber conduction velocity, muscle fiber composition, and power performance. Med. Sci. Sports Exerc. 2016, 48, 1761–1771. [Google Scholar] [CrossRef] [PubMed]
- Methenitis, S.; Spengos, K.; Zaras, N.; Stasinaki, A.-N.; Papadimas, G.; Karampatsos, G.; Arnaoutis, G.; Terzis, G. Fiber type composition and rate of force development in endurance and resistance trained individuals. J. Strength Cond. Res. 2017. [Google Scholar] [CrossRef] [PubMed]
- Harridge, S.D. The muscle contractile system and its adaptation to training. Med. Sport Sci. 1996, 41, 82–94. [Google Scholar]
- Hakkinen, K.; Aien, M.; Komi, P.V. Changes in isometric force- and relaxation-time, electromyographic and muscle fibre characteristics of human skeletal muscle during strength training and detraining. Acta Physiol. Scand. 1985, 125, 573–585. [Google Scholar] [CrossRef] [PubMed]
- Hakkinen, K.; Komi, P.V.; Aien, M. Effect of explosive type strength training on isometric force- and relaxation-time, electromyographic and muscle fibre characteristics of leg extensor muscles. Acta Physiol. Scand. 1985, 125, 587–600. [Google Scholar] [CrossRef] [PubMed]
- Noorkoiv, M.; Stavnsbo, A.; Aagaard, P.; Blazevich, A. In vivo assessment of muscle fascicle length by extended field-of-view ultrasonography. J. Appl. Physiol. 2010, 109, 1974–1979. [Google Scholar] [CrossRef] [PubMed] [Green Version]
- Zaras, N.; Stasinaki, A.; Krase, A.; Methenitis, S.; Karampatsos, G.; Georgiadis, G.; Spengos, K.; Terzis, G. Effects of tapering with light vs. Heavy loads on track and field throwing performance. J. Strength Cond. Res. 2014, 28, 3484–3495. [Google Scholar] [CrossRef] [PubMed]
- Zaras, N.; Stasinaki, A.-N.; Methenitis, S.; Krase, A.; Karampatsos, G.; Georgiadis, G.; Spengos, K.; Terzis, G. Rate of force development, muscle architecture, and performance in young competitive track and field throwers. J. Strength Cond. Res. 2016, 30, 81–92. [Google Scholar] [CrossRef] [PubMed]
- Bridge, C.; da Silva Santos, J.; Chaabene, H.; Pieter, W.; Franchini, E. Physical and physiological profiles of taekwondo athletes. Sports Med. 2014, 44, 713–733. [Google Scholar] [CrossRef] [PubMed]
- Blazevich, A.J.; Cannavan, D.; Horne, S.; Coleman, D.; Aagaard, P. Changes in muscle force–length properties affect the early rise of force in vivo. Muscle Nerve 2009, 39, 512–520. [Google Scholar] [CrossRef] [PubMed]
- Gerstner, G.; Thompson, B.; Rosenberg, J.; Sobolewski, E.; Scharville, M.; Ryan, E. Neural and muscular contributions to the age-related reductions in rapid strength. Med. Sci. Sports Exerc. 2017, 49, 1331–1339. [Google Scholar] [CrossRef] [PubMed]
- Wagle, J.; Carroll, K.; Cunanan, A.; Taber, C.; Wetmore, A.; Bingham, G.; DeWeese, B.; Sato, K.; Stuart, C.; Stone, M. Comparison of the relationship between lying and standing ultrasonography measures of muscle morphology with isometric and dynamic force production capabilities. Sports 2017, 5, 88. [Google Scholar] [CrossRef] [PubMed]
- Goldspink, G. Malleability of the motor system: A comparative approach. J. Exp. Biol. 1985, 115, 375–391. [Google Scholar] [PubMed]
- Abe, T.; Fukashiro, S.; Harada, Y.; Kawamoto, K. Relationship between sprint performance and muscle fascicle length in female sprinters. J. Physiol. Anthropol. Appl. Hum. Sci. 2001, 20, 141–147. [Google Scholar] [CrossRef]
- Kumagai, K.; Abe, T.; Brechue, W.F.; Ryushi, T.; Takano, S.; Mizuno, M. Sprint performance is related to muscle fascicle length in male 100-m sprinters. J. Appl. Physiol. 2000, 88, 811–816. [Google Scholar] [CrossRef] [PubMed]
- Lee, S.; Piazza, S. Built for speed: Musculoskeletal structure and sprinting ability. J. Exp. Biol. 2009, 212, 3700–3707. [Google Scholar] [CrossRef] [PubMed]
- Duclay, J.; Martin, A.; Duclay, A.; Cometti, G.; Pousson, M. Behavior of fascicles and the myotendinous junction of human medial gastrocnemius following eccentric strength training. Muscle Nerve 2009, 39, 819–827. [Google Scholar] [CrossRef] [PubMed]
- Potier, T.; Alexander, C.; Seynnes, O. Effects of eccentric strength training on biceps femoris muscle architecture and knee joint range of movement. Eur. J. Appl. Physiol. 2009, 105, 939–944. [Google Scholar] [CrossRef] [PubMed]
- Reeves, N.; Maganaris, C.; Longo, S.; Narici, M. Differential adaptations to eccentric versus conventional resistance training in older humans. Exp. Physiol. 2009, 94, 825–833. [Google Scholar] [CrossRef] [PubMed] [Green Version]
- Stasinaki, A.-N.; Gloumis, G.; Spengos, K.; Blazevich, A.J.; Zaras, N.; Georgiadis, G.; Karampatsos, G.; Terzis, G. Muscle strength, power, and morphologic adaptations after 6 weeks of compound vs. Complex training in healthy men. J. Strength Cond. Res. 2015, 29, 2559–2569. [Google Scholar] [CrossRef] [PubMed]
- Stasinaki, A.-N.; Zaras, N.; Methenitis, S.; Tsitkanou, S.; Krase, A.; Kavvoura, A.; Terzis, G. Triceps brachii muscle strength and architectural adaptations with resistance training exercises at short or long fascicle length. J. Funct. Morphol. Kinesiol. 2018, 3, 28. [Google Scholar] [CrossRef]
- Methenitis, S.; Zaras, N.; Spengos, K.; Stasinaki, A.-N.; Karampatsos, G.; Georgiadis, G.; Terzis, G. Role of muscle morphology in jumping, sprinting, and throwing performance in participants with different power training duration experience. J. Strength Cond. Res. 2016, 30, 807–817. [Google Scholar] [CrossRef] [PubMed]
- Linthorne, N.P. Analysis of standing vertical jumps using a force platform. Am. J. Phys. 2001, 69, 1198–1204. [Google Scholar] [CrossRef] [Green Version]
- Methenitis, S.; Terzis, G.; Zaras, N.; Stasinaki, A.; Karandreas, N. Intramuscular fiber conduction velocity, isometric force and explosive performance. J. Hum. Kinet. 2016, 51, 93–101. [Google Scholar] [CrossRef] [PubMed] [Green Version]
- Marcora, S.; Miller, M.K. The effect of knee angle on the external validity of isometric measures of lower body neuromuscular function. J. Sports Sci. 2000, 18, 313–319. [Google Scholar] [CrossRef] [PubMed]
- Andersen, L.L.; Andersen, J.L.; Zebis, M.K.; Aagaard, P. Early and late rate of force development: Differential adaptive responses to resistance training? Scand. J. Med. Sci. Sports 2010, 20, e162–e169. [Google Scholar] [CrossRef] [PubMed]
- Oliveira, F.B.D.; Rizatto, G.F.; Denadai, B.S. Are early and late rate of force development differently influenced by fast-velocity resistance training? Clin. Physiol. Funct. Imaging 2013, 33, 282–287. [Google Scholar] [CrossRef] [PubMed]
- Elias, L.J.; Bryden, M.P.; Bulman-Fleming, M.B. Footedness is a better predictor than is handedness of emotional lateralization. Neuropsychologia 1998, 36, 37–43. [Google Scholar] [CrossRef]
- Tsitkanou, S.; Spengos, K.; Stasinaki, A.N.; Zaras, N.; Bogdanis, G.; Papadimas, G.; Terzis, G. Effects of high-intensity interval cycling performed after resistance training on muscle strength and hypertrophy. Scand. J. Med. Sci. Sports 2017, 27, 1317–1327. [Google Scholar] [CrossRef] [PubMed]
- Kawakami, Y.; Ichinose, Y.; Fukunaga, T. Architectural and functional features of human triceps surae muscles during contraction. J. Appl. Physiol. 1998, 85, 398–404. [Google Scholar] [CrossRef] [PubMed]
- Tabachnick, B.; Fidell, L. Using Multivariate Statistics; Allyn & Bacon/Pearson Education: Boston, MA, USA, 2007. [Google Scholar]
- Hopkins, W.G. Measures of reliability in sports medicine and science. Sports Med. 2000, 30, 1–15. [Google Scholar] [CrossRef] [PubMed]
- Bartlett, R. The biomechanics of the discus throw: A review. J. Sports Sci. 1992, 10, 467–510. [Google Scholar] [CrossRef] [PubMed]
- Bartlett, R.; Best, R. The biomechanics of javelin throwing: A review. J. Sports Sci. 1988, 6, 1–38. [Google Scholar] [CrossRef] [PubMed]
- Gutierrez, M.; Soto, V.M.; Rojas, F.J. A biomechanical analysis of the individual techniques of the hammer throw finalists in the seville athletics world championship, 1999. New Stud. Athlet. 2002, 17, 15–28. [Google Scholar]
- Earp, J.; Kraemer, W.; Newton, R.; Comstock, B.; Fragala, M.; Dunn-Lewis, C.; Solomon-Hill, G.; Penwell, Z.; Powell, M.; Volek, J. Lower-body muscle structure and its role in jump performance during squat, countermovement, and depth drop jumps. J. Strength Cond. Res. 2010, 24, 722–729. [Google Scholar] [CrossRef] [PubMed]
- Nimphius, S.; McGuigan, M.; Newton, R. Changes in muscle architecture and performance during a competitive season in female softball players. J. Strength Cond. Res. 2012, 26, 2655–2666. [Google Scholar] [CrossRef] [PubMed]
- Karamanidis, K.; Albracht, K.; Braunstein, B.; Moreno Catala, M.; Goldmann, J.P.; Bruggemann, G.P. Lower leg musculoskeletal geometry and sprint performance. Gait Posture 2011, 34, 138–141. [Google Scholar] [CrossRef] [PubMed]
- Storey, A.; Wong, S.; Smith, H.; Marshall, P. Divergent muscle functional and architectural responses to two successive high intensity resistance exercise sessions in competitive weightlifters and resistance trained adults. Eur. J. Appl. Physiol. 2012, 112, 3629–3639. [Google Scholar] [CrossRef] [PubMed]
- Earp, J.E.; Kraemer, W.; Cormie, P.; Volek, J.; Maresh, C.; Joseph, M.; Newton, R. Influence of muscle–tendon unit structure on rate of force development during the squat, countermovement, and drop jumps. J. Strength Cond. Res. 2011, 25, 340–347. [Google Scholar] [CrossRef] [PubMed]
- Costill, D.L.; Daniels, J.; Evans, W.; Fink, W.; Krahenbuhl, G.; Saltin, B. Skeletal muscle enzymes and fiber composition in male and female track athletes. J. Appl. Physiol. 1976, 40, 149–154. [Google Scholar] [CrossRef] [PubMed]
- Terzis, G.; Spengos, K.; Kavouras, S.; Manta, P.; Georgiadis, G. Muscle fibre type composition and body composition in hammer throwers. J. Sports Sci. Med. 2010, 9, 104–109. [Google Scholar] [PubMed]


| Evaluation | Parameter | Taekwondo | Throwers | p | η2 |
|---|---|---|---|---|---|
| Body composition | Body height (cm) | 174.3 ± 4.9 | 183.3 ± 4.9 | 0.002 | 0.486 |
| Body mass (kg) | 66.3 ± 7.8 | 99.3 ± 9.9 | 0.000 | 0.791 | |
| LBM total (kg) | 55.2 ± 4.9 | 75.9 ± 3.4 | 0.000 | 0.877 | |
| LBM arms (kg) | 7.8 ± 1.1 | 9.6 ± 0.8 | 0.002 | 0.509 | |
| LBM trunk (kg) | 25.0 ± 2.0 | 35.6 ± 2.0 | 0.000 | 0.886 | |
| LBM legs (kg) | 18.7 ± 2.8 | 27.0 ± 1.8 | 0.000 | 0.789 | |
| BMD total (g·cm2) | 1.3 ± 0.09 | 1.5 ± 0.08 | 0.002 | 0.473 | |
| Body fat (%) | 10.9 ± 7.1 | 17.3 ± 5.0 | 0.053 | 0.241 | |
| CMJ | Jump height (cm) | 39.9 ± 5.9 | 45.8 ± 5.5 | 0.037 | 0.254 |
| Max power (W) | 918.4 ± 149.1 | 1578.6 ± 280.2 | 0.000 | 0.702 | |
| Max power/LBM (W/kg) | 16.7 ± 2.5 | 20.8 ± 3.5 | 0.015 | 0.335 | |
| Max velocity (m·s−1) | 3.3 ± 0.5 | 3.8 ± 0.5 | 0.037 | 0.258 | |
| ARFD (N·s−1) | 546.1 ± 168.9 | 649.6 ± 218.2 | 0.296 | 0.072 | |
| VL architecture | Thickness (cm) | 2.4 ± 0.2 | 3.0 ± 0.5 | 0.007 | 0.398 |
| Fascicle angle (°) | 17.0 ± 2.5 | 22.7 ± 3.3 | 0.001 | 0.511 | |
| Fascicle length (cm) | 8.4 ± 0.4 | 8.4 ± 0.8 | 0.888 | 0.001 | |
| GM architecture | Thickness (cm) | 1.9 ± 0.4 | 2.3 ± 0.2 | 0.042 | 0.248 |
| Fascicle angle (°) | 22.2 ± 4.6 | 25.7 ± 4.4 | 0.134 | 0.143 | |
| Fascicle length (cm) | 6.2 ± 0.7 | 5.9 ± 0.9 | 0.521 | 0.033 |
| Parameter | Taekwondo | Throwers | p | η2 | |
|---|---|---|---|---|---|
| Leg Press | |||||
| MIF (kg) | 349.6 ± 75.5 | 529.9 ± 67.5 | 0.000 | 0.643 | |
| MIF/Legs Lean Mass (kg·kg−1) | 5.8 ± 0.5 | 6.9 ± 0.9 | 0.007 | 0.395 | |
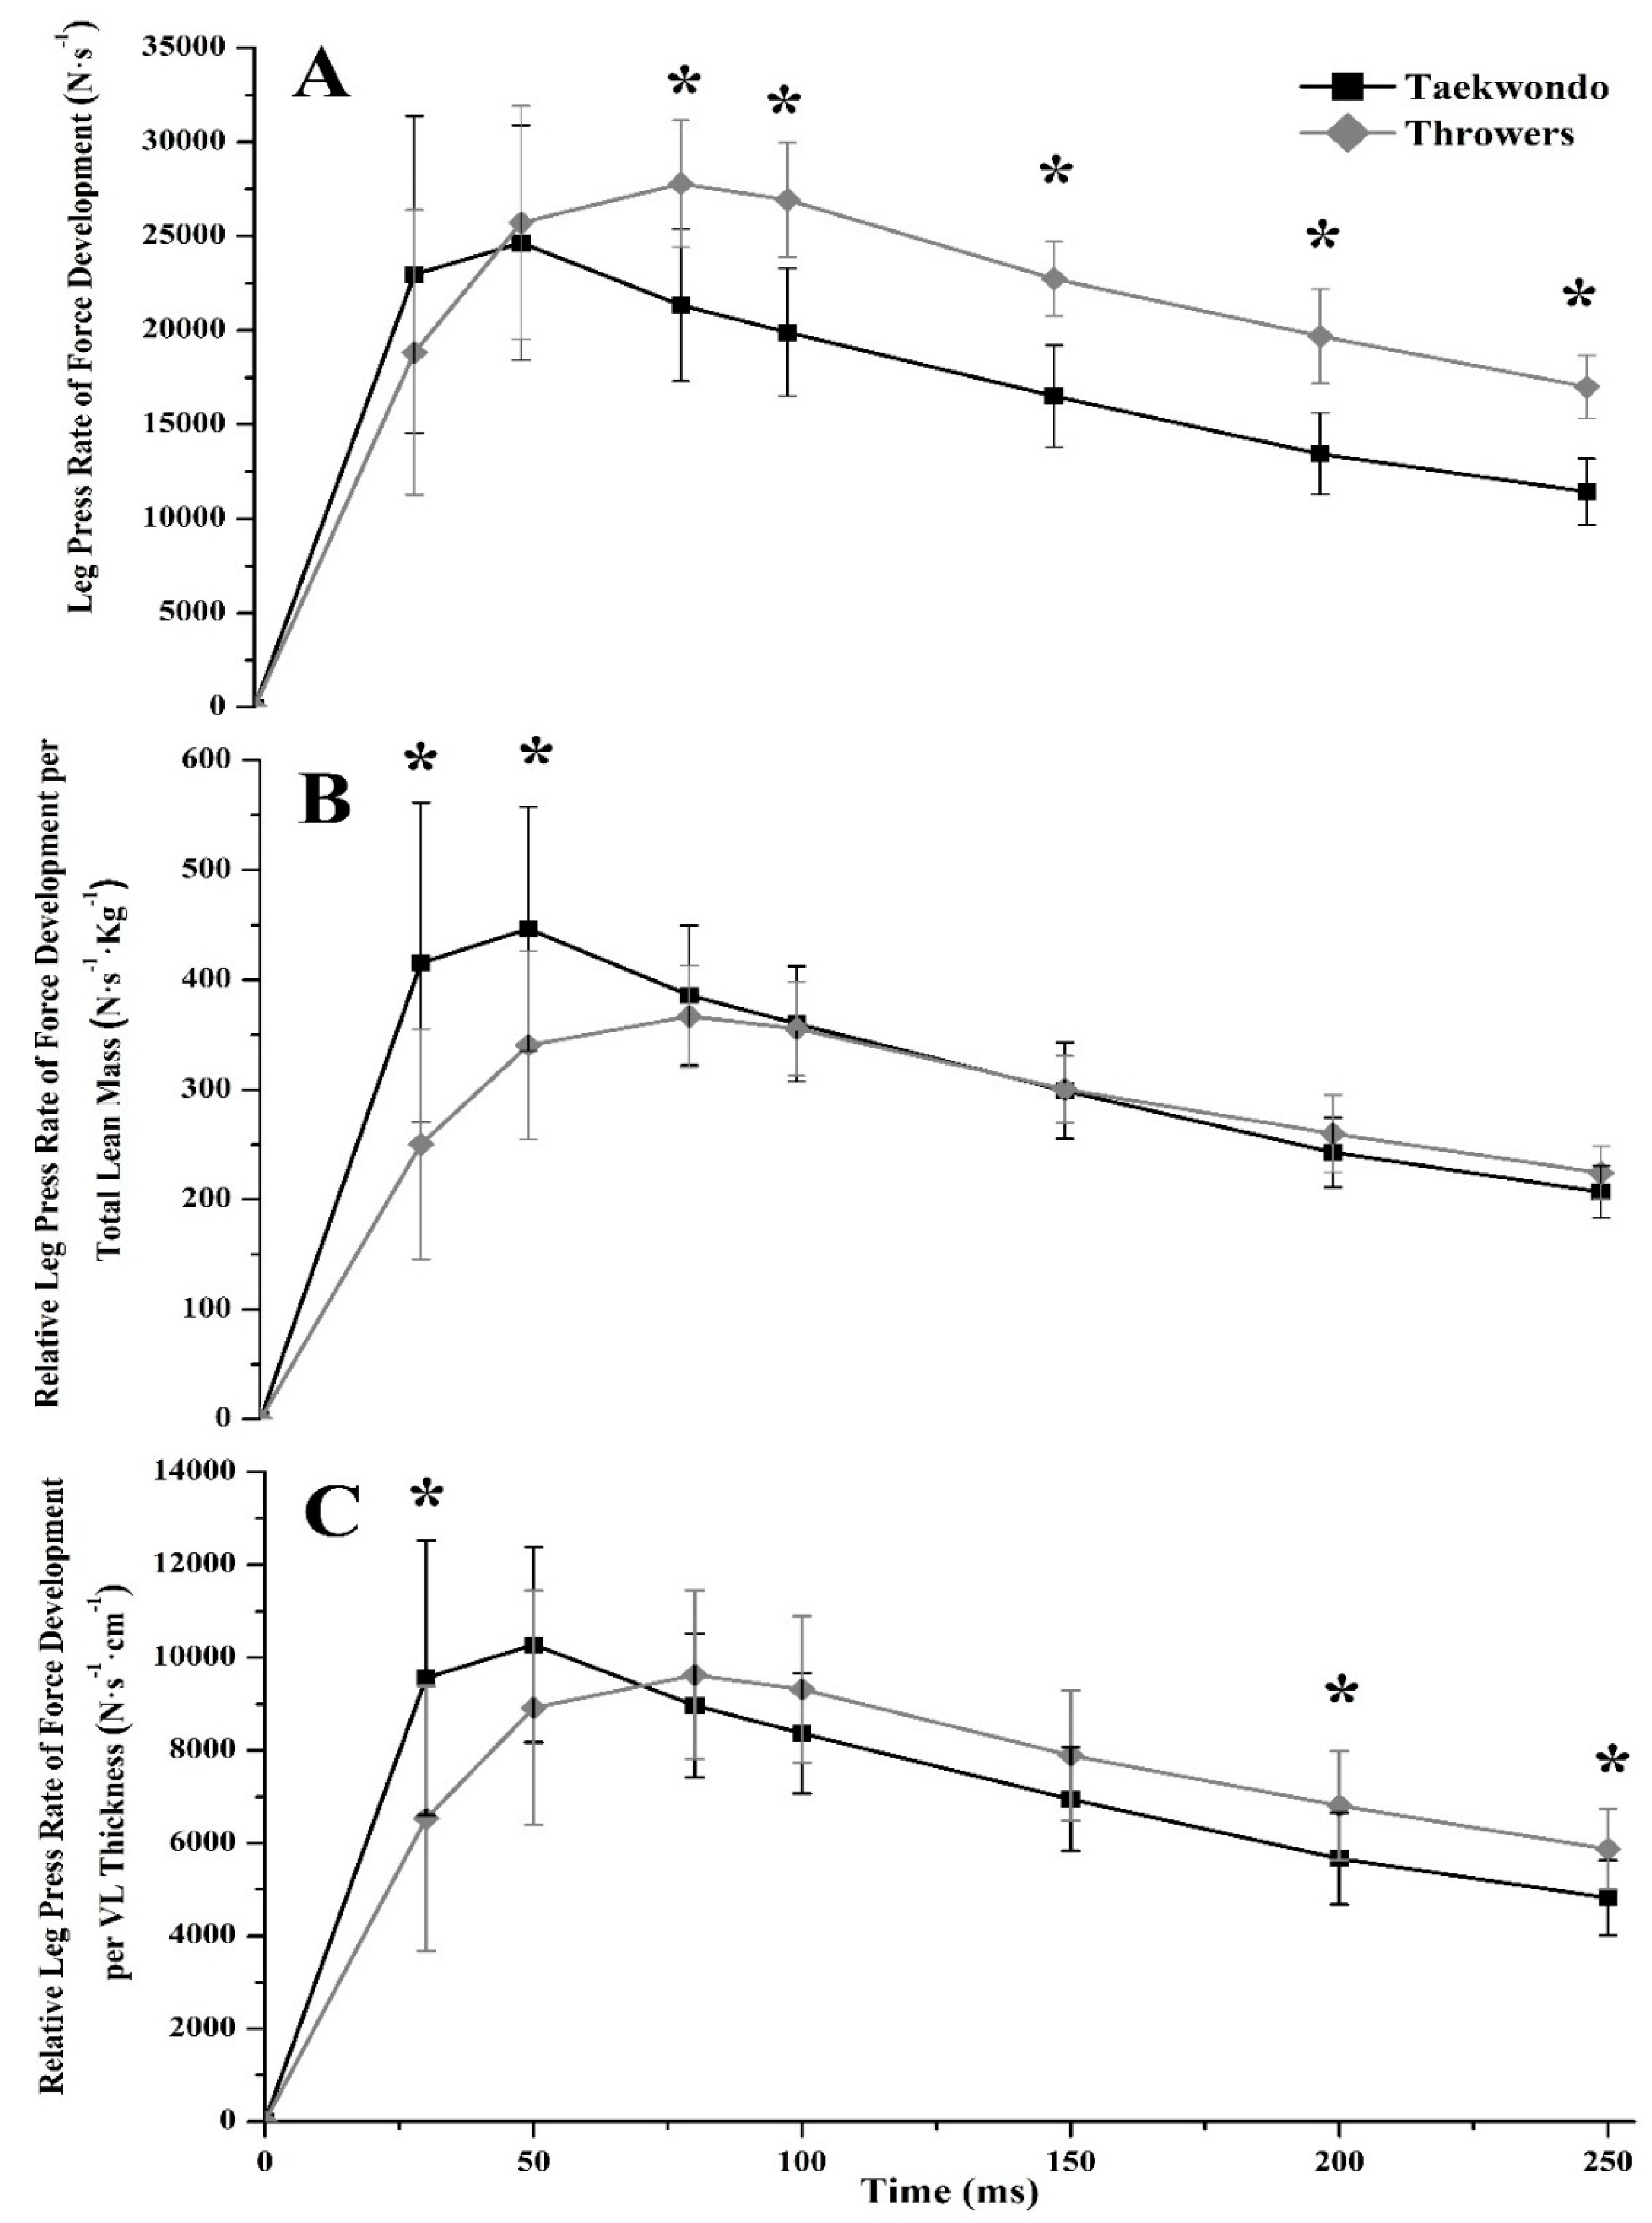
| Rate of Force Development (N·s−1) | 30 ms | 22,967.6 ± 8403.7 | 18,827.9 ± 7567.6 | 0.717 | 0.009 |
| 50 ms | 24,635.3 ± 6243.5 | 25,715.2 ± 6206.4 | 0.267 | 0.082 | |
| 80 ms | 21,341.3 ± 4035.4 | 27,784.1 ± 3362.9 | 0.004 | 0.440 | |
| 100 ms | 19,903.2 ± 3388.9 | 26,929.5 ± 3036.1 | 0.003 | 0.457 | |
| 150 ms | 16,512.6 ± 2703.1 | 22,735.9 ± 1973.4 | 0.001 | 0.519 | |
| 200 ms | 13,441.5 ± 2171.2 | 19,683.7 ± 2509.5 | 0.001 | 0.506 | |
| 250 ms | 11,440.9 ± 1761.9 | 16,996.5 ± 1668.7 | 0.000 | 0.616 | |
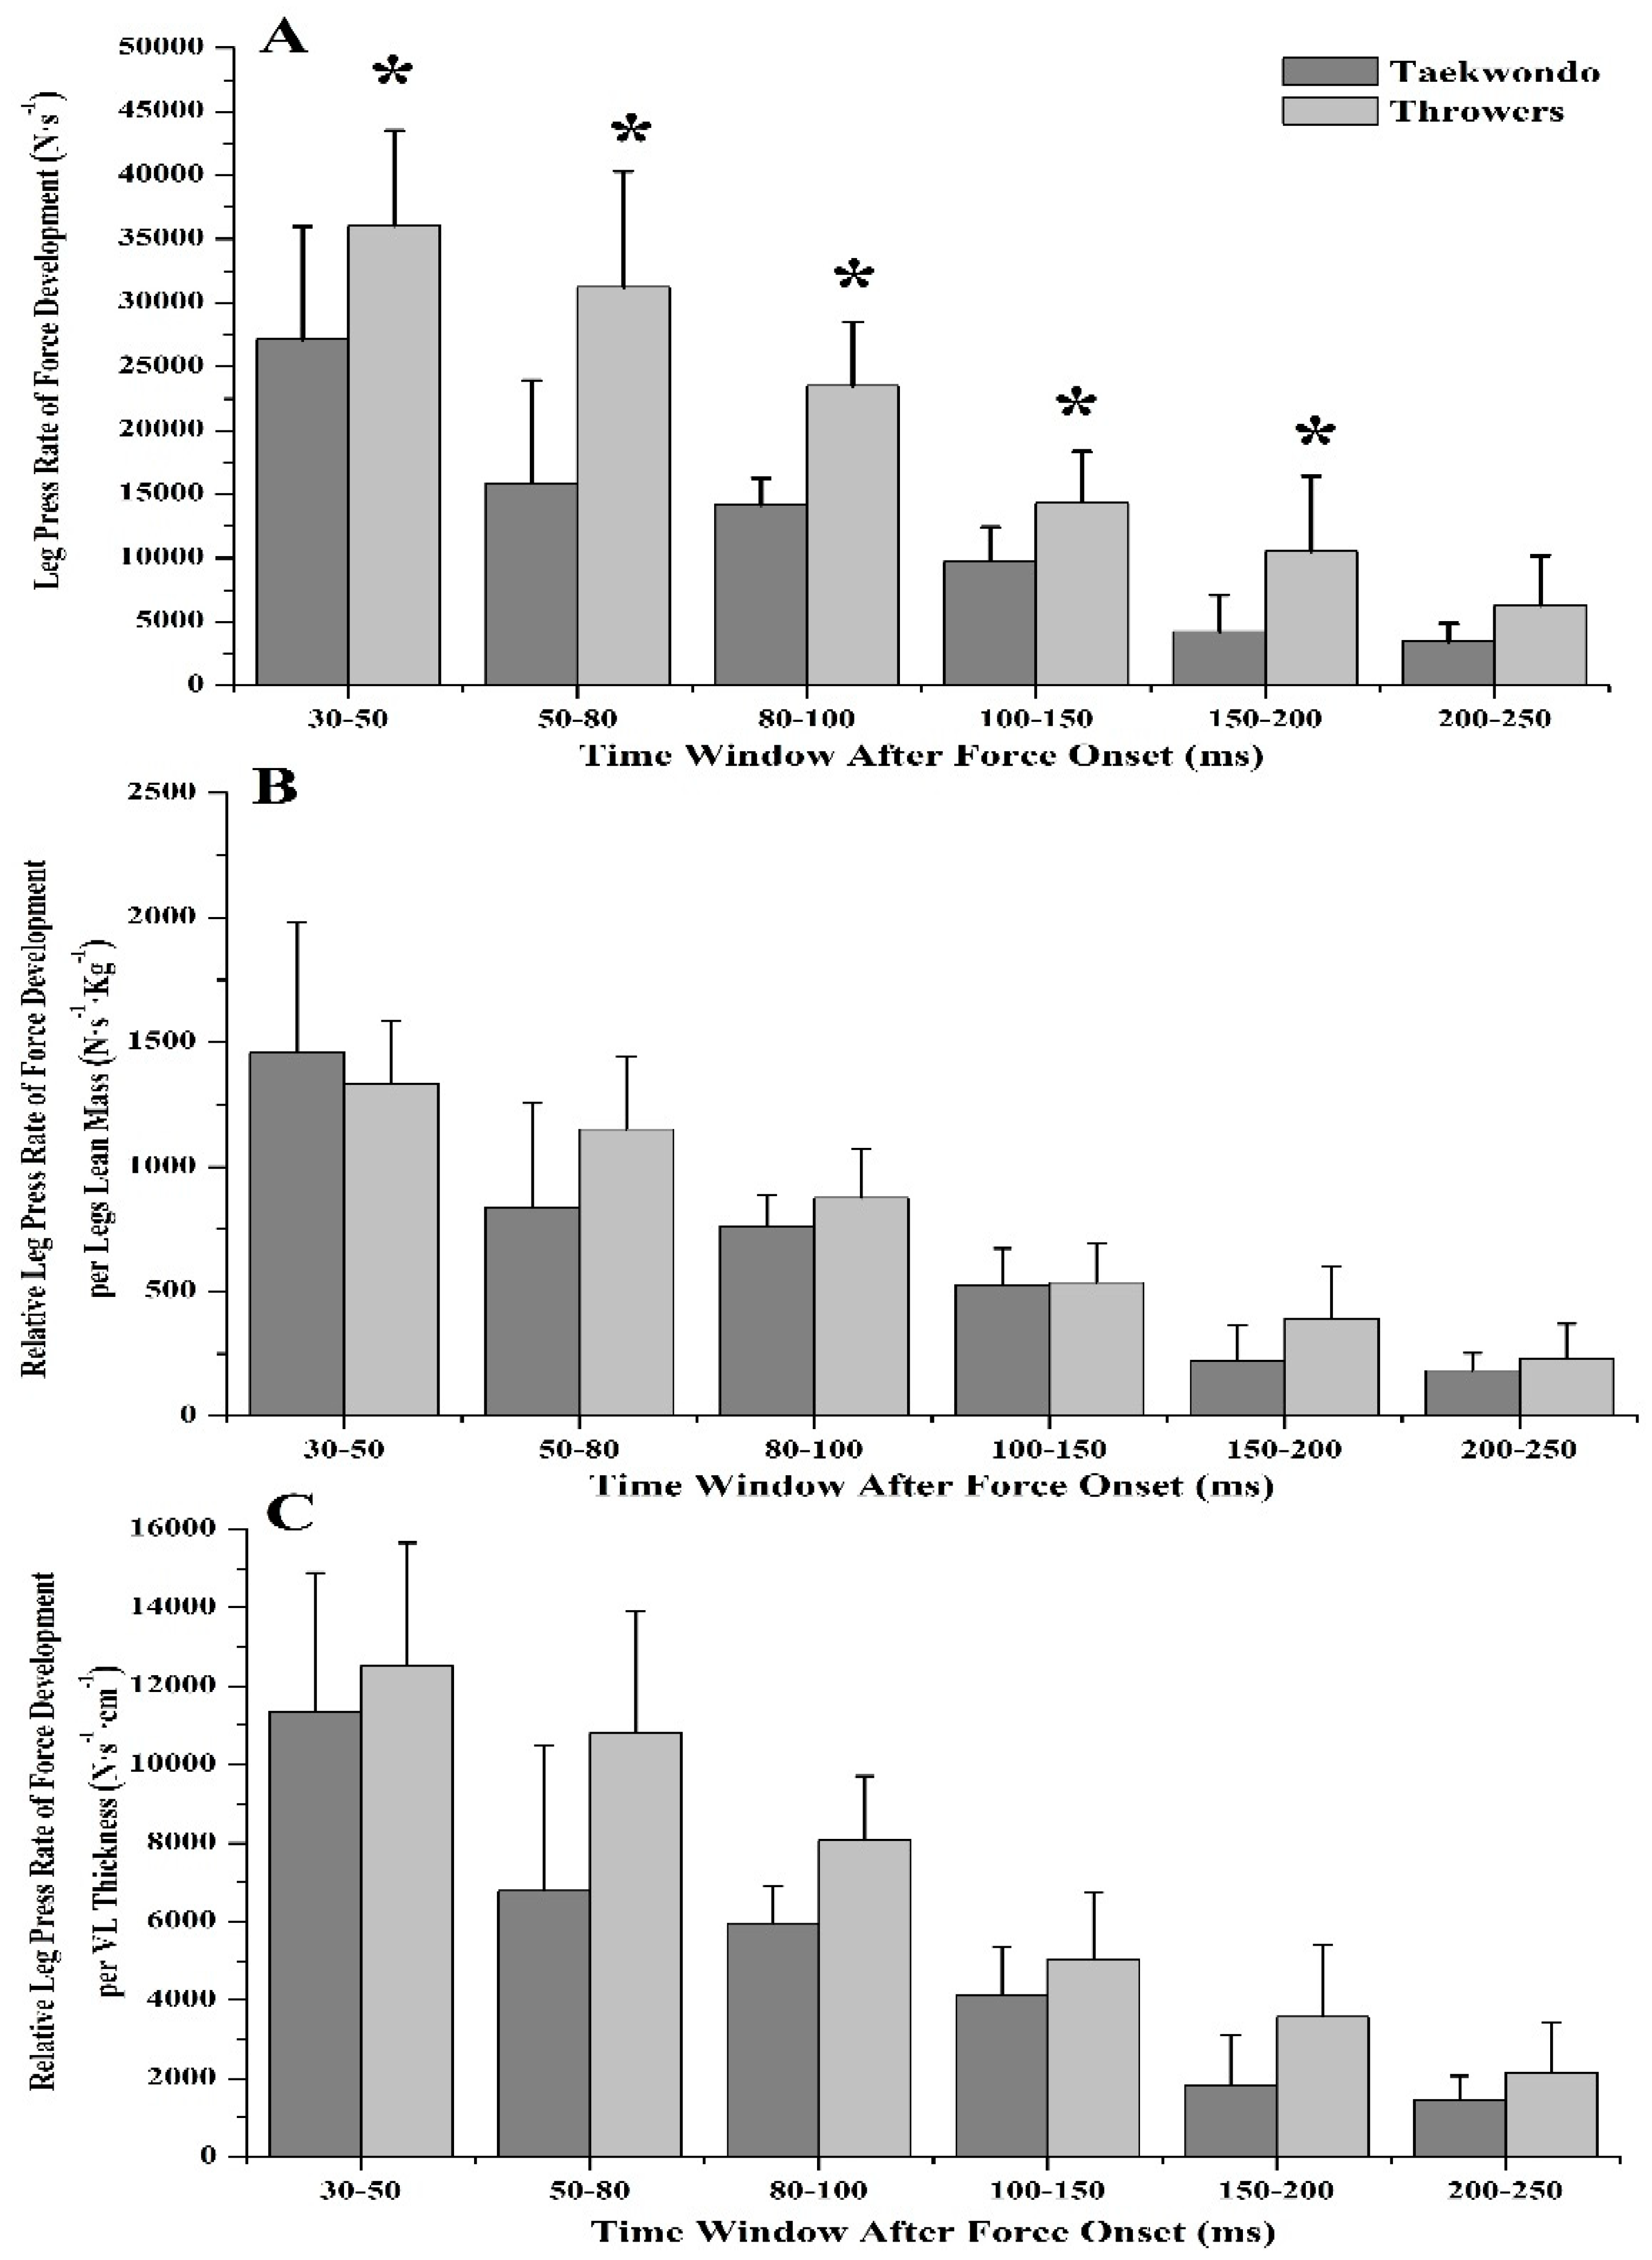
| Sequential Rate of Force Development (N·s−1) | 30–50 ms | 27,136.9 ± 8846.5 | 36,046.3 ± 7473.6 | 0.040 | 0.252 |
| 50–80 ms | 15,851.3 ± 8083.4 | 31,232.1 ± 9088.6 | 0.002 | 0.472 | |
| 80–100 ms | 14,150.9 ± 2103.6 | 23,511.3 ± 4994.8 | 0.000 | 0.617 | |
| 100–150 ms | 9731.5 ± 2688.3 | 14,348.8 ± 3996.6 | 0.015 | 0.336 | |
| 150–200 ms | 4228.1 ± 2861.2 | 10,527.2 ± 5904.6 | 0.015 | 0.333 | |
| 200–250 ms | 3438.4 ± 1433.5 | 6247.8 ± 3930.5 | 0.076 | 0.195 | |
| Leg Extension | |||||
| MIT (N·m) | 218.6 ± 34.5 | 371.2 ± 52.3 | 0.000 | 0.765 | |
| MIT/Legs Lean Mass (Nm·Kg−1) | 2.9 ± 0.2 | 3.4 ± 0.4 | 0.036 | 0.261 | |
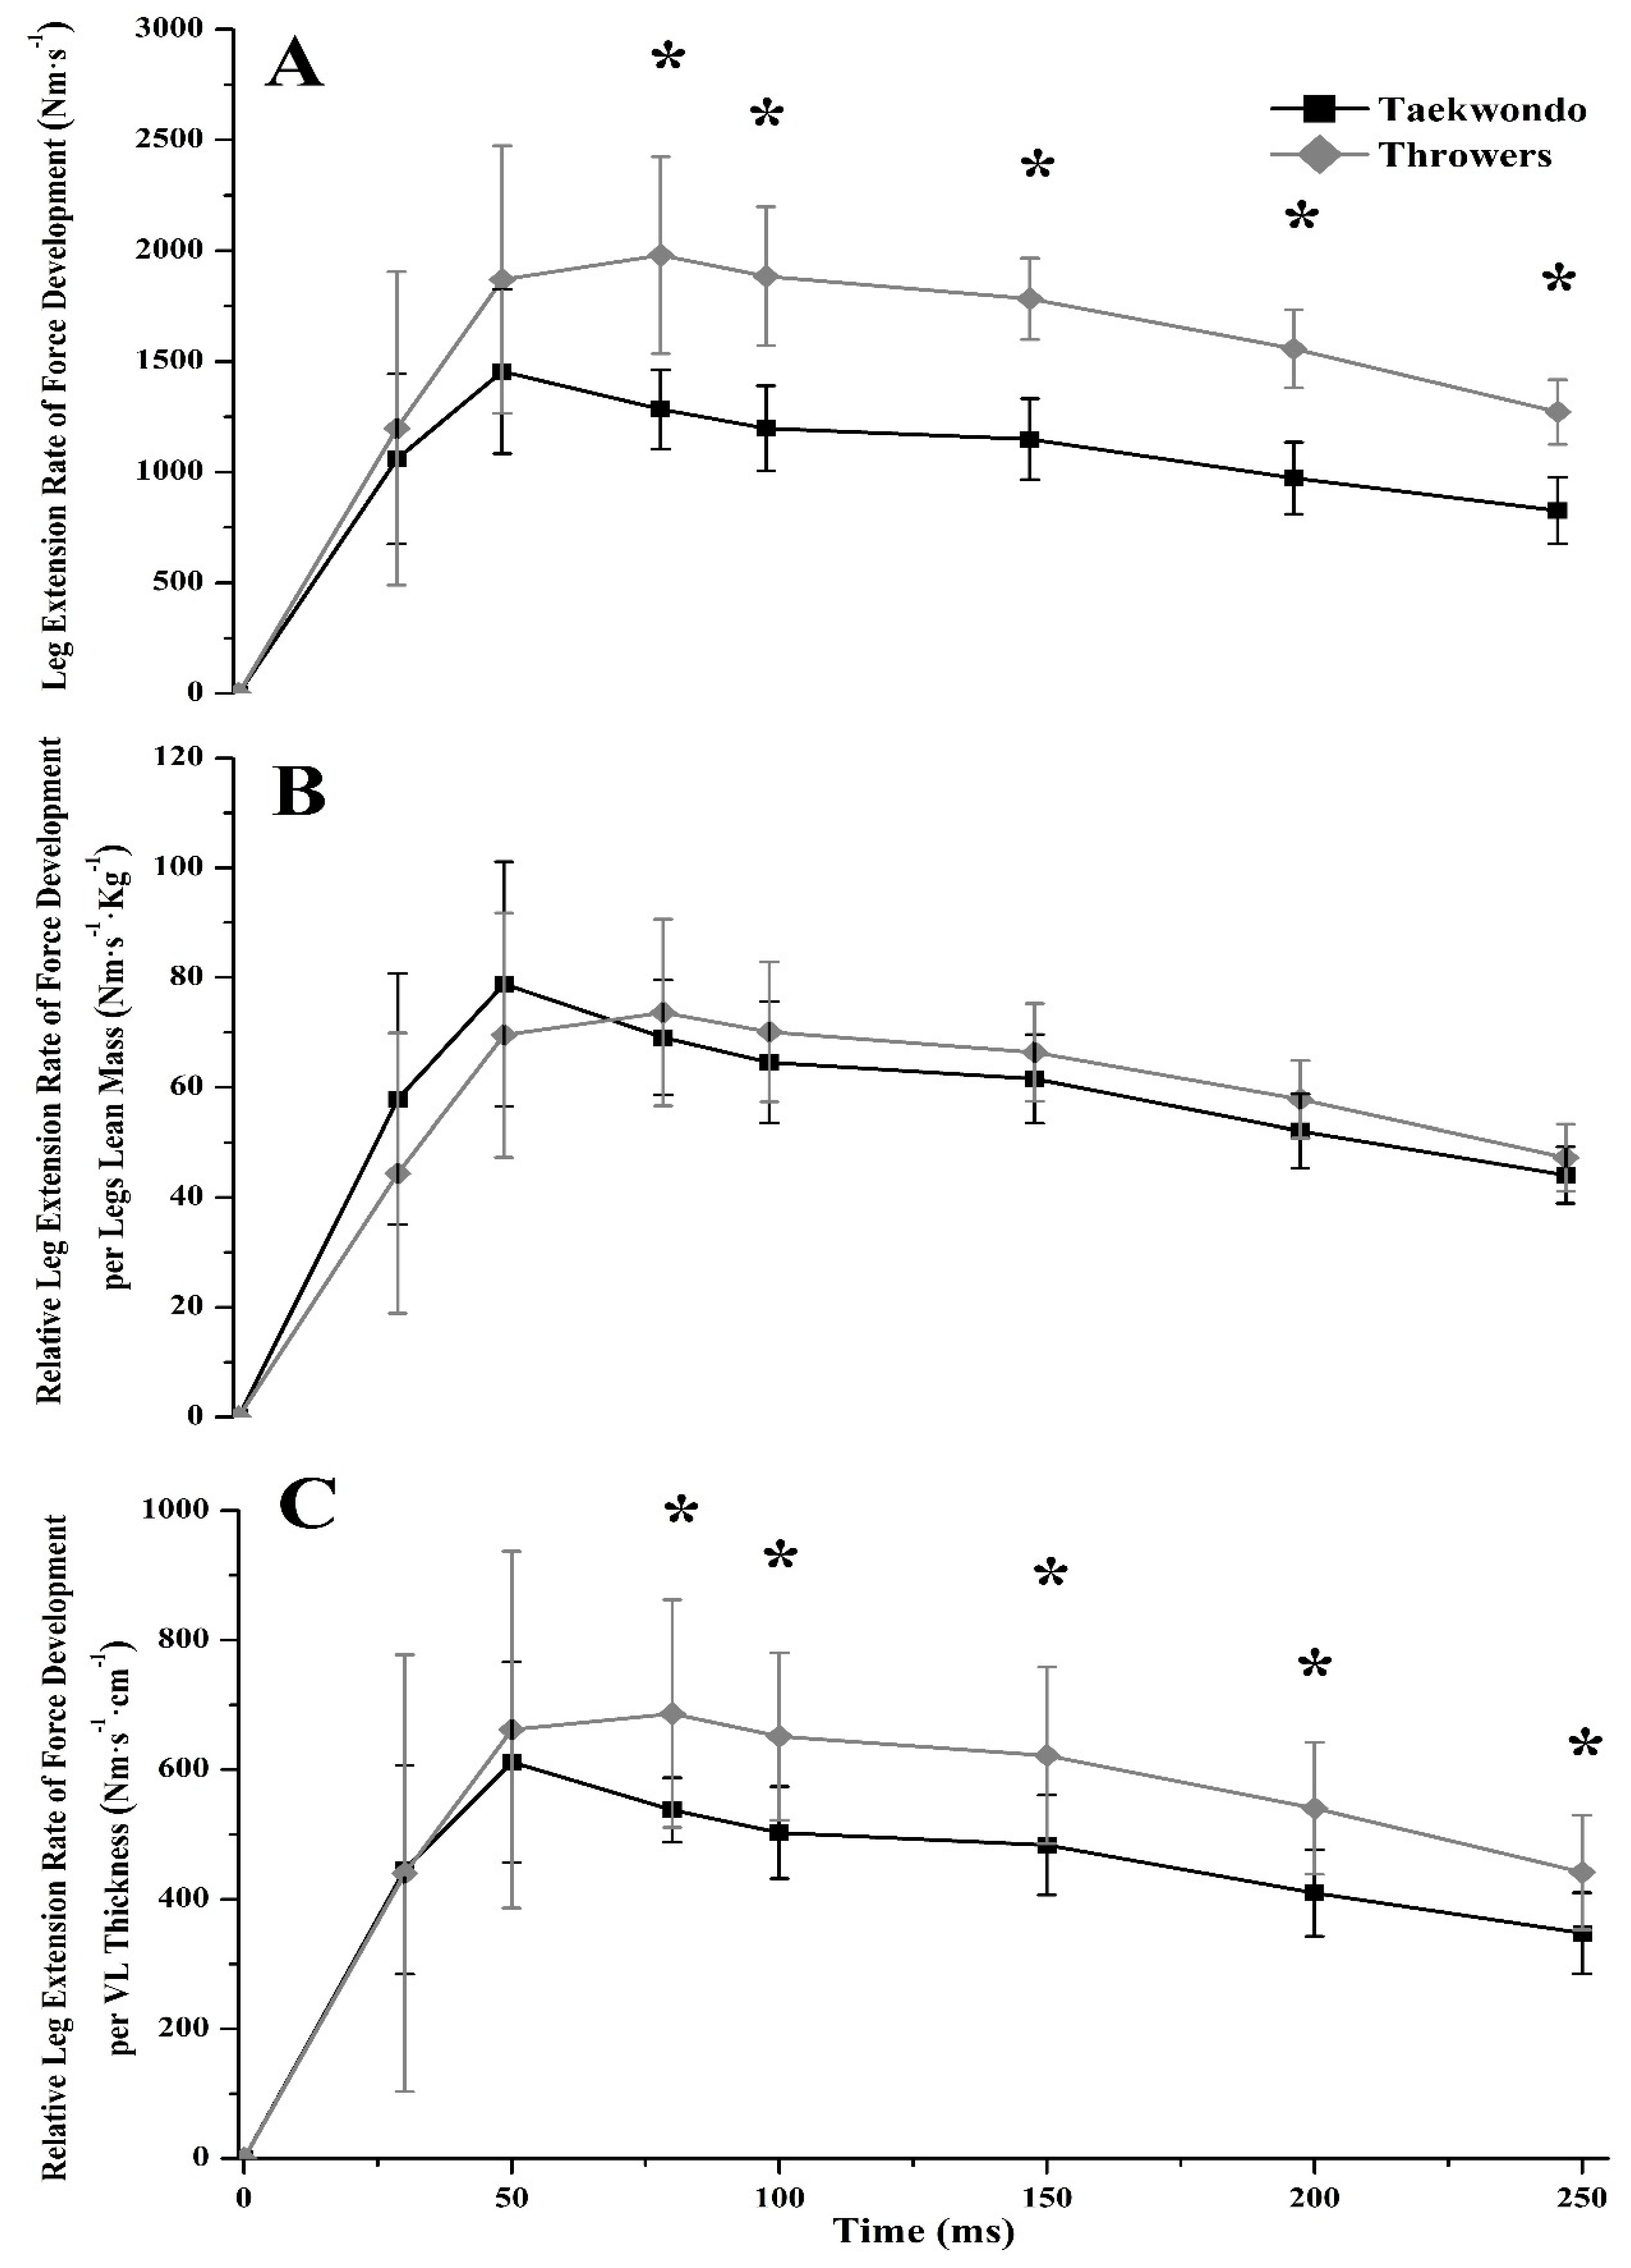
| Rate of Force Development (Nm·s−1) | 30 ms | 1059.7 ± 384.3 | 1196.9 ± 707.6 | 0.613 | 0.016 |
| 50 ms | 1454.5 ± 370.2 | 1869.5 ± 604.2 | 0.114 | 0.158 | |
| 80 ms | 1283.7 ± 179.3 | 1979.6 ± 444.5 | 0.001 | 0.532 | |
| 100 ms | 1197.8 ± 191.8 | 1885.1 ± 313.8 | 0.000 | 0.657 | |
| 150 ms | 1148.9 ± 182.8 | 1782.8 ± 184.3 | 0.000 | 0.771 | |
| 200 ms | 972.6 ± 161.9 | 1557.2 ± 176.9 | 0.000 | 0.763 | |
| 250 ms | 825.9 ± 150.1 | 1271.4 ± 146.1 | 0.000 | 0.719 | |
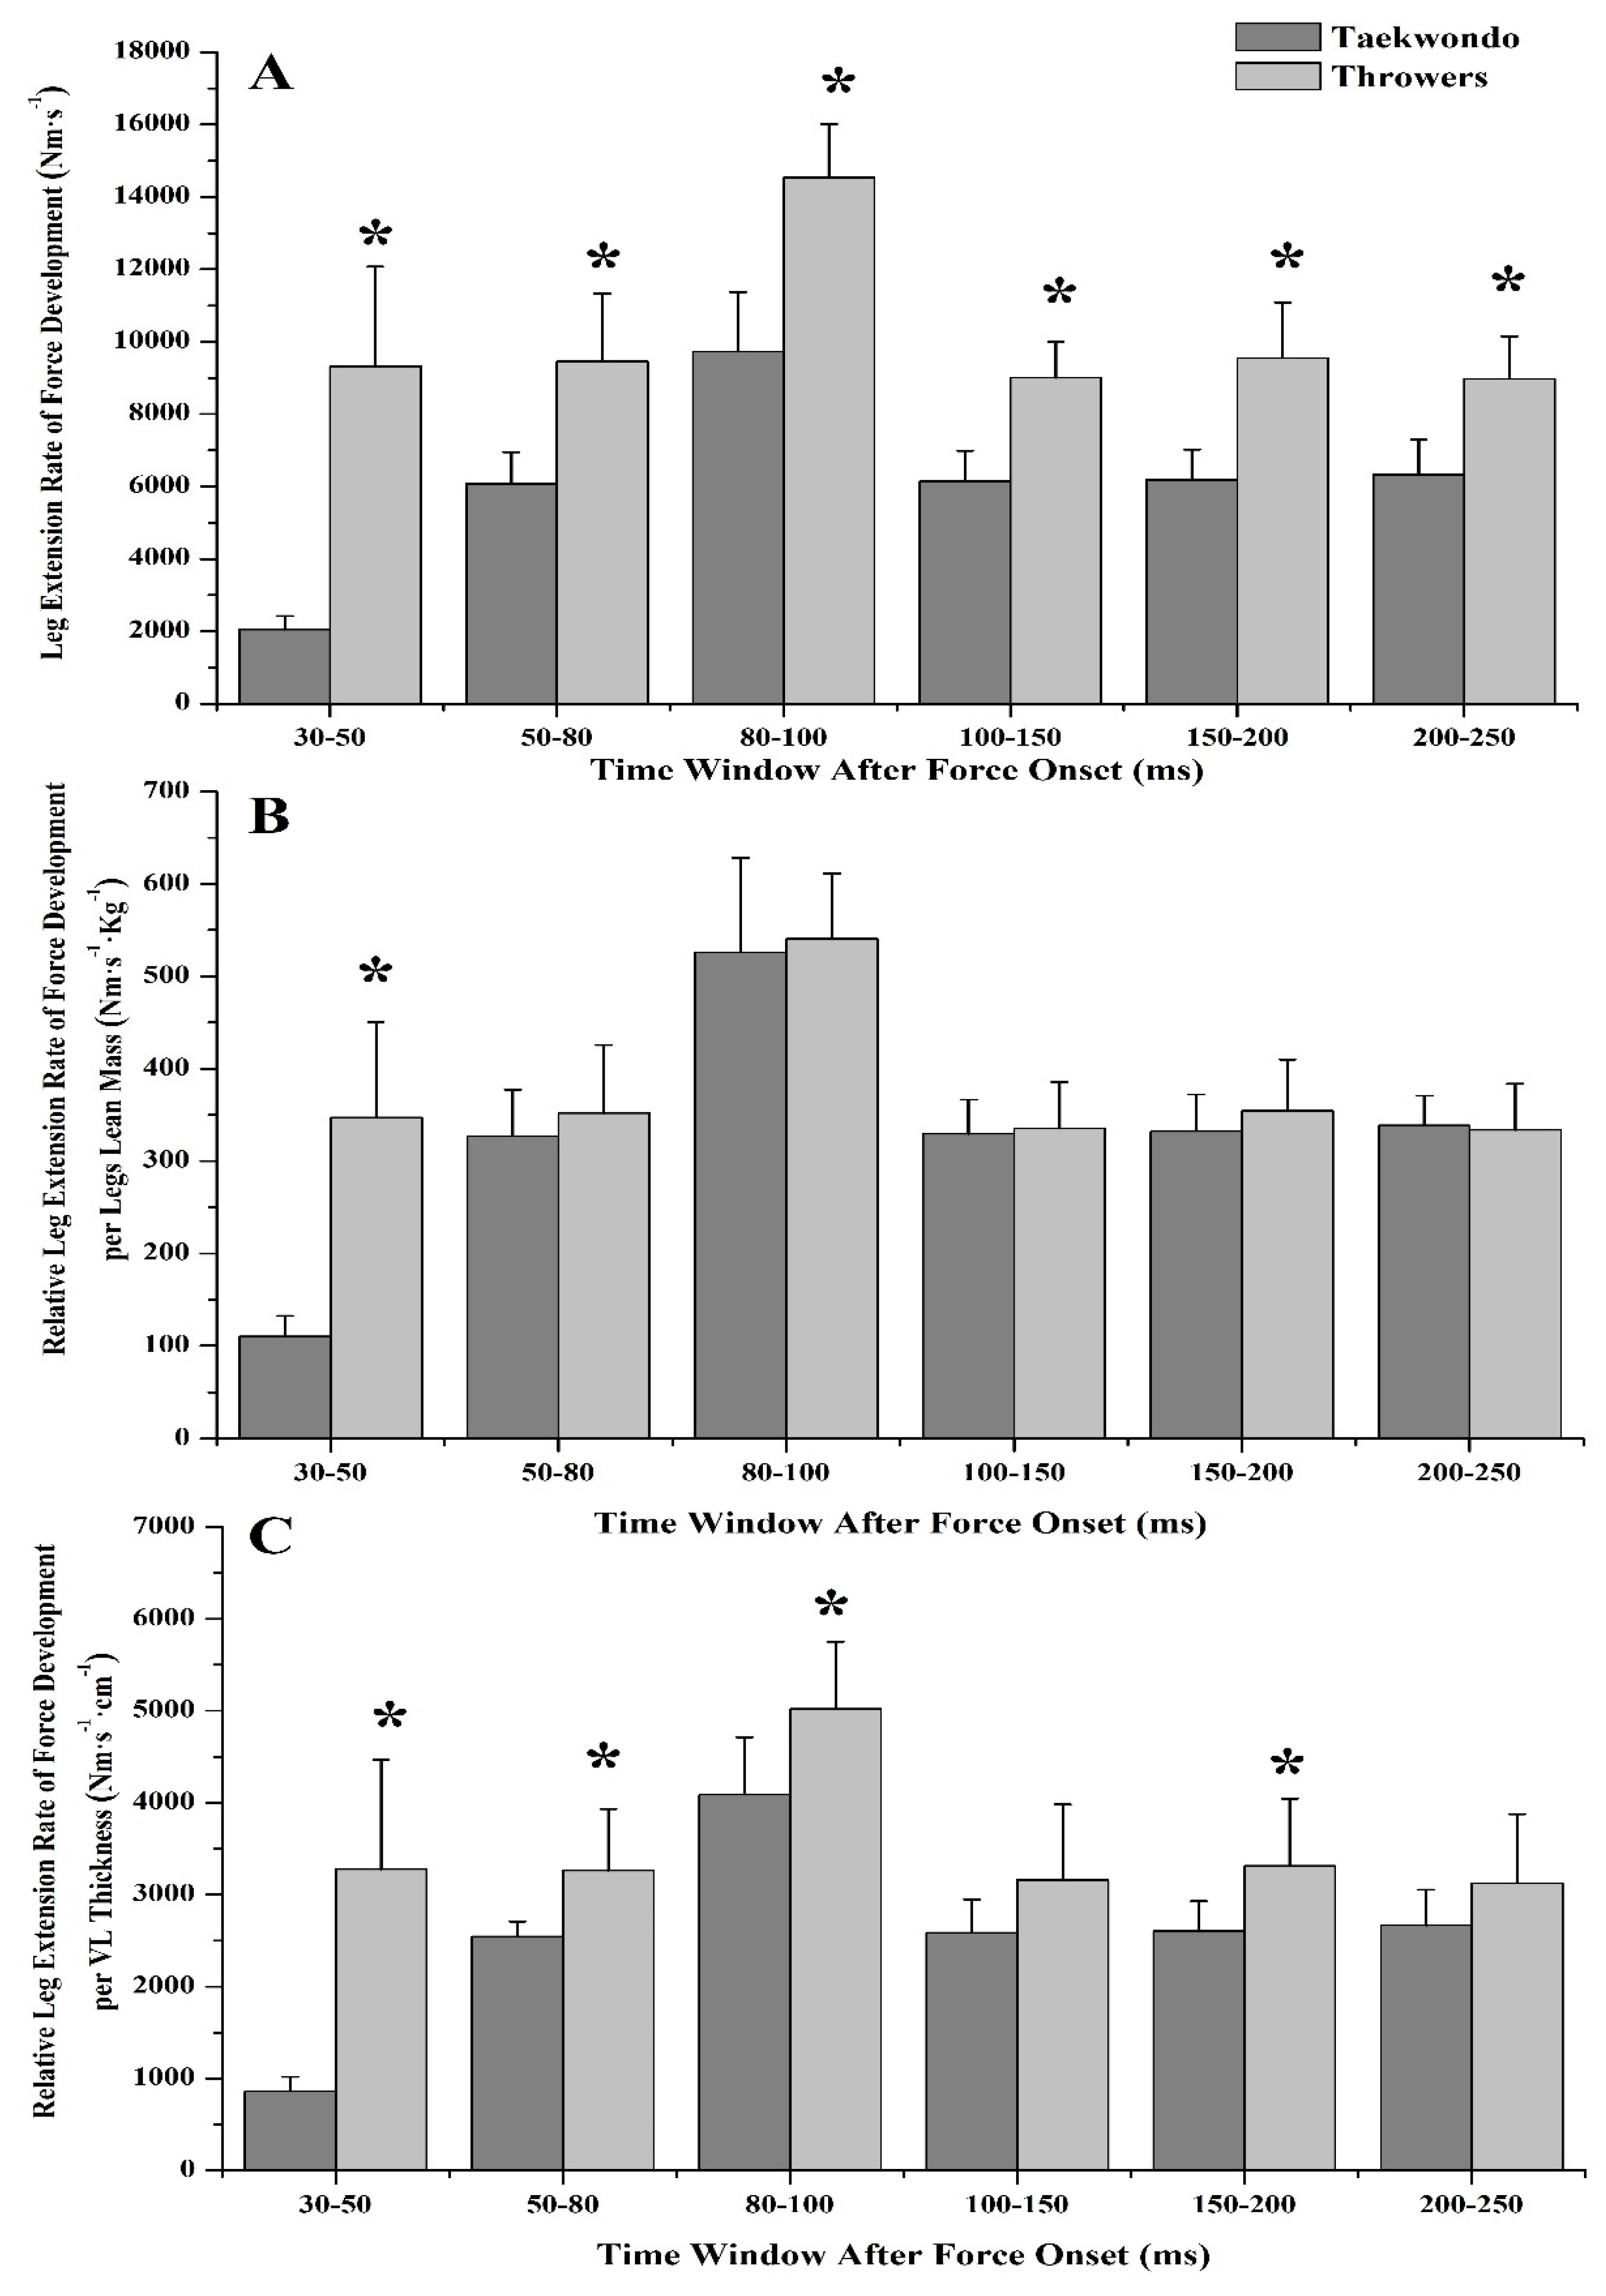
| Sequential Rate of Force Development (Nm·s−1) | 30–50 ms | 2046.7 ± 380.3 | 9319.3 ± 2752.4 | 0.000 | 0.784 |
| 50–80 ms | 6080.7 ± 870.4 | 9457.4 ± 1873.7 | 0.000 | 0.591 | |
| 80–100 ms | 9732.9 ± 1642.8 | 14,536.2 ± 1475.2 | 0.000 | 0.729 | |
| 100–150 ms | 6144.4 ± 840.3 | 9007.2 ± 992.3 | 0.000 | 0.730 | |
| 150–200 ms | 6187.2 ± 836.6 | 9554.4 ± 1532.6 | 0.000 | 0.669 | |
| 200–250 ms | 6332.5 ± 966.4 | 8975.1 ± 1171.9 | 0.000 | 0.628 | |
| Dependent | Independent | ANOVA | Variable Explained (%) | β | Sig. |
|---|---|---|---|---|---|
| CMJ Power | VL Thickness | F = 5.746 p = 0.015 | 37.2 | 0.850 | 0.004 |
| VL Fascicle Length | −0.573 | 0.039 | |||
| LPRFD80ms | VL Thickness | F = 10.458 p = 0.002 | 54.2 | 0.982 | 0.000 |
| VL Fascicle Length | −0.588 | 0.016 | |||
| LPRFD100ms | VL Thickness | F = 11.911 p = 0.001 | 57.7 | 1.000 | 0.000 |
| VL Fascicle Length | −0.522 | 0.024 | |||
| LPRFD150ms | VL Thickness | F = 9.847 p = 0.002 | 52.5 | 0.964 | 0.001 |
| VL Fascicle Length | −0.509 | 0.035 | |||
| LPRFD200ms | VL Thickness | F = 7.581 p = 0.006 | 45.1 | 0.895 | 0.002 |
| VL Fascicle Length | −0.401 | 0.110 | |||
| LPRFD250ms | VL Thickness | F = 10.891 p = 0.001 | 55.3 | 0.972 | 0.000 |
| VL Fascicle Length | −0.447 | 0.054 | |||
| LPRFDMIF | VL Thickness | F = 12.517 p = 0.001 | 59.0 | 0.985 | 0.000 |
| VL Fascicle Length | −0.410 | 0.063 | |||
| LERFD80ms | VL Thickness | F = 4.305 p = 0.035 | 29.2 | 0.765 | 0.012 |
| VL Fascicle Length | −0.338 | 0.226 | |||
| LERFD100ms | VL Thickness | F = 7.422 p = 0.006 | 44.5 | 0.884 | 0.002 |
| VL Fascicle Length | −0.372 | 0.138 | |||
| LERFD150ms | VL Thickness | F = 7.224 p = 0.007 | 43.8 | 0.904 | 0.002 |
| VL Fascicle Length | −0.541 | 0.039 | |||
| LERFD200ms | VL Thickness | F = 9.073 p = 0.003 | 50.2 | 0.950 | 0.001 |
| VL Fascicle Length | −0.515 | 0.037 | |||
| LERFD250ms | VL Thickness | F = 7.958 p = 0.005 | 46.5 | 0.920 | 0.001 |
| VL Fascicle Length | −0.488 | 0.054 | |||
| LERFDMIF | VL Thickness | F = 9.069 p = 0.003 | 50.2 | 0.936 | 0.001 |
| VL Fascicle Length | −0.434 | 0.073 |
© 2018 by the authors. Licensee MDPI, Basel, Switzerland. This article is an open access article distributed under the terms and conditions of the Creative Commons Attribution (CC BY) license (http://creativecommons.org/licenses/by/4.0/).
Share and Cite
Kavvoura, A.; Zaras, N.; Stasinaki, A.-N.; Arnaoutis, G.; Methenitis, S.; Terzis, G. The Importance of Lean Body Mass for the Rate of Force Development in Taekwondo Athletes and Track and Field Throwers. J. Funct. Morphol. Kinesiol. 2018, 3, 43. https://doi.org/10.3390/jfmk3030043
Kavvoura A, Zaras N, Stasinaki A-N, Arnaoutis G, Methenitis S, Terzis G. The Importance of Lean Body Mass for the Rate of Force Development in Taekwondo Athletes and Track and Field Throwers. Journal of Functional Morphology and Kinesiology. 2018; 3(3):43. https://doi.org/10.3390/jfmk3030043
Chicago/Turabian StyleKavvoura, Angeliki, Nikolaos Zaras, Angeliki-Nikoletta Stasinaki, Giannis Arnaoutis, Spyridon Methenitis, and Gerasimos Terzis. 2018. "The Importance of Lean Body Mass for the Rate of Force Development in Taekwondo Athletes and Track and Field Throwers" Journal of Functional Morphology and Kinesiology 3, no. 3: 43. https://doi.org/10.3390/jfmk3030043