
Transmission Range Evaluations for Connected Vehicles at Highway-Rail Grade Crossings


1
Bowhead Logistics Solutions, 1200 New Jersey Avenue, SE, Washington, DC 20590, USA
2
Department of Civil Engineering, University of Nebraska–Lincoln, PKI 203E, 1110 S 67th Street Omaha, NE 68182-0178, USA
*
Author to whom correspondence should be addressed.
Designs 2017, 1(1), 2; https://doi.org/10.3390/designs1010002
Submission received: 3 April 2017
/
Revised: 4 May 2017
/
Accepted: 9 May 2017
/
Published: 12 May 2017
(This article belongs to the Special Issue Road Vehicle Safety: Design and Assessment)
Abstract
:This study evaluates the transmission range requirements of Connected Vehicles (CVs) at Highway-Rail Grade Crossings (HRGCs) in terms of safety improvement. The safety improvement of HRGCs is evaluated by using a reliability-based risk analysis that calculates risk of collision for CVs and non-CVs. Trains are assumed to have onboard units that transmit train location and speed information to CVs via vehicle to vehicle communications. The stopping distance and time to collision of a vehicle are the demand functions in reliability-based risk analysis. The demand functions consist of probability density functions of a vehicle’s initial speed, perception-reaction time, initial deceleration rate, final speed, and final deceleration rate. Train arrival time depending on the train speed and transmission range is the supply threshold for calculating the CV’s risk of collision at passive HRGCs. The transmission range’s projected highway distance is the supply threshold for CVs at active HRGCs. After deriving probability density functions of demand functions from the published data, Monte Carlo simulations generate the probabilities or risks that a CV would fail to stop within the transmission range or train arrival time. With the provision of a 600 m transmission range, the risk of collision for the CV is lower than that for the non-CV with a 300 m sight distance to the train at the passive HRGC. The CV’s risk of collision is lower than the non-CV’s with a 300 m transmission range at active HRGCs. The CV application at HRGCs can improve safety by reducing CVs’ risk of collision. A 600 m transmission range is desirable at passive HRGCs. A 300 m transmission is sufficient for CVs at active HRGCs. Overall, a 600 m transmission range is feasible to improve the safety at passive and active HRGCs.
1. Introduction
Highway-rail grade crossings (HRGCs) are locations with continuing safety issues despite work done to improve their safety. The total number of incidents, injuries, and deaths at public HRGCs in the U.S. has declined over the last 10 years; however, 2060 incidents, 990 injuries, and 237 deaths still occurred in 2015 [1]. These injuries and deaths incur primary (direct, indirect, and intangible) and secondary (supply chain business disruption) costs [2]. Active HRGCs have more incidents, injuries, and deaths than passive HRGCs for they are located in higher traffic areas and more likely to incur incidents [3]. However, safety devices at active HRGCs have a higher incident prevention rate than stop or yield signs at passive HRGCs, when traffic volumes and number of trains are taken into account [4]. The major cause of incidents at active HRGCs is drivers’ violation of control devices [5]. Impatient drivers rush the gates as they think no train will arrive soon based on their experiences [6]. Likewise, passive HRGCs experience a high level of noncompliance to stop signs. A field study of seven passive HRGCs in Kansas shows that 79% (1913 out of 2421) of drivers did not stop in front of stop signs [7]. Another field study in Australia shows that 59% of drivers are not compliant to stop signs [8]. Kasalica et al. [9] found that 8 out of 35 drivers (23%) did not stop or slow down after perceiving an approaching train at a passive HRGC in Serbia. Driver violations are the main cause of incidents at HRGCs, and a new technology has the potential to mitigate the problem by providing train information to drivers directly.
Safety devices, such as flashing light signals, automatic gates, or other infrastructure are used to improve safety for active HRGCs with high incident rates. Passive HRGCs have crossbucks, stop or yield signs and are typically located in rural areas or areas with lower traffic volumes and lower numbers of trains. Drivers may be aware of the traffic control devices by auditory or visual stimulus when they are sufficiently close (within sight distance) to active HRGCs. At passive HRGCs, drivers need to locate the trains by themselves to make sure there are no approaching trains before crossing. However, some drivers are not aware of approaching trains for various reasons, or they perceive trains but make the wrong decision of proceeding or stopping, resulting in incidents [10]. Drivers’ negligence or misjudgment of a train’s arrival time results in an incident. Essentially, drivers at any HRGC have higher risks if they are unable to perceive approaching trains in time and make correct decisions to avoid collisions. The current protection mechanism providing auditory or visual warnings may not be sufficient for drivers to know exactly when an approaching train will arrive.
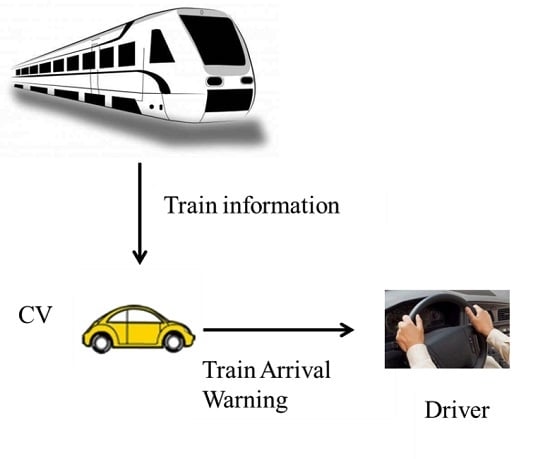
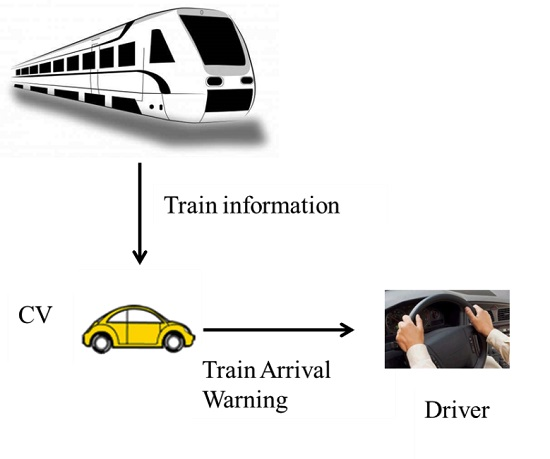
It is expected that injuries and deaths at HRGCs can be further reduced if a new system can provide train information to drivers directly. Given the train speed and arrival time, drivers can have a better chance to make the correct decision and avoid collisions. Wireless communication methods can transmit train information from a train to highway vehicles. The emergence of Connected Vehicle (CV) technology provides the wireless communication network for Vehicle-to-Vehicle (V2V) safety applications. The CV technology uses dedicated short-range communications to enable V2V information exchange using onboard units (OBUs). The U.S. Department of Transportation announces the proposed rules for mandating V2V communications on light vehicles [11] paving the way to improving safety at HRGCs in the future. The concept of direct communications between a train and vehicles had been proposed by Hartong et al. [12]. OBUs had been installed on trucks and transit vehicles in the safety pilot model deployment [13]. An OBU can also be installed on a train that is similar to the installation on a vehicle. When a train is equipped with an OBU, a highway vehicle’s OBU can receive the train information and evaluate the risk of collision based on its own with the train’s speed, location, and heading. An OBU consisting of V2V communication and driver-vehicle interfaces can provide visual, auditory, or haptic warnings to drivers if any risk exceeds a threshold. CV drivers may maneuver their vehicles to avoid potential incidents after perceiving the onboard warning. In this study, it is assumed that OBUs are installed on CVs and approaching trains, other assumptions regarding the driver, highway, train and HRGC will be specified in the problem formulation section.
The objective of this study is to evaluate the transmission range requirements of CV application at HRGCs from the perspective of safety improvement. The problem is formulated as a reliability-based risk analysis with the demand variable acting as a probability density function [14]. With the supply variable given as a safety threshold, the probability of exceeding the threshold (deterministic) is defined as the risk of collision (a probability between 0 and 1). The supply variables are the sight distance and transmission range for non-CVs and CVs. The transmission range of V2V communications is a function transmission power. The higher the transmission power, the longer the transmission range. Based on the performance requirements defined in SAE J2945/1 [15], the minimum transmission range for V2V safety applications is 300 m. However, considering the safety requirements at HRGCs, a train’s OBU can transmit at a higher power level to extend the transmission range over 300 m. The demand variables are the stopping distance and time to collision at active and passive HRGCs. The details of reliability-based risk analysis are elucidated in the next section.
2. Methods
2.1. Reliability-Based Risk Analysis
Reliability theory incorporates the uncertainty of the supply and demand variables in the performance function to generate the risk of failure. The simplest system includes one demand and one supply variable in the performance function [16]. When demand and supply variables are Probability Density Functions (PDF), the expected value and standard deviation of the difference between demand and supply variables can be calculated if both variables are normally distributed. A function’s PDF can be obtained by using exact methods if the function only has two variables. Exact methods are unable to work when more than two variables are in the limit state function—or when this limit state function is non-linear, or the variables are not normally distributed [17]. Approximate methods including the first- and second-order reliability methods were developed to solve this problem. Both methods transform a reliability analysis problem into an approximate optimization problem. Such a transformation comes with two premises: the number of random variables should be limited, and the problem should be lightly nonlinear to avoid large bias in the estimation [18]. Unlike approximate methods, the Monte Carlo Method [19] defines a domain of possible input variables, defines how these input variables are generated randomly from their PDFs over the domain, performs a deterministic computation for the input variables, and aggregates or analyzes the results statistically. Essentially, a Monte Carlo simulation randomly generates input variable values a large number of times and aggregates the result as a PDF for further analysis. When a function consisting of multiple variables and no closed form is available, Monte Carlo simulation is an efficient and effective tool to solve the problem. Since several input variables are expected in the demand function of problem formulation, Monte Carlo simulation will be used to calculate the risk of collision at HRGCs.
2.2. Problem Formulation
The risk of collision can be measured from the perspective of time and space. If a vehicle is unable to stop in time, then it may collide with an arriving train at passive HRGCs. If a vehicle is unable to stop in front of an active HRGC with gates, then it may collide with the gate. CV drivers receive train information from approaching trains at passive HRGCs, and the risk of collision is evaluated based on time to collision. CV drivers may also receive train information from an approaching train at active HRGCs, the risk of collision is evaluated based on their stopping distances. Only the CV without preceding vehicles approaching an HRGC that may collide with a train or a gate is considered as the CV with the potential risk of collision. At passive HRGCs, non-CV drivers need to perceive an approaching train by the visual (train) or auditory (horn) stimulus, and the risk is the potential collision with the train. At active HRGCs, the risk is considered as the potential collision with the infrastructure for non-CV drivers. A vehicle may go around the gates; however, this type of driver behavior is not considered in the problem formulation as vehicles may have already stopped or slowed down before crossing.
2.2.1. Assumptions
The following conditions are assumed at the passive and active HRGCs where the CV application is implemented.
- A single track and two-lane highway
- Straight sections with no curves on the highway
- The highway–rail intersecting angle is 90°
- The highway pavement is dry to provide sufficient friction for deceleration
- No line of sight obstruction between highway vehicles and the approaching train
- The sight distance to train is 300 m under fair weather conditions
- The speed of an approaching train is constant
- CV drivers are obedient to the onboard warning of a train arrival to stop their vehicles
2.2.2. Supply Thresholds
The supply variables for CVs and non-CVs are the transmission range and sight distance at HRGCs. As portrayed in Figure 1, the V2V transmission range is the distance from the approaching train to the CV. The V2V transmission range needs to be projected on the highway for supplying the required stopping distance at active HRGCs. The train speed, V2V transmission range, and sight distance determine the time to collision (TTC) at passive HRGCs. The highway distance is the supply threshold for a safe stop in front of active HRGCs. Train arrival time is the supply threshold at passive HRGCs. Table 1 lists the supply thresholds of CV and non-CVs at active and passive HRGCs.
For active HRGCs equipped with gates and flashers, the warning time shall be at least 20 s before the train arrival as regulated by the Code of Federal Regulations [20]. When the gate is lowering, a vehicle may collide with the gate whether the approaching train has arrived or not. Train arrival time becomes an indirect factor in the safety modeling at active HRGCs for vehicles are protected by the gates. Therefore, the supply threshold would be considered from the perspective of sight distance at active HRGCs. As for passive HRGCs, the supply threshold is considered from the perspective of TTC. Essentially, both CVs and non-CVs need to stop in time before a train arrives at a passive HRGC.
2.2.3. Demand Functions
Stopping distance defines the necessary distance for highway vehicles to stop safely in front of an obstacle. Stopping distance is a function of vehicle speed, perception-reaction time, deceleration rate, and grade based on the American Association of State Highway Transportation Officials [21] definition. When a driver applies the brake to decelerate from moving to a complete stop, the braking action should be continuous. That means the driver’s foot should keep pressing on the brake pedal until the vehicle comes to a stop. The deceleration rate is an average of the exerting braking force during the braking process. However, if the driver presses the brake initially and loosens it for a short time then presses it again, the deceleration rates of the two braking phases can be different.
Drivers tend to decelerate in a discontinuous manner when they are approaching HRGCs [22,23]. Drivers tend to reduce their speeds when they initially perceive risks. If the risk is not imminent, then the deceleration may not be continuous. The first phase of deceleration is mild for some drivers, and it is followed by the second phase of deceleration that the deceleration rate is higher than that of the first phase. At passive HRGCs, as drivers approach, it is assumed that they try to locate a train in the perception-reaction time. When a train is perceived, some drivers may start to decelerate at this moment, but the deceleration is mild without the intention to stop completely. At active HRGCs, drivers may just stop stepping on the accelerator or brake slightly as the HRGC is still far away. This process is the first phase of deceleration. When they see that a train is approaching, or warning lights are flashing, a solid brake will be applied to stop the vehicle completely. This process is the second phase of deceleration. Essentially, this stopping process can be divided into three parts: the perception-reaction time to locate the train, initial braking, and full braking [23]. Equation (1) [2] is to model the three-phase stopping behavior found at HRGCs. The second and third terms in Equation (1) denote the initial and final braking distances. As analyzed in the previous section, train arrival time is the supply threshold for CVs and non-CVs at passive HRGCs, and the corresponding demand function is TTC. Equation (2) denotes TTC of the stopping maneuver. The second and third terms in Equation (2) denote the initial and final braking times.
where
- d = stopping distance (m),
- Vi = initial vehicle speed (km/h),
- Vf = final vehicle speed (km/h),
- t = perception-reaction time (s),
- ai = initial deceleration rate (m/s2),
- af = final deceleration rate (m/s2),
- G = grade, and
- TTC = time to collision.
The demand function is the stopping distance the active HRGCs, and the demand function is TTC at passive HRGCs. Equations (3) and (4) define the risk of collision as the probabilities of stopping distance and TTC above the supply thresholds.
where
- = risk of collision for stopping distance,
- = risk of collision for TTC,
- =supply threshold of stopping distance,
- =supply threshold of TTC.
Monte Carlo simulations require PDFs of all stochastic variables in the demand function. The PDFs of stopping distance and TTC at HRGCs can be obtained by plugging the PDFs of all variables into Equations (3) and (4) (assuming grade is zero). With the assumption that perception-reaction time and vehicle speeds are normally distributed, and the deceleration rates are log-normally distributed, the histogram of stopping distance can be generated from simulations. The statistical package R (version 2.15.3) is used to perform these simulations. The risk of collision can be obtained by calculating the probability of overshooting a designated distance and TTC.
2.3. Data Sources
The data sources consist of field vehicle speeds and deceleration data at HRGCs, and drivers’ perception-reaction data from driving simulators. The data sources of active HRGCs are based on the data collected by Moon and Coleman [23] at two active HRGCs—Hartford and McLean in the Chicago–St. Louis high-speed passenger rail corridor. Only the single vehicle data from both sites are used in this study. The research of Tey et al. [22] using an HRGC driving simulator provides detail distance statistics (means and standard errors) of accelerator release, initial braking, and final braking for two initial speeds (60 and 80 kph). The PDFs of all variables in the demand functions are defined in Table 2 [24].
The PDF of each variable should be able to address the variations of driver behavior and other factors in the period of data collection. Driver behavior depends on human factors including gender, age, health condition, alcohol/drug use, etc. Other environmental, vehicular, and road factors—including time of day, day of week, weather, temperature, light, vehicle type, model year, tire pressure, pavement, and geometric designs—may affect the likeliness of a crash occurrence and the severity of injury if a crash occurs. These safety factors may change over time and their temporal stability is crucial in assessing the impact of safety countermeasures [25,26]. The PDFs are obtained from the collected samples that the temporary instability issue can be addressed in the data collection period; however, the sample characteristics may change over a longer period of time or other than the data collection period. In addition, the unobserved heterogeneity [27] among safety factors (e.g., pavement and light conditions) can be accounted for in the stochastic demand function considering the total effect of all variables’ randomness to the stopping distance. After all, the risk of collision is generated from the demand function based on the supply threshold, and Monte Carlo simulations provide the aggregate probabilities of all unobserved effects.
3. Results
3.1. Passive HRGC
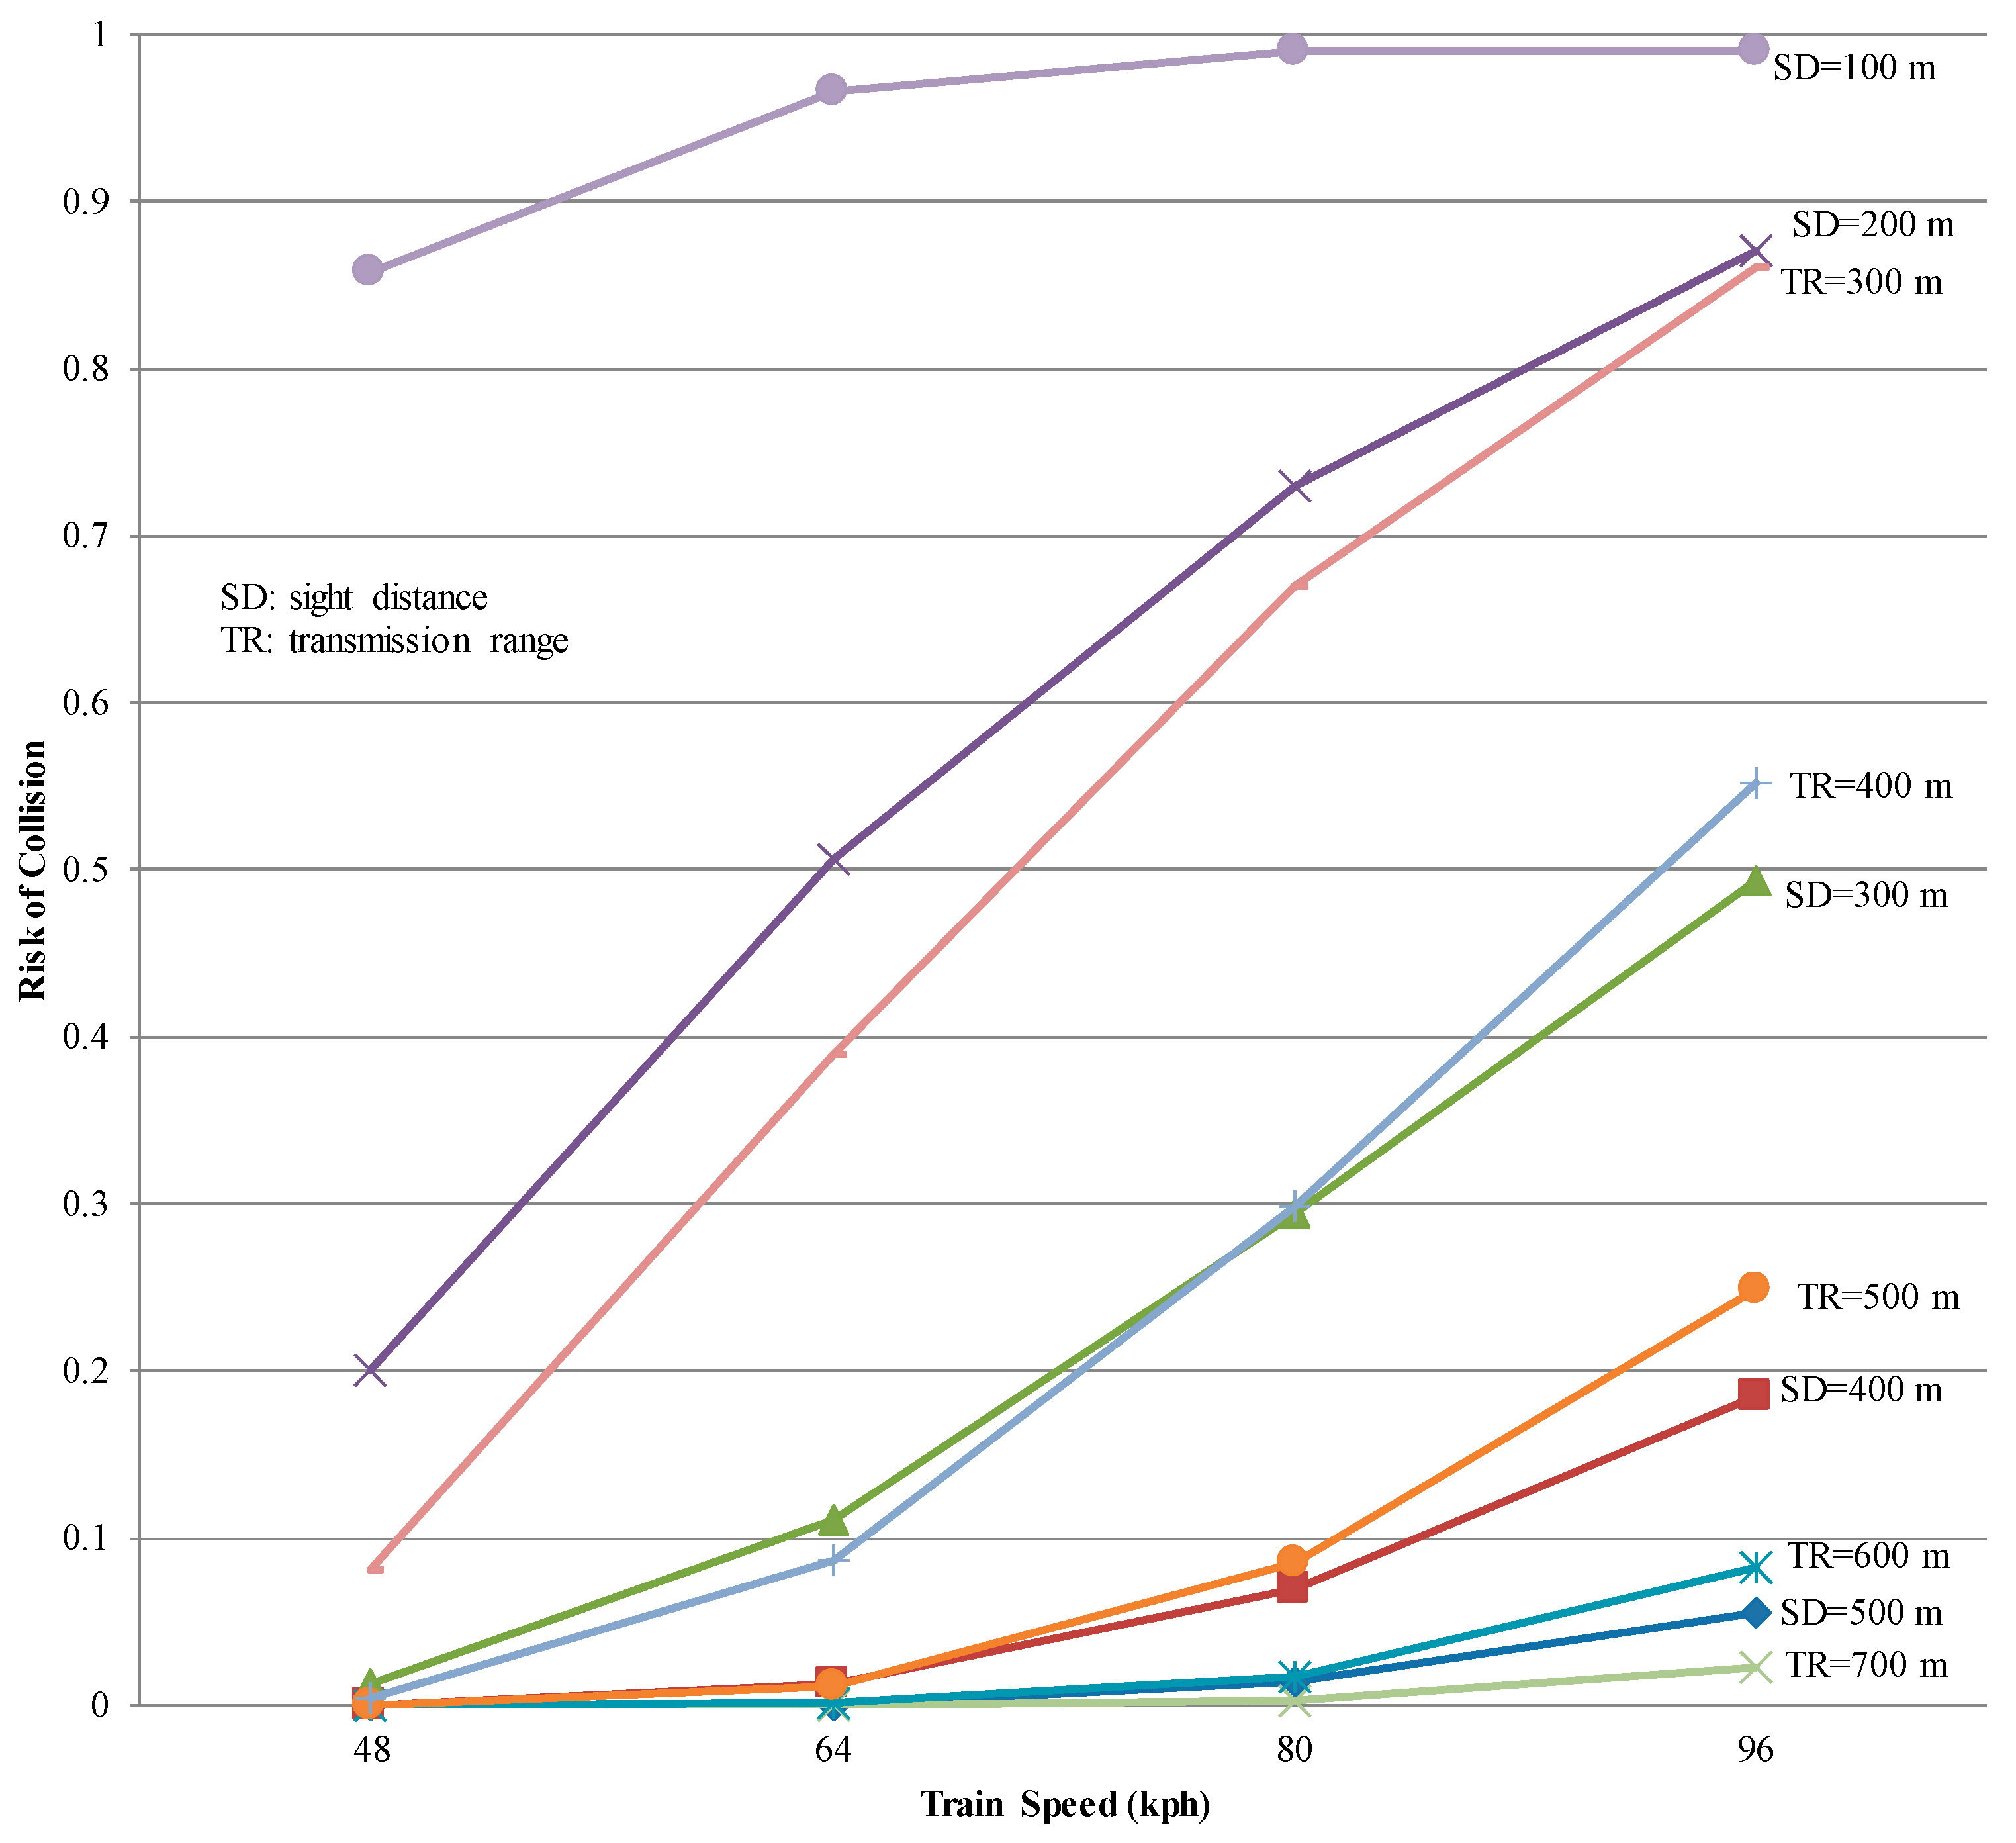
At passive HRGCs, the supply thresholds depend on the train speed, transmission range, sight distance to train, and the angle between the driving direction and vehicle to train direction. The demand function is the same for CV and non-CV drivers, different supply thresholds are used in the calculation of risk of collision. Figure 2 shows the risks of collisions at various train sight distances and transmission ranges at the passive HRGC. Four train speeds—48, 64, 80, and 96 kph (30, 40, 50, and 60 mph)—are used to evaluate the risk of collisions. Sight distances are from 100 m to 500 m at the interval of 100 m, and their corresponding risks decrease with the increase of sight distances. When a train is approaching at 96 kph (60 mph), and a driver’s sight distance is 300 m, the risk of collision is close to 0.5. With the same speed of an approaching train, a driver’s risk can be reduced to less than 0.2 if the sight distance is 400 m. On the other hand, if a driver can only have a sight distance of 100 m, then the risk of collision is higher than 0.8 even the train speed is only 48 kph (30 mph). The risk of collision increases from 0.2 to 0.5 with an increase of train speed from 48 to 64 kph (30 to 40 mph).
The CV’s risks of collision are calculated based on the transmission ranges from 300 to 700 m. It is observed that when the transmission range is 400 m the risk of collision is close to 0.5 with the train speed of 96 kph (60 mph). If a transmission range of 600 m is provided, then the risk of collision drops to less than 0.1 with the same train speed. Although a transmission range of 700 m can further reduce the risk of collision, the scale of reduction is not large (from 0.08 to 0.02). As observed in Figure 2, the risk of collision for a 600 m transmission range is close to that for a 500 m sight distance with the train speed of 96 kph (60 mph). With the provision of a 600 m transmission range, the risk of collision for the CV is lower than that for the non-CV with a 300 m sight distance to the train.
3.2. Active HRGC
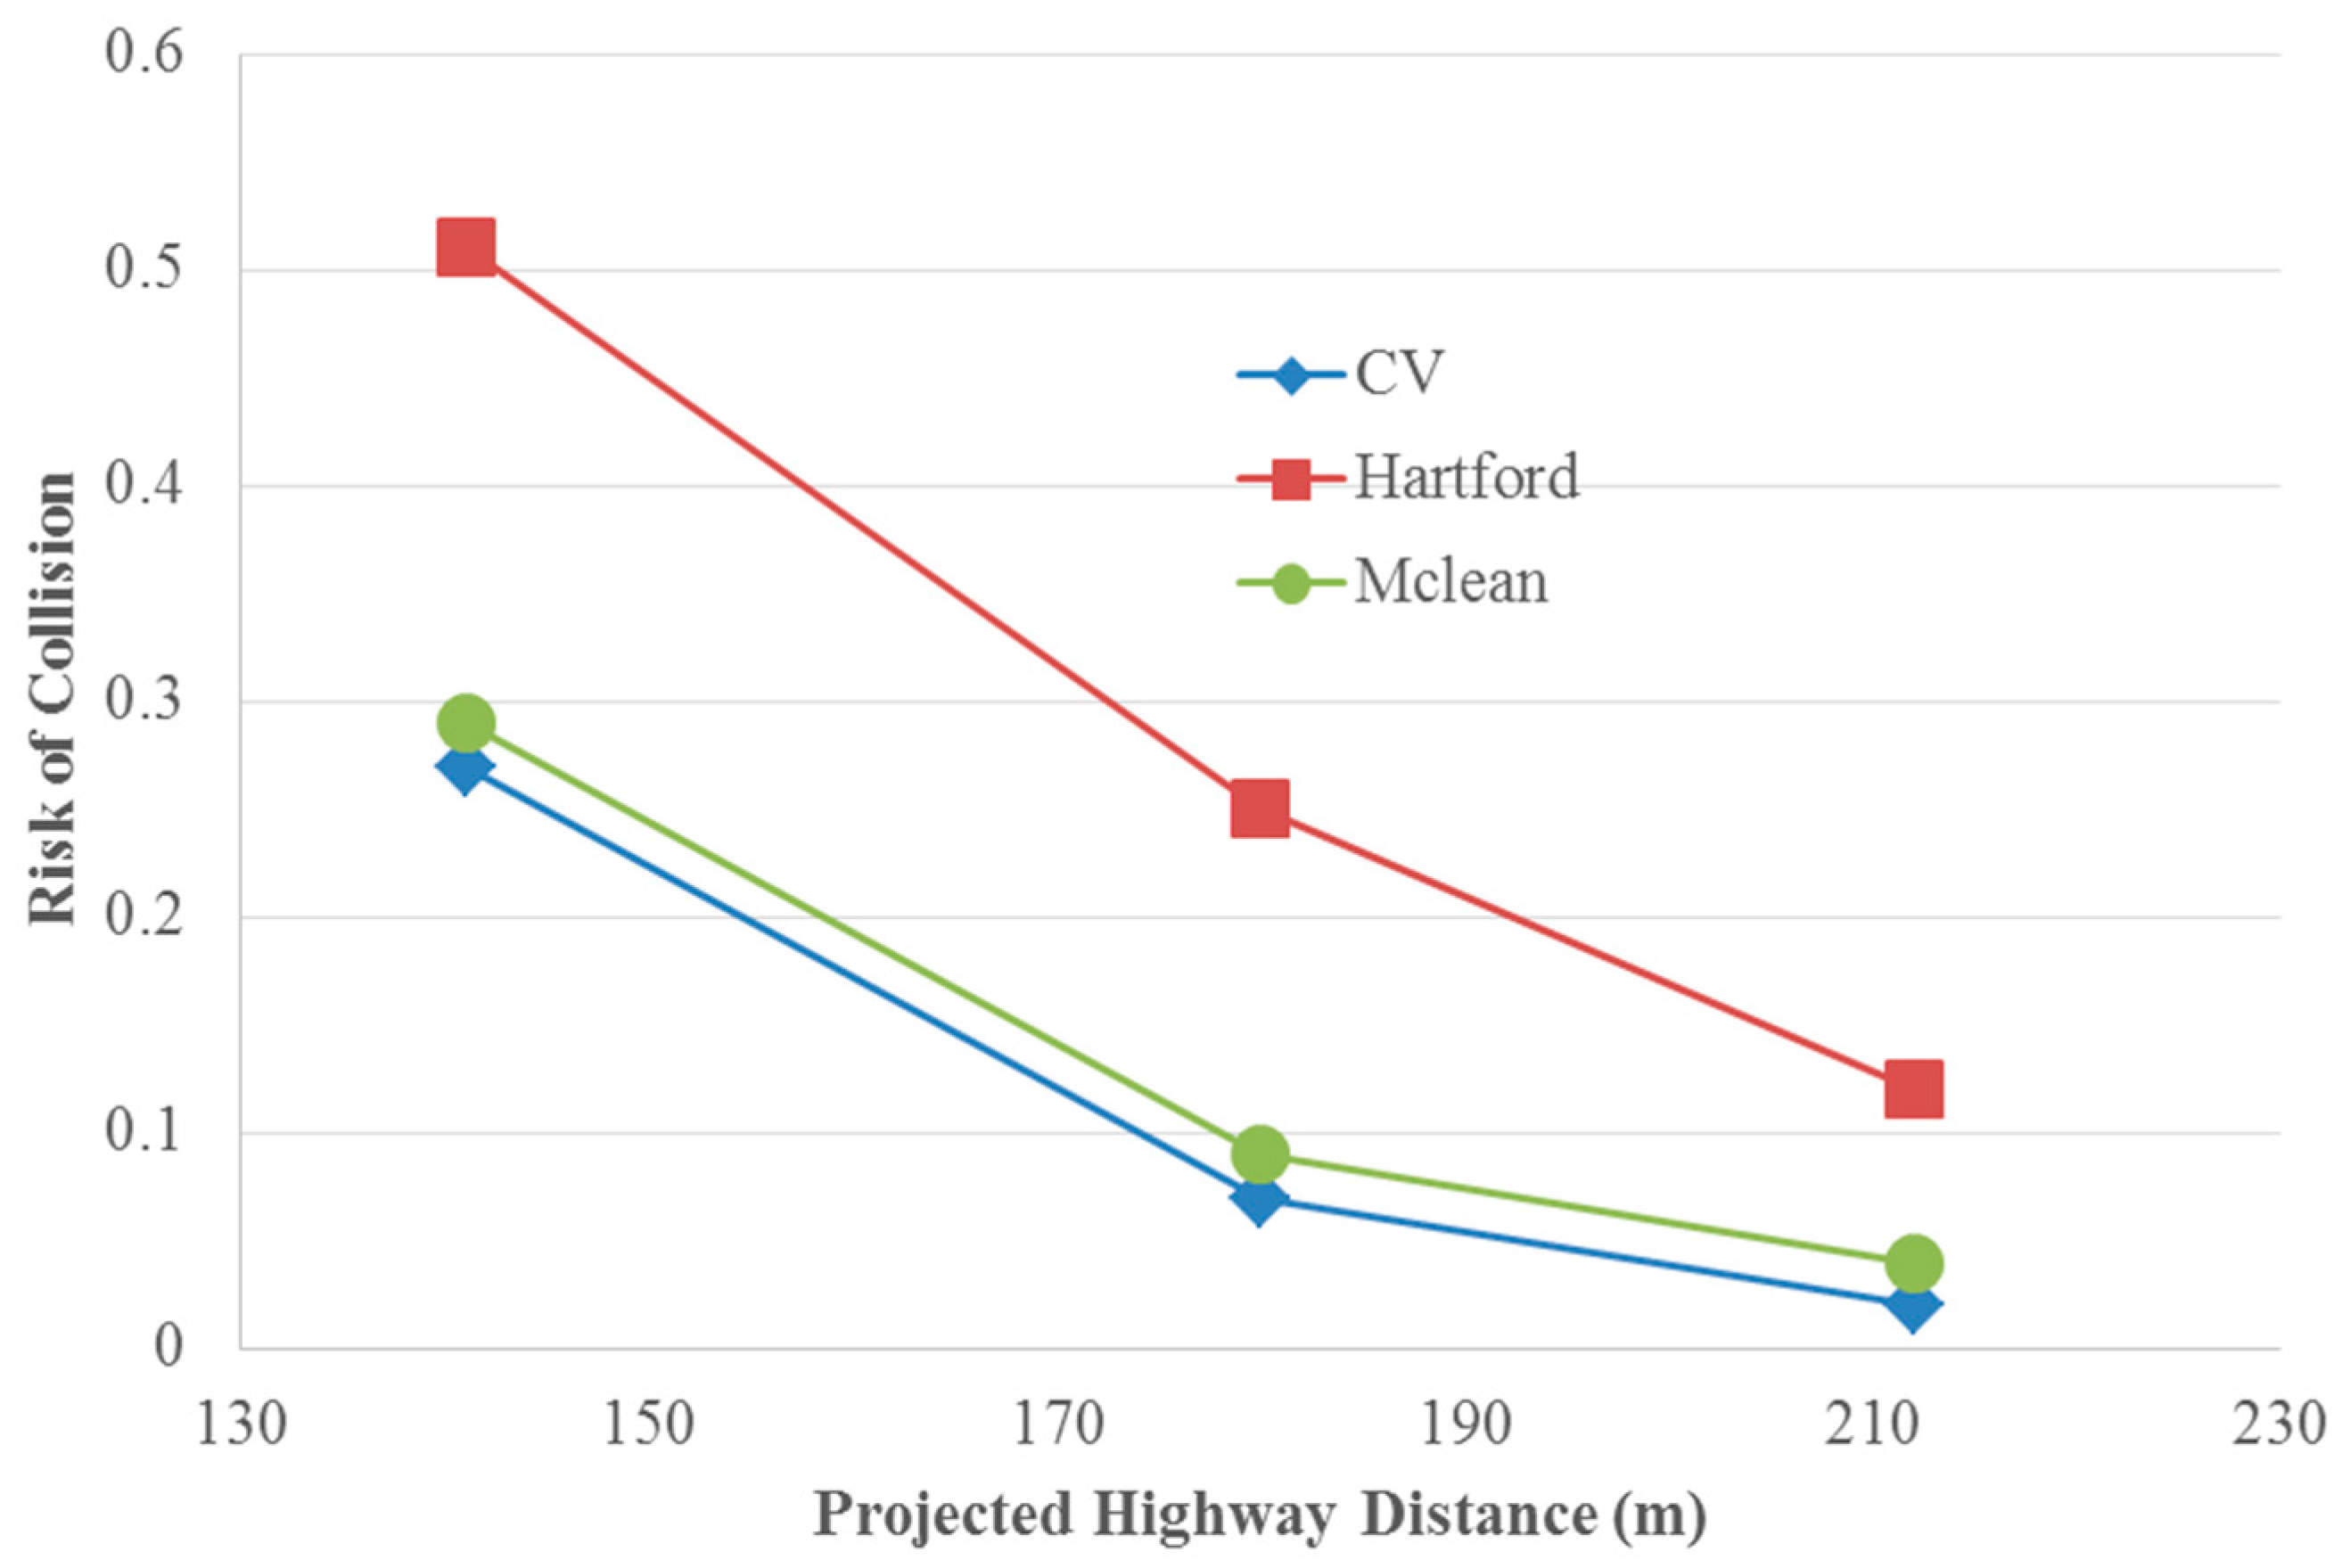
At active HRGCs, the supply thresholds depend on the sight distance to HRGC and transmission range projected on the highway. The demand functions are different for the CV and non-CVs, and three demand functions are used in the calculation of risk of collision. Three supply highway distances (141.4, 176.8, and 212.1 m) are used to compare the risk of collision for the CV and non-CV at active HRGCs as illustrated in Figure 3. The corresponding V2V transmission ranges are 200, 250, and 300 m for each projected highway distance for the CV. The CV’s risk of collision is lower than non-CVs’ at each supply projected highway distance. Given a 300 m transmission range, the CV’s risk of collision is less than 0.1.
4. Discussion
Based on the simulations results at the passive HRGC, if a non-CV driver’s sight distance is 300 m and the transmission range for a CV driver is also 300 m, then the CV driver’s risk of collision is higher than the non-CV driver’s. Under this condition, the transmission range needs to be extended to 600 m so the risk of collision can be lower than that of a 300 m sight distance. Although the SAE’s standard transmission range is 300 m (SAE 2016), an extension to 600 m is viable by increasing the transmission power from 20 dBm (0.1 W) (defined for V2V safety applications) to 33 dBm (1.995 W) at passive HRGCs. For active HRGCs, given a 300 m transmission range is sufficient for an approaching 60 kph (37.5 mph) CV. A train’s OBU can adjust its transmission power according to the type of HRGCs; however, such an adjustment is an extra effort to develop the software function and it increases the complexity of operations as well. In practice, the transmission power of a train’s OBU can be set as 33 dBm constantly for providing a 600 m transmission range at all HRGCs. 33 dBm is the maximum transmission power specified by Federal Communications Commission [28], whether a 600 m transmission range can be provided effectively at this power level depends on the condition of line of sight obstruction at each HRGC. Besides, the OBU’s installation position on a locomotive may also affect the transmission range. Further research is needed to discuss issues of transmission power and OBU installation for maintaining the desirable effective transmission range.
The effective transmission range of V2V communications can be decreased by line of sight obstruction such as buildings, vegetation, etc. However, such a decrease will not cause a complete loss for radiated 5.9 GHz microwaves and can still penetrate or deflect from the obstruction surfaces to reach the receiver. If a 600 m transmission range is decreased to 500 m, the risk of collision is still lower than that of a 300 m sight distance. A 300 m sight distance should require fair weather, no line of sight obstruction, good driver vision, and a conspicuous train to perceive. Such a good combination of conditions may not appear very often for most HRGCs. Considering the low cost ($350 [29]) of OBU installations on trains and vehicle installations may reach 50% in 2021 [11], this safety application is no doubt a cost-effective solution as compared to installations of safety devices or other means for improving rural passive HRGCs with incident occurrences. For active HRGCs, most drivers would stop their vehicles by perceiving the activated gates and flashers, the CV application can still provide additional protection to CV drivers by advising the train arrival time. With the provision of train arrival time, impatient CV drivers should be less likely to drive around the gates if they know the exact arrival time of an approaching train.
Margins of safety have already been considered in the evaluations of risk of collision. The CV’s risk of collision at 600 m transmission range is less than 0.1 as compared to 0.5 of non-CV’s in the passive HRGC. Even in the case of 500 m transmission range, the CV’s risk of collision is 0.25 still much lower than the non-CV’s 0.5. A wide safety margin has been reserved by adopting a 600 m transmission range. Emergency scenarios such as drivers’ late reaction, a train’s warning message loss, or other unexpected factors, may increase the risk of collision; nonetheless, the safety should not be compromised by providing a sufficient margin of safety.
5. Conclusions
With sufficient transmission ranges, the CV application can improve the safety at HRGCs by reducing the risk of collision. The CV’s risk of collision is lower than the non-CV’s when a sufficient transmission range is provided at passive and active HRGCs. The transmission range at passive HRGCs is vital to the prevention of train collisions. A 600 m transmission range is desirable at passive and active HRGCs. With the provision of a 600 m transmission range, the risk of collision for the CV is lower than that for the non-CV with a 300 m sight distance at the passive HRGC. At active HRGCs, given a 300 m transmission range, the risk of collision for the CV is lower than that for the non-CVs. Overall, a 600 m transmission range is feasible to improve the safety at passive and active HRGCs.
Author Contributions
Chung-Jen Hsu and Elizabeth G. Jones conceived and designed the experiments; Chung-Jen Hsu performed the experiments; Chung-Jen Hsu analyzed the data; Elizabeth Jones contributed reagents/materials/analysis tools; Chung-Jen Hsu wrote the paper.
Conflicts of Interest
The authors declare no conflict of interest.
References
- Federal Railroad Administration. Available online: https://www.fra.dot.gov/Page/P0855 (accessed on 16 December 2016).
- Brod, D.; Weisbrod, G.; Moses, S.J.; Gillen, D.B.; Martland, C.D. Comprehensive Costs of Highway-Rail Grade Crossing Crashes; Transportation Research Board: Washington, DC, USA, 2013. [Google Scholar]
- Federal Railroad Administration. Railroad Safety Statistics 2012 Preliminary Annual Report; Department of Transportation: Washington, DC, USA, 2013.
- Saccomanno, F.F.; Park, P.Y.-J.; Fu, L. Estimating countermeasure effects for reducing collisions at highway–railway grade crossings. Accid. Anal. Prev. 2007, 39, 406–416. [Google Scholar] [CrossRef] [PubMed]
- Meeker, F.; Fox, D.; Weber, C. A Comparison of Driver Behavior at Railroad Grade Crossings with Two Different Protection Systems. Accid. Anal. Prev. 1997, 29, 11–16. [Google Scholar] [CrossRef]
- Khattak, A.; McKnight, G. Gate rushing at highway-railroad grade crossings: Drivers’ response to a centerline barrier. Transp. Res. Rec. 2008, 2056, 104–109. [Google Scholar] [CrossRef]
- Russell, E.R.; Shah, H.D.; Rys, M.J. Study of Drivers’ Behavior at Passive Railroad-Highway Grade Crossings; Mack-Blackwell Transportation Center: Fayetteville, AR, USA, 2007. [Google Scholar]
- Tey, L.-S.; Ferreira, L.; Wallace, A. Measuring driver responses at railway level crossings. Accid. Anal. Prev. 2011, 43, 2134–2141. [Google Scholar] [CrossRef] [PubMed]
- Kasalica, S.; Vukadinović, R.; Lučanin, V. Study of Drivers’ Behaviour at a Passive Railway Crossing. Promet—Traffic Transp. 2012, 24, 193–201. [Google Scholar] [CrossRef]
- Rudin-Brow, C.M.; George, M.F.; Stuart, J.J. Human Factors Issues of Accidents at Passively Controlled Rural Level Crossings. Transp. Res. Rec. 2014, 2458, 96–103. [Google Scholar] [CrossRef]
- National Highway Traffic Safety Administration. Available online: https://www.federalregister.gov/documents/2017/01/12/2016-31059/federal-motor-vehicle-safety-standards-v2v-communications (accessed on 20 January 2017).
- Hartong, M.; Goel, R.; Farkas, C; Wijesekera, D. PTC-VANET Interactions to Prevent Highway Rail Intersection Crossing Accidents. In Proceedings of the IEEE 65th Vehicular Technology Conference, Dublin, Ireland, 22–25 April 2007; pp. 2550–2554. [Google Scholar]
- Bezzina, D.; Sayer, J. Safety Pilot Model Deployment: Test Conductor Team Report; Rep. No. DOT HS 812 171; National Highway Traffic Safety Administration: Washington, DC, USA, 2015.
- Faber, M.H.; Stewart, M.G. Risk Assessment for Civil Engineering Facilities: Critical Overview and Discussion. Reliab. Eng. Syst. Saf. 2003, 80, 173–184. [Google Scholar] [CrossRef]
- On-board Systems Requirements for V2V Safety Communications; Surface Vehicle Standard J2945/1; SAE International: Warrendale, PA, USA, 2016.
- Ang, A.H.S.; Tang, W.H. Probability Concepts in Engineering Planning and Design; John Wiley: New York, NY, USA, 1975; Volume 1. [Google Scholar]
- Ellingwood, B.; Galambos, T; MacGregor, J.; Cornell, C. Development of a Probability Based Load Criterion for American National Standard; US Department of Commerce: Washington, DC, USA, 1980.
- Mordechai, S. Applications of Monte Carlo Method in Science and Engineering; InTech: Rijeka, Croatia, 2011. Available online: http://www.intechopen.com/books/applications-of-monte-carlo-method-in-science-and-engineering (accessed on 5 January 2016).
- Metropolis, N.; Ulam, S. The Monte Carlo method. J. Am. Stat. Assoc. 1949, 44, 335–341. [Google Scholar] [CrossRef] [PubMed]
- 49 CFR 234.225—Activation of warning system; Federal Railroad Administration: Washington, DC, USA, 1998.
- American Association of State Highway and Transportation Officials. A Policy on Geometric Design of Highways and Streets; AASHTO: Washington, DC, USA, 2011. [Google Scholar]
- Tey, L.-S.; Wallis, G.; Cloete, S.; Ferreira, L. Modelling driver behaviour towards innovative warning devices at railway level crossings. Accid. Anal. Prev. 2013, 51, 104–111. [Google Scholar] [CrossRef] [PubMed]
- Moon, Y.J.; Coleman, F. Highway-Rail Quad Gate Operation Time by System Simulation of Dynamic Dilemma Zone. J. Trans. Eng. 2003, 129, 253–261. [Google Scholar] [CrossRef]
- Hsu, C.-J.; Jones, E.G. Sensitivity analyses of stopping distance for connected vehicles at active highway-rail grade crossings. Accid. Anal. Prev. 2017, 99, 210–217. [Google Scholar] [CrossRef] [PubMed]
- Behnood, A.; Mannering, F.L. The temporal stability of factors affecting driver injury severities in single-vehicle crashes: Some empirical evidence. Anal. Methods Accid. Res. 2015, 8, 7–32. [Google Scholar] [CrossRef]
- Behnood, A.; Mannering, F. An empirical assessment of the effects of economic recessions on pedestrian-injury crashes using mixed and latent-class models. Anal. Methods Accid. Res. 2016, 12, 1–17. [Google Scholar] [CrossRef]
- Mannering, F.L.; Shankar, V.; Bhat, C.R. Unobserved heterogeneity and the statistical analysis of Highway accident data. Anal. Methods Accid. Res. 2016, 11, 1–16. [Google Scholar] [CrossRef]
- Amendment of the Commission’s Rules Regarding Dedicated Short-Range Communication Services in the 5.850-5.925 GHz Band; Federal Communications Commission: Washington, DC, USA, 2006.
- Harding, J.; Powell, G.R.; Yoon, R.; Fikentscher, J.; Doyle, C.; Sade, D.; Lukuc, M.; Simons, J.; Wang, J. Vehicle-to-Vehicle Communications: Readiness of V2V Technology for Application; Rep. No. DOT HS 812 014; National Highway Traffic Safety Administration: Washington, DC, USA, 2014.
Figure 1.
Transmission range for CVs and sight distance for non-CVs.
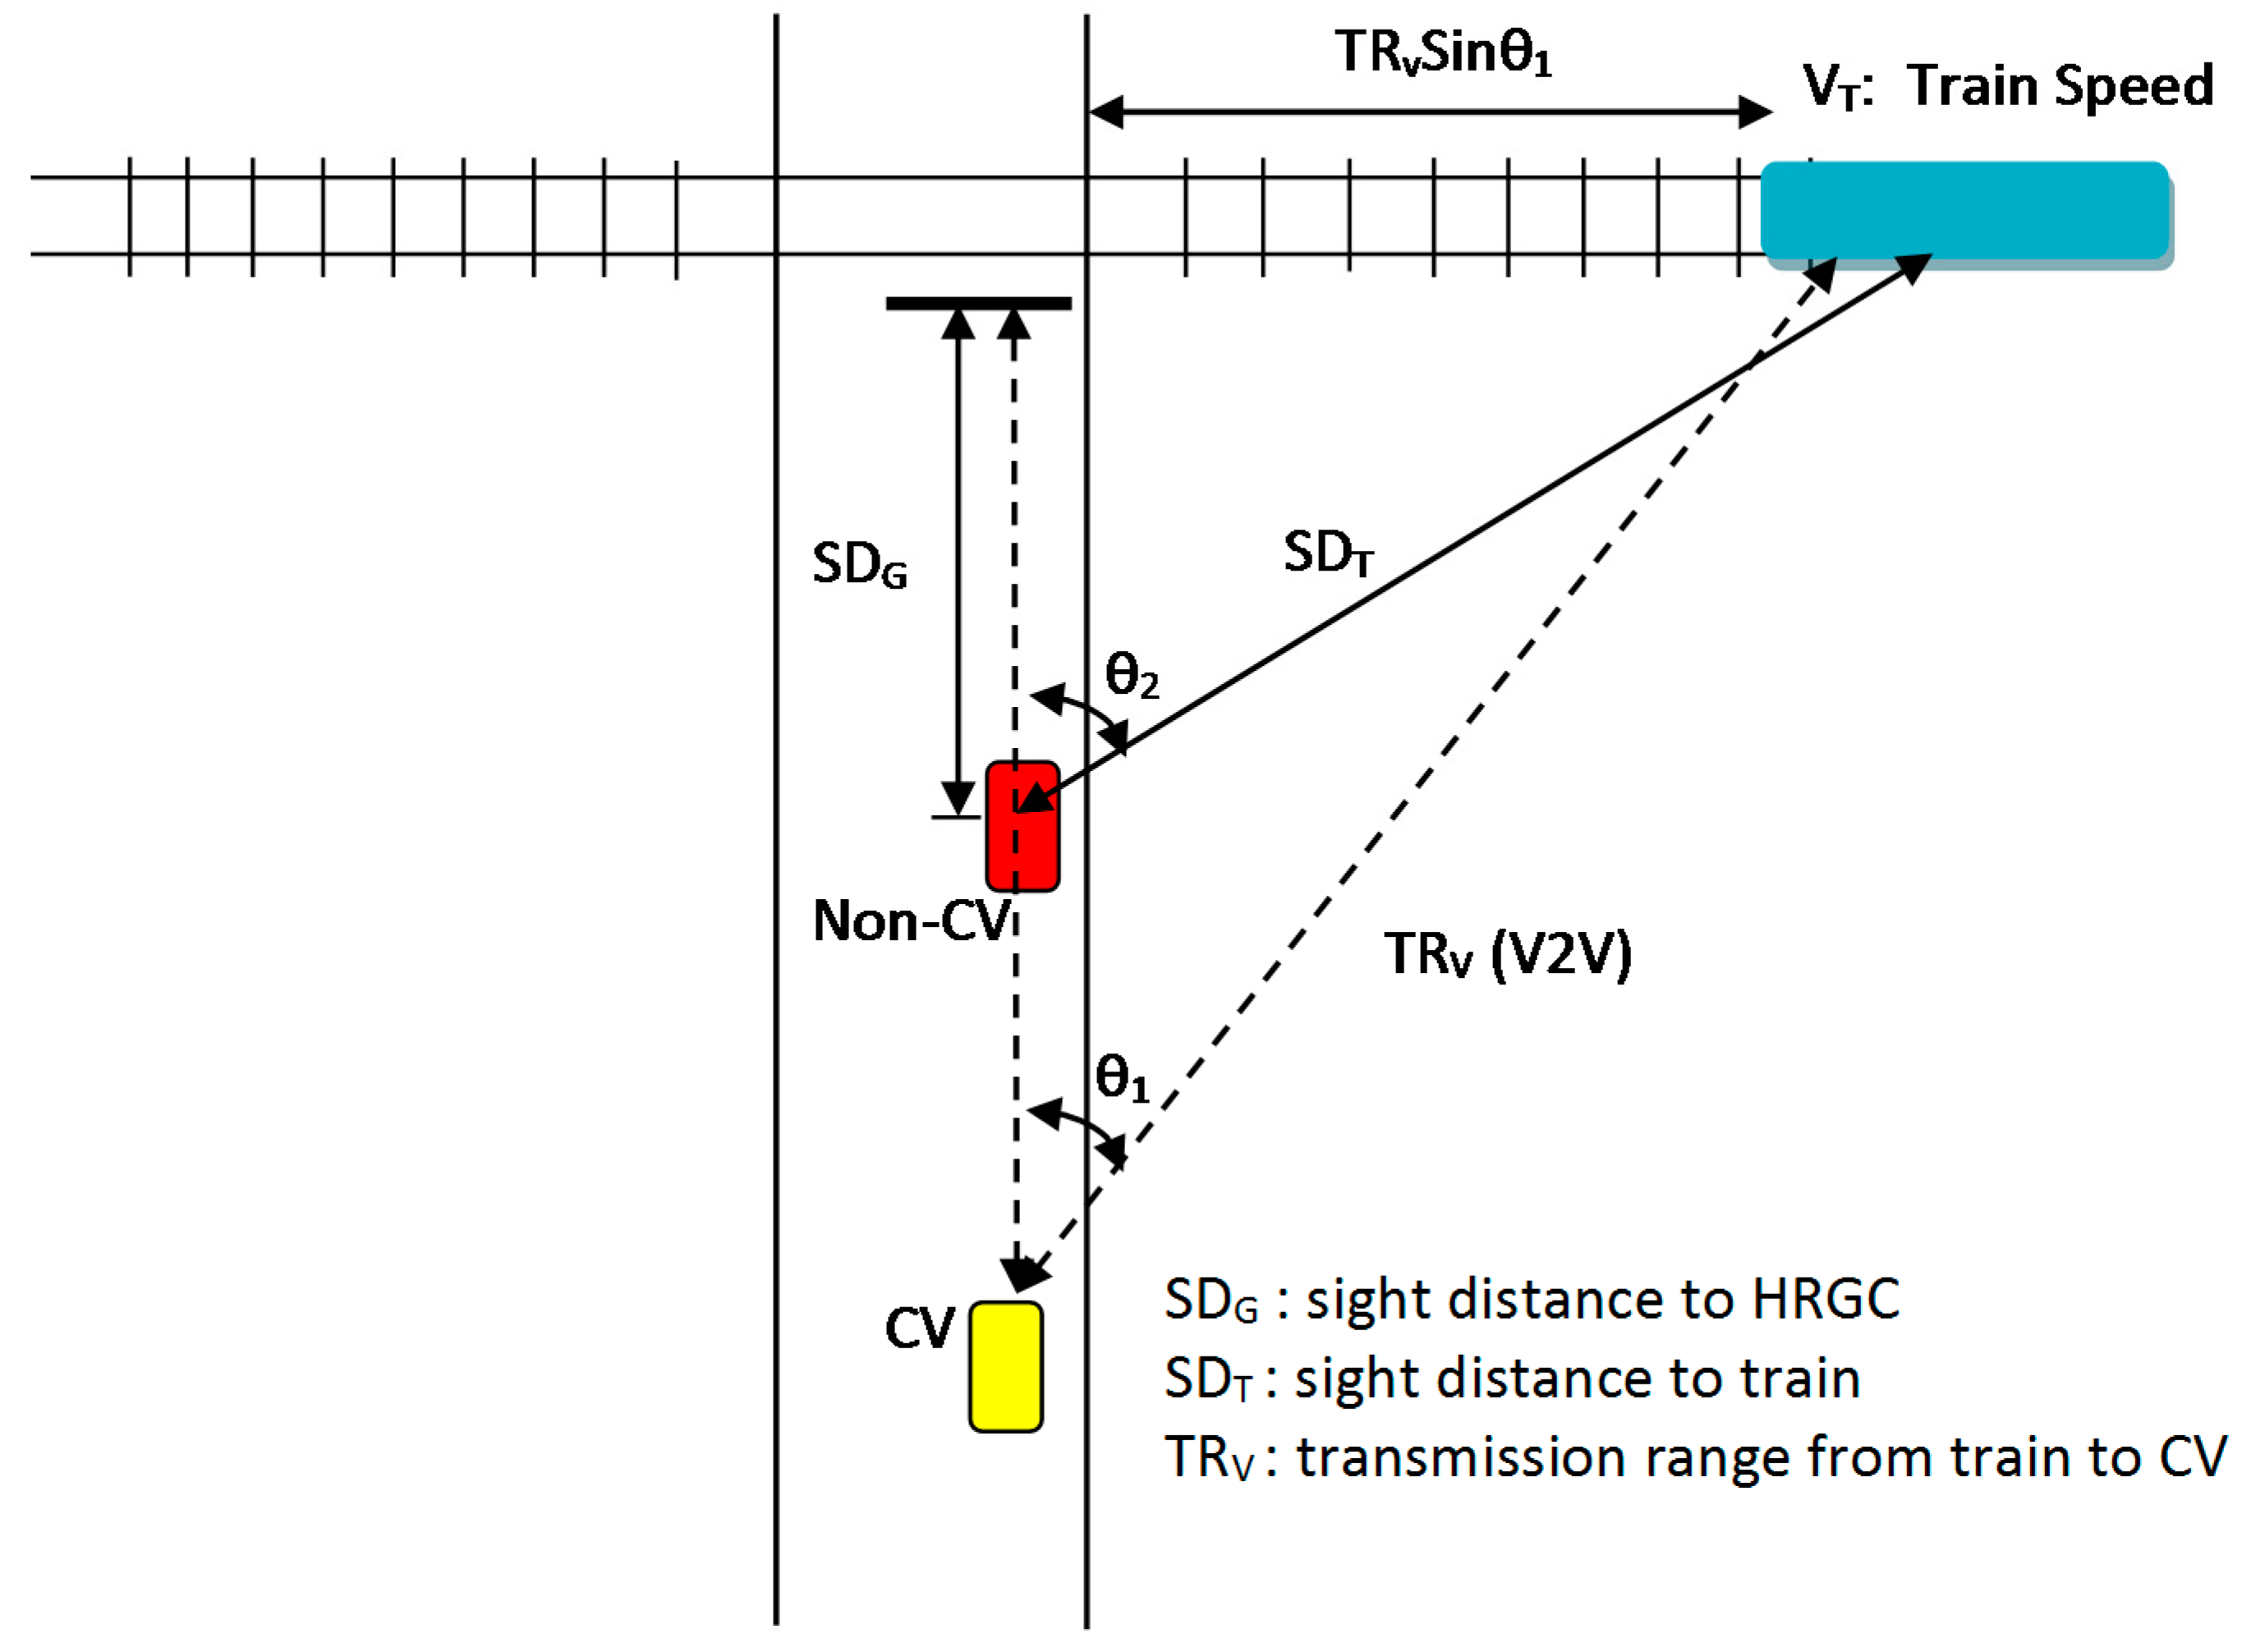
Figure 2.
Risk of collision at the passive HRGC.

Figure 3.
Risk of collision at active HRGCs.

Table 1.
Supply Variables.
| HRGC | Vehicle | Sight/Transmission Distance * | Train Arrival Time | Highway Distance | Supply Threshold |
|---|---|---|---|---|---|
| Active | CV | TR | ≥20 s | TR Cosθ1 | TR Cosθ1 |
| Active | Non-CV | SDG | ≥20 s | SDG | SDG |
| Passive | CV | TR | TR Sinθ1/VT | TR Cosθ1 | TR Sinθ1/VT |
| Passive | Non-CV | SDT | SDT Sinθ2/VT | SDT Cosθ2 | SDT Sinθ2/VT |
* All the variables are defined in Figure 1.
Table 2.
PDFs of Stochastic Variables in the Demand Function
| Vehicle | Non-CV | Non-CV | Non-CV | CV | |
|---|---|---|---|---|---|
| Site | McLean | Hartford | Simulator | Simulator | |
| Warning Device | Active | Active | Passive | Onboard | |
| (mean, standard deviation) | (mean, standard deviation) | (mean, standard deviation) | (mean, standard deviation) | ||
| Reaction Time (s) | Normal | (3.13, 1.59) | (3.13, 1.59) | (3.22, 1.69) | (3.21, 1.35) |
| Initial Speed (m/s) | Normal | (17.24, 1.9) | (18.92, 2.1) | (16.5, 1.6) | (16.5, 1.6) |
| Initial Brake (m/s2) | Log-normal | (0.51, 0.27) | (0.63, 0.39) | (0.73, 0.43) | (0.57, 0.33) |
| Final Speed (m/s) | Normal | (14.2, 1.42) | (16.85, 1.85) | (12.32, 1.47) | (10.02, 1.2) |
| Final Brake (m/s2) | Log-normal | (1.19, 0.56) | (0.85, 0.47) | (1.64, 0.56) | (1.02, 0.52) |
© 2017 by the authors. Licensee MDPI, Basel, Switzerland. This article is an open access article distributed under the terms and conditions of the Creative Commons Attribution (CC BY) license (http://creativecommons.org/licenses/by/4.0/).
Share and Cite
MDPI and ACS Style
Hsu, C.-J.; Jones, E.G. Transmission Range Evaluations for Connected Vehicles at Highway-Rail Grade Crossings. Designs 2017, 1, 2. https://doi.org/10.3390/designs1010002
AMA Style
Hsu C-J, Jones EG. Transmission Range Evaluations for Connected Vehicles at Highway-Rail Grade Crossings. Designs. 2017; 1(1):2. https://doi.org/10.3390/designs1010002
Chicago/Turabian StyleHsu, Chung-Jen, and Elizabeth G. Jones. 2017. "Transmission Range Evaluations for Connected Vehicles at Highway-Rail Grade Crossings" Designs 1, no. 1: 2. https://doi.org/10.3390/designs1010002