The Design of Net-Zero-Energy Affordable Housing in Philadelphia


Jefferson-East Falls Campus, Thomas Jefferson University, Philadelphia, PA 19144, USA
*
Author to whom correspondence should be addressed.
Designs 2018, 2(3), 26; https://doi.org/10.3390/designs2030026
Submission received: 10 June 2018
/
Revised: 28 June 2018
/
Accepted: 17 July 2018
/
Published: 23 July 2018
(This article belongs to the Special Issue Integrated Sustainable Building Design, Construction and Operation)
Abstract
:Sustainable buildings are often considered expensive alternatives to conventional designs. However, a decline in costs associated with materials, technology, labor and whole building approaches make green homes realistic to construct even within low-income neighborhoods. This can address the critical shortage of affordable housing in cities, and the emerging recognition of their impact on healthy communities. This study proposes an affordable and energy-efficient design for a low-income rowhouse in Philadelphia as a city having the highest poverty rate in the U.S. The design can be replicated as an investment in the future where people live with net zero energy and zero emissions. Furthermore, residents have the opportunity to create a more vibrant and healthy neighborhood economy by investing their savings locally. The results showed that the proposed prototype has a payback of approximately just over 16 years. Although this seems long, the building is affordable since the ongoing operating expenses are significantly less than a typical house. This is achieved by the combination of an efficient building design, onsite power generation, water conservation and rainwater harvesting. The payback period may suggest that larger-scale projects than just a single urban residence (two residences and larger) are needed to improve investment paybacks. This is discussed. Considering the added benefits (energy and water) that will continue after the payback period, the design can be a pioneer for low-income neighborhoods.
1. Introduction
Residences in the U.S. are responsible for $160 billion worth of energy consumption for heating, cooling and lighting each year, totaling 20% of total U.S. energy consumption [1]. Additionally, there is a critical shortage in affordable housing, especially among the most populous U.S. cities, as housing demand outpaces supply, leading to rising prices. The notion that green homes can be a solution to the energy, emissions and affordability issues is an attempt to tackle multiple problems with one solution, but becomes difficult when quality, durability and sustainability targets must be met while being affordable for homeowners [2]. A home is said to be affordable when no more than 30% of a household’s annual income is spent on housing [3], but this often sets the budget too low to afford energy-efficient upgrades and technologies, like photovoltaics (PV). With the Environmental Protection Agency (EPA) encouraging local governments to promote energy efficiency in their jurisdictions through improvements in residential units [4], it may be possible to bring new energy-efficient residences closer to the 30% affordability mark using strategies like considering energy efficiency at the beginning of the design process rather than as an “alternate add” to be value-engineered later. This can be done to generate triple-bottom-line (TBL) benefits for the local community. However, we argue that the TBL is not enough because it ignores subjective criteria that are essential for the success of any type of project, but perhaps more so for projects for those living below the poverty line whose experience of homes are not personally restorative nor necessarily sources of personal and community pride. Subjective characteristics (feelings of safety, beauty, color, views, etc.), however, increase the sense of place, investment and architectural character and lead to places and communities that thrive as they are sustained as people are more likely to care for and invest in them. Instead of a TBL approach, we argue for an approach based on Integral Sustainable Design and test its ability to provide integral, sustainable and affordable projects.
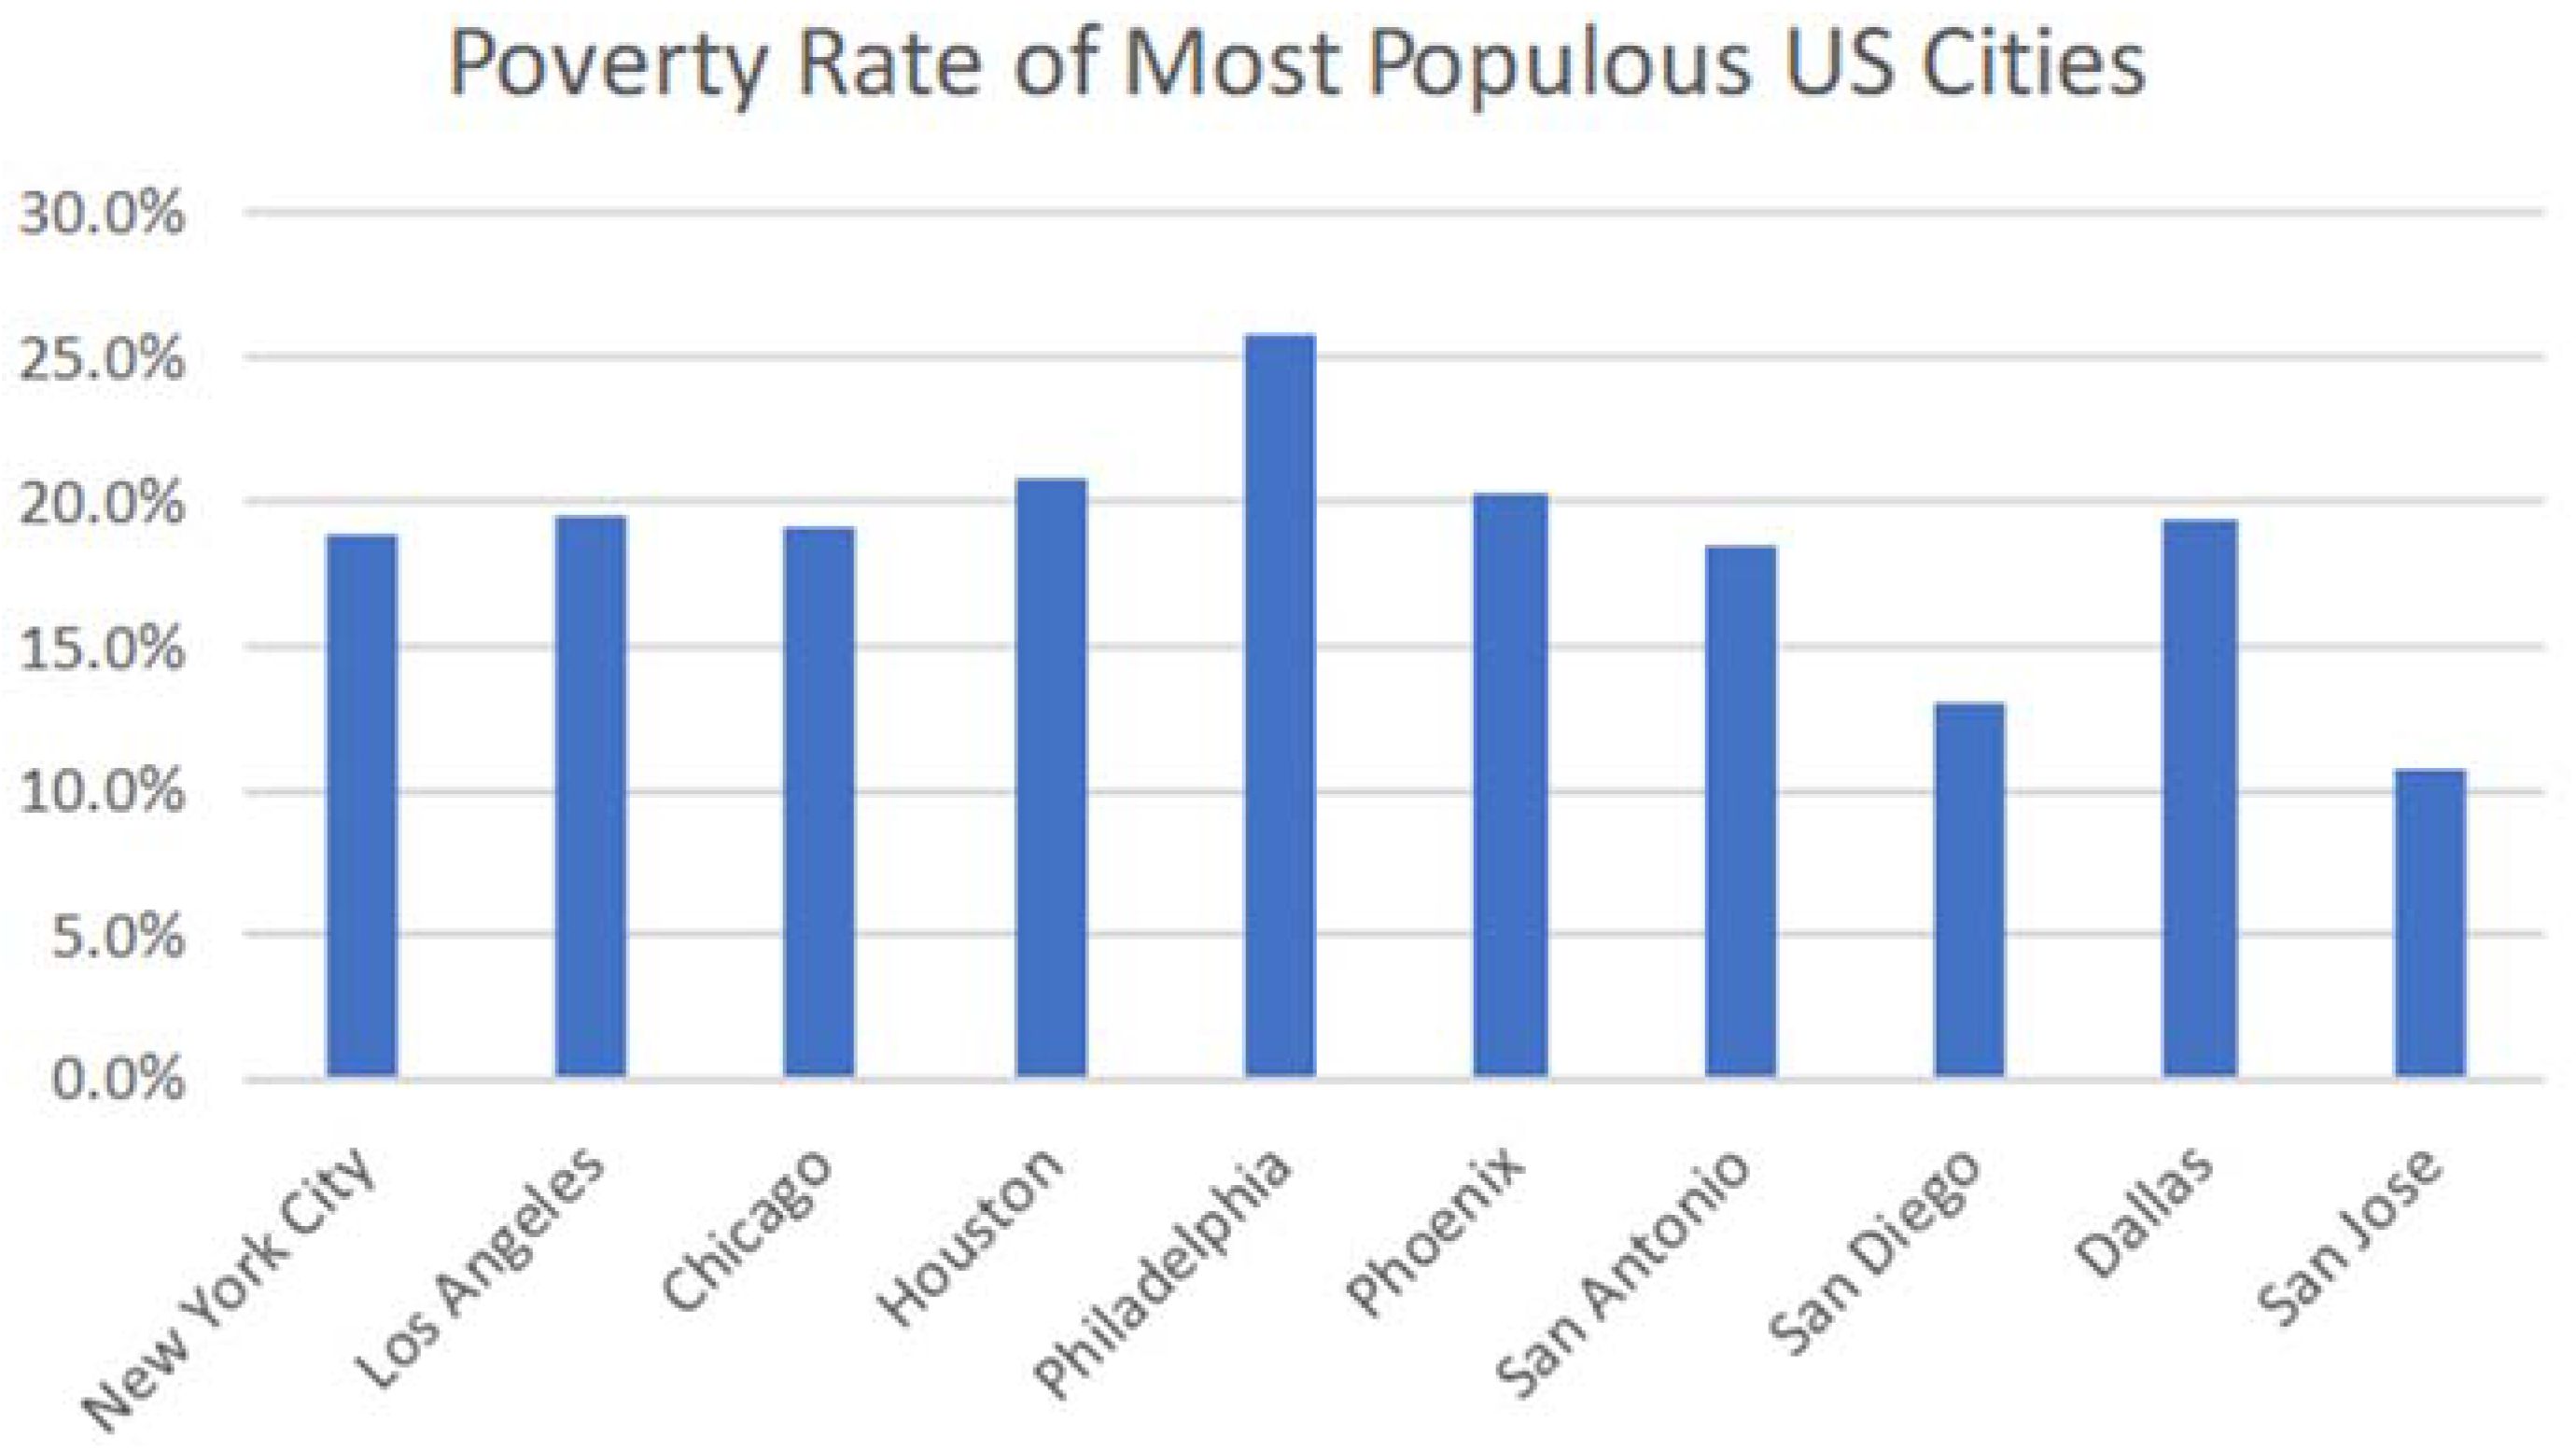
Affordable energy-efficient houses have many benefits, such as reducing greenhouse gas emissions, decreasing pollution, improving air quality and thermal comfort, and conserving resources. Reduced energy costs are added benefits to ensure affordable housing budget targets are met. According to the EPA, an Energy Star home can reduce its energy use up to 30% or $600 per year on average [5]. However, as mentioned above, there are additional experiential and social benefits that are often not achieved in other affordable projects that pursue the TBL. To actualize these economic, environmental and social benefits, major cities need a new holistic prototypical integral sustainable home design to promote affordable energy-efficient housing in low-income neighborhoods. This study proposes and tests the new approach to affordable and energy-efficient design for a low-income rowhouse in Philadelphia, which has the highest poverty rates among the 10 largest cities in the U.S. [6] (see Figure 1). The design aims to be replicated as an investment in the future where people live in a sustainable and efficient home with net zero energy and zero emissions. The value proposition for this home is more than energy efficiency and a small payback period, but rather the technological, energy and social resilience the project aims to add to a typical affordable home by providing choice and redundancy: how to spend money in the community to further one’s values using funds saved from installing technology; to remain with power while others are blacked out due to storms; and the back-up provided by the ability to purchase electricity from the grid in the event the onsite generation does not provide enough. The methodology includes the proposed low-income green housing design in Philadelphia accompanied by guiding principles and green goals. The research approach consists of design development with certain restrictions in terms of location, use, sustainability goals and cost. Then, the proposed design is analyzed and compared to a baseline case. In each step of the comparison, the proposed design is improved to make it more sustainable, especially in terms of energy use. Life-cycle assessment (LCA) and cost analysis were performed in the proposed model to evaluate building assemblies, as well as affordability of this design in the low-income neighborhood. The scope of this study is limited to high-performance residential design in terms of energy efficiency and affordability.
2. Background
Affordable energy-efficient houses are where green-building benefits and affordable housing goals intersect in the literature. Though ‘green’ is not directly understood by many home owners, long-term durability, a healthier living environment, and reduced energy costs make green houses attractive [7]. According to a survey by Building Design and Construction White Paper, 82% of home seekers value energy efficiency the most, which causes builders to improve insulations, windows, doors, Heating, Ventilation and Air Conditioning (HVAC) systems, and appliances in residences [8]. With the improved systems, the cost of housing construction has increased, and affordable housing has gained substantial importance.
The benefits of green housing were apparent for low-income residents, as energy-efficient products and properly insulated homes decrease utility costs [9]. There is an additional positive impact of green housing for especially low-income and minority residents, who live in neighborhoods with higher rates of asthma and environmental health hazards [10]. That is, improved health and occupant comfort benefits, which provide cleaner air and decrease asthma and similar conditions [11].
Concerns related to green housing were mentioned as having higher first costs compared to conventional affordable housing. It was also mentioned that higher initial capital costs can demotivate developers to invest in green construction, as green rating systems, as well as house seekers, look for low initial investments [12]. This explains the shortage of affordable housing especially in metropolitan cities like Philadelphia. This study and the proposed design is created to address this critical shortage of affordable housing in cities, while focusing on the emerging recognition of their impact on healthy communities.
3. The Proposed Low-Income Housing Design
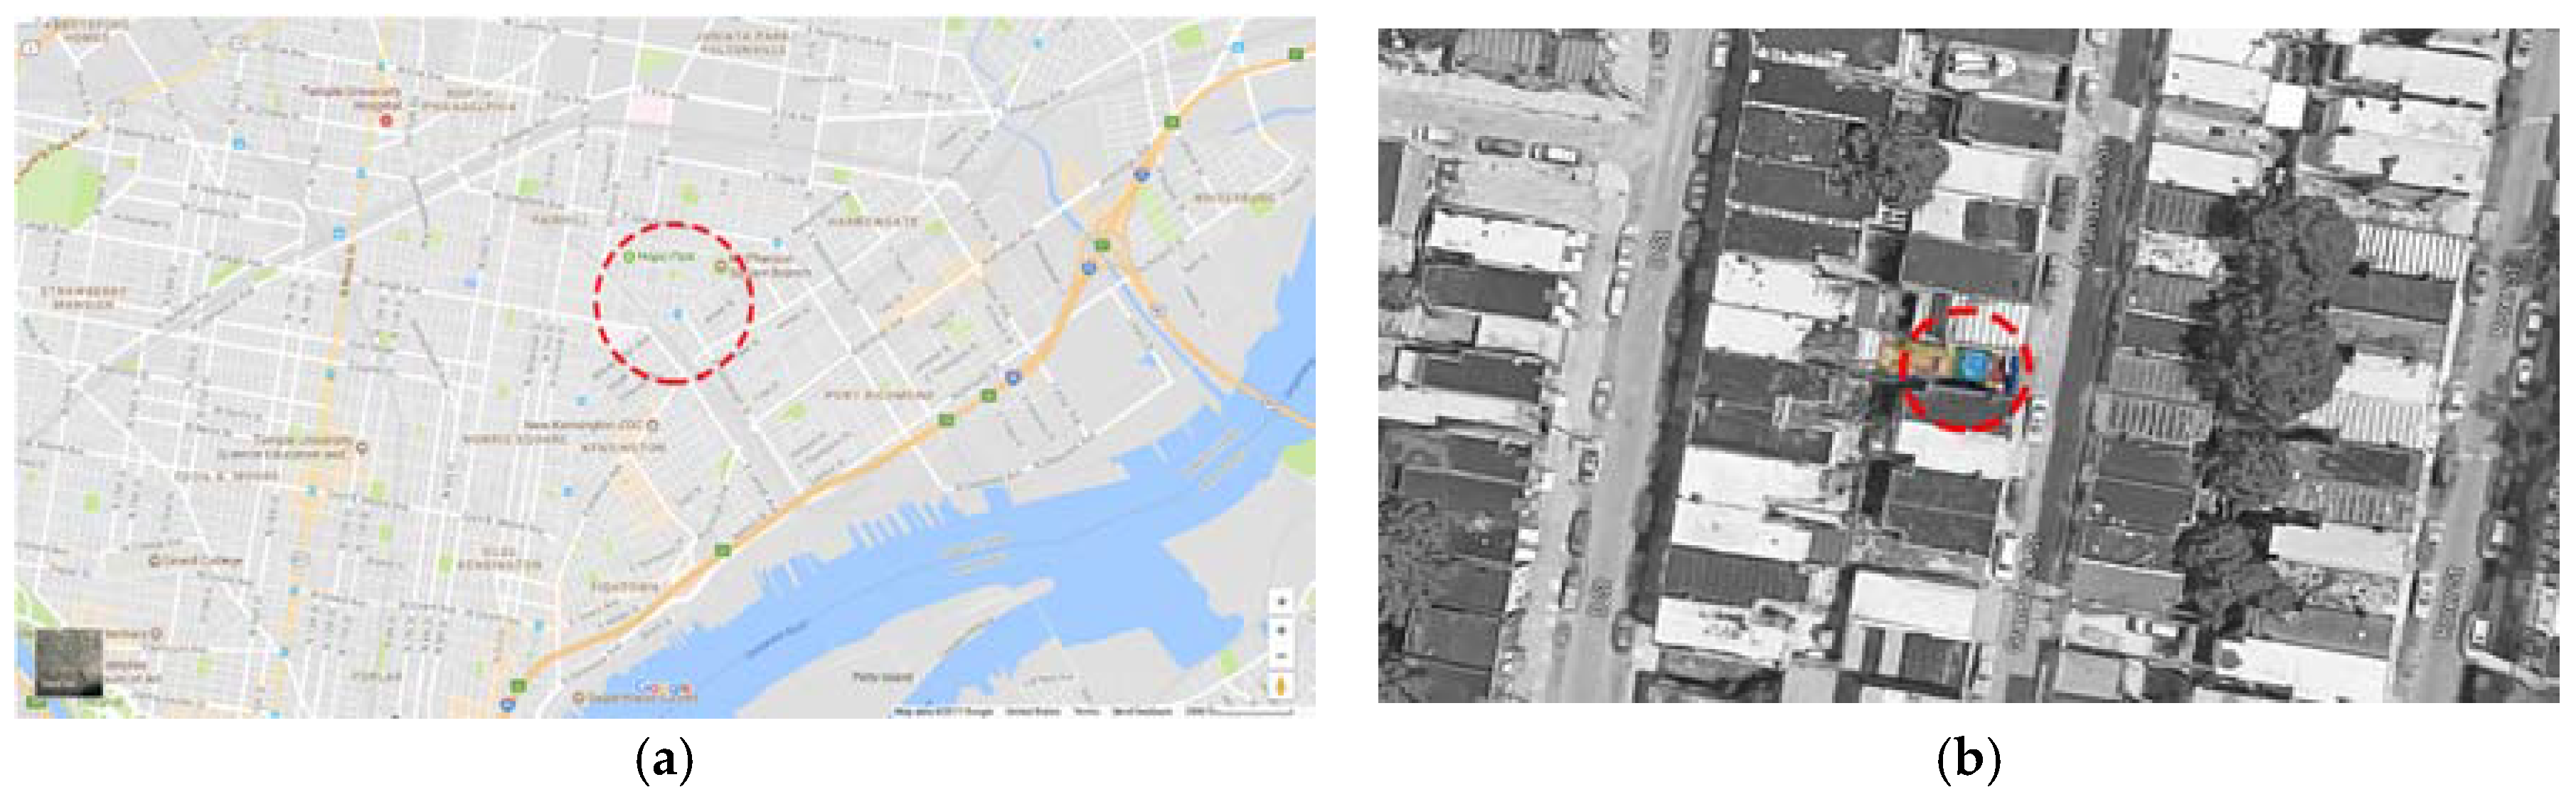
This research proposes creating a residence using the formal precedent of a rowhouse to integrate with the site context and the existing and historic residential architecture of Philadelphia. The site (Figure 2) was selected in the North Kensington neighborhood, since it is among the poorest neighborhoods where 68.6% of the population lives below the poverty line [13]. A design imperative for the project is to create an integral sustainable design, and so the project was driven by an adaptation of DeKay’s Integral Sustainable Design Framework [14]. To start the design process, guiding principles were created using four quadrants to establish a direction and focus for design decisions enabling the most integral, holistic design results (see Table 1). Considering the location, the main goals are as given in Table 2.
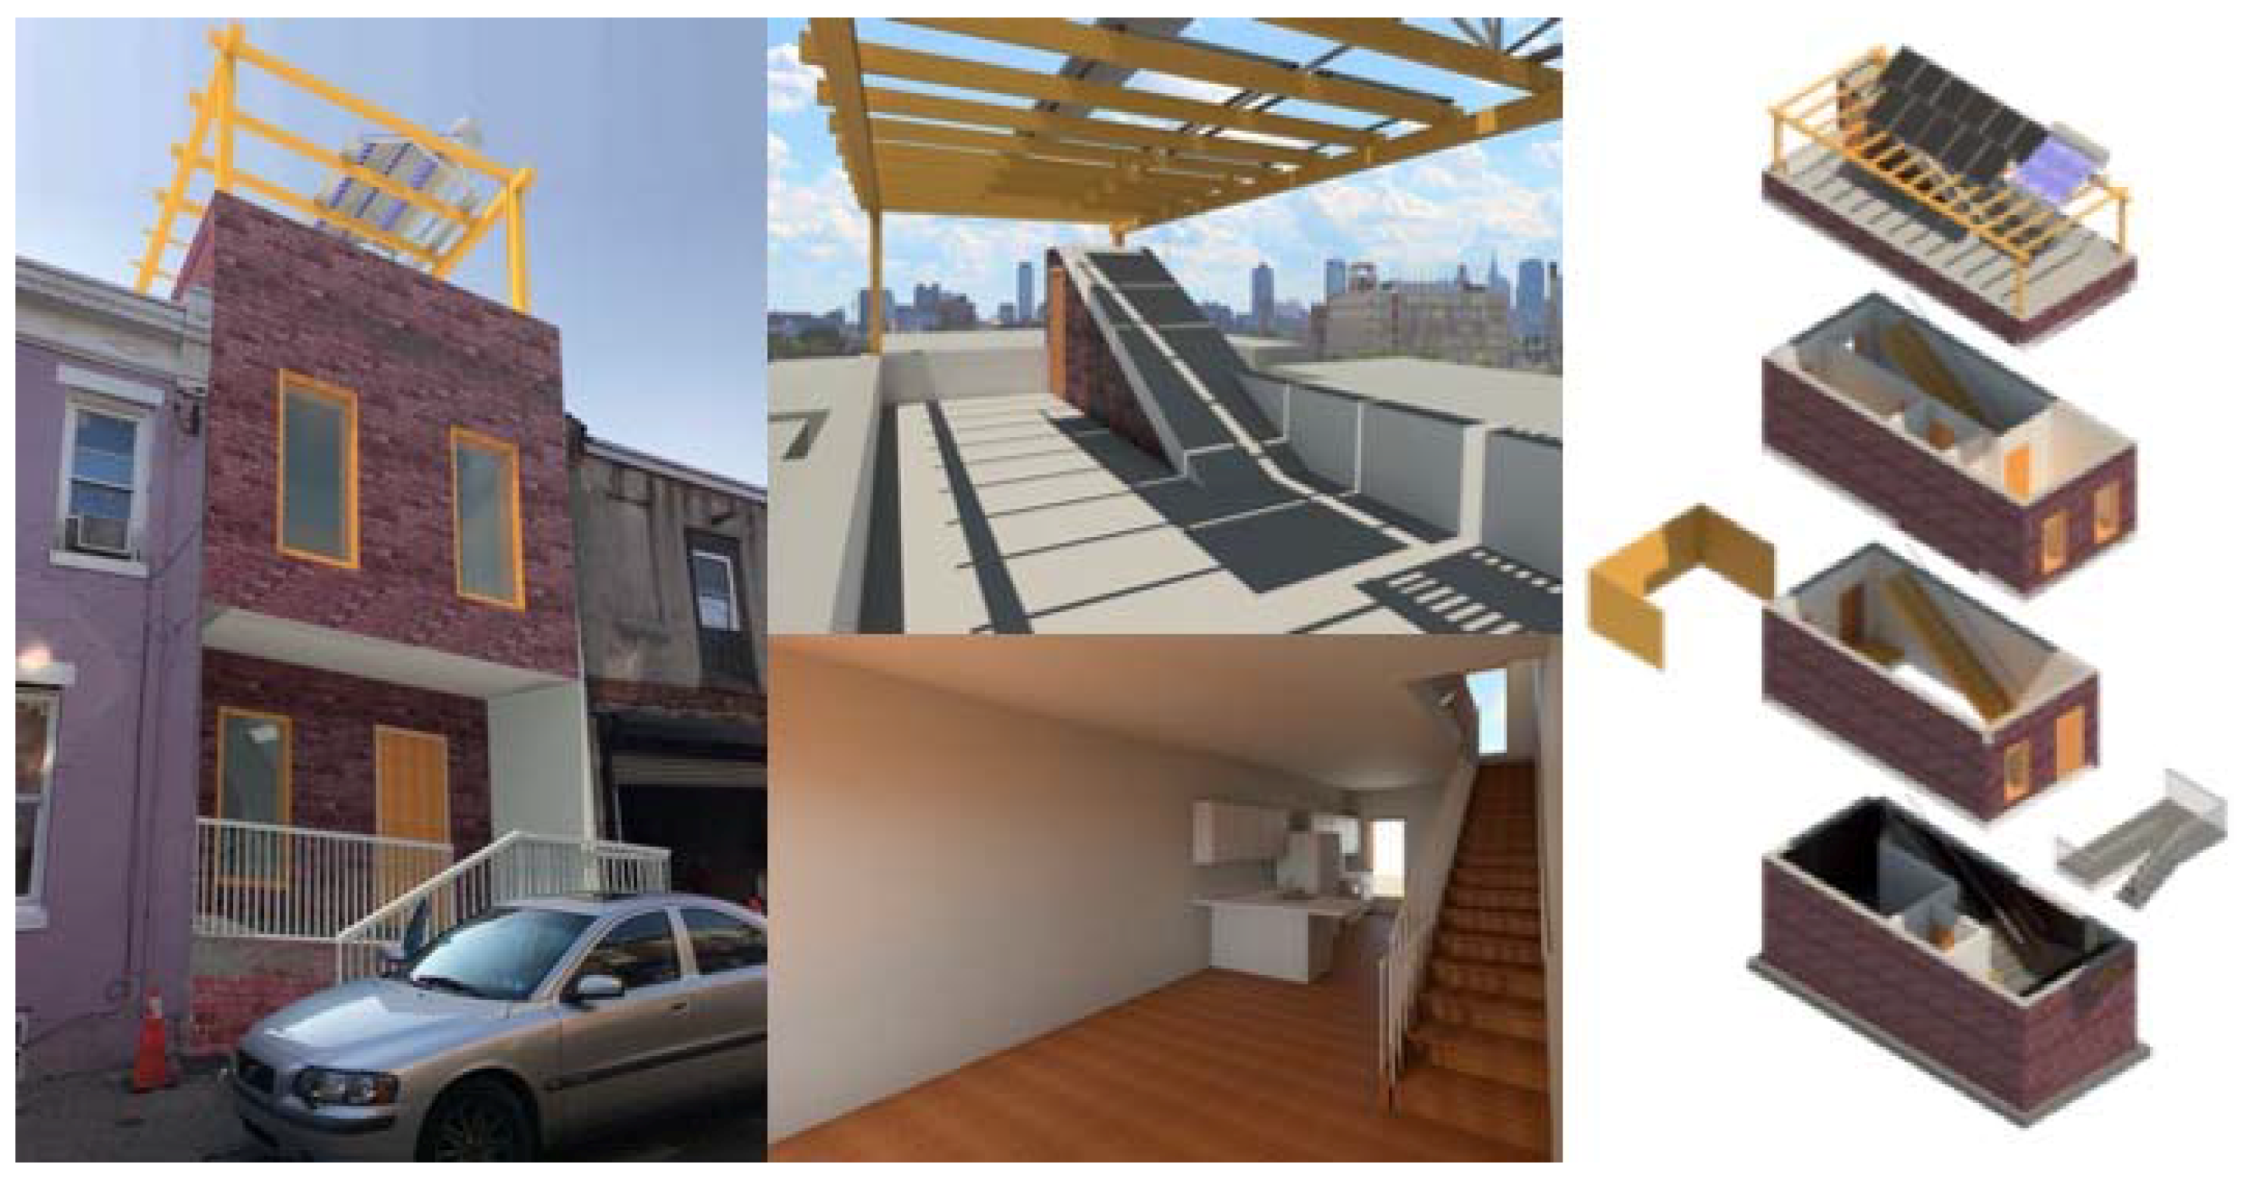
Considering the location, use, and site constraints, this rowhouse will have two floors above ground, an accessible rooftop, and a basement. The backyard exterior space is a common quality of Philadelphia’s rowhouses. The front porch will provide a cultural asset “offering an enjoyable as well as safety-enhancing vantage during nice weather” [15] and support neighborhood community social interaction. This rowhouse project will adopt the same envelope exterior materials, using the same commonly used brick on the façade to integrate as much as possible with the existing architecture.
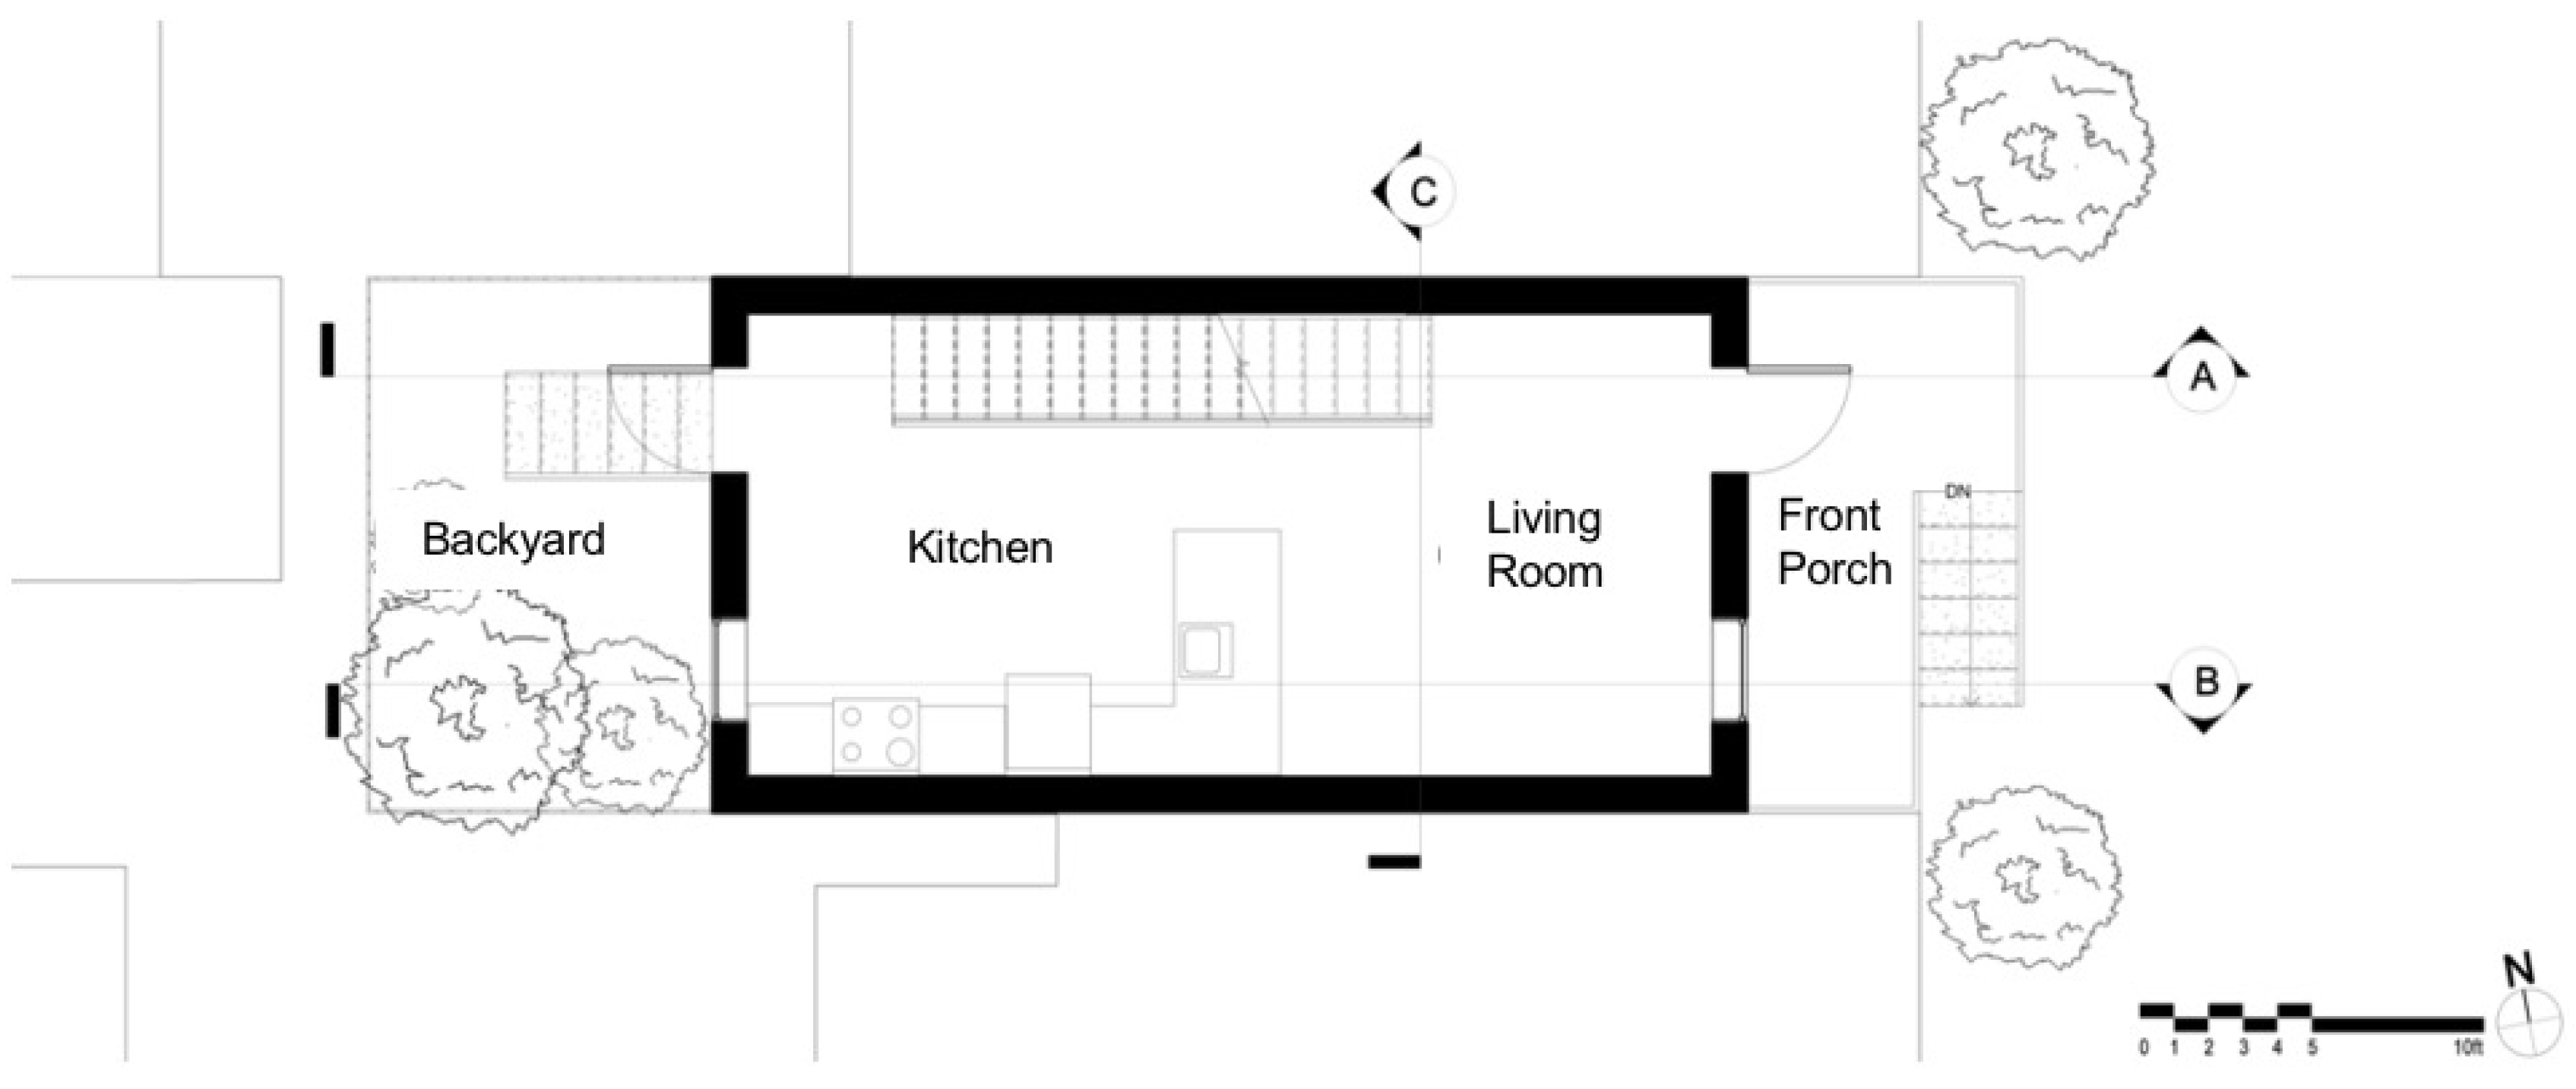
The proposed design (Figure 3) is composed of two levels (and occupiable roof) above ground and a basement. The mechanical equipment is in the basement, which occupies the entire footprint of the building. The first floor (Figure 4) has a front porch followed by the main entrance, and an open floor plan with the living room and kitchen. On this floor, there is access to a backyard.
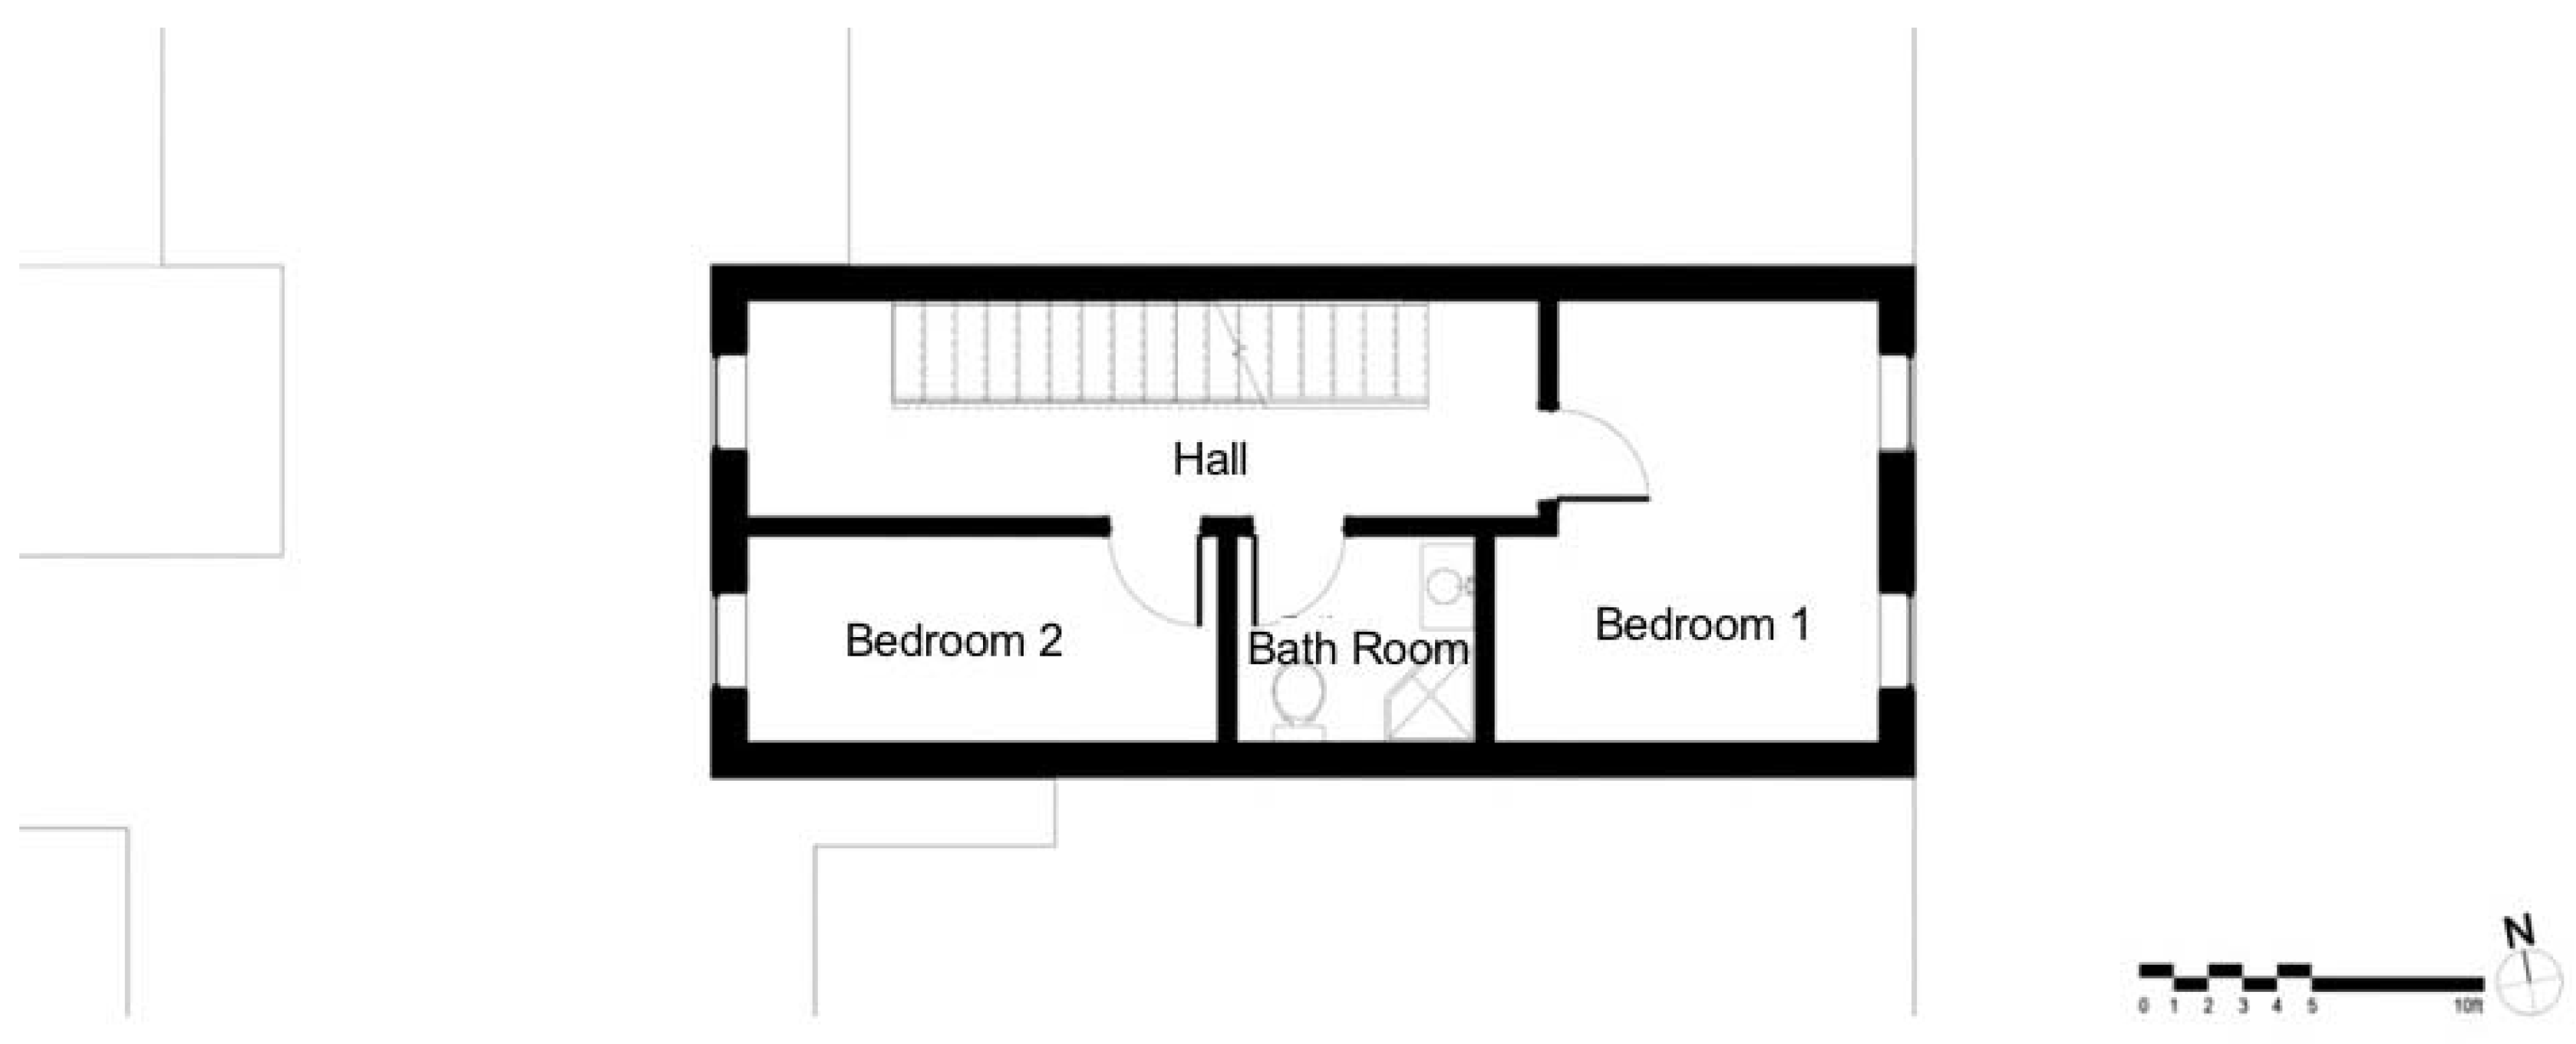
The second floor (Figure 5) has two bedrooms facing the front and the back of the house, and a bathroom in between them. Finally, the house has an accessible rooftop that provides an additional outdoor space with views of the city skyline, and is shaded by the PV and solar water systems mounted above the space on a pergola. This proposal is created to accommodate three people, which is the average number of people per household in this region of Philadelphia.
4. A Comparative Analysis of the Proposed Design
The proposed net-zero affordable prototype is analyzed using a life-cycle assessment (LCA) and cost analysis to validate its embodied energy and affordability. The LCA validation process starts with a baseline model and evolves until it reaches a high-performance building. This process develops a building that is code compliant, while analyzing the effect of each performance improvement on energy consumption (i.e., EUI).
4.1. Creating Model Assemblies
The baseline and high-performance LCA models are generated by using Athena EcoCalculator for Residential Assemblies, Version 1.21 in the closest nearby city to Philadelphia (New York City), and within the American Society of Heating, Refrigeration, and Air Conditioning Engineers (ASHRAE) climate zone 4 by Athena Sustainable Materials Institute [16]. Building assemblies for eight (8) sections of the residence are selected for the baseline and high-performance cases (Table 3). The baseline model building assemblies are selected based on common rowhouse construction methods (e.g., wood-framed housing) and with the most environmentally friendly materials available in the software. Other materials would have been preferred, but the selection was limited. On the other hand, high-performance model assemblies are chosen for being the most energy efficient, which will increase the overall thermal performance of the building.
4.2. Life-Cycle Assessment (LCA) Using the Athena EcoCalculator
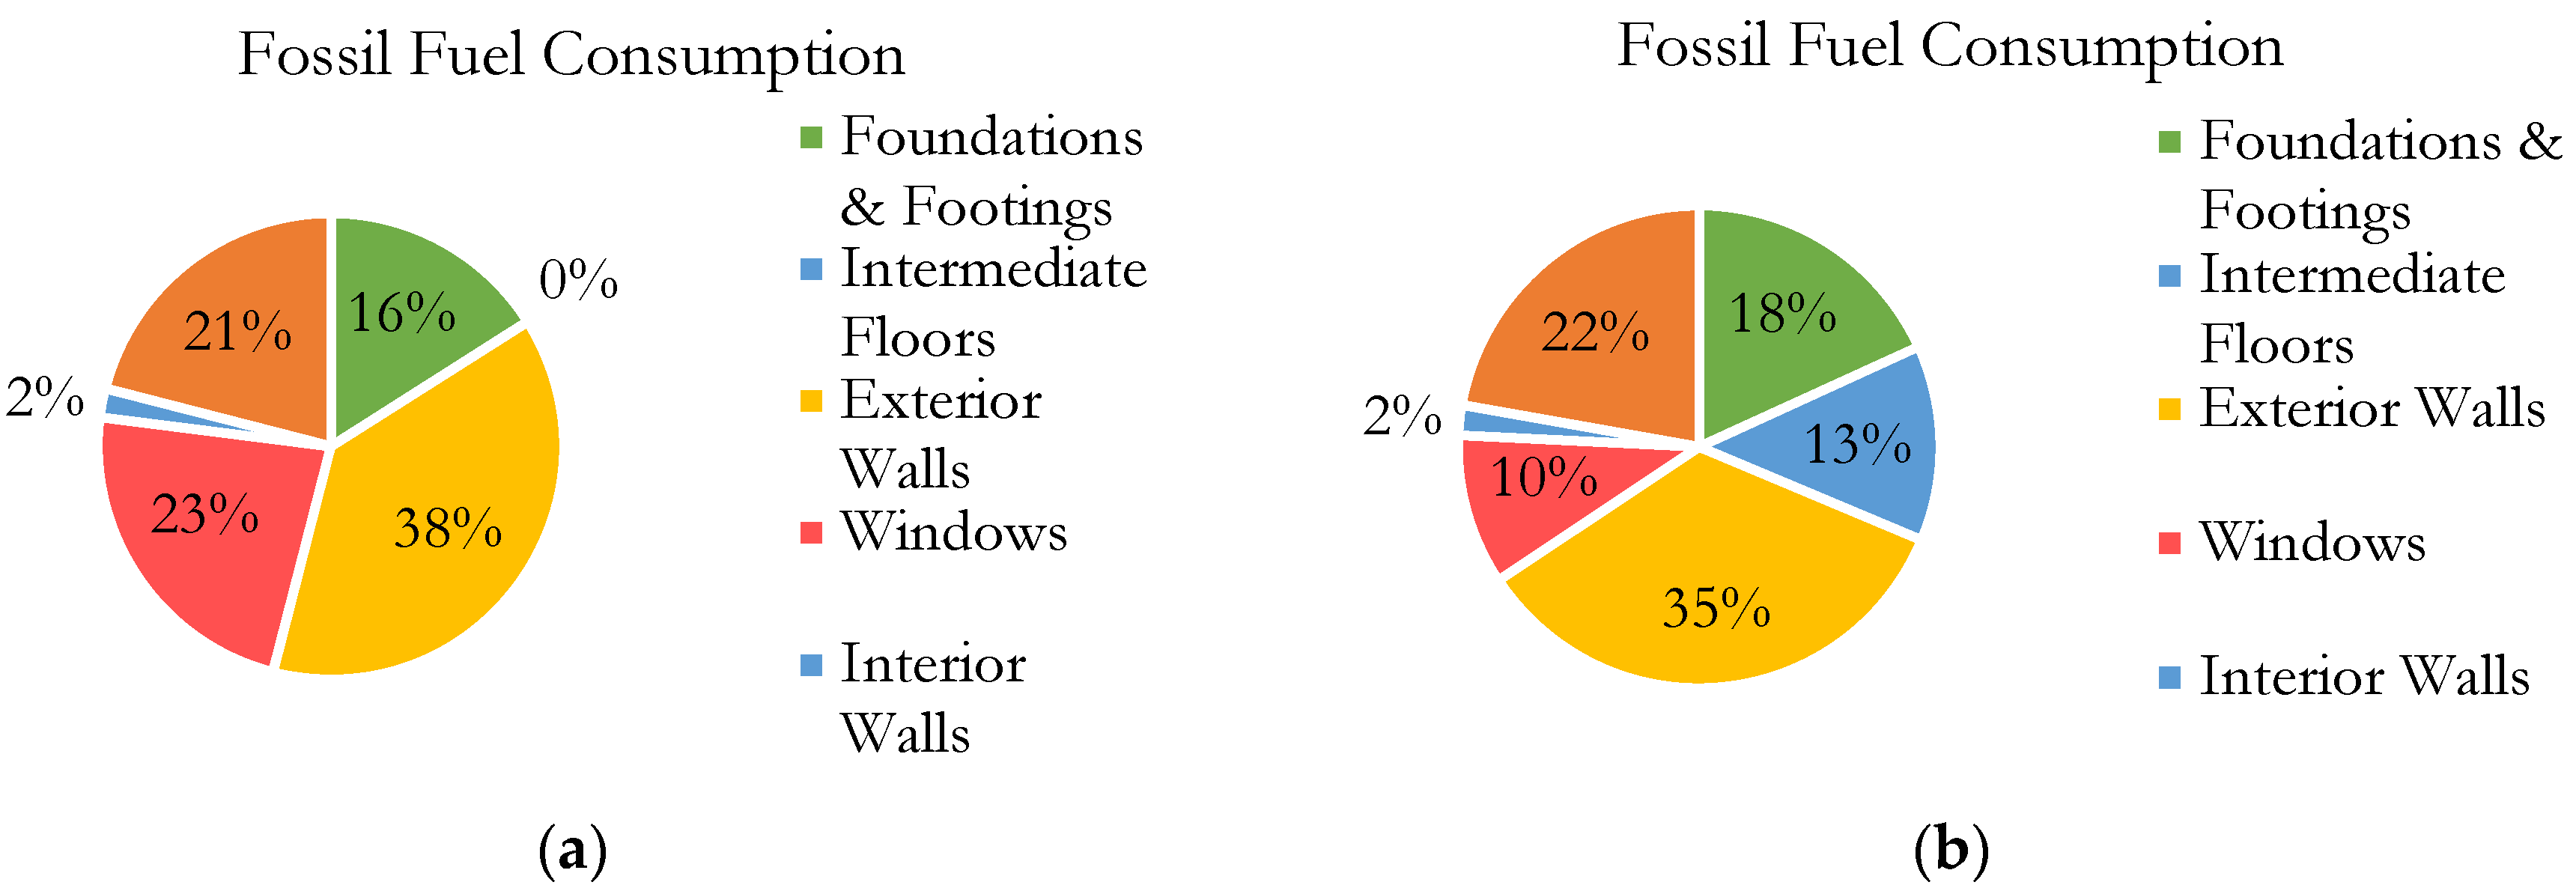
LCA reports include environmental impacts in seven (7) categories. For the baseline analysis (Figure 6a), the assembly with the highest negative impact in terms of fossil fuel consumption, global warming potential, eutrophication potential and smog potential is the exterior walls. Meanwhile, the windows have a greater negative impact on acidification potential and human health criteria. Exterior walls are the assemblies that have the highest fossil fuel consumption. For the high-performance model (Figure 6b), the assemblies with higher negative impact on fossil fuel consumption, global warming potential, acidification potential, eutrophication potential and smog potential are the exterior walls. The windows have a greater negative impact on acidification potential and human health criteria. The foundations and footings in the assembly have the highest ozone depletion potential.
4.3. Energy Analysis and Improvements to Baseline Model
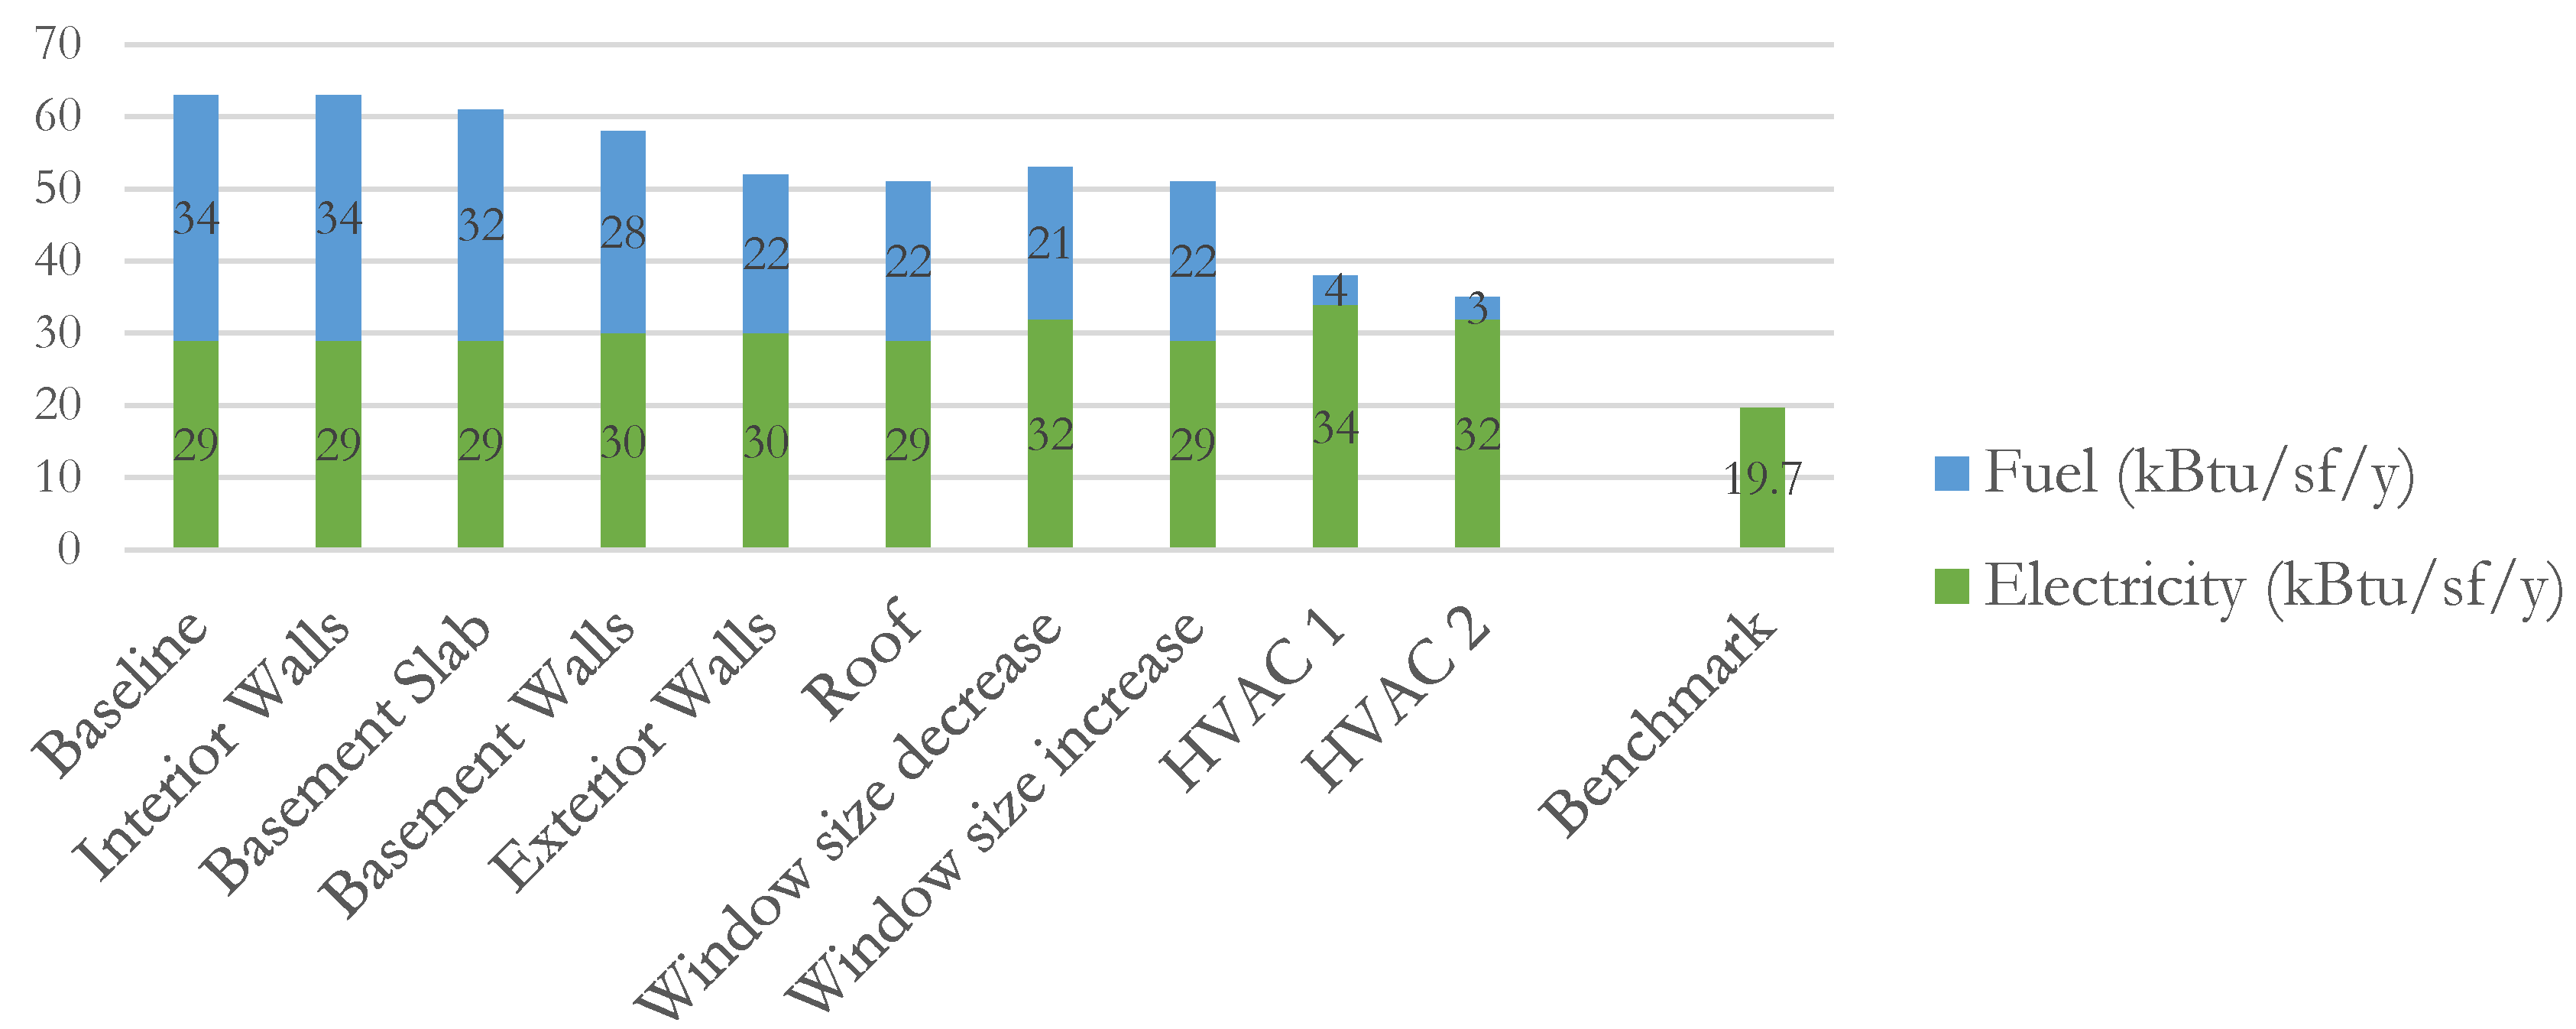
The baseline model was further analyzed to decrease energy consumption. The energy analysis was completed using Autodesk Green Building Studio [17]. The annual energy use of the baseline model is 63 kBtu/sf/yr. This value includes energy from fuel (34 kBtu/sf/yr) and from electricity (29 kBtu/sf/yr or 8 kWh/sf/yr). The results show that most of the fuel is used for heating and most of the electricity is used for pumps, auxiliary and fans. To generate a more efficient and sustainable building, a series of improvements in the building envelope and some interior elements and systems were made.
The first improvement was to increase the interior walls’ R-value from 0 to 11 sf·°F·h/Btu. After this change, the annual Energy Use Intensity (EUI) was still 63 kBtu/sf/yr, while the fuel consumption remained 34 kBtu/sf/yr and the electricity remained 29kBTU/sf/yr (8 kBtu/sf/yr). This change did not affect the annual EUI of the building compared to the baseline, as it did not change the building envelope.
The second improvement was to change the building slab to an R-value of 40 sf·°F·h/Btu from the original R-value of 10 sf·°F·h/Btu. This resulted in a decrease of 2 kBtu/sf/yr. The fuel consumption decreased to 32 kBtu/sf/yr, while the electricity remained at 29 kBtu /sf/yr (9 kWh/sf/yr). In this model, the amount of fuel used to heat the space decreased; however, the amount of fuel needed to heat water increased.
The third improvement was to change the R-value of the basement walls from 10 to 48 sf·°F·h/Btu, which decreased another 2 kBtu/sf/yr from the previous EUI. In this analysis, it was found that the percentage of electricity surpassed the percentage of fuel consumed. The use of fuel to heat water increased whereas space heating used less fuel. However, the use of electricity for cooling increased, and the use of pumps, auxiliary and fans decreased. The exterior wall and roof R-value improvements continued. The summary of results is shown in Table 4.
After improving R-values, window area sizes were changed to observe changes in the EUI. When the area of windows was decreased about 50% of its original area, the EUI increased, the use of fuel decreased by 4%, while the electricity use increased. The amount of fuel used to heat decreased, while fuel to heat water increased and electricity for cooling increased. As window size decreases, this increased the EUI from 51 to 53 kBtu/sf/yr. Note that this change was not implemented before the next improvement.
The next series of improvements include changes to the HVAC system, which is where the greatest impact to EUI is expected. When the model changes to a different HVAC system, the EUI drops significantly to 38 kBtu/sf/yr. The new HVAC system, Residential 14 SEER/8.3 HSPF Split Package Heat Pump, uses electricity and, according to this stage in the analysis, the use of electricity represents 90% of all energy used. However, the amount of consumed electricity increased 1 kWh/sf/yr (around 3.142 kBtu/sf/yr). Water heating becomes the only remaining use of fuel, and electricity is now being used for both space heating and cooling. This last improvement to the building’s chosen HVAC system is a Residential 17 SEER/9.6 HSPF Split HP < 5.5 ton. Using a more efficient HVAC (electric power) decreases the EUI even more to 35 kBtu/sf/yr, while the demand for electricity for space heating and cooling is also reduced. For a better understanding of the energy usage change along with all improvements, Figure 7 graphically shows the reduction of fuel and electricity during a year. Please note the benchmark used for comparison in the figure is a Living Building Challenge case study (Mission Zero House) [18].
4.4. Comparison of LCA of Baseline and High-Performance Models
When the LCA models are compared, all assemblies, from baseline to high-performance, differ in their environmental impact. Some assemblies increase their environmental impact, such as how the exterior walls increase their acidification potential and smog potential (Figure 8), while other assemblies even decrease their negative impact, like exterior walls when it comes to global warming potential, fossil fuel consumption and human health criteria. It is an interesting result to have higher levels of acidification potential and smog potential in the high-performance model.
4.5. Comparison of Life Cycle Cost (LCC) of Baseline and High-Performance Models
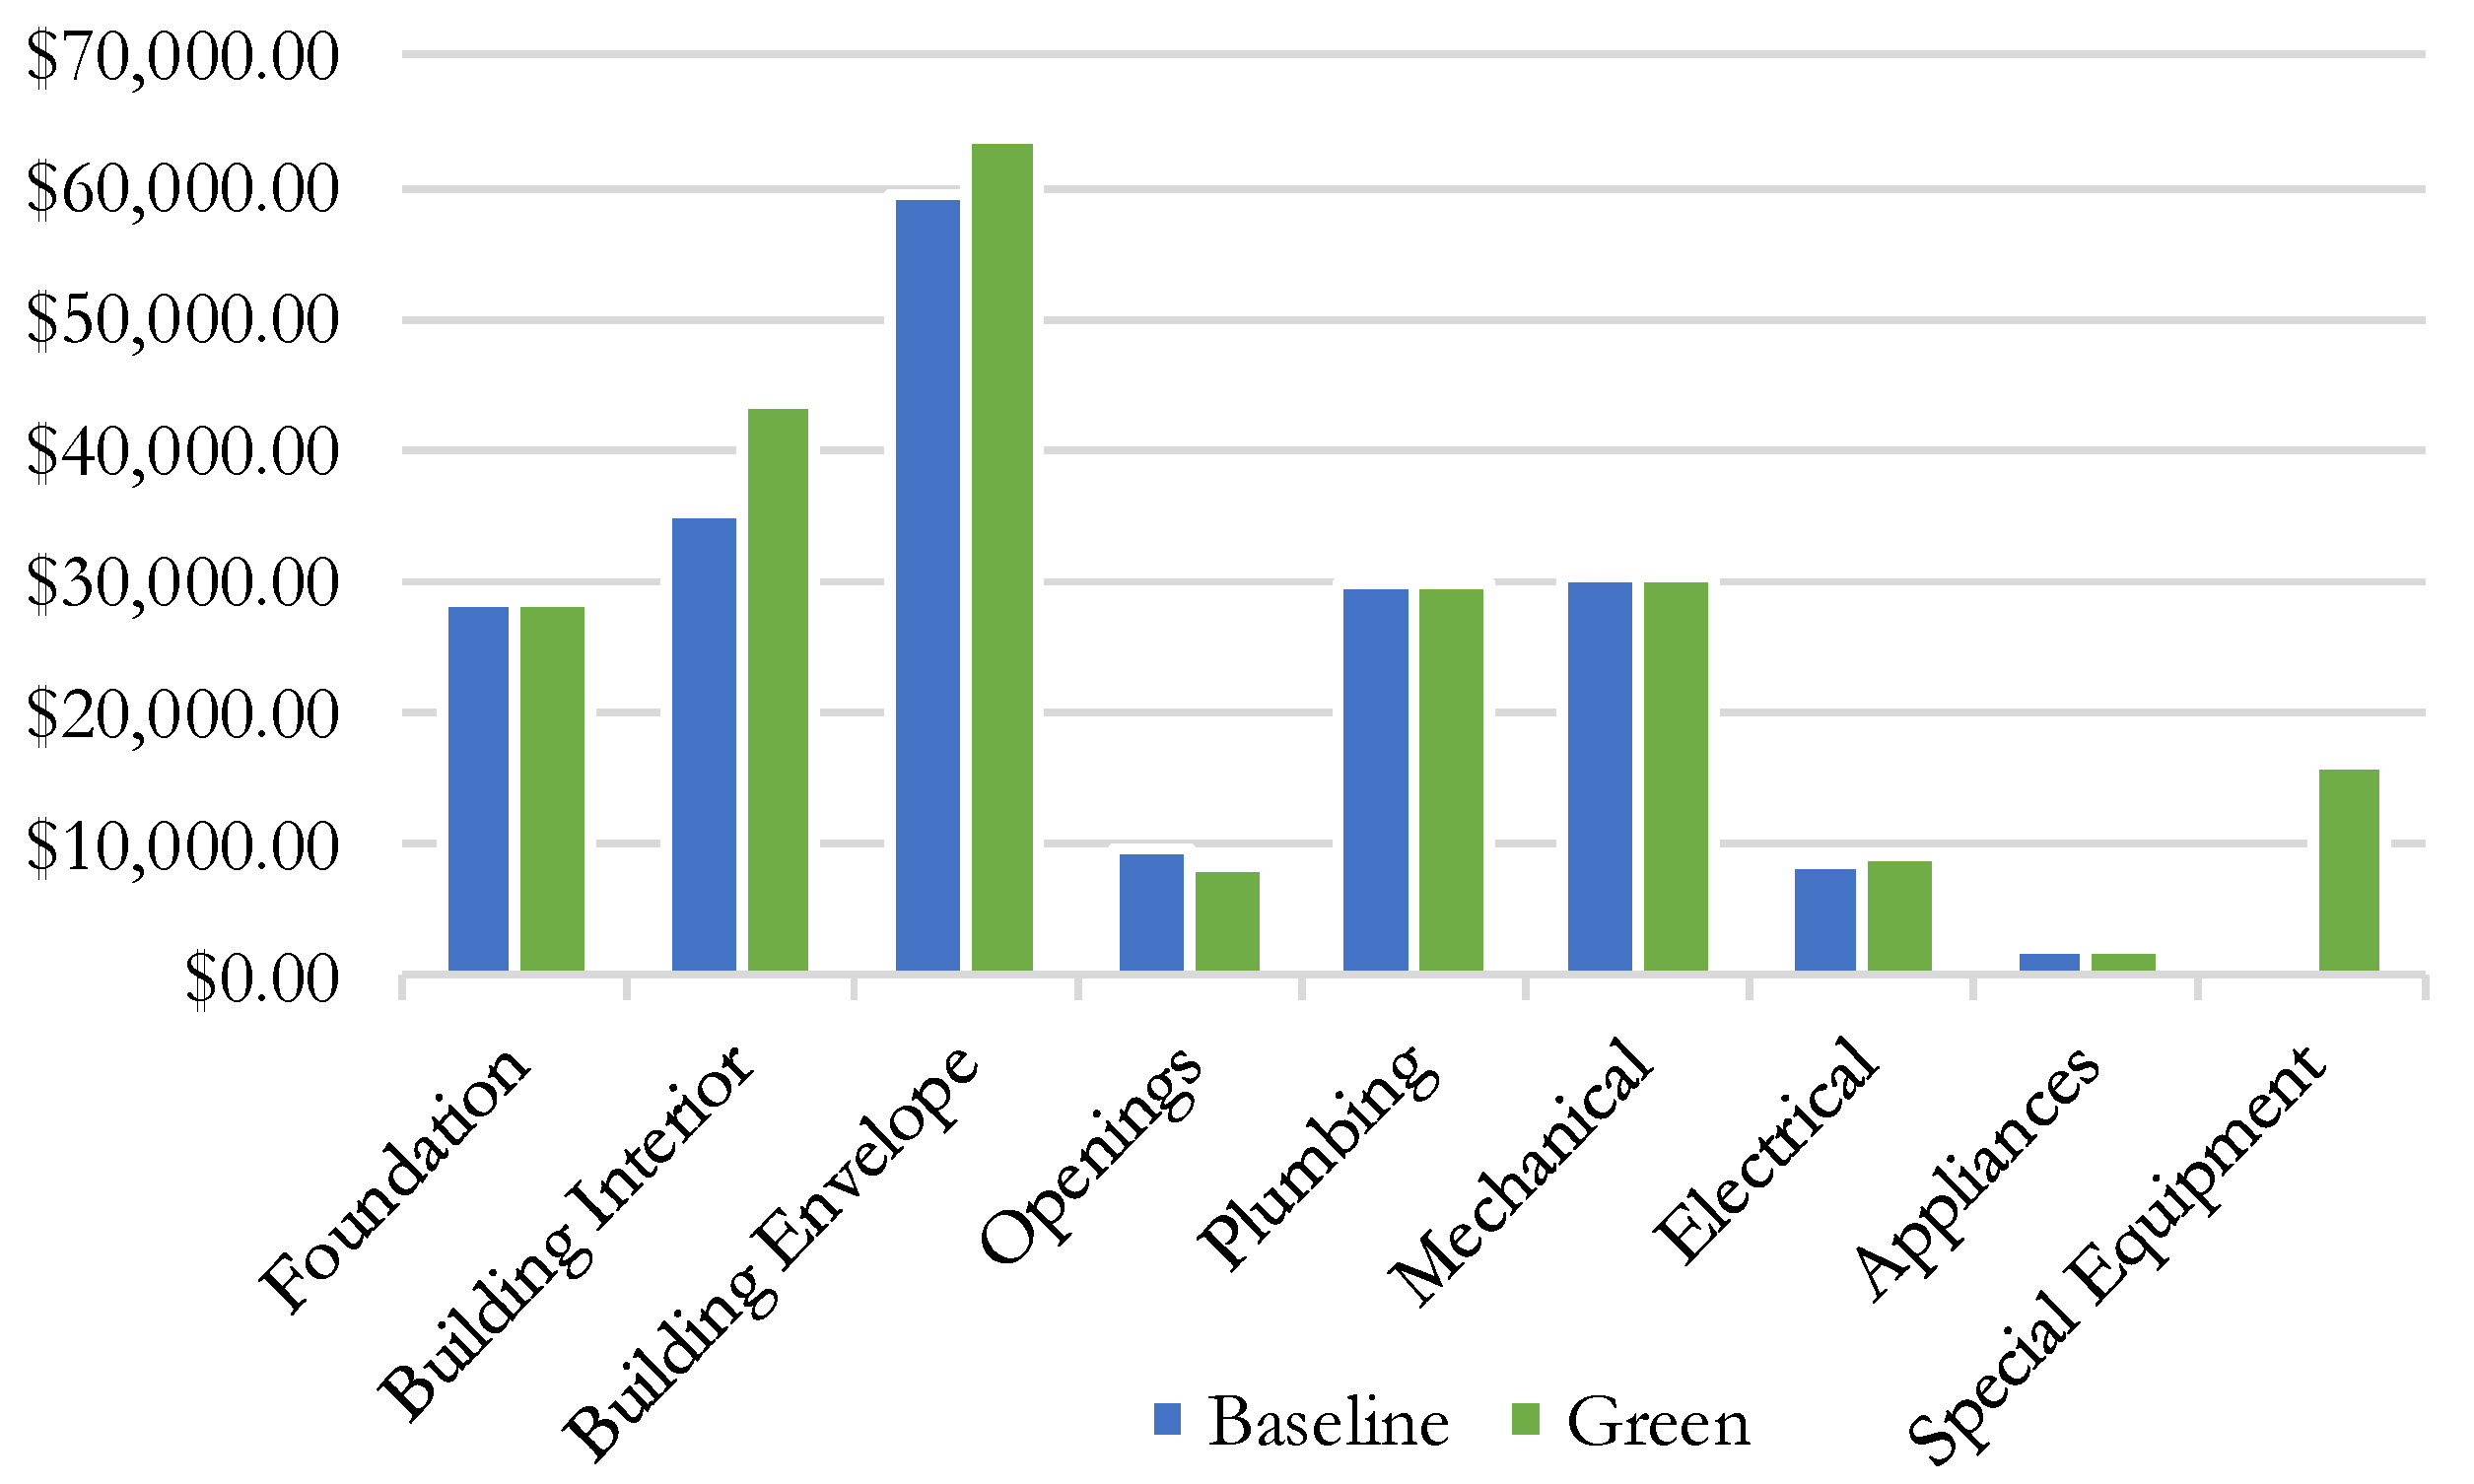
Cost estimates to both models are performed by using Assemblies Cost Data [19] and Green Building Cost Data [20]. All the building elements were taken into account for the cost estimate including foundations, building interior, building envelope, openings, plumbing, mechanical, electrical and appliances. The total cost of the baseline building was calculated to be $203,779.30 ($133.19/sf) while the cost of the high-performance building was $231,658.54 ($151.41/sf). Figure 9 presents a comparison of costs in each building section. According to the results, the first cost of the high-performance model is 13.68% more than the baseline model. To make the high-performance model affordable, the payback duration of improvements and the decrease in the utility bills will be calculated.
When electricity is considered, the amount of energy needed to be purchased from electricity suppliers is lower than in the baseline building. Taking into consideration the first costs ($231,658.54–$203,779.30) and the difference in energy needed in both buildings (63–35 kBtu/sf/yr), the estimate for payback is 17.02 years when the electricity rate is $0.1290/KWh. Note that for every 0.1 cent increase in the electricity rate, the payback period decreases by 0.13 years.
This payback calculation includes the photovoltaics (PV) array and the solar hot water system, which also provide life-cycle cost gains. According to a solar water estimate calculator, the cost of equipment, with installation, taxes and rebates is estimated to be $2588 [21]. The resulting estimated annual saving is $189, and the return on investment is 13.71 years. The NREL PV Watts Calculator [22] estimates the amount of energy that a PV system generates over one year. The tool used an electricity rate of 0.13$/kWh, which corresponds with the Philadelphia electricity rate for distribution and use [23]. Based on the available roof area (465 sf), 20 panels were used to calculate the annual energy produced (8001 kWh/yr) and the value of electricity generated, which is approximately $1033.
In an attempt to reduce the payback period, the number of PV panels was reduced from the number of panels that fit within the available roof area to the number of panels needed to provide net zero energy, that is, enough to meet the 35 kBTU/sf/yr needed per the previous set of calculations. This improves the affordability of the home by reducing the construction cost while maintaining low ongoing operational costs, and still meets the project guiding principles and goals set at the beginning of the design. Thus, the number of panels was reduced from 20 to 11 (8001 to 4185 kWh/yr, respectively), and the payback period is reduced from 17.02 to 16.15 years (see Table 5).
4.6. Comparison of Design Results to Guiding Principles
The prototype residential design is created using four guiding principles from four distinct perspectives to help make the most integral and holistic design. The guiding principles are presented below along with a figure to demonstrate that these principles were followed as a means to validate the integral sustainable design approach (See Figure 10):
- Experience: The house is creating a pleasant view of the street and helping to provide a better and healthy environment for the residents.
- Facts/performance: The design encourages a heathy interior environment with minimal monthly utility costs (i.e., energy and water savings) and uses recycled and recyclable materials for construction.
- Culture: The proposed design provides an affordable building in the neighborhood and saves money on utility bills. If replicated, this prototypical housing unit may stimulate local social and economic development.
- Systems: The house has a closed-loop water system with rainwater harvesting and treated water, and is off grid, generating its own electricity.
5. Conclusions
This study presented an affordable and energy-efficient design for a low-income rowhouse in Philadelphia, which has the highest rate of poverty among large U.S. metropolitan cities. Baseline and high-performance design alternatives were compared in terms of environmental impact and costs. The LCA analysis showed that windows have a greater negative impact on acidification potential and human health criteria, while foundations and footings have the highest ozone depletion potential for both designs. The energy analysis was further carried on with a detailed analysis of multiple iterations. The improvements of R-values alone (walls, slab and roof) decreased the EUI from 63 kBtu/sf/yr to 52 kBtu/sf/yr. While the change in the windows’ size did not affect the EUI values, when the model is changed to a different HVAC system, the EUI drops significantly to 38 kBtu/sf/yr, nearly a 40% decrease overall.
Similarly, baseline and high-performance design alternatives were compared for their cost estimates. The first costs were higher in the high-performance model, as expected. However, the payback duration of improvements and the decrease in the utility bill were also considered in the analysis to make the prototype affordable, as planned. In the final stage of the analysis, the number of PV panels was reduced from 20 to 11. The results showed that the proposed prototype housing investment has a payback period of approximately just over 16 years with the ongoing operating expenses being significantly less than a typical house.
Considering the added benefits (energy and water) that will continue after the payback period, the design can be a pioneer for low-income neighborhoods. The prototype design of the affordable net-zero-energy housing unit in Kensington, Philadelphia is expected to create interest among developers, which could lead to the development of new affordable housing units that could trigger social improvement, culture change and an improved well-being. Although the integral approach is delivering a more holistic approach than the TBL, the payback period is not as low as expected. This is likely because the rowhouse is small, even compared to other Philadelphia rowhouses. The selection of a larger site may have provided lower payback periods. This may suggest the following: (1) there is a lower limit to the size of single-residence projects that can still achieve reasonable payback periods, (2) zoning revisions may be needed to increase minimum lot sizes for affordable projects to achieve better payback periods, or (3) it may be beneficial to apply the approach to a minimum of two homes simultaneously, that is, this approach should apply to a larger-scale (neighborhood) project. Future studies can include improvements to the plumbing system of the prototype design, where a rainwater harvesting system can be designed according to the occupant needs in addition to low-flow and low-flush fixtures.
Author Contributions
Conceptualization, R.F., G.O.-D. and A.d.C.A.F.; Methodology, R.F., G.O.-D. and A.d.C.A.F.; Software, R.F., G.O.-D. and A.d.C.A.F.; Validation, R.F. and A.d.C.A.F.; Formal Analysis, A.d.C.A.F.; Investigation, R.F.; Resources, R.F., G.O.-D. and A.d.C.A.F.; Data Curation, R.F., G.O.-D. and A.d.C.A.F.; Writing-Original Draft Preparation, R.F. and G.O.-D.; Writing-Review & Editing, R.F. and G.O.-D.; Visualization, A.d.C.A.F.; Supervision, R.F. and G.O.-D.; Project Administration, R.F. and G.O.-D.
Funding
This research received no external funding.
Conflicts of Interest
The authors declare no conflict of interest.
References
- HHS (US Department of Health and Human Services) Office of Homeless Services. Available online: https://www.hhs.gov/programs/social-services/homelessness/index.html (accessed on 6 June 2018).
- NREL (National Renewable Energy Laboratory). Design and Evaluation of a Net Zero Energy Low-Income Residential Housing Development in Lafayette, Colorado; National Renewable Energy Laboratory: Golden, CO, USA, 2012.
- HUD (US Department of Housing and Urban Development). Affordable Housing. U.S. Department of Housing and Urban Development, 2018. Available online: https://www.hud.gov/program_offices/comm_planning/affordablehousing/ (accessed on 6 June 2018).
- EPA (Environmental Protection Agency). Energy Efficiency in Affordable Housing; Environmental Protection Agency: Washington, DC, USA, 2011.
- EPA (Environmental Protection Agency). Energy Star® Overview Of 2007 Achievements. 2007. Available online: https://www.energystar.gov/ia/partners/publications/pubdocs/2007%20CPPD%204pg.pdf (accessed on 6 May 2018).
- US Census Bureau. American Fact Finder—Community Facts. Available online: https://factfinder.census.gov/faces/nav/jsf/pages/community_facts.xhtml (accessed on 18 July 2018).
- Lindburg, A. What is New in Eco-Affordable Housing? Combining Green Building Innovations with Affordable Housing Needs; Dovetail Partners, Inc.: Minneapolis, MN, USA, 2007. [Google Scholar]
- Green Buildings and the Bottom Line. Building Design and Construction. 2018. Available online: https://www.bdcnetwork.com (accessed on 18 July 2018).
- Boehland, J. Greening affordable housing. Environ. Build. News 2005, 14, 11–19. [Google Scholar]
- Frumkin, H. Healthy, equity, and the built environment. Environ. Health Perspect. 2005, 113, 290–291. [Google Scholar] [CrossRef]
- FHLBA (Federal Home Loan Bank of Atlanta). The Little Green Book; Federal Home Loan Bank of Atlanta (FHLBA): Atlanta, GA, USA, 2005. [Google Scholar]
- Bradshaw, W. The Costs and Benefits of Green Affordable Housing; New Ecology Inc.: Cambridge, MA, USA, 2005. [Google Scholar]
- The New York Times. Mapping Poverty in America-Data from the Cencus Bureau Show Where the Poor Live. Retrieved from The New York Times. 2014. Available online: http://www.nytimes.com/newsgraphics/2014/01/05/poverty-map/ (accessed on 6 June 2018).
- DeKay, M. Integral Sustainable Design: Transformative Perspectives; Earthscan: London, UK, 2011. [Google Scholar]
- Schade, R.S. Philadelphia Rowhouse Manual; Office of Housing and Community Development, Philadelphia City Planning Commission, City of Philadelphia: Philadelphia, PA, USA, 2008. [Google Scholar]
- Athena Sustainable Materials Institute, Athena EcoCalculator for Residential Assemblies, Version 1.21. Available online: https://calculatelca.com/software/ecocalculator/ecocalculator-for-residential-assemblies/ (accessed on 6 June 2018).
- Green Building Studio. Solar Analysis; Revit. Autodesk: San Rafael, CA, USA, 2018. [Google Scholar]
- Liljequist, B. The Power of Zero: Learning from the World’s Leading Net Zero, Energy Buildings; Ecotone Publishing: Portland, OR, USA, 2016. [Google Scholar]
- RS Means. Assemblies Cost Data; RS Means: Rockland, MA, USA, 2013. [Google Scholar]
- RS Means. Green Building Cost Data; RS Means: Rockland, MA, USA, 2012. [Google Scholar]
- Free Hot Water. Solar Collector Estimator. Retrieved from Free Hot Water. Available online: http://www.freehotwater.com/solar-calculators/solar-thermal-calculator/ (accessed on 6 June 2018).
- NREL. PVWatts Calculator. Retrieved from NREL. Available online: http://pvwatts.nrel.gov (accessed on 6 June 2018).
- PECO. Electric Price to Compare. Retrieved from PECO. 2018. Available online: https://www.peco.com/MyAccount/MyService/Pages/ElectricPricetoCompare.aspx (accessed on 6 June 2018).
- U.S. Energy Information Administration. Electric Power Monthly. Retrieved from U.S. Energy Information Administration; 2018. Available online: https://www.eia.gov/electricity/monthly/epm_table_grapher.php?t=epmt_5_6_a (accessed on 6 June 2018).
Figure 1.
Poverty rates in the U.S. Adapted from [6], Cured Philadelphia, 2017.
Figure 1.
Poverty rates in the U.S. Adapted from [6], Cured Philadelphia, 2017.

Figure 2.
(a) Location of the site in Philadelphia, (b) location of the site in the North Kensington neighborhood.
Figure 2.
(a) Location of the site in Philadelphia, (b) location of the site in the North Kensington neighborhood.

Figure 3.
(a) Diagrammed spaces, (b) exterior east façade perspective.

Figure 4.
First floor plan.

Figure 5.
Second floor Plan.

Figure 6.
(a) Baseline model, (b) high-performance model.

Figure 7.
EUI results per design improvements to Baseline.

Figure 8.
Environmental impact summary comparison.

Figure 9.
Baseline and green building cost estimate comparison.

Figure 10.
Design meeting the guiding principles.


Table 1.
Guiding Principles.
| Experience | Facts/Performance |
| Contribute to creating a pleasant view of the street and help to provide a better and healthy environment for the residents. | Have a healthy interior environment with minimal monthly cost in utilities, saving water and energy and using recycled and recyclable materials for construction. |
| Culture | Systems |
| Improve affordable construction quality building in the neighborhood. Incentivize the community to save money on utility bills and help improve neighborhood economy. Create a prototypical housing unit that can be replicated in other places to stimulate social and economic development. | Design with the climate to save and conserve natural resources like water and electricity. |
Table 2.
Goals.
| Experience | Facts/Performance |
| Create a house where people are thermally comfortable; feel safe and secure; have abundant access to daylight; can experience the city from street and roof levels; experience a connection to nature via a modest outdoor space. | Achieve net zero energy. Collect 100% of harvested rainwater from roof and use it to offset water consumption. |
| Culture | Systems |
| Improve residents’ and neighborhood quality of life. Front porch to engage with community. Provide opportunity to generate savings from costly utility bills that can be used to invigorate the local economy. | Produce 100% of energy via onsite renewable sources (PV) to help achieve net zero energy. Install PV system. Install and use water conservation system including low-flow fixtures, the reuse of greywater and a treatment system. |
Table 3.
Baseline and High-Performance Model Assemblies.
| Assembly Type | Materials—Baseline | Materials—High-Performance |
|---|---|---|
| Foundation wall | 8″ Cast-in-Place Vapor Barrier | 8″ Cast-in-Place R10 Polyisocyanurate Foam Continuous Insulation Vapor Barrier |
| Foundation slab | 4″ Poured Concrete Slab | 4″ Poured Concrete Slab |
| Footing | Poured Concrete Footing | Poured Concrete Footing |
| Intermediate floor | Wood Joist w/Oriented Strand Board (OSB) Decking (uninsulated) Vapor Barrier | Wood Joist w/OSB Decking R19 Cavity Insulation Vapor Barrier |
| Exterior wall | Clay Brick Cladding w/1” Air Space R13 Cavity Insulation Weather-Resistant Barrier ½ Gypsum Board + 2 Coats Latex Paint | Clay Brick Cladding w/1″ Air Space 3 ½″ Structural Insulated Panels (R19) (SIP) Weather-Resistant Barrier ½ Gypsum Board + 2 Coats Latex Paint |
| Windows | Aluminum-Operable Low-E, Argon Filled | Vinyl clad wood Filled Low-E, Argon Filled |
| Interior walls | Wood Stud 2 × 4 16″ on center (o.c.) ½″ Gypsum Board 2 Coats Latex Paint | Wood Stud 1 5/8 × 3 5/8 24” o.c. ½” Gypsum Board 2 Coats Latex Paint |
| Roofs | Wood Joist w/OSB Decking Asphalt Shingles, Fiberglass Felt-based, 20 year R38 Cavity Insulation ½″ Gypsum Board + 2 Coats Latex Paint | Wood Joist w/OSB Decking Asphalt Shingles, Fiberglass Felt-based, 20 year R38 Cavity Insulation ½″ Gypsum Board + 2 Coats Latex Paint |
Table 4.
Energy Use Intensity (EUI) Countdown.
| Model | EUI (kBtu/sf/yr) |
|---|---|
| Baseline | 63 |
| Interior Walls R-value = 11 sf·°F·h/Btu | 63 |
| Basement Slab R-value = 40 sf·°F·h/Btu | 61 |
| Basement Walls R-value = 48 sf·°F·h/Btu | 58 |
| Exterior Walls R-value = 48 sf·°F·h/Btu | 52 |
| Roof R-value = 58 sf·°F·h/Btu | 51 |
© 2018 by the authors. Licensee MDPI, Basel, Switzerland. This article is an open access article distributed under the terms and conditions of the Creative Commons Attribution (CC BY) license (http://creativecommons.org/licenses/by/4.0/).
Share and Cite
MDPI and ACS Style
Ozcan-Deniz, G.; Fryer, R.; De Castro Amorim Ferreira, A. The Design of Net-Zero-Energy Affordable Housing in Philadelphia. Designs 2018, 2, 26. https://doi.org/10.3390/designs2030026
AMA Style
Ozcan-Deniz G, Fryer R, De Castro Amorim Ferreira A. The Design of Net-Zero-Energy Affordable Housing in Philadelphia. Designs. 2018; 2(3):26. https://doi.org/10.3390/designs2030026
Chicago/Turabian StyleOzcan-Deniz, Gulbin, Robert Fryer, and Ana De Castro Amorim Ferreira. 2018. "The Design of Net-Zero-Energy Affordable Housing in Philadelphia" Designs 2, no. 3: 26. https://doi.org/10.3390/designs2030026