
Highway Bridge Infrastructure in the Province of British Columbia (BC), Canada


School of Engineering, The University of British Columbia, Kelowna, BC V1V 1V7, Canada
*
Author to whom correspondence should be addressed.
Infrastructures 2017, 2(2), 7; https://doi.org/10.3390/infrastructures2020007
Submission received: 14 March 2017
/
Revised: 4 May 2017
/
Accepted: 7 May 2017
/
Published: 11 May 2017
(This article belongs to the Special Issue Concrete Structures: Present and Future Trends)
Abstract
:Some recent catastrophic impacts on highway bridges around the world have raised concerns for assessing the vulnerability of existing highway bridges in Canada. Rapid aging of bridge infrastructure coupled with increased traffic volume has made it crucial to establish an advanced Bridge Management System (BMS) for highway bridges. This paper aims at developing a highway bridge inventory for the province of British Columbia (BC) which is critical for efficient assessment of the existing structural health condition of the bridges, predicting their future deterioration, and prioritizing their maintenance and retrofitting works. This inventory is an extensive assemblage of data on highway bridges in BC under the responsibility of the BC Ministry of Transportation and Infrastructure (BC MoT) that includes more than 2500 highway bridges. It includes identification of the most common bridge types along with their location, structural and geometric parameters such as construction materials, bridge length, number of spans, deck width, skew angle, bridge pier, and foundation type, structural health condition rating and construction period. This information is of paramount importance for effective infrastructure management, proper rehabilitation solutions, and efficient design of a Structural Health Monitoring (SHM) and Control System for enhancing structural resilience of highway bridges in BC. Several statistical analyses have been carried out for efficient utilization of the information available in the inventory for further research and analyses, as well as for developing a proper BMS for the province’s bridges.
1. Introduction
Bridges work as vital links in the highway networks. The failure of bridges due to any natural calamity in a region can dramatically affect the transportation network causing substantial economic disturbance to that region [1,2,3]. Post disaster emergency services can be severely affected due to the failure of highway bridges. Moreover, the performance of the entire transportation system can be disruptive as a result of the lengthy repair time of damaged bridges and difficulties in rerouting of traffic. This is why it is of great importance to the Canadian economy that highway bridges continue to function at optimum levels even after a significant natural hazard, such as an earthquake of large magnitude [4] or massive flooding or even manmade hazards. Events similar to the 1971 San Fernando earthquake, the 1989 Loma Prieta earthquake, the 1994 Northridge earthquake, the 1995 Kobe earthquake, the 1999 Chi-Chi earthquake, and 2010 Chile earthquake have already demonstrated the seismic vulnerability that highway bridges are subjected to [5,6,7,8,9,10,11,12]. The failure of Silver bridge in 1967 in West Virginia due to corrosion and material fault, bridge failure in Laval, Quebec in 2006 due to design flaws and lack of regular maintenance, collapse of I-5 bridge in 1995 in California, and the partial collapse of Bonnybrook Bridge in Calgary in 2006 due to river scouring caused by severe flood has highlighted the urgency for efficient assessment of the existing bridges. Therefore, reliability based performance analysis of highway bridges should be carried out in order to assess the present vulnerability and resilience of structures. This will ensure reliable and cost-effective rehabilitation techniques and control solutions to reduce potential damages during such events. Fragility curve analysis, one of the tools for assessing the vulnerability of existing and newly designed highway bridges to seismic and scouring hazards, and hazards due to corrosion and chloride penetration from de-icing salt, is becoming popular nowadays [4,13,14,15,16,17,18]. Seismic fragility assessment of a new or existing highway bridge describes the probability of having slight, moderate, or severe damage when subjected to a specific ground motion. Typically, the generation of fragility curves of every individual existing highway bridge would be ideal, but cost and time would be prohibitive. Therefore, an approach which sub-categorizes all the highway bridges in the region into different bridge types based on their structural and geometric characteristics and assesses the fragility of individual bridge types will be more realistic. In this paper, an extensive bridge inventory analysis is presented with the statistics of different structural and geometric parameters which intends to classify the major highway bridge types in British Columbia (BC) under the responsibility of the BC Ministry of Transportation and Infrastructure (BC MoT). Fragility analysis is also the first step to assess seismic resilience of any bridge structure, which is a measure of the robustness of the structure and its capability to restore its original performance after any catastrophic event [19,20]. Different active, passive, and semi-active Structural Control Solutions have been studied and incorporated by several researchers to enhance the resilience of bridges to minimize damage during any seismic event and expedite aftershock recovery to its original performance [21,22,23,24,25,26]. Knowledge on the province’s bridges along with their structural and geometrical parameters would be of significant importance for the specific design and study of these control devices along with their implementations.
This inventory of different bridge parameters, seismic location of bridges and present health condition can also provide a basis for the effective design of Structural Health Monitoring (SHM) systems for the province’s Highway Bridges. Early damage detection and real time health monitoring of structures is becoming a popular tool to avoid severe damage and minimize the cost of repair. Numerous studies have been conducted on SHM of highway bridges by using a variety of embedded sensors to evaluate the damage state, capacity, or vulnerability of such structures [27,28,29,30,31,32]. Many of the bridges in this region are very old and may have reached the end of their service lives, and should be brought under continuous health monitoring. This portfolio of bridges presented herein can significantly contribute towards the future study of SHM of bridges in BC and help establish cost effective and reliable solutions. This inventory would be a step towards the development of a National Bridge Inventory (NBI) for Canada that will eventually contribute in establishing an advanced Bridge Management System (BMS).
2. Research Significance
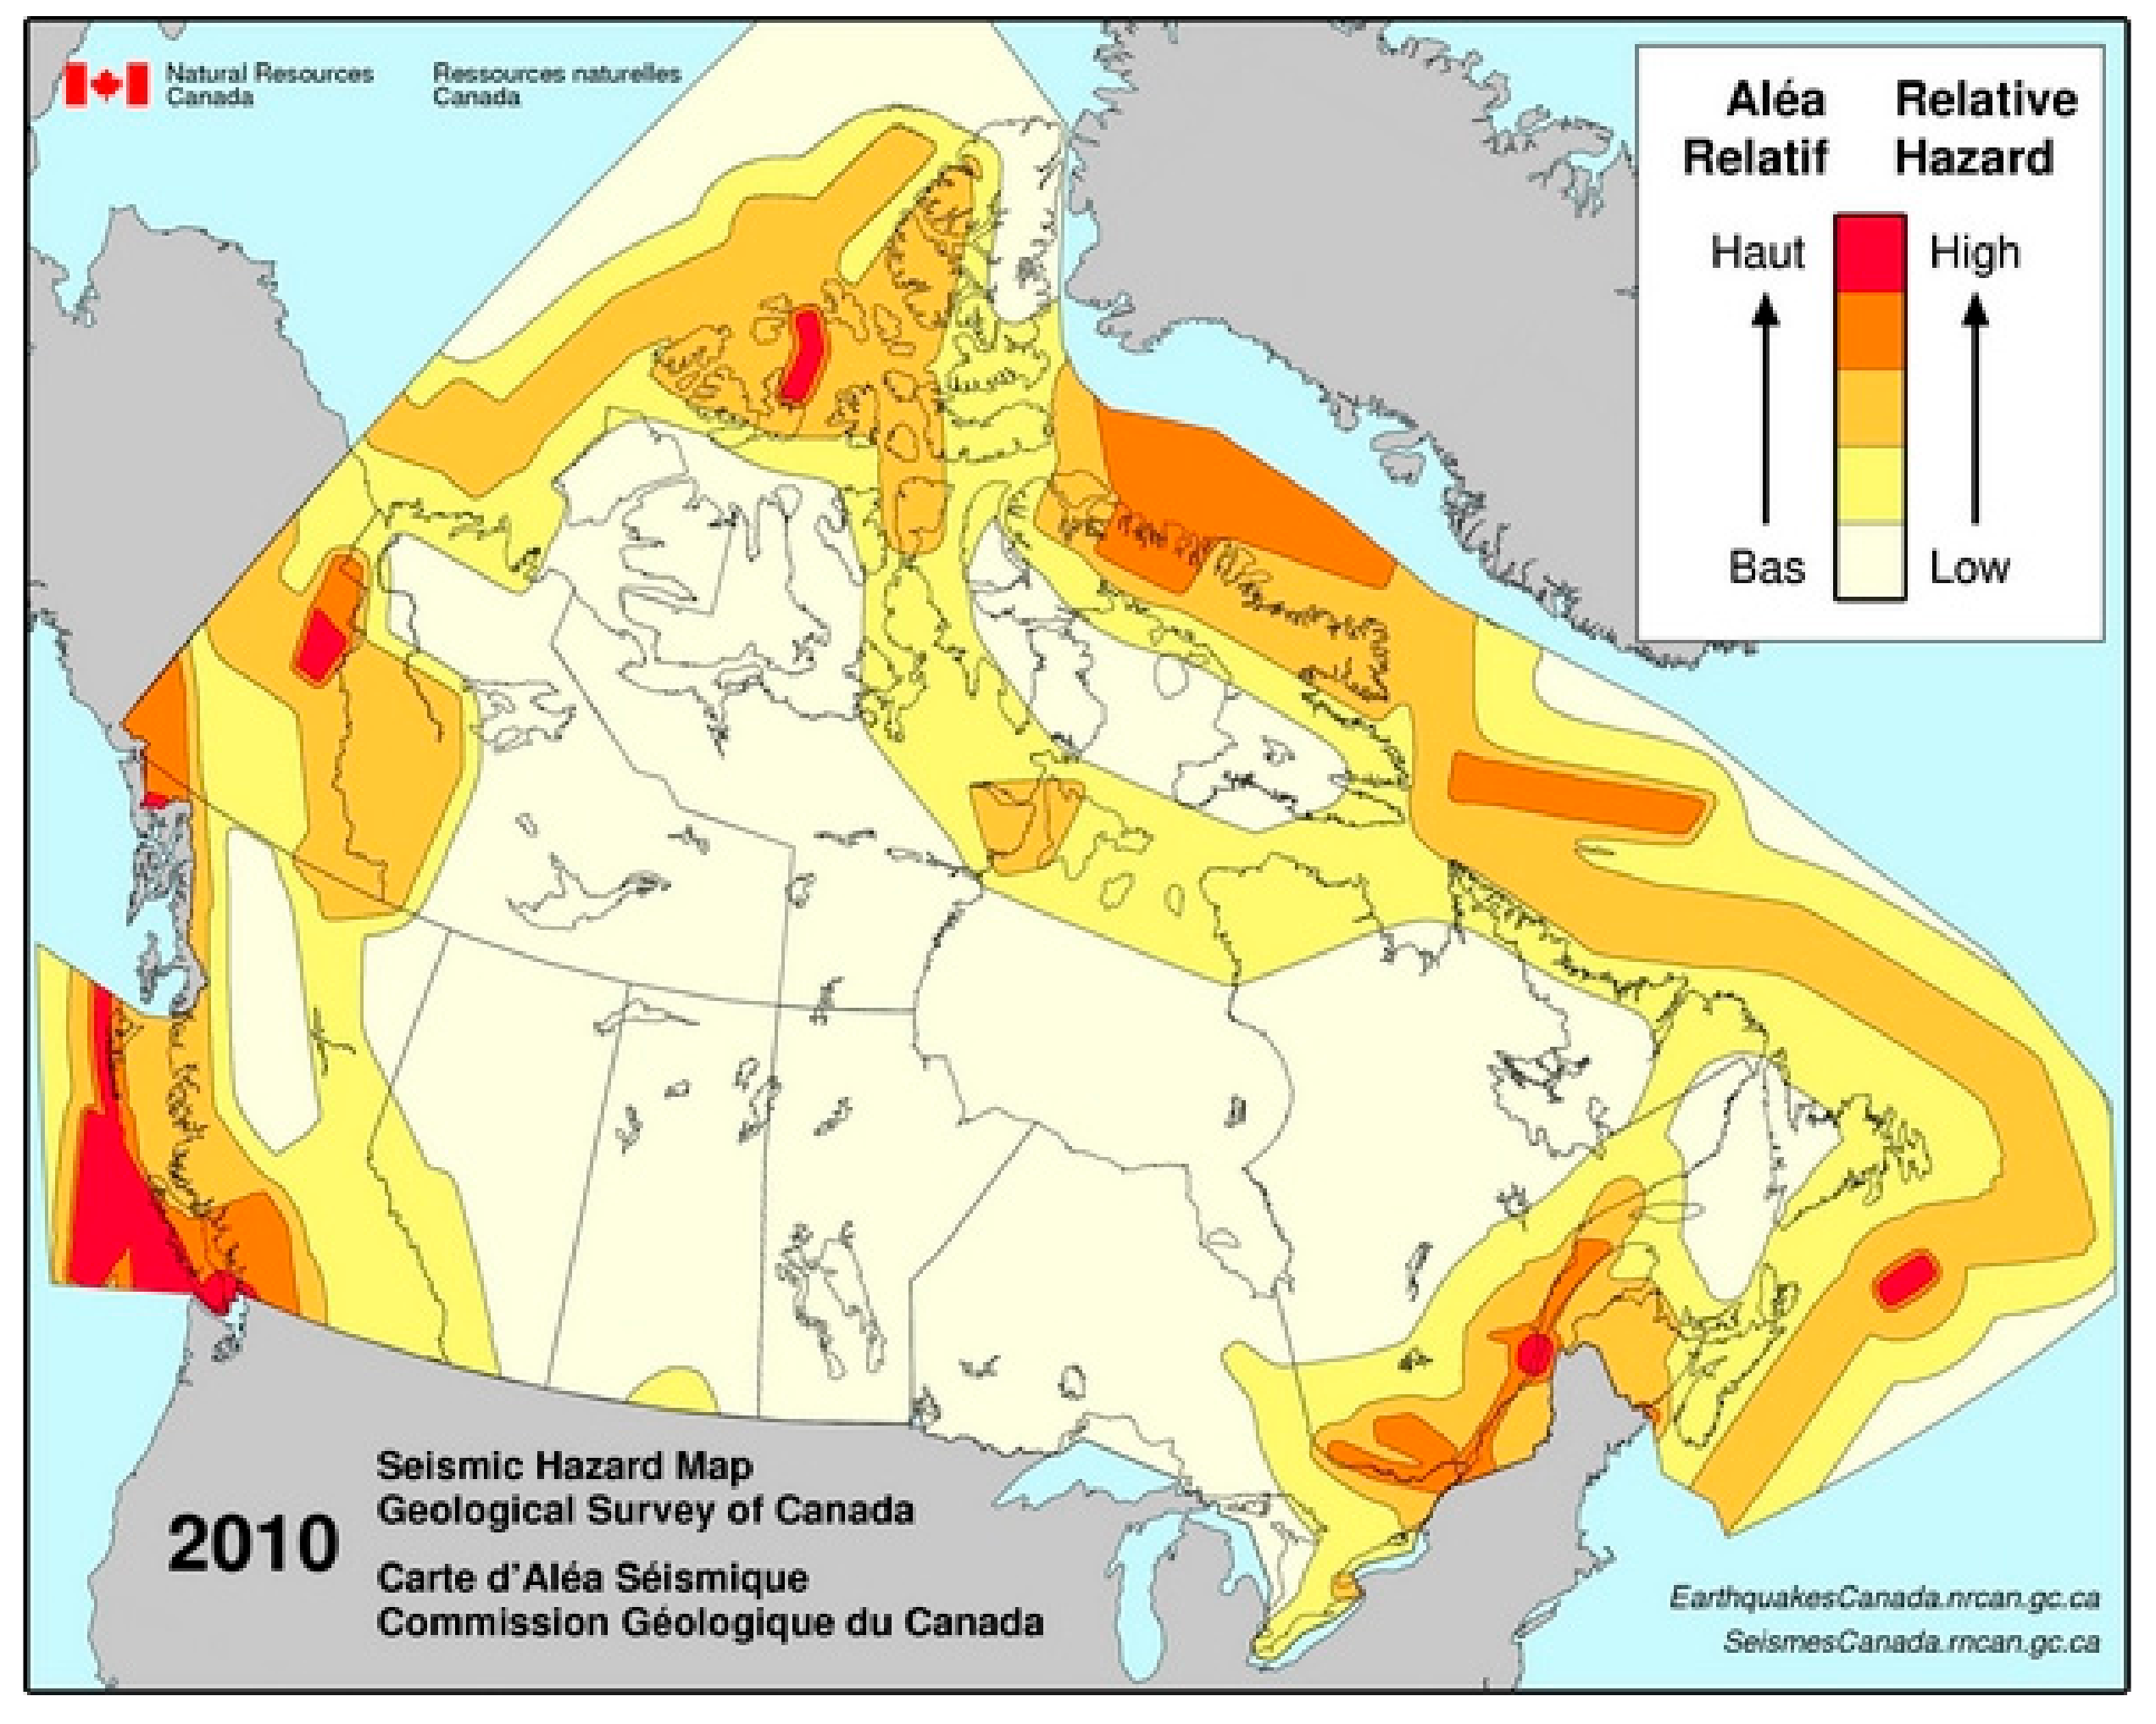
The motivation behind this particular research stems from recognition of the fact that several parts of Canada are highly vulnerable to seismic activity, which poses a serious threat to the aging highway infrastructures. Recent geological reports have already highlighted the western regions of British Columbia as the most active parts in Canada, which includes Vancouver Island and the Queen Charlotte Islands. This portion of the country is struck by earthquakes more than 200 times a year. Figure 1 presents the seismic hazard map for Canada provided by Natural Resources, Canada (www.earthquakescanada.ca) from which the seismic vulnerability of British Columbia can be envisaged. Most of the bridges in this region also undergo severe climate condition. Due to cold winters and hot summer, bridges experience many freeze-thaw-heat cycles in their service lifetimes, which affects their durability. Exposure to freeze-thaw-heat cycles also expedites the corrosion process of the reinforcing steel by initiating cracks in the concrete while concrete pores expand due to freezing. This also helps de-icing salts get inside the concrete causing further degradation of the reinforcing steel [33,34,35,36,37]. Bridges near marine environments like in western British Columbia are subjected to sea salt exposure, which causes severe chemical and physical deterioration to structures making these structures more vulnerable. Therefore, continuous inspection and risk assessment of BC highway bridges are of utmost importance. Moreover, many of the bridges in British Columbia are old and may have reached the end of their service lives where many need to be repaired or replaced. Since their construction, the seismic design guidelines for the province have also seen several improvements. Figure 2 shows the cumulative distribution function for the construction year of BC highway Bridges, which shows that nearly 40% of all bridges were built before 1970 when the first probabilistic seismic hazard map for Canada had been developed [38]. This clearly indicates that many existing bridges were designed without adequate consideration of the seismic hazards of the region. Additionally, bridges built before 1970 did not use air-entrained concrete or epoxy coated reinforcement to protect them from the effects of freeze-thaw cycles or de-icing salt, resulting in severe deterioration of different bridge components [39]. Some recent reports have highlighted the fact that Canadian municipal infrastructure is rapidly approaching its breaking point, a high percentage of which includes the highway bridges. Over time the continuing deterioration, reduced maintenance, and rapid aging of the infrastructures have substantially increased the anticipated repair or replacement cost [40]. If not maintained or retrofitted properly, these structurally deficient infrastructures would lead to similar catastrophic events like the highway overpass collapse in 2006 in Laval, Quebec, the I-35W bridge collapse in 2007 in Minneapolis, or the recent collapse of the I-5 Bridge in 2013 in Washington. Considering these facts, it is now critical to generate an updated portfolio of Canadian highway bridges, which will help develop the Bridge Infrastructure Management System (BIMS) for Canada.
3. Bridge Inventory Analysis
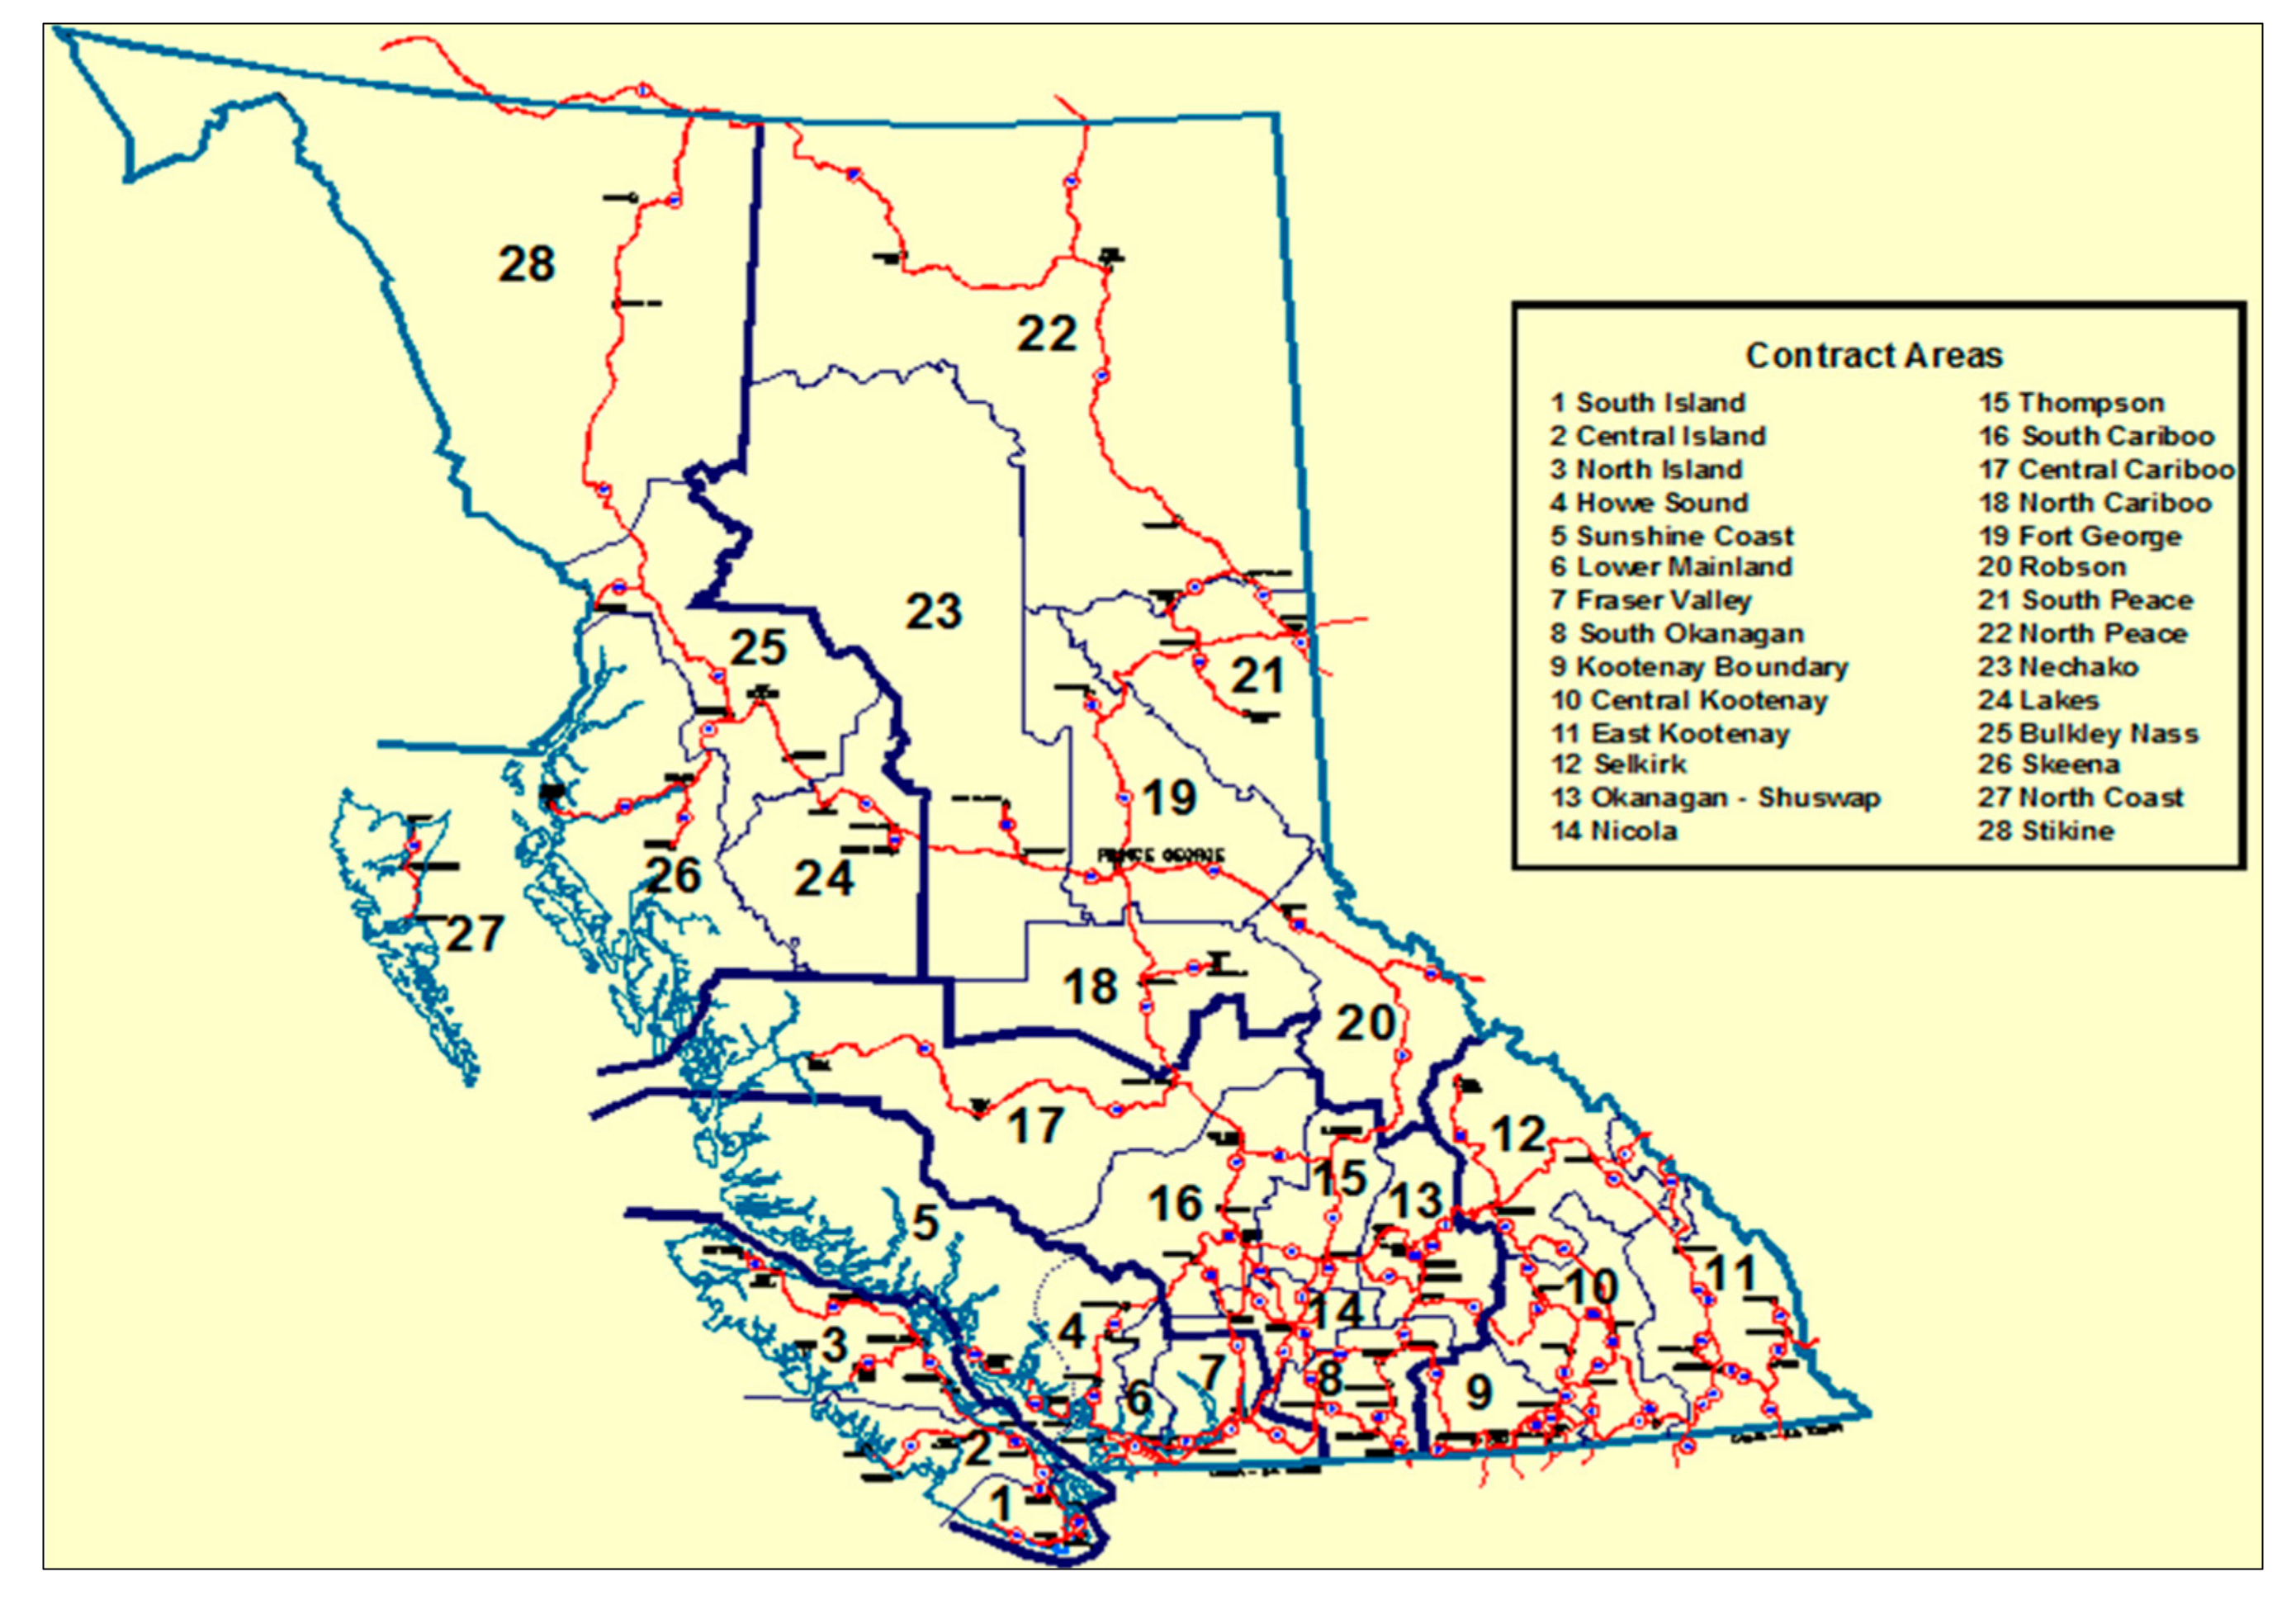
Bridge inventory analysis is intended to classify the typical bridge types along with their general parameters (e.g., total length, span number, year of construction, bridge condition index, pier and foundation type, etc.) that can represent a significant number of similar bridges of that region. In this particular inventory, a total 2555 number of highway bridges are identified under the responsibility of BC MoT. For the ease of handling of this large number of data, the whole BC region is subdivided among 28 contract areas as shown in Figure 3. The percentage of highway bridges that belong to a particular area is shown in Table 1. It can be observed that the southern parts of BC contain almost 80% of all the highway bridges of the province.
The inventory results in a total of 13 typical bridge classes depending on their construction material type, number of spans, construction system, and span continuity. Though the database is not sufficient for describing each bridge and its parameters completely, it is satisfactory to categorize each bridge to a typical class. Materials that were generally used for constructing most of the bridges are listed as steel, cast in place and precast concrete, untreated timber, and glulam. The most common bridge superstructure systems enlisted in the database are provided in Table 2. In BC most of the bridges are constructed using rectangular/I girder and box girder construction systems and a few of the others fall in the categories for suspension and cable stayed bridge system. Culverts and tunnels are not considered in the typical bridge classes as they have different construction systems unlike bridges. Table 3 shows all the typical bridge classes along with their numbers and corresponding percentages in the bridge inventory.
Bridges that fall into these 13 typical bridge classes almost cover more than 96% of all highway bridges under the supervision of BC MoT. Among those bridges, reinforced concrete bridges include 46.5% whereas steel and timber bridges include 29.3% and 20.1%, respectively. Figure 4 focuses on the distribution of highway bridge types in BC in terms of construction material of the superstructures over a span of 63 years from 1940–2003. It shows the trends in using steel, concrete, and timber as construction material for highway bridges in BC in terms of percentage over a 10 year span with the number of total bridges constructed in that period at the top of each column. Conclusions that can be drawn from Figure 4 are as follows:
- There is an increasing trend in the use of concrete bridges compared to steel bridges. After 1970, the percentage of concrete bridges including pre-tensioned and post-tensioned concrete bridges increases in a rapid manner, which is also a common phenomenon in other regions of Canada considering the high construction cost and difficulties in the maintenance of steel bridges.
- Almost 70% of timber bridges are constructed from 1960 to 1980 after which a gradual decrease can be observed in using timber as a construction material for bridges in BC.
4. Bridge Class Parameter
All the bridges present in the inventory are classified according to their construction material, construction system, number of span, and their continuity. The other factors available to give a more in depth knowledge about the types and their geometric configurations include: (i) geometry of the bridge i.e., bridge length, deck width, skewness, etc.; (ii) pier or abutment type; (iii) pier material; (iv) foundation type; (v) year of construction; and (vi) bridge condition rating. While assessing the vulnerability of any typical bridge class under any hazard by using the fragility curve, these parameters are required for reliable analytical modeling with some defined uncertainty that can cover a large variety of bridges of that class. Parameters such as year of construction and bridge condition index give an understanding on the level of uncertainties in material properties in terms of deterioration and material aging compared to the as built drawing. Extensive statistical analyses have been carried out to represent theses parameters to realize the existing and future trend of highway bridge construction in BC. For some parameters like total length of bridges, maximum span length, number of spans, and skew angle, statistical tools like mean, mode, standard deviation, and range are useful to have a good synopsis. In other cases, probabilistic solutions like cumulative distribution or frequency analysis of these parameters are convenient.
4.1. Total Bridge Length and Maximum Span Length
The total bridge length as well as the individual span length are proper estimates of bridge size and its significance. Here, the total length of the bridge and maximum span length is provided in meters. For most of the cases, the maximum span length corresponds to the middle span with a few exceptions. The Cumulative Distribution Function (CDF) of this parameter is provided in Figure 5 and Figure 6, respectively, to visualize the percentage of bridges that fall under a certain range of length or below. The CDF represents the probability that a real-valued random variable X will be found equal or smaller than x. The CDF of a real-valued random variable X can be shown as:
In order to plot the CDF, at first the bridges are arranged in ascending order of the parameter of interest starting from the smallest and the CDF is assigned to the ith bridge as CDF = i/N, where N is the total size of the data. For example, the bridges that fall under the category of “SSG Concrete” class are arranged in ascending order starting from the bridge of 6 m span to 55.2 m span and are provided with a number from 1 to 218. Then the CDF is assigned to the ith bridge as CDF = i/218. From the CDF plot of any typical bridge class, an optimum range of bridge length that covers a large number of bridges of that class can be recognized. For instance, while taking into consideration the multispan timber girder bridges, one can choose a range of values from 10–60 m for total bridge length with a maximum span length from a range of 5–20 m that actually covers almost 90% of all timber girder bridges in BC. Apart from these, other summaries are provided below:
- Almost 90% of multispan concrete box girder bridges (MSBG Concrete) have a total bridge length of 10–90 m whereas for multispan concrete girder bridges (MSG Concrete) 90% of them lie within a range of 20–120 m. Among the four types of multispan concrete bridges (Table 3), multispan simply supported girder bridges (MSSG) form the longest with a maximum length of 1200 m.
- Similar estimations can be made for maximum span length. While 90% of the MSBG concrete bridges have a maximum span length of 10–20 m, the range for 90% MSG concrete bridge is 20–40 m.
- Single span bridges are much smaller than other category bridges where most of them are covered within a range of 10–60 m. Among these five types of bridges, single span truss bridges are the longest ones.
- Multispan steel bridges comprise the longest bridges of all the categories considering 70% of the steel bridges have a span length ranging from 100–300 m. Steel bridges cover a large variety of span lengths from 20–60 m.
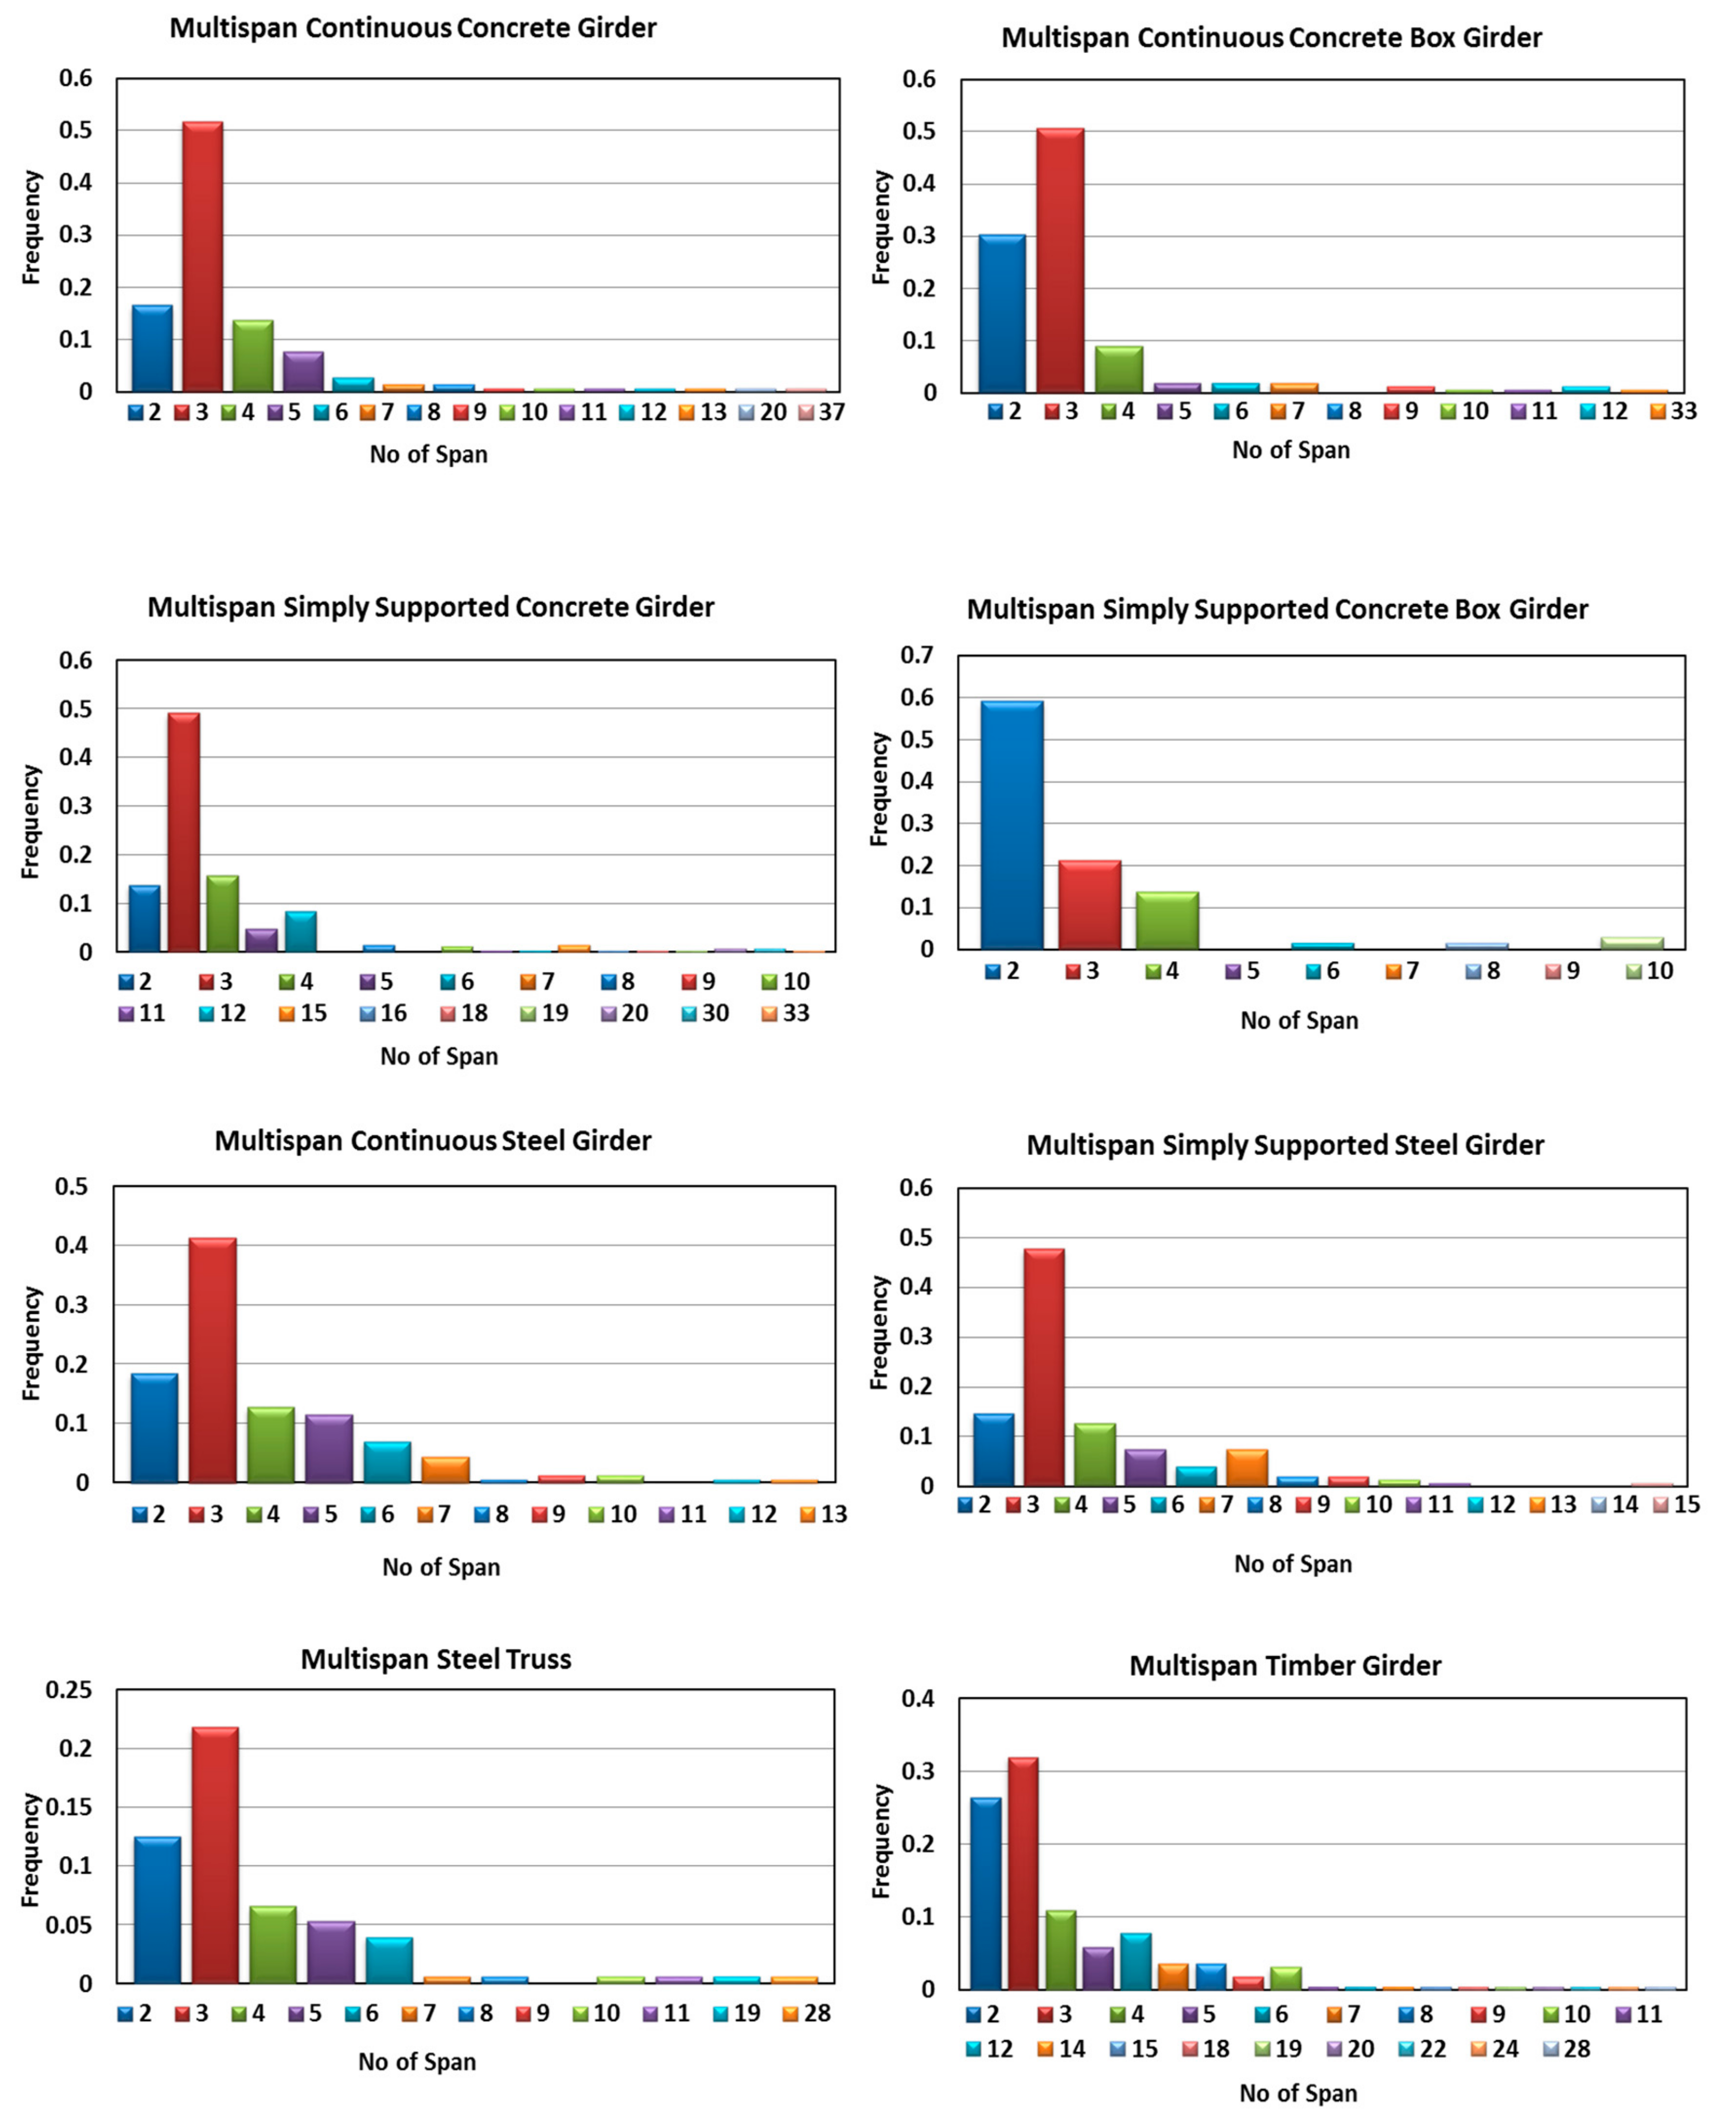
4.2. Number of Bridge Spans
All the bridges considered in the bridge inventory are subdivided into two broad categories: single span and multiple span bridges depending on the number of spans. For multispan bridges, estimating the number of spans is essential. Here, probability mass function (PMF) is used instead of CDF to describe the frequency of any specific number of spans as it is a discrete variable. PMF provides the probability of a discrete variable that is exactly equal to some specified value. PMF for the number of spans is calculated by dividing the number of occurrences of that span by the total number of multispan bridges present in the inventory. The PMF of span number for each bridge type is shown in Figure 7. From this figure, it can be concluded that:
- For all bridge types except for simply supported concrete box girder bridges (MSBG Concrete), most are constructed with three spans. For the MSBG Concrete bridge class, bridges with double span are most common.
- Timber girder bridges are generally comprised of a higher number of span with smaller span lengths.
4.3. Deck Width
Bridge deck width is another important parameter for the exact analytical modelling of a complete bridge. Bridge deck repair is one of the most common maintenance works by highway agencies. Therefore, deck width information is important to estimate the deck repair cost. It also gives an estimate about the lane numbers, amount of dead load, and vehicular load. However, the inventory does not provide any information about the deck thickness. In this inventory, the bridge deck is measured from out to out distance including the roadway and pedestrian walkway and is presented here in meters. For an appropriate estimation of bridge deck width, graphical statistics for different bridge classes are presented here in Figure 8 in terms of minimum, 25th percentile, median, 75th percentile and maximum deck width. It is interesting to observe that though all the bridge classes cover a large range of deck widths, for most of them the 75th percentile lies within 10 to 15 m. Single span concrete girder (SSG concrete) bridges consist of the maximum deck width whereas bridges of this category are smallest in the group in terms of total length. This phenomenon can be justified, because most of the single span girder bridges are used on the highway for narrow creek crossings. Deck widths for a similar category of bridges cover almost similar range of values, irrespective of the fact of whether it is a single span or multiple span bridge. For timber girder bridges and steel truss bridges, most of the bridges are within a span of 3–13 m. From the box plots, it can be observed that all the deck width distributions are positively skewed except for the SST Steel (negatively skewed) and the MSSBG concrete (uniformly distributed).
4.4. Skew Angle
Bridge skew angle is defined as the angle between the intermediate pier or abutment central axis and the perpendicular to the centerline of the roadway. Because of the land geometry, alignment of the highway, and obstacles, sometimes it is required to construct skewed bridges, which is a common phenomenon in BC. Skewness is an important parameter as large skewness has the capability to alter the force distribution in the deck or girder and has a large effect on changing the behavior of the bridge during an earthquake. In BC, it is not uncommon to find bridges with skewness as high as 60°. Here the statistics for the percentage of non-skewed bridges and bridges having a skew angle between 1–15°, 16–30°, 30–45°, and greater than 45° are provided with an estimate of mean, median, and standard deviation in Table 4. Important notes that can be pointed out from the Table are:
- Steel truss bridges are mainly non-skewed bridges with a very few exceptions.
- For skewed concrete girder bridges, most of them have a skew angle that lies between 16–30°.
- Steel and timber girder bridges are less skewed than the concrete girder bridges, however, it is not uncommon for these bridges to have skew angle more than 45°.
4.5. Year of Construction
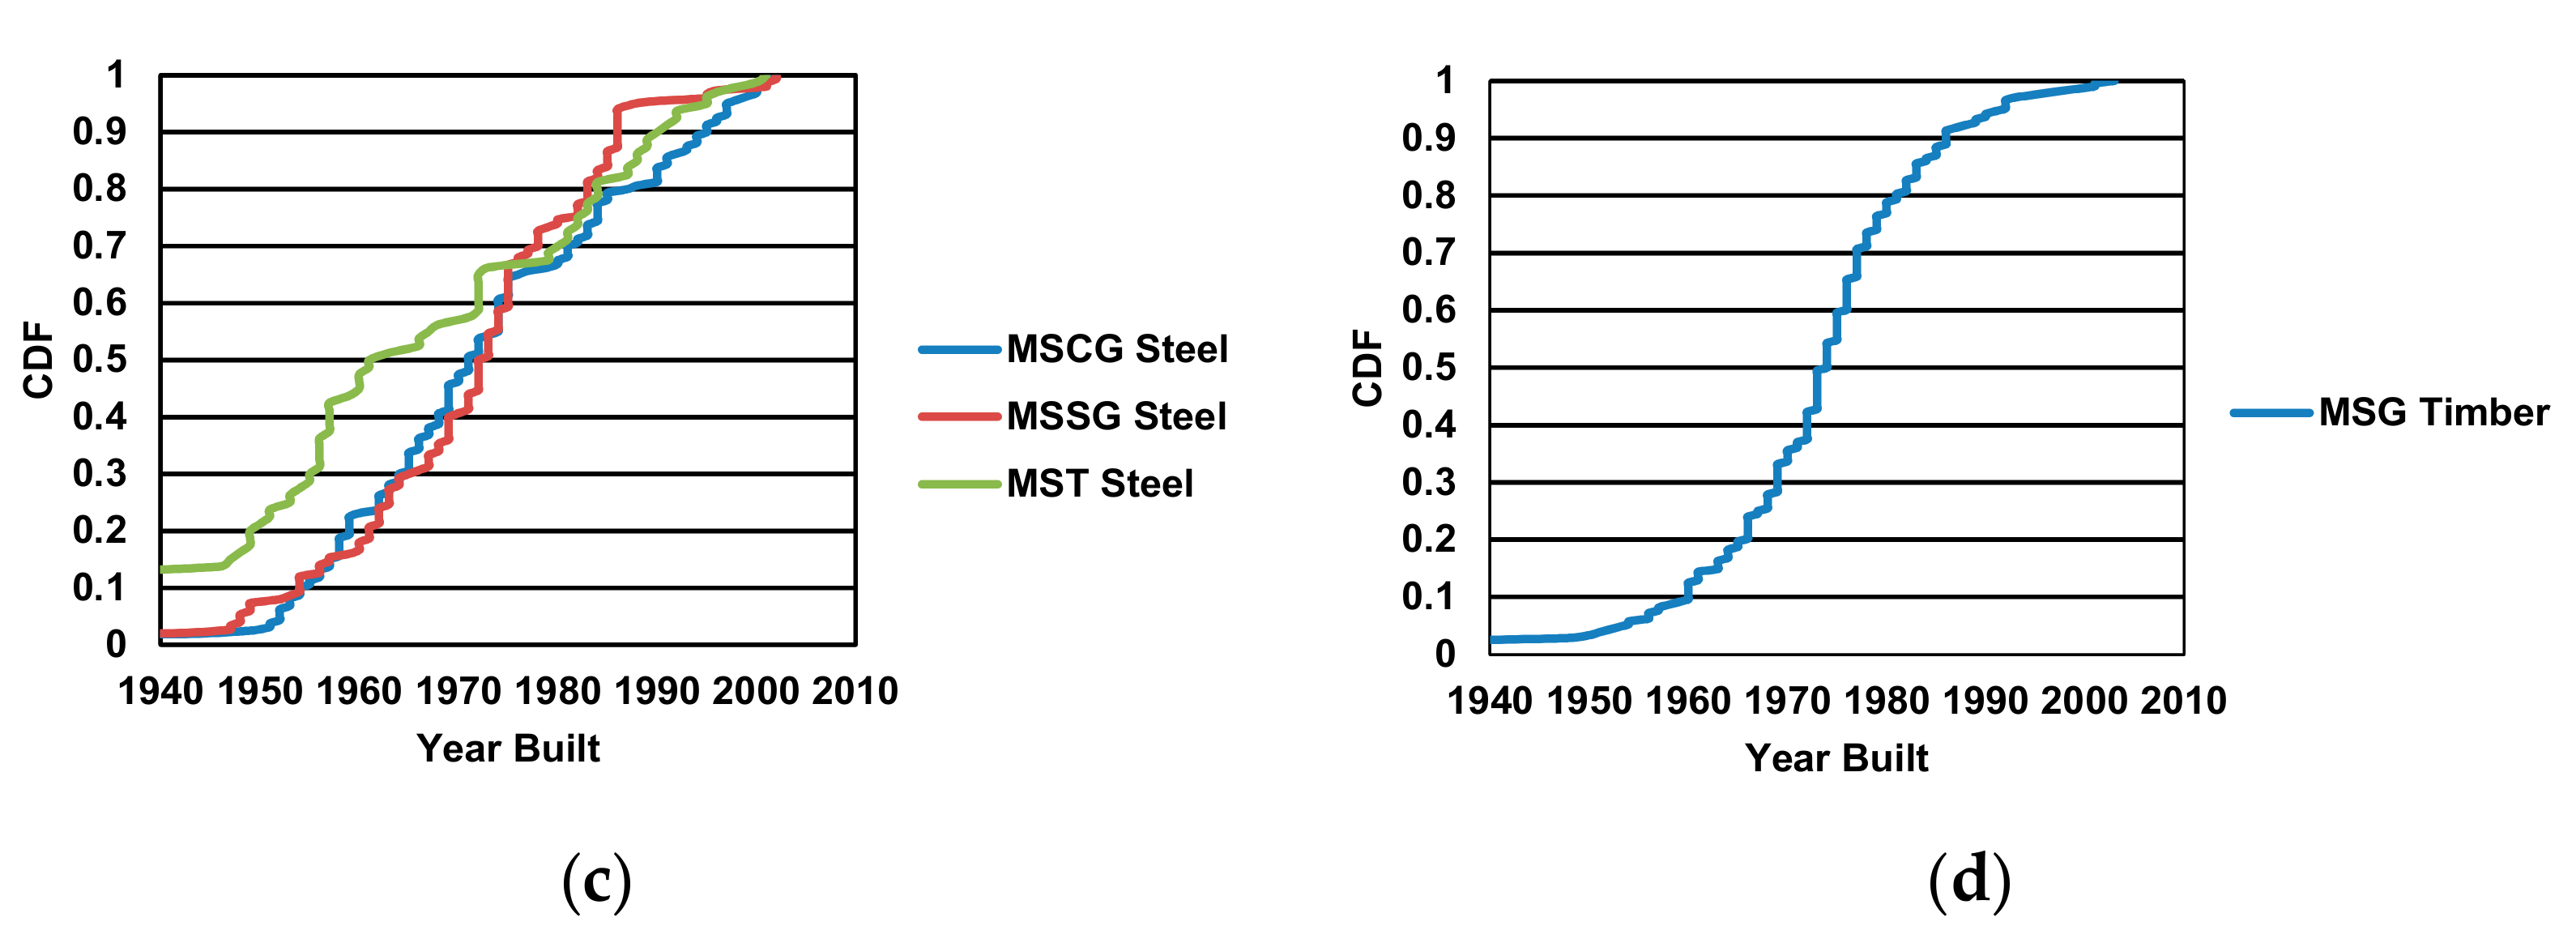
Year of construction can be a valid indication for the bridge model uncertainty in terms of material aging. It also provides information on the bridge design standards that were followed in the design process. It also indicates the existing and future trends of construction systems. From the CDF of construction year in Figure 9, it can be observed that a large percentage of bridges were built at a time when there was a lack of seismic design codes for bridges. Additionally, old bridges are continuously subjected to the destructive effects of material aging, widespread corrosion of steel reinforcing bars in concrete structures, and corrosion of steel structures and components that contribute to the uncertainty in the model compared to the as built design data. This information is of importance to visualize the current condition of bridges and can contribute in predicting their future condition considering their life span. For efficient prioritization of the maintenance and retrofitting work, bridges should be categorized under different labels in terms of their construction age.
- From the sudden steep slope of the CDF of timber girder bridges (mid portion of Figure 9d), it can be summarized that most of the timber bridges were constructed within the period of 1970–1980 whereas after 1980, the slope flattens indicating a significant reduction in timber bridge construction.
- Since 1980, an increase in the number of concrete bridges is noteworthy (Figure 9b). After 1980, there was a decreasing trend in the steel bridges, especially for steel truss bridges. Steel truss bridges are much older compared to the other steel bridge types.
Construction year is of some use from the seismic point of view for those bridge inventories have no seismic retrofit or upgrade to date. Although bridge engineers may consider it a weak indicator of the material condition, it may provide some indication particularly when the actual condition of the bridge is not available from manual inspection.
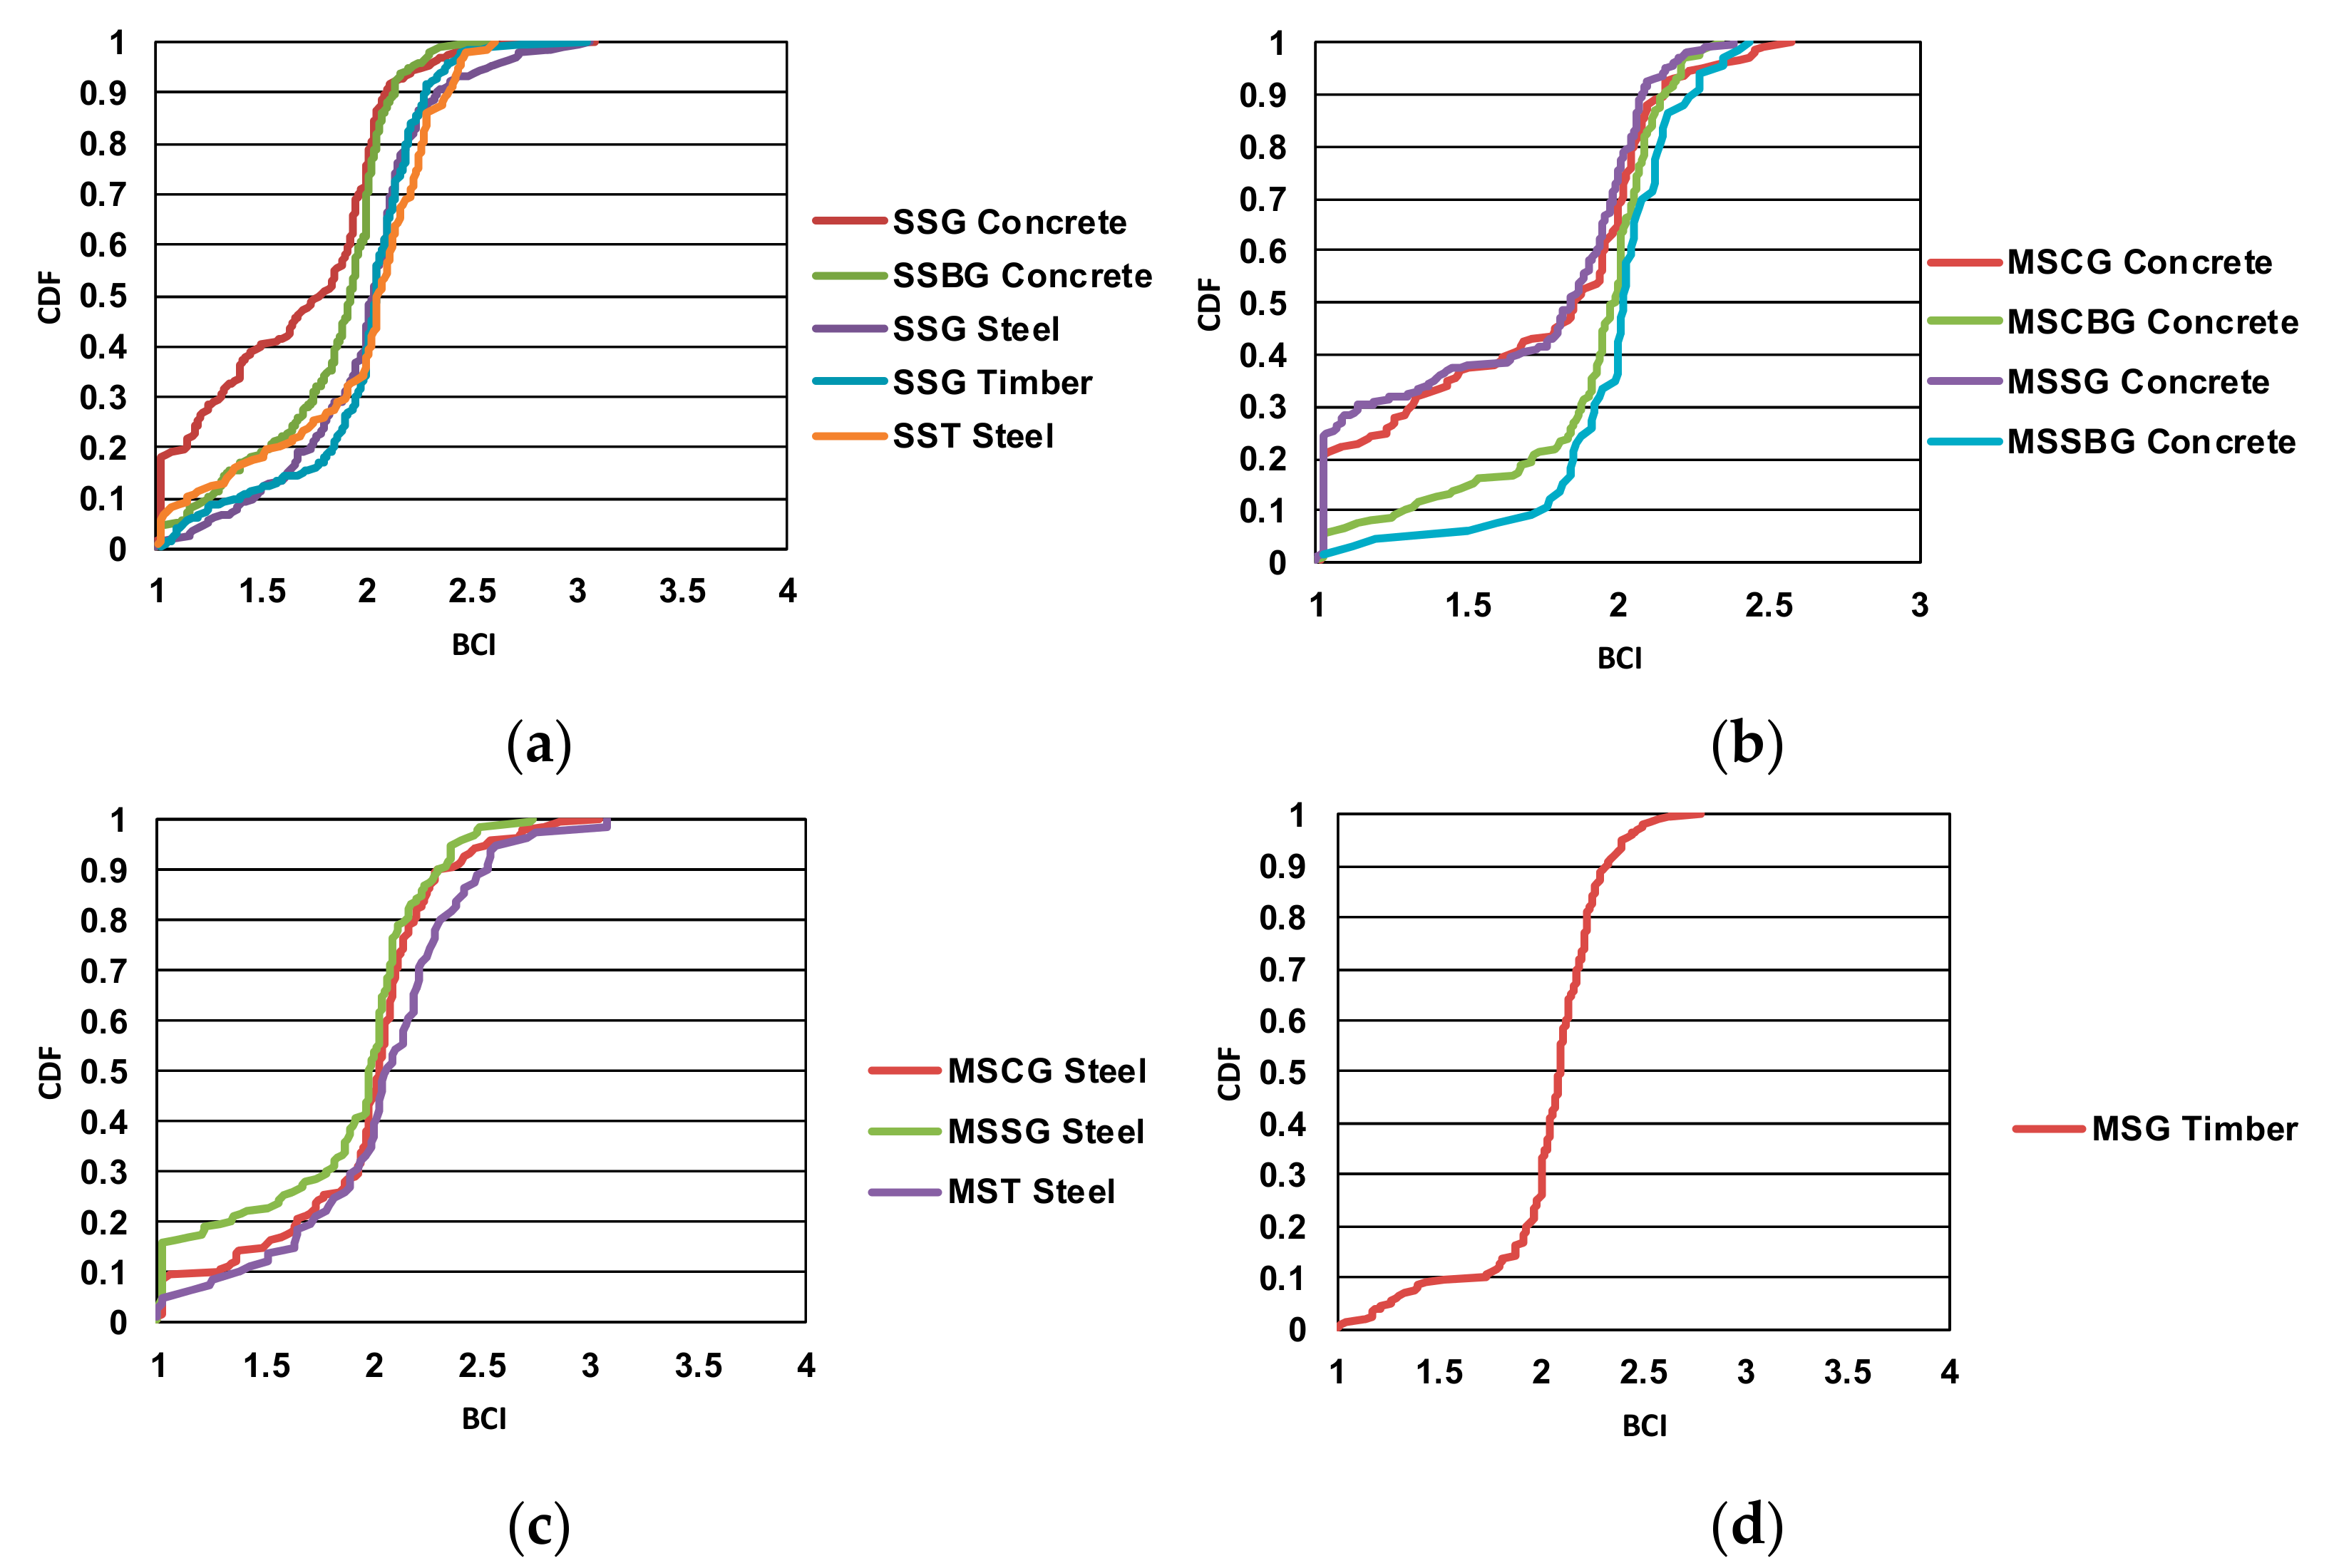
4.6. Bridge Condition Index (BCI)
Bridge Condition Index (BCI) is a new emerging tool for developing a proper BIMS. In British Columbia, almost 50% of all bridges are built before 1980. As a result of aging and continuous deterioration, few of these infrastructures might have reached the end of their service lives and need to be replaced or brought under continuous health monitoring. BCI value is a good indicator of such condition. It is a planning tool that helps the ministry of transportation schedule their maintenance and repair works on priority basis. In Canada, BCI was first developed by the Ministry of Transportation of Ontario based on the current value and the replacement cost of the bridge [41]. In BC, bridges are inspected once in every year and are provided with a BCI rating, a scale that starts at 1 for new bridges and continues up to a maximum value of 5 for the worst condition. For BC highway bridges, BCI is calculated on a weighted average of component condition rating for all the applicable bridge components using the BC MoT Standards for Bridge Inspection [42]. BC MoT has defined a total of 41 Bridge components (Erosion Protection, Foundation Movement, Abutment, Wing/Retaining Walls, Embankments, Footings/Pilling, Pier Columns/Walls, Bearings, Girders, Live Load Vibration, Sag, Coating, Deck Joints, Railings/Parapet, etc.) for inspection which are further sub categorized under Hydrotechnical, Substructure, Superstructure, Deck and Approaches. To maintain consistency during inspection BC MoT has set out standards for Bridge Inspection Condition Rating [42] and allows inspector with certain credential and training only. For Inspection, BC MoT has defined 5 Condition States (CS) starting from CS 1 to CS 5 (or E, G, F, P & V) as described in Table 5. During the inspection of all applicable components of an individual bridge, Inspectors provide a condition rating for each component which is based on the percentage of each component showing characteristics of each condition states. For example, during an inspection of a particular bridge, the inspector might have observed that 94% of the abutment are exhibiting Good Condition, 5% are in Fair Condition and 1% showing sign of significant defects or Poor condition. Therefore, the Component Condition Rating is a weighted average of its condition states. Once all the applicable components have been provided with Component Condition Rating, BCI is calculated by applying rational weight factors depending on the importance that each component plays towards the overall performance of a bridge [43]. Cumulative distribution on bridge condition index for BC bridges is provided in Figure 10. According to the recent Database on Highway Bridge Condition, provided by BC MoT, a total of 2815 number of bridges including the culverts and the tunnels have been categorized under five structural condition states: Excellent, Good, Fair, Poor and Very poor as shown in Table 5. The statistics shows:
- Almost 95% of the bridges are assigned with a BCI value equal to or less than 3.0, which indicates the absence of any significant damage in the bridges in BC.
- Only 0.04% of the total 2815 bridges has suffered serious damage and needed immediate repair.
4.7. Bridge Pier and Foundation Type
For complete characterization of a bridge type, one need to define its pier, abutment, and foundation type. Pier and foundation are indispensable components that complete the load path between superstructures and hard ground. Selection of a pier type depends on many factors such as superstructure type, bridge dimension, span number, required vertical clearance over ground or water, clearance between consecutive piers, and aesthetics. In this inventory for BC bridges, 10 typical pier types have been identified based on their construction material type, number of columns in each pier, and other geometrical parameters as shown in Figure 11. Among those pier types, reinforced concrete multi column bents are the most common for highway bridges in BC. This pier type has advantages over single column or flared column while supporting a wide bridge or bridges with high skew angles, and is mostly used for grade separation over the highway. Unlike multi column bent, pile bent, and pile bent with concrete diaphragm, they are mostly used for small creek crossings. The concrete diaphragm in between the piles has no structural advantage; rather it is used for debris deflection. Treated timber pier or log pier are other important pier type in BC that are mainly used with timber girder bridges, that are less than 100 m in length. The wall type pier has advantages over other pier types because of its high lateral stiffness and can be further categorized as hammerhead wall pier and wall pier with uniform or varying cross section. The types of piers and their percentages in the context of BC bridges are provided in Table 6. From the statistics it can be observed that the multi-column bent, pile bent, wall pier, and timber pier are the governing pier types among BC highway bridges.
For the ease of data handling and decision making, the types of piers used for all multispan bridge classes are provided in Table 7. From the statistics presented here, it can be concluded that,
- Most of the concrete girder and steel girder bridges are constructed with multi column bent piers, whereas pile bent types are mostly associated with concrete box girder bridges.
- Steel bent and timber piers are typical to steel bridges and timber girder bridges, respectively, however, for the steel bridge type, concrete wall piers seemed to be preferred.
- The most common foundation types that were widely used for the construction of BC highway bridges are also listed in Table 8 along with their associated pier types.
- For bridges with single column, flared column, and multicolumn bent pier types, single column footing was always the preferred option.
- For bridges with pile bent with or without concrete diaphragm, the steel pipe pile is the most common among other available pile types such as concrete pile, steel H pile, and log pile. For different type of wall piers, steel H pile and steel pipe pile have been the best matches, unless the soil condition is good for shallow wall footing.
5. Application of Bridge Inventory Data
BC MoT is responsible for maintaining the good structural health condition of all the highway bridges in BC and for providing safe transportation throughout the province, including the management of more than 2500 highway bridges. To develop an effective BMS there is no alternative to having an accurate and comprehensive bridge inventory of the highway bridges of the region. In the USA, all jurisdictions use an almost similar approach to develop NBI for almost 605,102 bridges from all the states, which is authorized by the Federal Highway Administration (FHWA). Unlike the USA, Canada does not have an NBI of the existing highway bridges at the federal level and in some cases not even at the provincial level. In the USA and some provinces in Canada, Bridgit, Pontis, and other similar BMS software packages are used for managing bridges [44]. Information from the bridge inventory regarding the present operating condition of the bridges, bridge type, construction year, and other structural parameters are used by these software to generate the replacement cost module and deterioration module to estimate the future condition of bridges and the requirements of any necessary replacement. Considering the rapid increase in aging of highway bridges and some recent bridge failures, it is time to develop a proper BMS and NBI for bridges in Canada.
Fragility analysis is another popular tool for assessing the structural health condition of highway bridges. Fragility curves represent the probability of damage of any component or the structure as a whole when subjected to a specific level of earthquake. Fragility analysis of each bridge would be ideal, however, considering the time constraints, the most popular approach is to identify the major bridge types in the region and develop fragility curves for each bridge type. An extensive fragility analysis is performed to assess the seismic performance of the existing wall pier highway bridges in BC (Type 7 and 8 in Table 6) using information from this bridge inventory. The seismic fragility assessment requires nonlinear dynamic time history analysis of 3D finite element bridge models. For this study, 540 analytical models of wall pier bridges in BC are generated by combining the structural and geometrical parameters and uncertainties described in here [45].
6. Final Considerations
The Bridge inventory presented in this report is one of the most comprehensive resources of information on highway bridges in BC under the responsibility of BC MoT. The following conclusions can be made from this study.
- A total number of 2555 bridges have been identified and are classified into 13 typical bridge classes, which represent almost 96% of total highway bridges in the region. Among those major categories of bridges, timber girder bridges comprise more than 29% of all bridges whereas concrete girder and concrete box girder bridge types comprise 24% and 22.5% of all highway bridges in the province, respectively.
- Different structural and geometrical properties required to describe a comprehensive bridge type are also presented here which include total length and maximum span length of the bridge, deck width, number of spans, skew angle, construction type and materials used, pier and foundation type, year of their construction, structural condition rating, and location of the bridges. An in-depth analysis of the inventory has been carried out for better representation of the available data and to make essential judgments.
- While considering the age of the existing bridges, it can be concluded that 50% of the bridges from the inventory were constructed more than 35 years ago. Other statistics show that the timber girder bridges and steel bridges are considerably older compared to the concrete bridges, which indicates that the modern bridges are mostly being built with reinforced concrete.
- In general, the majority of bridges have a BCI rating between 2–2.5 which indicates a condition state that does not require immediate attention, and very few, almost less than 1%, suffer from serious defects that need immediate repair or replacement. Since most timber and steel bridges are older, they have higher BCI rating than the others.
- The inventory includes bridges that have a total length of less than 4 m to bridges over 1800 m. Almost 80% of them are within the range of 20–100 m. The number varies from 5 m to 40 m in the case of single span bridges. For multispan bridges, three spans are the most frequent except for the simply supported concrete box girder bridge type, which is mostly comprised of two span bridges.
- In BC, highway bridges with multi-column bent and timber piers are most common which comprise almost 21.89% and 21.04%, respectively, of all the bridges in the inventory. While looking into the foundation types, steel pipe pile and steel H pile are the dominating types.
This extensive repository of bridge data will not only assist us in evaluating the current structural health condition and assess the vulnerability of highway bridges in BC but also helps to estimate the future condition of bridge components and prioritize rehabilitation works. This portfolio will work as a gateway for developing an efficient Bridge Infrastructure Management System and a National Bridge Inventory for Canada.
Acknowledgments
Financial contributions of the Natural Sciences and Engineering Research Council of Canada (NSERC) through Collaborative Research and Development (CRD) Grant in collaboration with S-Frame Software Inc. were critical to conduct this research and are gratefully acknowledged. Thanks are also due to the BC Ministry of Transportation and Infrastructure (BC MoT) for providing all the necessary details of the existing bridges in BC. The contributions of Abu Hena Mohammad Muntasir Billah, Mohammad Shahnewaz, and Trevor Judd in collecting information from a large number of drawing files using the BC MoT Structural Image Database (SID) are also acknowledged.
Author Contributions
Kader Siddiquee performed the statistical analyses with the collected information on BC Highway Bridges, prepared a Bridge Inventory for the province and wrote this article under complete supervision and guidance of Shahria Alam. Shahria Alam contributed greatly towards the completion of the study and also reviewed the article.
Conflicts of Interest
The authors declare no conflict of interest. The founding sponsors had no role in the design of the study; in the collection, analyses, or interpretation of data; in the writing of the manuscript, and in the decision to publish the results. The contents of this paper reflect the view of the authors, who are responsible for the facts and accuracy of the data presented herein. The contents do not necessarily reflect the official views or policies of the British Columbia Ministry of Transportation and Infrastructure, and this paper does not constitute a standard, specification, or regulation.
References
- Chang, S.E.; Nojima, N. Measuring post-disaster transportation system performance: The 1995 Kobe earthquake in comparative perspective. Transp. Res. Part A Policy Pract. 2001, 35, 475–494. [Google Scholar] [CrossRef]
- Cho, S.; Gordon, P.; Moore, J.; Richardson, H.; Shinozuka, M.; Chang, S. Integrating transportation network and regional economic models to estimate the costs of a large urban earthquake. J. Reg. Sci. 2001, 41, 39–65. [Google Scholar] [CrossRef]
- Padgett, J.; DesRoches, R. Bridge functionality relationships for improved seismic risk assessment of transportation networks. Earthq. Spectra 2007, 23, 115–130. [Google Scholar] [CrossRef]
- Billah, A.; Alam, M.; Bhuiyan, M. Fragility analysis of retrofitted multicolumn bridge bent subjected to near-fault and far-field ground motion. J. Bridge Eng. 2013, 18, 992–1004. [Google Scholar] [CrossRef]
- Jennings, P.C. Engineering Features of the San Fernando Earthquake of February 9, 1971; Report No. EERL-71-02; Earthquake Engineering Research Laboratory, California Institute of Technology: Pasadena, CA, USA, 1971. [Google Scholar]
- Mitchell, D.; Tinawi, R.; Sexsmith, R.G. Performance of bridges in the 1989 Loma Prieta earthquake, Lessons for Canadian designers. Can. J. Civ. Eng. 1991, 18, 711–734. [Google Scholar] [CrossRef]
- Basoz, N.I.; Kiremidjian, A.S.; King, S.A.; Law, K.H. Statistical analysis of bridge damage data from the 1994 Northridge, CA earthquake. Earthq. Spectra EERI 1999, 15, 25–53. [Google Scholar] [CrossRef]
- Bruneau, M.; Wilson, J.W.; Tremblay, R. Performance of steel bridges during the 1995 Hyogo-ken Nanbu (Kobe, Japan) earthquake. Can. J. Civ. Eng. 1996, 23, 678–713. [Google Scholar] [CrossRef]
- Chang, K.C.; Chang, D.W.; Tsai, M.H.; Sung, Y.C. Seismic performance of highway bridges. Earthq. Eng. Eng. Seismol. 2001, 2, 55–77. [Google Scholar]
- Hsu, Y.; Fu, C. Seismic effect on highway bridges in Chi Chi earthquake. J. Perform. Constr. Facil. 2004, 18, 47–53. [Google Scholar] [CrossRef]
- Kawashima, K.; Unjoh, S.; Hoshikuma, J.I.; Kosa, K. Damage of Bridges due to the 2010 Maule, Chile. Earthq. J. Earthq. Eng. 2011, 15, 1036–1068. [Google Scholar] [CrossRef]
- Mitchell, D.; Huffman, S.; Tremblay, R.; Saatcioglu, M.; Palermo, D.; Tinawi, R.; Lau, D. Damage to bridges due to the 27 February 2010 Chile earthquake. Can. J. Civ. Eng. 2012, 39, 675–692. [Google Scholar]
- Mander, J.B. Fragility curve development for assessing the seismic vulnerability of highway bridges. In Research Progress and Accomplishments: 1997–1999; Stoyle, J.E., Ed.; Multidisciplinary Center for Earthquake Engineering Research (MCEER): Buffalo, NY, USA; pp. 89–98.
- Choi, E.; DesRoches, R.; Nielson, B. Seismic fragility of typical bridges in moderate seismic zones. Eng. Struct. 2004, 26, 187–199. [Google Scholar] [CrossRef]
- Pan, Y.; Agrawal, A.; Ghosn, M. Seismic Fragility of Continuous Steel Highway Bridges in New York State. J. Bridge Eng. 2007, 12, 689–699. [Google Scholar] [CrossRef]
- Bignell, J.; James, L. Analytical fragility analysis of southern Illinois wall pier supported highway bridges. Earthq. Eng. Struct. Dyn. 2010, 39, 709–729. [Google Scholar] [CrossRef]
- Alam, M.S.; Bhuiyan, M.A.R.; Billah, A.H.M.M. Seismic fragility assessment of SMA-bar restrained multi-span continuous highway bridge isolated by different laminated rubber bearings in medium to strong seismic risk zones. Bull. Earthq. Eng. 2012, 10, 1885–1909. [Google Scholar] [CrossRef]
- Tavares, D.H.; Suescun, J.R.; Paultre, P.; Padgett, J.E. Seismic fragility of a highway bridge in Quebec. J. Bridge Eng. 2013, 18, 1131–1139. [Google Scholar] [CrossRef]
- Decò, A.; Bocchini, P.; Frangopol, D.M. A probabilistic approach for the prediction of seismic resilience of bridges. Earthq. Eng. Struct. Dyn. 2013, 42, 1469–1487. [Google Scholar] [CrossRef]
- Cimellaro, G.P.; Reinhorn, A.M.; Bruneau, M. Framework for analytical quantification of disaster resilience. Eng. Struct. 2010, 32, 3639–3649. [Google Scholar] [CrossRef]
- Hedayati Dezfuli, F.; Alam, M.S. Seismic vulnerability assessment of a steel-girder highway bridge equipped with different SMA wire-based smart elastomeric isolators. Smart Mater. Struct. IOP 2016, 25, 075039. [Google Scholar]
- Domaneschi, M.; Martinelli, L. Earthquake-resilience-based control solutions for the extended benchmark cable-stayed bridge. J. Struct. Eng. 2016, 142, C4015009. [Google Scholar] [CrossRef]
- Ando, Y.; Sakakibara, M.; Yamandoe, S.I.; Ohbo, N. Seismic evaluation of actual bridge with isolators by vibration tests. In Proceedings of the Second World Conference on Structural Control, Kyoto, Japan, 28 June–1 July 1998; Volume 1, pp. 913–922. [Google Scholar]
- Constantinou, M.C.; Reinhorn, A.M.; Mokha, A.; Watson, R. Displacement control device for base isolation of bridges. Earthq. Spectra 1991, 7, 179–200. [Google Scholar] [CrossRef]
- Wilde, K.; Paolo, G.; Fujino, Y. Base isolation system with shape memory alloy device for elevated highway bridges. Eng. Struct. 2000, 22, 222–229. [Google Scholar] [CrossRef]
- Yang, J.N.; Wu, J.C.; Kawashima, K.; Unjoh, S. Hybrid control of seismic–excited bridge structure. Earthq. Eng. Struct. Dyn. 1995, 24, 1437–1451. [Google Scholar] [CrossRef]
- Housner, G.; Bergman, L.A.; Caughey, T.K.; Chassiakos, A.G.; Claus, R.O.; Masri, S.F.; Skelton, R.E.; Soong, T.T.; Spencer, B.F.; Yao, J.T. Structural control: past, present, and future. J. Eng. Mech. 1997, 123, 897–971. [Google Scholar] [CrossRef]
- Mufti, A. Guidelines for Structural Health Monitoring; ISIS Canada Design Manual; ISIS Canada: Winnipeg, MB, Canada, 2001. [Google Scholar]
- Pines, D.; Aktan, A.E. Status of SHM long span bridges in the United States. Prog. Struct. Eng. Mater. 2002, 4, 372–380. [Google Scholar] [CrossRef]
- Tennyson, R.C.; Mufti, A.A.; Rizkalla, S.; Tadros, G.; Benmokrane, B. Structural health monitoring of innovative bridges in Canada with fiber optic sensors. Smart Mater. Struct. 2001, 10, 560–573. [Google Scholar] [CrossRef]
- Domaneschi, M.; Limongelli, M.P.; Martinelli, L. Vibration based damage localization using MEMS on a suspension bridge model. Smart Struct. Syst. 2013, 12, 679–694. [Google Scholar] [CrossRef]
- Domaneschi, M.; Limongelli, M.P.; Martinelli, L. Damage detection and localization on a benchmark cable-stayed bridge. Earthq. Struct. 2015, 8, 1113–1126. [Google Scholar] [CrossRef]
- Janssen, D.J.; Snyder, M.B. Mass loss experience with ASTM C 666 with and without de-icing salt. In Freeze-Thaw Durability of Concrete, Rilem Proceedings No. 30; ISBN 0 419 20000 2. Chapman & Hall: London, UK, 1997; Volume 270, pp. 247–258. [Google Scholar]
- Kan, L.L.; Shi, H.S.; Sakulich, A.R.; Li, V.C. Self-healing characterization of engineered cementitious composite materials. ACI Mater. J. 2010, 107, 617. [Google Scholar]
- Harnik, A.B.; Meier, U.; Rösli, A. Combined Influence of Freezing and De-icing Salt on Concrete—Physical Aspects. In Proceedings of the 1st International Conference on Durability of Building Materials and Components, Ottawa, ON, Canada, 21–23 August 1978; pp. 474–484. [Google Scholar]
- Stark, J.; Ludwig, H.M. Freeze-thaw resistance and de-icing salt resistance of concrete made with cements of different C3A contents. In Proceedings of the Rilem International Workshop on the Resistance of Concrete to Scaling due to Freezing in the Presence of De-Icing Salts, Sainte-Foy, QC, Canada, 30–31 August 1993; pp. 93–108. [Google Scholar]
- Sakulich, A.R.; Bentz, D.P. Increasing the service life of bridge decks by incorporating phase-change materials to reduce freeze-thaw cycles. J. Mater. Civ. Eng. 2011, 24, 1034–1042. [Google Scholar] [CrossRef]
- Mitchell, D.; Paultre, P.; Tinawi, R.; Saatcioglu, M.; Tremblay, R.; Elwood, K.; Adams, J.; DeVall, R. Evolution of seismic design provisions in the National Building Code of Canada. Can. J. Civ. Eng. 2010, 37, 1157–1170. [Google Scholar] [CrossRef]
- Khanzada, K.M. State of Bridge Management in Canada. Master’s Thesis, Department of Construction Management and Engineering, North Dakota State University, Fargo, ND, USA, 1987. [Google Scholar]
- Mirza, S. Danger Ahead: The Coming Collapse of Canada’s Municipal Infrastructure; Report No. 1060 E; Federation of Canadian Municipalities: Ottawa, ON, Canada, 2007.
- Hammad, A.; Yan, J.; Mostofi, B. Recent development of bridge management systems in Canada. Proceedings of Annual Conference of the Transportation Association of Canada Saskatoon, Saskatoon, SK, Canada, 14–17 October 2007. [Google Scholar]
- British Columbia Ministry of Transportation and Infrastructure. Bridge Management Information System (BMIS) Manual; BCMoT: Victoria, BC, Canada, 2017.
- McCarten, P. Using condition monitoring data for bridge management. In Proceedings of the 6th Austroads Bridge Conference, Perth, Australia, 12–15 September 2006. [Google Scholar]
- Small, E.P.; Philbin, T.; Fraher, M.; Romack, G.P. Current status of bridge management system implementation in the United States. In Proceedings of the 8th International Bridge Management Conference, Denver, CO, USA, 26–28 April 1999. [Google Scholar]
- Siddiquee, K. Seismic Vulnerability Assessment of Wall Pier Highway Bridges in British Columbia. Master’s Thesis, The University of British Columbia, Kelowna, BC, Canada, 2015. [Google Scholar]
Figure 1.
Seismic hazard map of Canada (www.earthquakescanada.ca).
Figure 1.
Seismic hazard map of Canada (www.earthquakescanada.ca).

Figure 2.
Cumulative distribution of highway bridge construction year in British Columbia (BC).
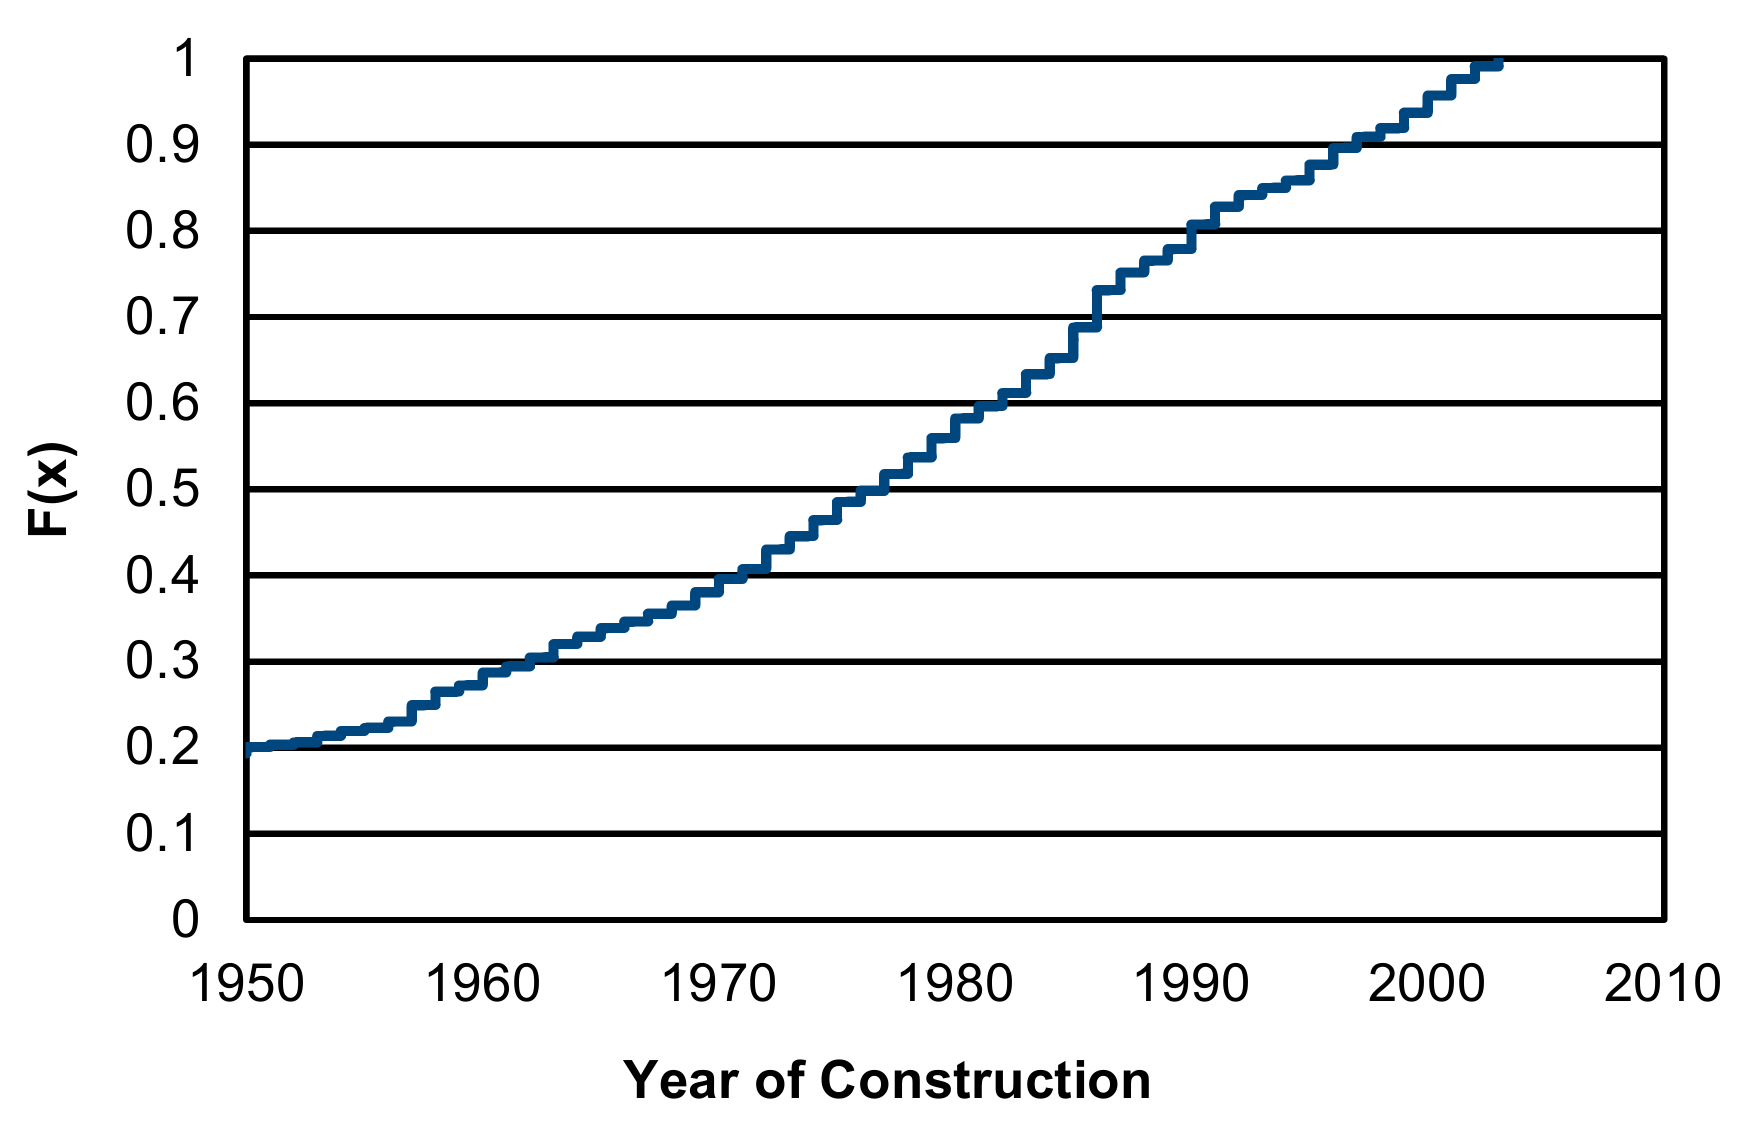
Figure 3.
Contract areas for highway bridge inventory in the British Columbia region.

Figure 4.
Distribution of bridges by year of construction and superstructure material.
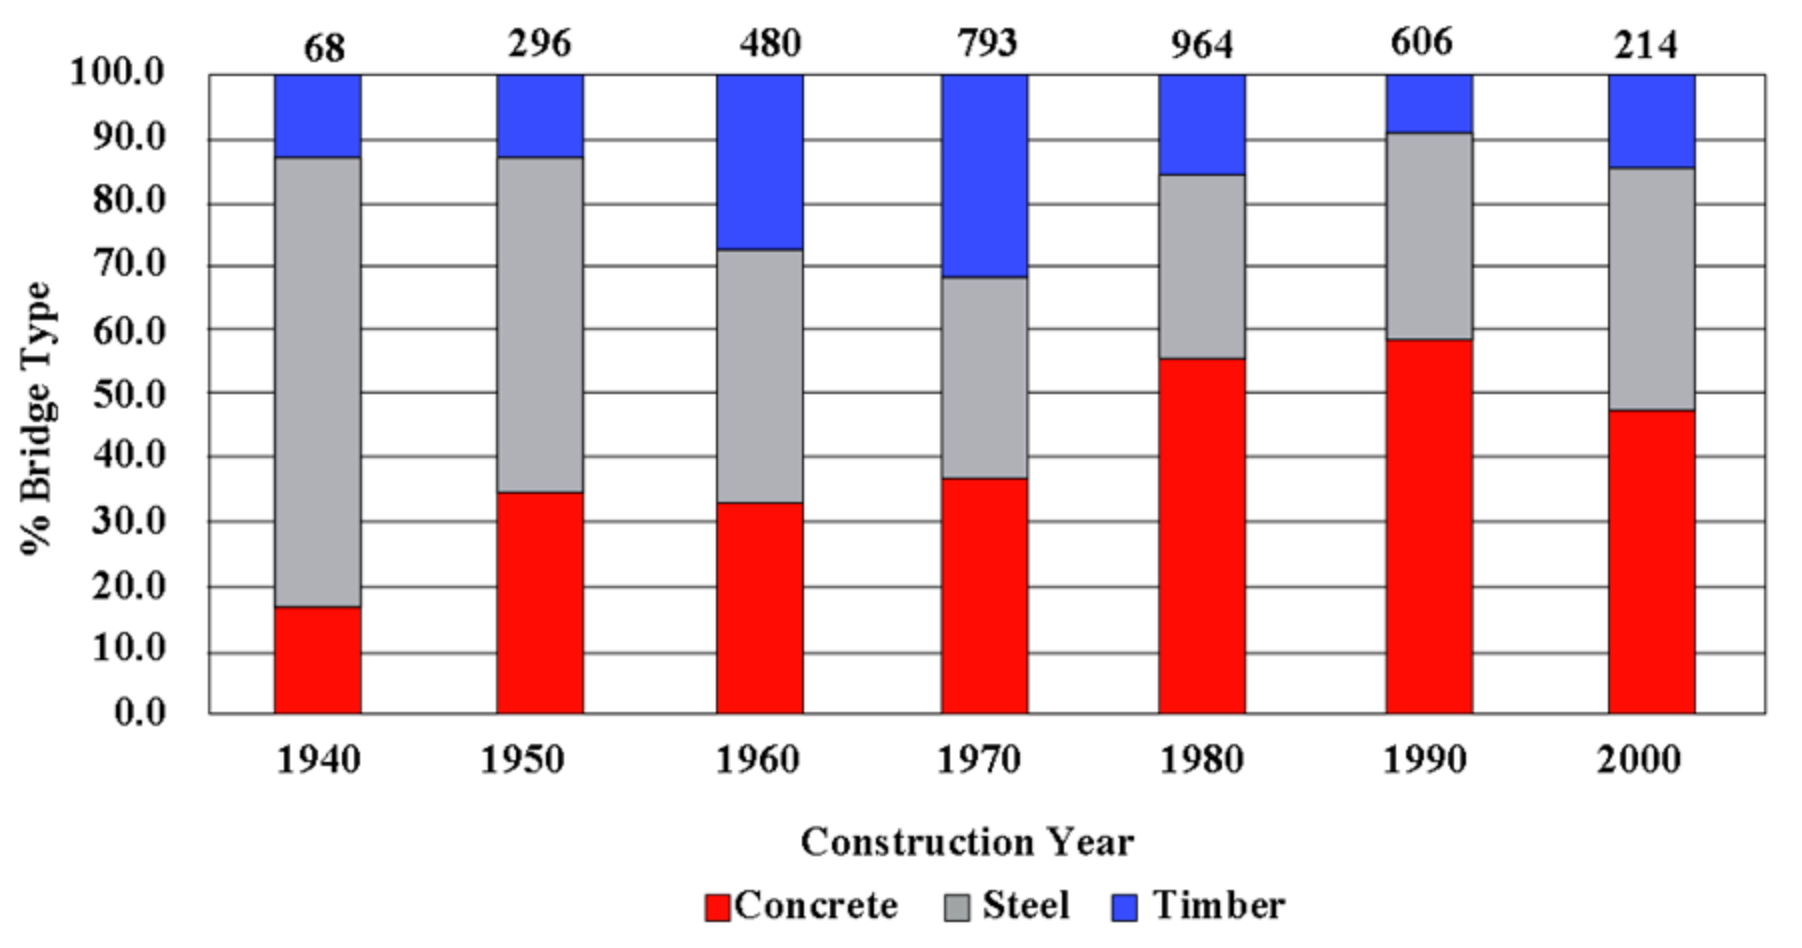
Figure 5.
Cumulative distribution function of total bridge length for (a) Simply supported (b) Multispan concrete; (c) Multispan steel and (d) Multispan timber girder bridges.
Figure 5.
Cumulative distribution function of total bridge length for (a) Simply supported (b) Multispan concrete; (c) Multispan steel and (d) Multispan timber girder bridges.
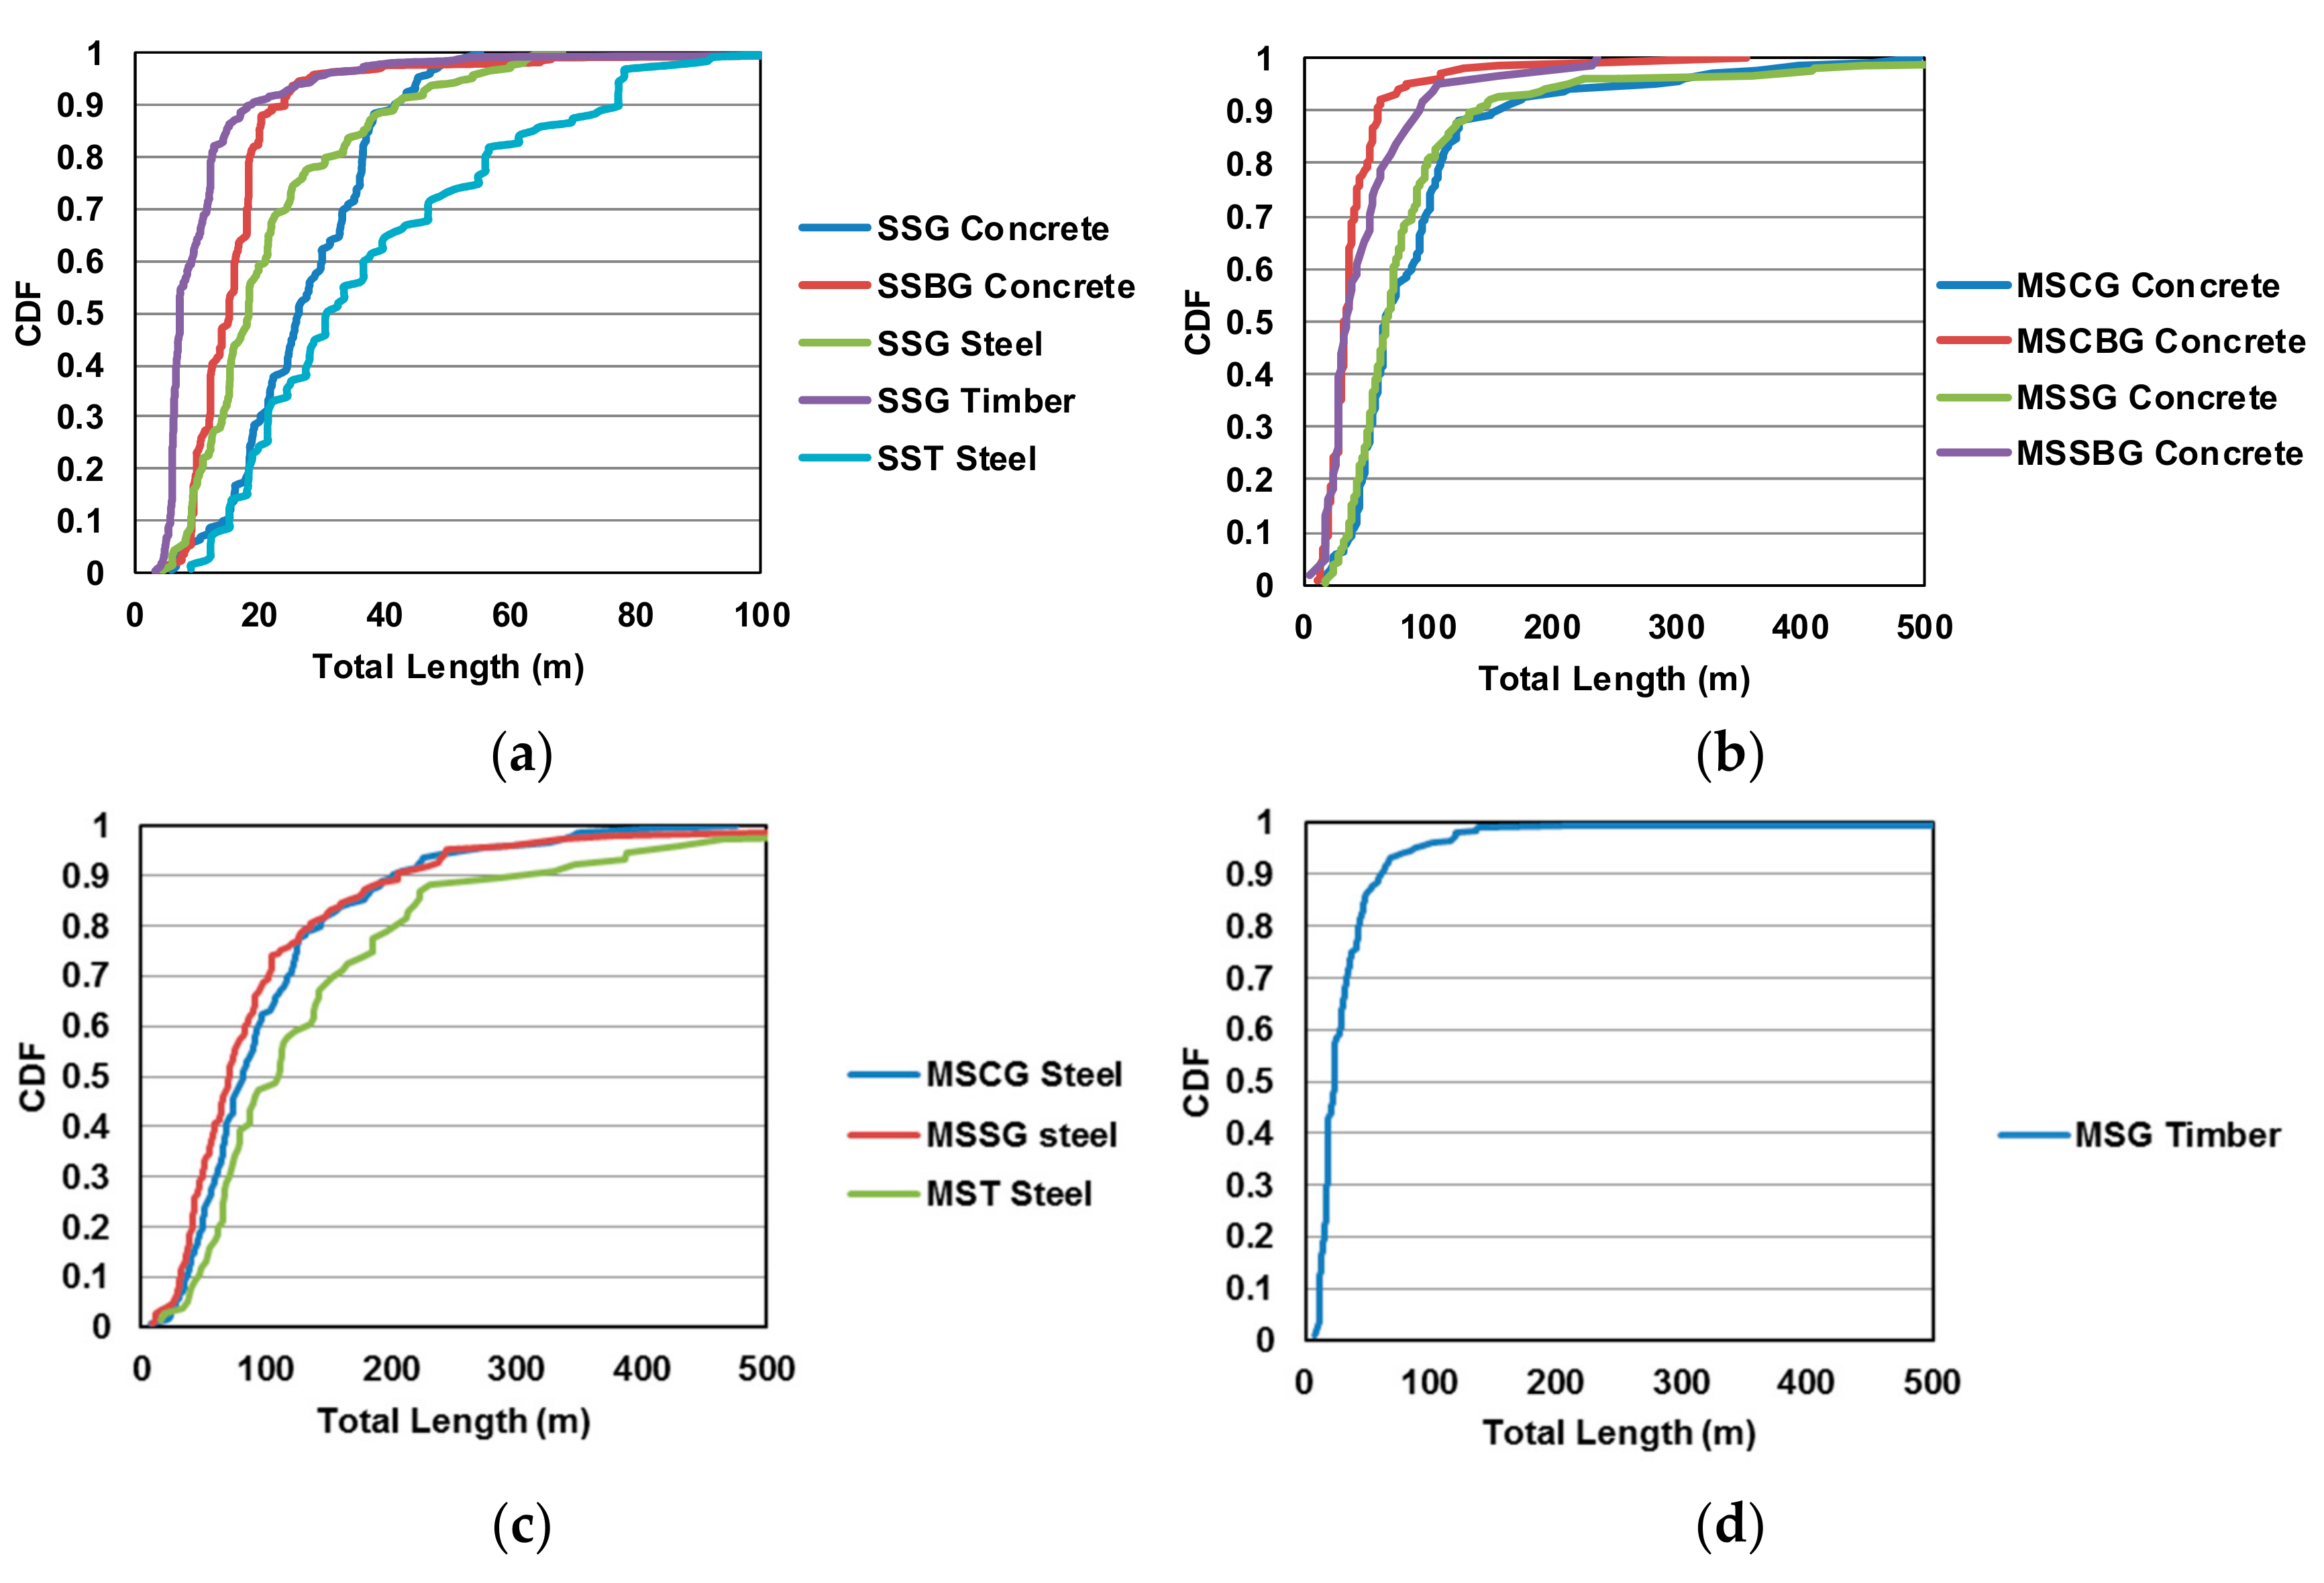
Figure 6.
Cumulative distribution function of Maximum Span length for (a) Multispan concrete; (b) Multispan steel and timber girder bridges.
Figure 6.
Cumulative distribution function of Maximum Span length for (a) Multispan concrete; (b) Multispan steel and timber girder bridges.

Figure 7.
Probability mass function for the number of bridge spans.

Figure 8.
Statistics for different bridge types showing minimum, 25th percentile, median, 75th percentile and maximum deck width.
Figure 8.
Statistics for different bridge types showing minimum, 25th percentile, median, 75th percentile and maximum deck width.
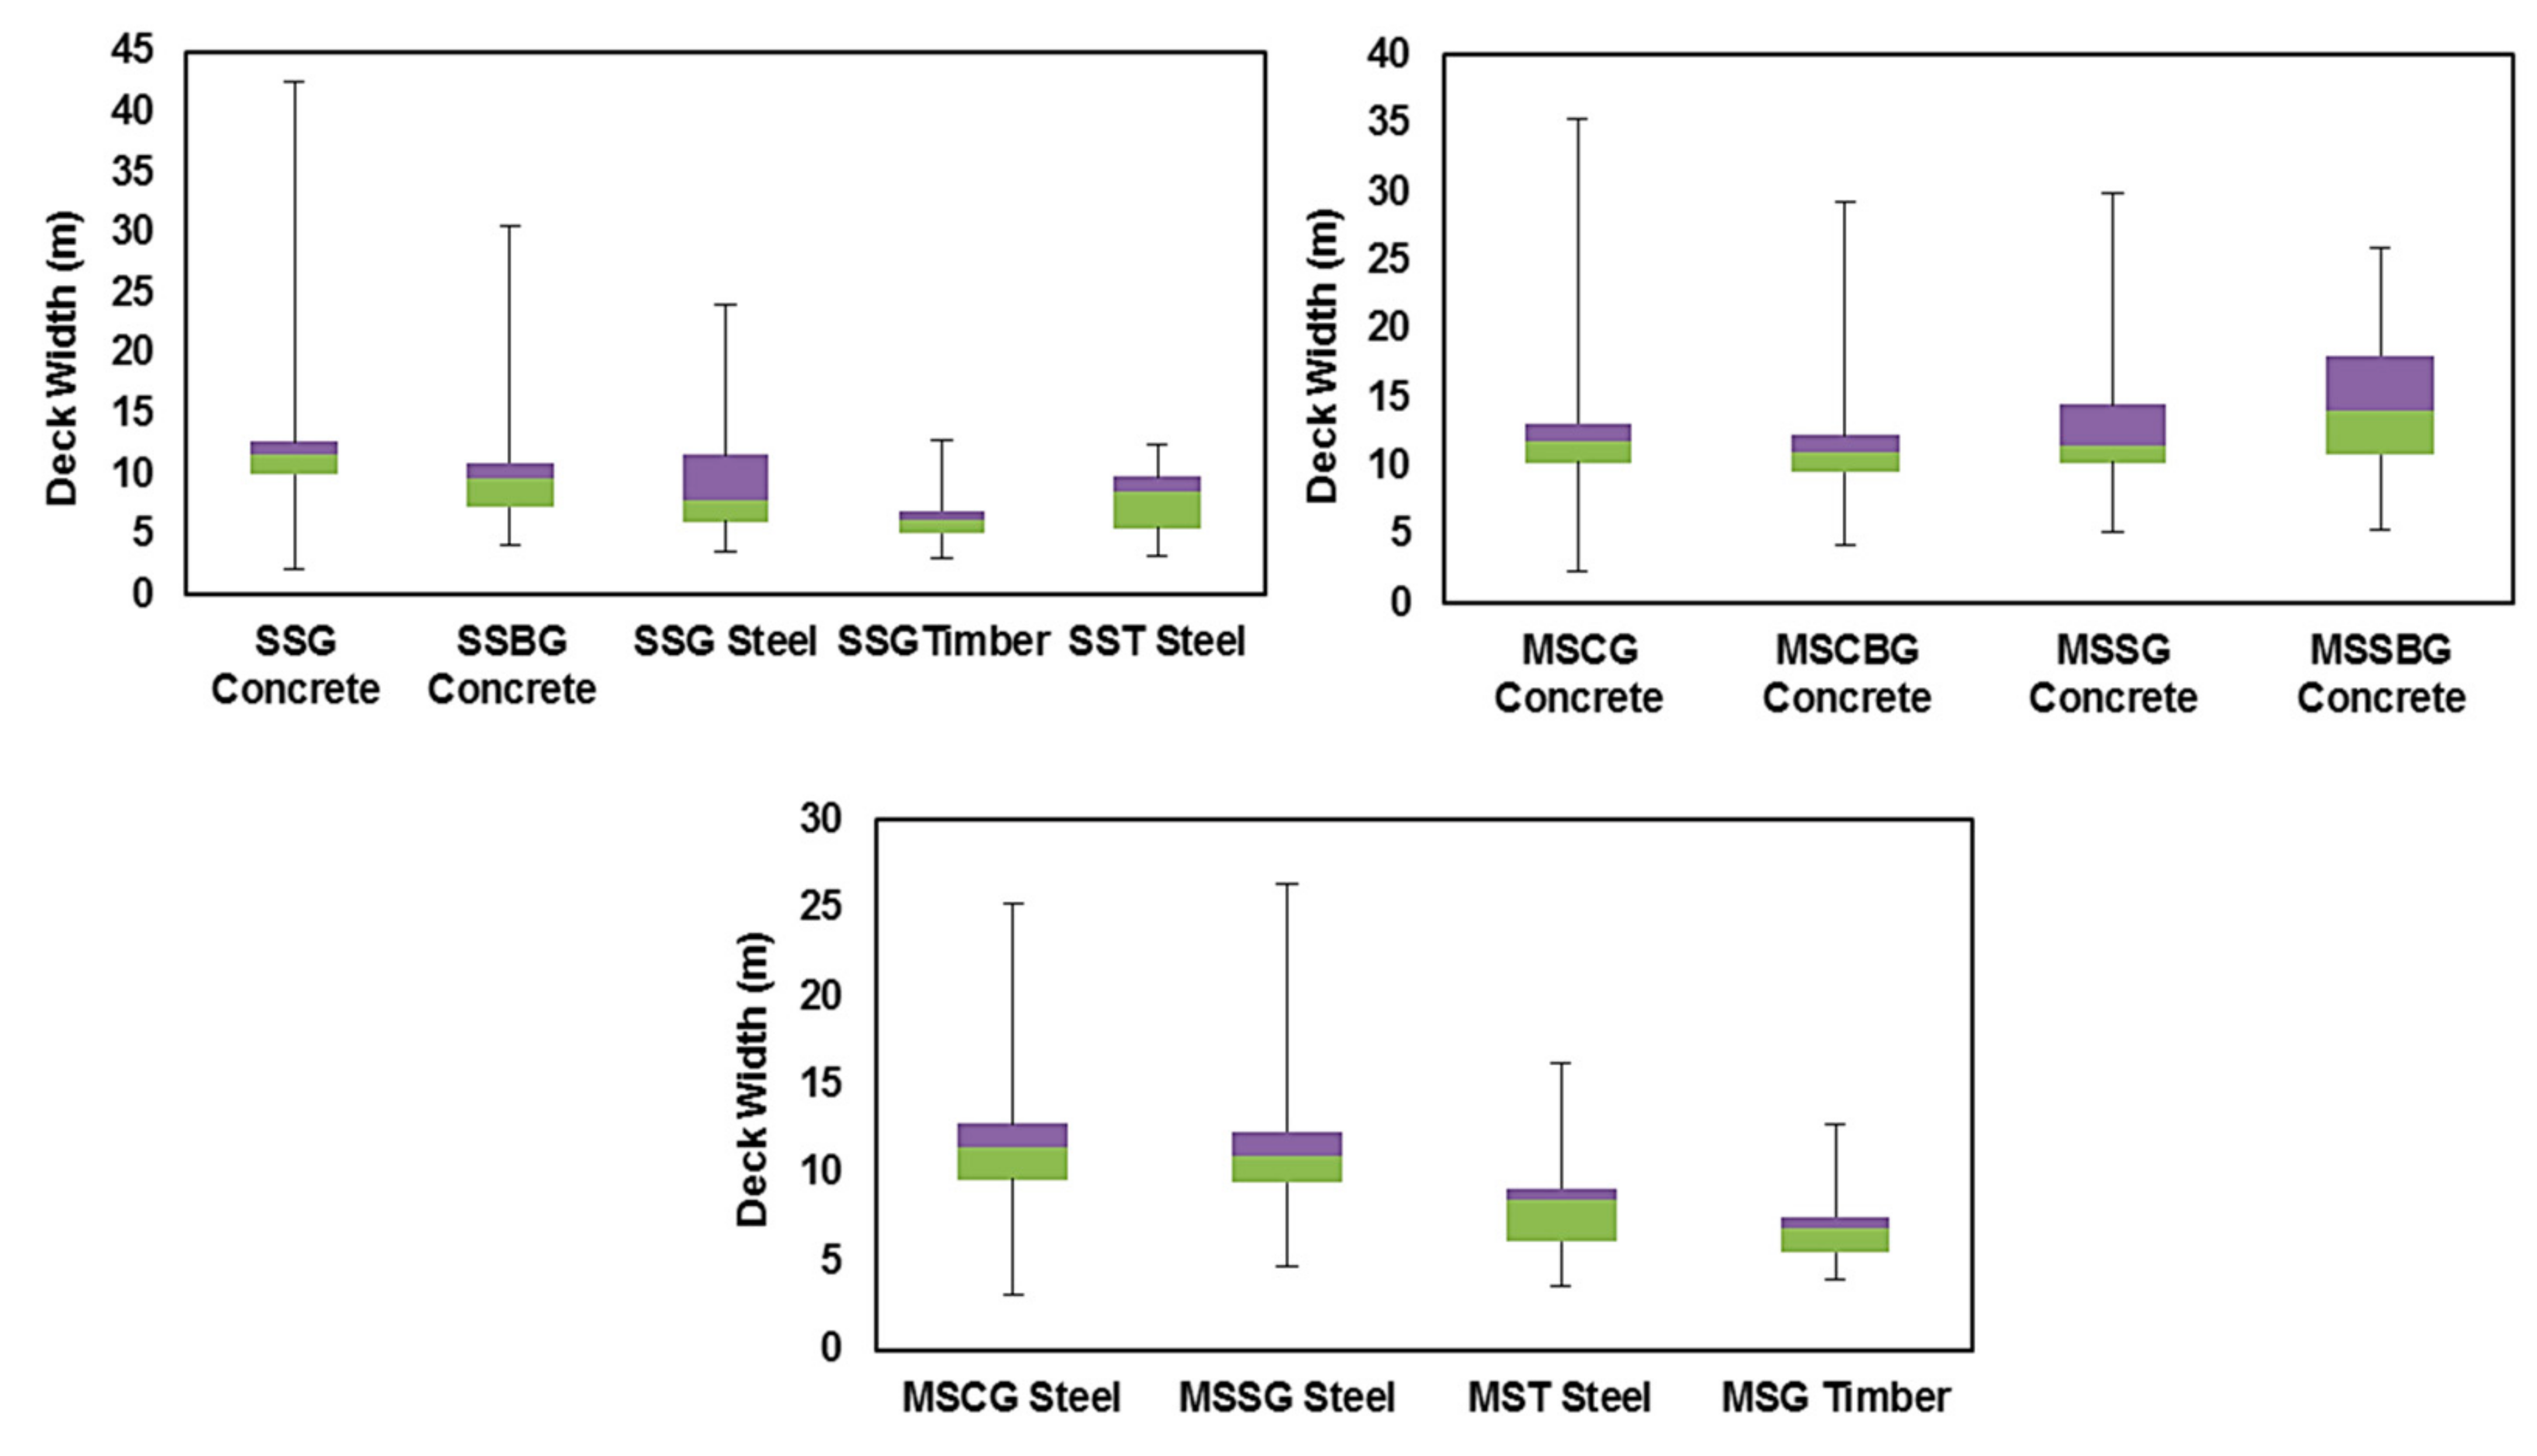
Figure 9.
Cumulative distribution function of construction year for (a) Single span; (b) Multispan concrete; (c) Multispan steel; and (d) Multispan timber girder bridges.
Figure 9.
Cumulative distribution function of construction year for (a) Single span; (b) Multispan concrete; (c) Multispan steel; and (d) Multispan timber girder bridges.


Figure 10.
Cumulative distribution function of Bridge Condition Index for (a) Simply supported; (b) Multispan concrete; (c) Multispan steel; and (d) Multispan timber girder bridges.
Figure 10.
Cumulative distribution function of Bridge Condition Index for (a) Simply supported; (b) Multispan concrete; (c) Multispan steel; and (d) Multispan timber girder bridges.

Figure 11.
Typical bridge pier type in BC (a) Single column, (b) Flared column, (c) Multi column bent; (d) Pile bent; (e) Pile bent with concrete diaphragm; (f) Steel bent; (g) Reinforced concrete wall pier of uniform cross section; (h) Wall pier of varying cross section; (i) Hammerhead or T-type wall pier; (j) Timber or Log pier (Ref: BC Ministry of Transportation).


Table 1.
Percentage distribution of highway bridges among BC contract areas.
| SL. No. | Contract Area | Total Bridges | % of Bridges | SL. No. | Contract Area | Total Bridges | % of Bridges |
|---|---|---|---|---|---|---|---|
| 1 | South Island | 106 | 4.0 | 15 | Thompson | 94 | 3.5 |
| 2 | Central Island | 124 | 4.7 | 16 | South Cariboo | 87 | 3.3 |
| 3 | North Island | 179 | 6.7 | 17 | Central Cariboo | 121 | 4.6 |
| 4 | Howe Sound | 133 | 5.0 | 18 | North Cariboo | 64 | 2.4 |
| 5 | Sunshine Coast | 24 | 0.9 | 19 | Fort George | 64 | 2.4 |
| 6 | Lower Mainland | 172 | 6.5 | 20 | Robson | 52 | 2.0 |
| 7 | Fraser Valley | 204 | 7.7 | 21 | South Peace | 111 | 4.2 |
| 8 | South Okanagan | 116 | 4.4 | 22 | North Peace | 86 | 3.2 |
| 9 | Kootenay Boundary | 78 | 2.9 | 23 | Nechako | 33 | 1.2 |
| 10 | Central Kootenay | 148 | 5.6 | 24 | Lakes | 34 | 1.3 |
| 11 | East Kootenay | 97 | 3.7 | 25 | Bulkley Nass | 94 | 3.5 |
| 12 | Selkirk | 72 | 2.7 | 26 | Skeena | 95 | 3.6 |
| 13 | Okanagan-Shuswap | 114 | 4.3 | 27 | North Coast | 43 | 1.6 |
| 14 | Nicola | 75 | 2.8 | 28 | Stikine | 34 | 1.3 |
Table 2.
Bridge superstructure system listed in the BC bridge inventory.
| SL. No. | Construction System | SL. No. | Construction System |
|---|---|---|---|
| 1 | Rectangular Girder | 7 | Suspension |
| 2 | Box Girder | 8 | Cable Stayed |
| 3 | I Girder | 9 | Balanced Cantilever |
| 4 | Truss-Through | 10 | Tunnel/Culvert |
| 5 | Truss-Deck | 11 | Miscellaneous |
| 6 | Structural Arch |
Table 3.
Typical bridge classes listed in the BC bridge inventory.
| SL. | Type | Abbreviation | Number | % |
|---|---|---|---|---|
| 1 | Single Span Concrete Girder Bridge | SSG Concrete | 218 | 8.5 |
| 2 | Single Span Concrete Box Girder Bridge | SSBG Concrete | 347 | 13.6 |
| 3 | Single Span Steel Girder Bridge | SSG Steel | 233 | 9.1 |
| 4 | Single Span Steel Truss Bridge | SST Steel | 138 | 5.4 |
| 5 | Single Span Timber Girder Bridge | SSG Timber | 301 | 11.8 |
| 6 | Multispan Continuous Concrete Girder Bridge | MSCG Concrete | 147 | 5.8 |
| 7 | Multispan Continuous Concrete Box Girder Bridge | MSCBG Concrete | 160 | 6.3 |
| 8 | Multispan Simply Supported Concrete Girder Bridge | MSSG Concrete | 252 | 9.9 |
| 9 | Multispan Simply Supported Concrete Box Girder Bridge | MSSS Concrete | 62 | 2.4 |
| 10 | Multispan Continuous Steel Girder Bridge | MSCG Steel | 165 | 6.5 |
| 11 | Multispan Simply supported Steel Girder Bridge | MSSG Steel | 153 | 6.0 |
| 12 | Multi Span Timber Girder Bridge | MSG Timber | 211 | 8.3 |
| 13 | Multi Span Steel Truss Bridge | MST Steel | 80 | 3.1 |
| 14 | Others | 88 | 3.4 | |
| Total | 2555 | 100.0 |
Table 4.
Statistics for bridge skew angle.
| Bridge Type | Mean (deg) | Median (deg) | Std. Dev. (deg) | 0° (%) | 1–15° (%) | 16°–30° (%) | 31°–45° (%) | >45° (%) |
|---|---|---|---|---|---|---|---|---|
| SSG Concrete | 11.5 | 0 | 14.8 | 51.9 | 12.6 | 24.4 | 11.1 | 0 |
| SSBG Concrete | 7.8 | 0 | 11.9 | 66.3 | 9.82 | 20.9 | 3 | 0 |
| SSG Steel | 8.8 | 0 | 15.5 | 70.17 | 5.3 | 10.5 | 11.4 | 2.6 |
| SSG Timber | 6.5 | 0 | 11.5 | 66.4 | 16.4 | 9.4 | 7.8 | 0 |
| SST Steel | 1.6 | 0 | 6.6 | 94 | 2 | 2 | 2 | 0 |
| MSCG Concrete | 10.8 | 2 | 14.2 | 50 | 19 | 18 | 13 | 0 |
| MSCBG Concrete | 6.8 | 0 | 11.1 | 67.4 | 9 | 21.3 | 2.25 | 0 |
| MSSG Concrete | 11.9 | 2 | 15.1 | 49.7 | 15.2 | 18.3 | 15.7 | 1.1 |
| MSSBG Concrete | 7.7 | 0 | 14.7 | 69.7 | 9.1 | 12.1 | 6.1 | 3 |
| MSCG Steel | 8.9 | 0 | 15.8 | 72 | 5.6 | 7.2 | 12.8 | 2.4 |
| MSSG Steel | 6.7 | 0 | 14.1 | 75.6 | 6.7 | 7.6 | 7.6 | 2.5 |
| MST Steel | 2.8 | 0 | 9.2 | 85.7 | 4.76 | 4.76 | 4.76 | 0 |
| MSG Timber | 6.9 | 0 | 14.0 | 74.6 | 4.76 | 12.7 | 6.35 | 1.6 |
Table 5.
British Columbia bridge Condition State (including tunnels and culverts).
| BCI/CS | Condition State | Summarized Description | Number of Bridges | Percent |
|---|---|---|---|---|
| 1 | E—Excellent | As new Condition | 549 | 19.5% |
| 2 | G—Good | Normal deterioration, maintenance not required | 1888 | 67.1% |
| 3 | F—Fair | Minor defects or collision damage, maintenance required | 365 | 13.0% |
| 4 | P—Poor | Significant defects or advanced deterioration, repair required | 12 | 0.4% |
| 5 | V—Very Poor | Serious defects, imminent failure of components, immediate repair required | 1 | 0.0% |
| Grand Total | 2815 | 100.0% |
Table 6.
Bridge pier type classification.
| SL. No. | Pier Type | Number of Bridges | % of Bridges |
|---|---|---|---|
| 1 | Single Column | 11 | 0.85 |
| 2 | Flared Column | 77 | 5.96 |
| 3 | Multi Column Bent | 283 | 21.89 |
| 4 | Pile Bent | 178 | 13.77 |
| 5 | Pile Bent with Concrete Diaphragm | 96 | 7.42 |
| 6 | Steel Bent | 36 | 2.78 |
| 7 | Solid Wall Pier of Uniform Cross Section | 119 | 9.20 |
| 8 | Solid Wall Pier of Varying Cross Section | 85 | 6.57 |
| 9 | Hammerhead or Tee Type Wall Pier | 35 | 2.71 |
| 10 | Timber Pier | 272 | 21.04 |
| 11 | Others/Information not available | 103 | 7.97 |
| Total | 1295 | 100.00 |
Table 7.
Percentage of different pier types used for the multispan bridge classes.
| SL. No. | Pier Type | MSCG Concrete | MSCBG Concrete | MSSG Concrete | MSSBG Concrete | MSCG Steel | MSSG Steel | MST Steel | MSG Timber |
|---|---|---|---|---|---|---|---|---|---|
| 1 | Single Column | 4.2 | -- | 0.8 | -- | 0.6 | 0.7 | 1.2 | -- |
| 2 | Flared Column | 6.9 | -- | 8.7 | 1.5 | 8.1 | 15.0 | 1.2 | -- |
| 3 | Multi Column Bent | 31.3 | 5.0 | 34.1 | 27.3 | 24.2 | 30.1 | 16.0 | 0.5 |
| 4 | Pile Bent | 16.0 | 31.3 | 15.5 | 31.8 | 10.6 | 6.5 | 6.2 | 3.3 |
| 5 | Pile Bent with Concrete Diaphragm | 14.6 | 15.0 | 10.3 | 9.1 | 3.1 | 3.9 | 6.2 | -- |
| 6 | Steel Bent | 0.7 | 0.6 | -- | 1.5 | 11.2 | 2.0 | 4.9 | 1.4 |
| 7 | Solid Wall Pier of Uniform Cross Section | 7.6 | 3.8 | 3.2 | 4.5 | 16.8 | 17.0 | 24.7 | 0.9 |
| 8 | Solid Wall Pier of Varying Cross Section | 4.2 | 2.5 | 16.3 | 1.5 | 6.2 | 5.9 | 9.9 | 1.4 |
| 9 | Hammerhead or Tee Type Wall Pier | 0.7 | 1.3 | 4.0 | 1.5 | 5.0 | 7.8 | 1.2 | -- |
| 10 | Timber Pier | 7.6 | 26.3 | 2.0 | 18.2 | 6.2 | 3.3 | 6.2 | 78.2 |
Table 8.
Percentage of foundation type used along with different pier types.
| SL. No. | Pier Type | Concrete Pile | Steel H Pile | Steel Pipe Pile | Steel Pipe Pile Filled With Concrete | Timber or Log Pile | Single Column Footing | Combined Footing | Wall Footing |
|---|---|---|---|---|---|---|---|---|---|
| 1 | Single Column | -- | 18.2 | 36.4 | -- | -- | 36.4 | -- | -- |
| 2 | Flared Column | 1.3 | 24.7 | 13.0 | 1.3 | 6.5 | 40.3 | -- | -- |
| 3 | Multi Column Bent | 2.5 | 7.1 | 8.2 | 3.9 | 8.5 | 19.9 | 19.9 | -- |
| 4 | Pile Bent | 11.8 | 17.4 | 50.0 | 11.2 | -- | -- | -- | -- |
| 5 | Pile Encased Pier | 1.0 | 6.3 | 61.5 | 30.2 | -- | -- | -- | -- |
| 6 | Steel Bent | -- | 18.9 | 2.7 | -- | -- | 27.0 | 27.0 | -- |
| 7 | Solid Wall Pier of Uniform Cross Section | 0.8 | 13.4 | 13.4 | 1.7 | 8.4 | -- | -- | 27.7 |
| 8 | Solid Wall Pier of Varying Cross Section | 3.5 | 17.6 | 7.1 | 1.2 | 18.8 | -- | -- | 27.1 |
| 9 | Hammerhead or Tee Type Wall Pier | -- | 22.9 | 5.7 | -- | -- | -- | 2.9 | 54.3 |
| 10 | Timber Pier | -- | -- | -- | -- | 96.3 | -- | 3.7 | -- |
© 2017 by the authors. Licensee MDPI, Basel, Switzerland. This article is an open access article distributed under the terms and conditions of the Creative Commons Attribution (CC BY) license (http://creativecommons.org/licenses/by/4.0/).
Share and Cite
MDPI and ACS Style
Siddiquee, K.; Alam, M.S. Highway Bridge Infrastructure in the Province of British Columbia (BC), Canada. Infrastructures 2017, 2, 7. https://doi.org/10.3390/infrastructures2020007
AMA Style
Siddiquee K, Alam MS. Highway Bridge Infrastructure in the Province of British Columbia (BC), Canada. Infrastructures. 2017; 2(2):7. https://doi.org/10.3390/infrastructures2020007
Chicago/Turabian StyleSiddiquee, Kader, and M. Shahria Alam. 2017. "Highway Bridge Infrastructure in the Province of British Columbia (BC), Canada" Infrastructures 2, no. 2: 7. https://doi.org/10.3390/infrastructures2020007