A Coupled CFD–DEM Simulation of Slurry Infiltration and Filter Cake Formation during Slurry Shield Tunneling


1
Department of Geotechnical Engineering, College of Civil Engineering, Tongji University, Shanghai 200092, China
2
Key Laboratory of Geotechnical Engineering, Ministry of Education, Tongji University, Shanghai 200092, China
*
Author to whom correspondence should be addressed.
Infrastructures 2018, 3(2), 15; https://doi.org/10.3390/infrastructures3020015
Submission received: 22 May 2018
/
Revised: 12 June 2018
/
Accepted: 13 June 2018
/
Published: 15 June 2018
(This article belongs to the Special Issue The Role of Infrastructures in the Smart City)
Abstract
:Tunneling in highly permeable ground using a slurry shield machine can be challenging because it is difficult to form the so-called filter cake on the tunnel face to transport the support pressure. Consequently, destructive accidents might happen, such as face instability and water inrush. How to form an efficient filter cake in time is crucial during engineering practice, especially in ground with high permeability. Various theoretical and experimental analyses regarding the formation of filter cakes have been conducted. However, due to the complexity of this problem, which has to incorporate the mechanical and hydraulic behaviors of the fluid–solid mixture system, few numerical simulations are found in the literature. In this paper, with the aid of a newly developed numerical tool, a coupled CFD (computational fluid dynamics)–DEM (discrete element method) simulation is established to study the slurry infiltration and filter cake formation during slurry shield tunneling. The slurry infiltration process is simulated by modelling the scheme of the infiltration column test, in which sedimentation behaviors of slurry particles are captured and compared with experimental results. The results show that the sedimentation behaviors of the slurry particles and filter cake formation phenomenon are well captured by simulations and in accordance with the experiments, which indicates the robustness of the coupled CFD–DEM simulation used in present work.
1. Introduction
Slurry shield machines are widely used in mechanized tunneling projects, especially in undersea and cross-river tunnels [1]. During construction, the tunnel face is stabilized by pressurized slurry. In order to transport the support pressure efficiently, a so-called filter cake must be formed on the tunnel face under slurry pressure. However, when the soil on the tunnel face is highly permeable, such as sand and gravel, the slurry would infiltrate into the ground instead of being retained on the tunnel face. Consequently, a loss of the support pressure might occur, leading to geological hazards such as tunnel face collapse and underground water inrush. Thus, a comprehensive study of the slurry infiltration behavior is crucial to the safety and economic efficiency of the tunneling project.
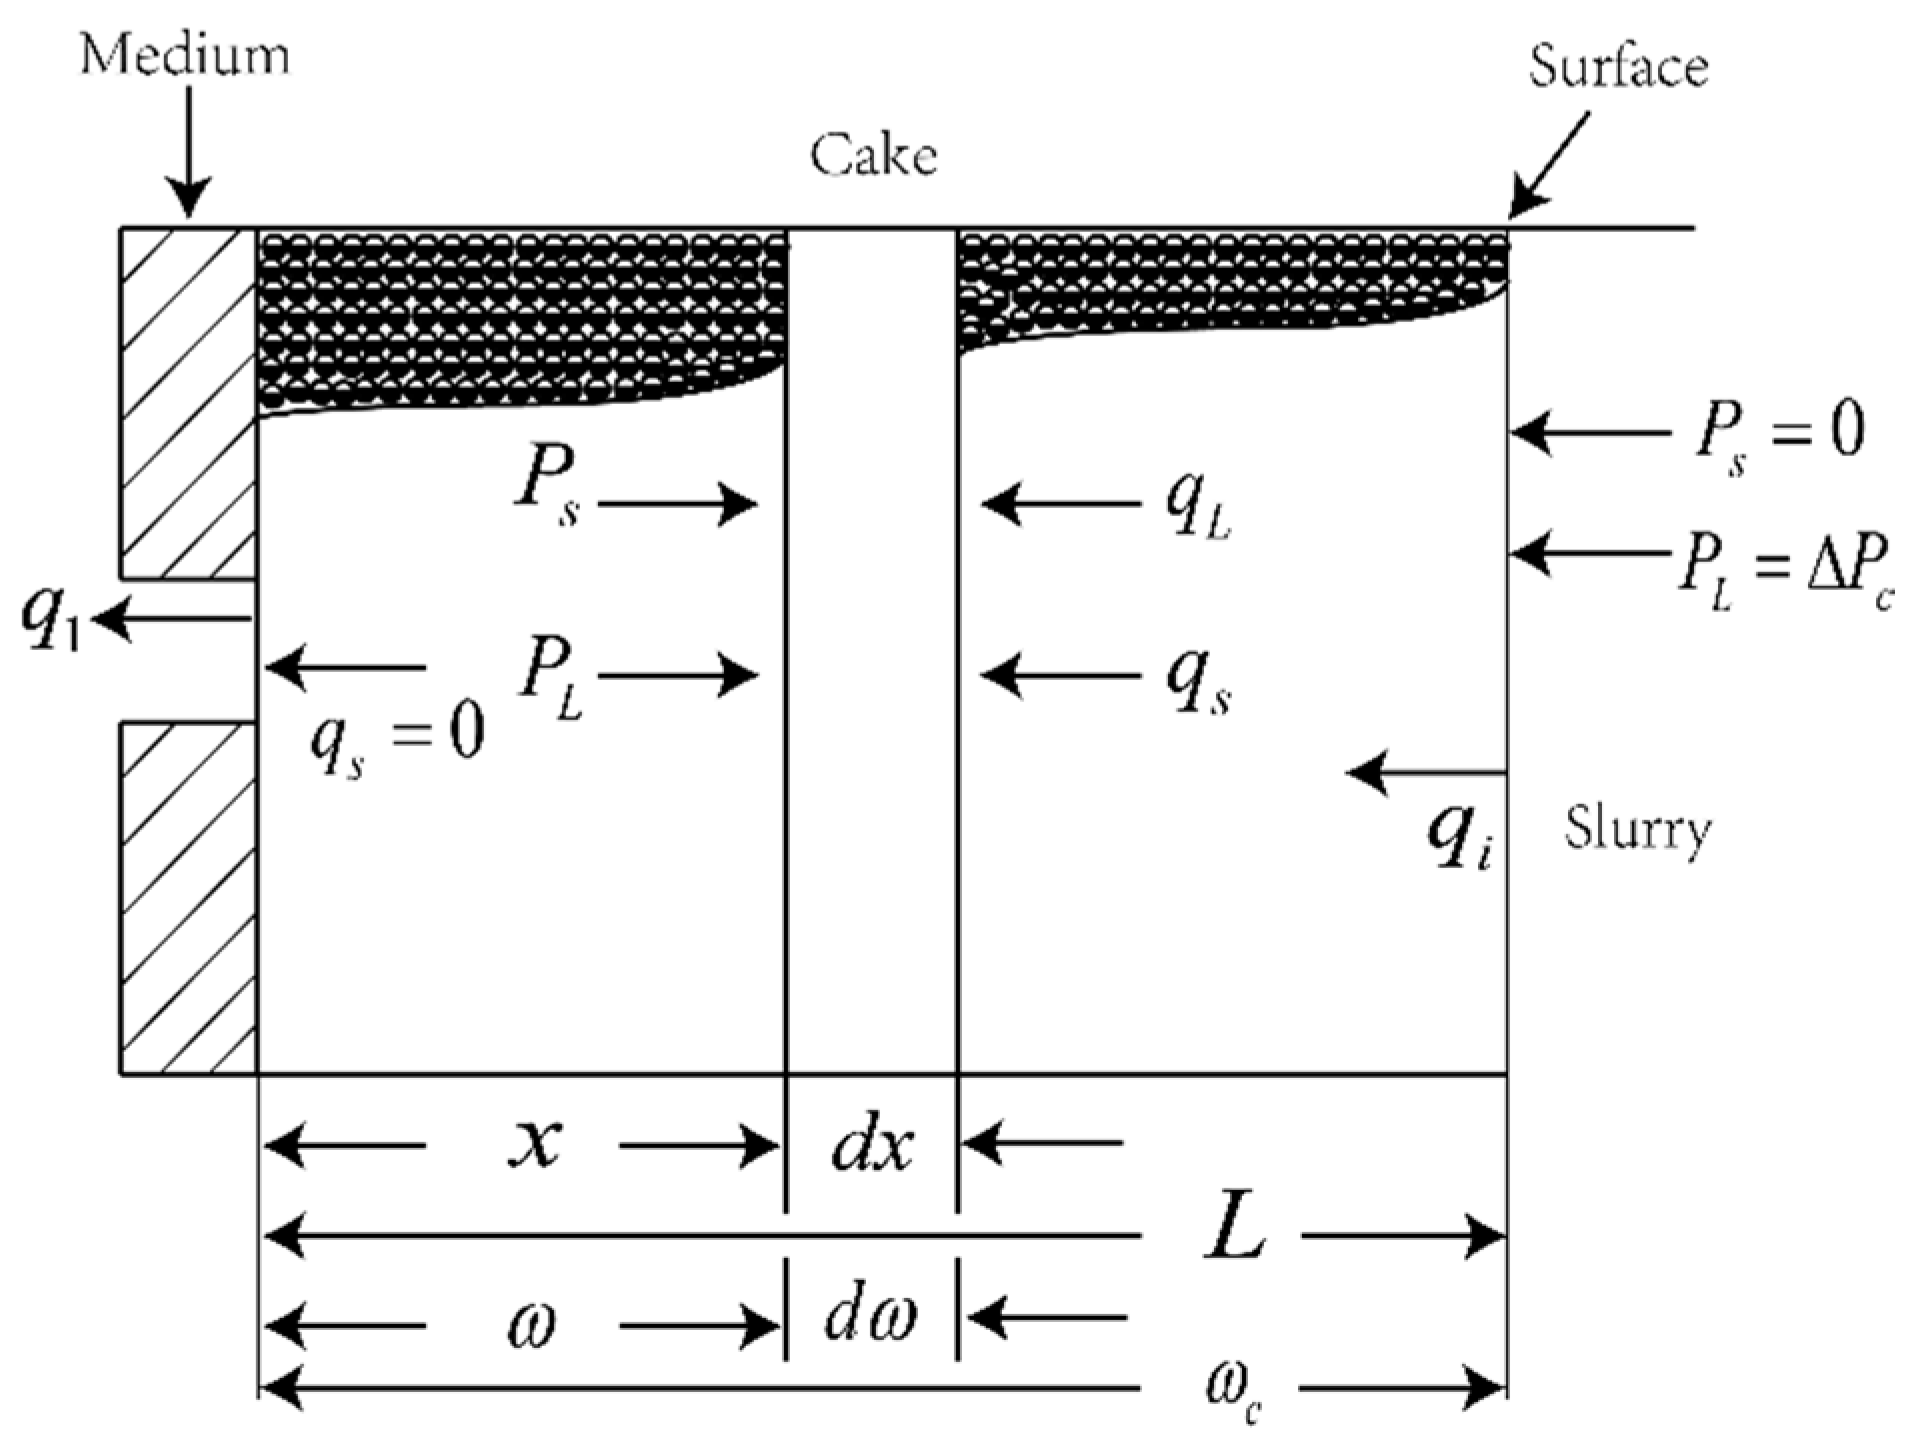
Regarding the theoretical studies, one could refer to the conventional cake infiltration theory, in which the slurry infiltrates across a membrane medium and is retained on the medium face to form a filter cake as shown in Figure 1 [2]. According to conventional cake infiltration theory, both the fluid phase and solid phase are treated as a continuum. Slurry flow equations are established based on the continuity condition and momentum balance. Incorporating constitutive relations between the solid pressure and permeability and the solid fraction of the cake, the partial differential slurry flow equations could be analytically solved under certain initial boundary conditions and assumptions. The analytical solutions could be used to acquire the pressure distribution within the system and time-dependent growth of the filter cake. However, the assumptions such as ignoring the velocity of the solid phase and constant fluid velocity during the whole process impose further limitations to its application [3]. Besides this, the continuous treatment of fluid and solid phase for simplifying the problem is not in accordance with the highly polydisperse nature of slurry.
Various experimental studies have also been carried out, in most of which the slurry infiltration column test was adopted.
Krause [4] proposed an empirical equation for calculating the infiltration length of slurry from various laboratory tests. The equation showed that the infiltration length was related to the applied pressure, slurry viscosity, and particle size of the ground. However, this equation could lead to large error due to the difficulty in determining the empirical parameters. Talmon et al. [5] conducted a plastering test using a Perspex cylindrical cell. According to the results, he concluded that the slurry invasion process could be separated into two stages: mud spurt and consolidation. A semi-empirical equation was also proposed to evaluate the time-dependent cake growth. Min et al. [6] investigated the effects of clay content on the filter cake properties such as thickness and permeability. The results showed that clay content was a controlling parameter during slurry infiltration. Min et al. [7] used an infiltration column test apparatus and conducted 45 slurry infiltration tests as shown in Figure 2, and different infiltration behaviors were observed. Their results also provided instruction and comparison of the numerical simulation, which will be further discussed in Section 3. Though experimental investigations could obtain the slurry infiltration behavior at the end of the experiments, it is nearly impossible to capture the whole infiltration process. In addition, some critical pieces of information such as the interaction between slurry particle and fluid phase and porosity distribution evolution with time could not be provided by the experiments either.
In order to study the mechanism of slurry infiltration, a suitable numerical approach is indispensable. Conventional numerical methods such as FEM (finite element method), etc., which use a continuous mesh to simulate the solid, cannot possibly capture the interactions between slurry particles and sand particles. However, using a pure DEM simulation we could not incorporate the rheology properties of the slurry. To simulate a highly polydisperse system with fluid such as slurry, a coupled CFD and DEM approach might be the optimal choice available at present. This paper proposes a coupled CFD and DEM approach to investigate the slurry infiltration and filter cake formation behavior during slurry shield tunneling. In this CFD–DEM approach, the solid phase is treated as discrete slurry particles while the fluid phase is treated as a continuous Newtonian fluid since these treatments are more realistic regarding the highly polydisperse nature of slurry. The paper is organized as follows. Firstly, the theoretical background and methodology of the CFD and DEM are explained in Section 2. Secondly, the numerical implementation is introduced in Section 3. The slurry infiltration process is simulated by modelling the scheme of the infiltration column test. Then the results are discussed and compared with the published experimental results in Section 4. Finally, Section 5 summarizes the major conclusions of the present work.
2. Theory and Methodology
The coupled CFD–DEM simulation is based on two open source codes: LAMMPS (Large-scale Atomic/Molecular Massively Parallel Simulator)-based DEM code named LIGGGHTS (LAMMPS improved for general granular and granular heat transfer simulations) [8] and CFD code OpenFOAM (Open Source Field Operation and Manipulation) (www.openfoam.com). The framework of the coupling computation of DEM and CFD, named CFDEM, written by Goniva et al. [9] is employed in present paper.
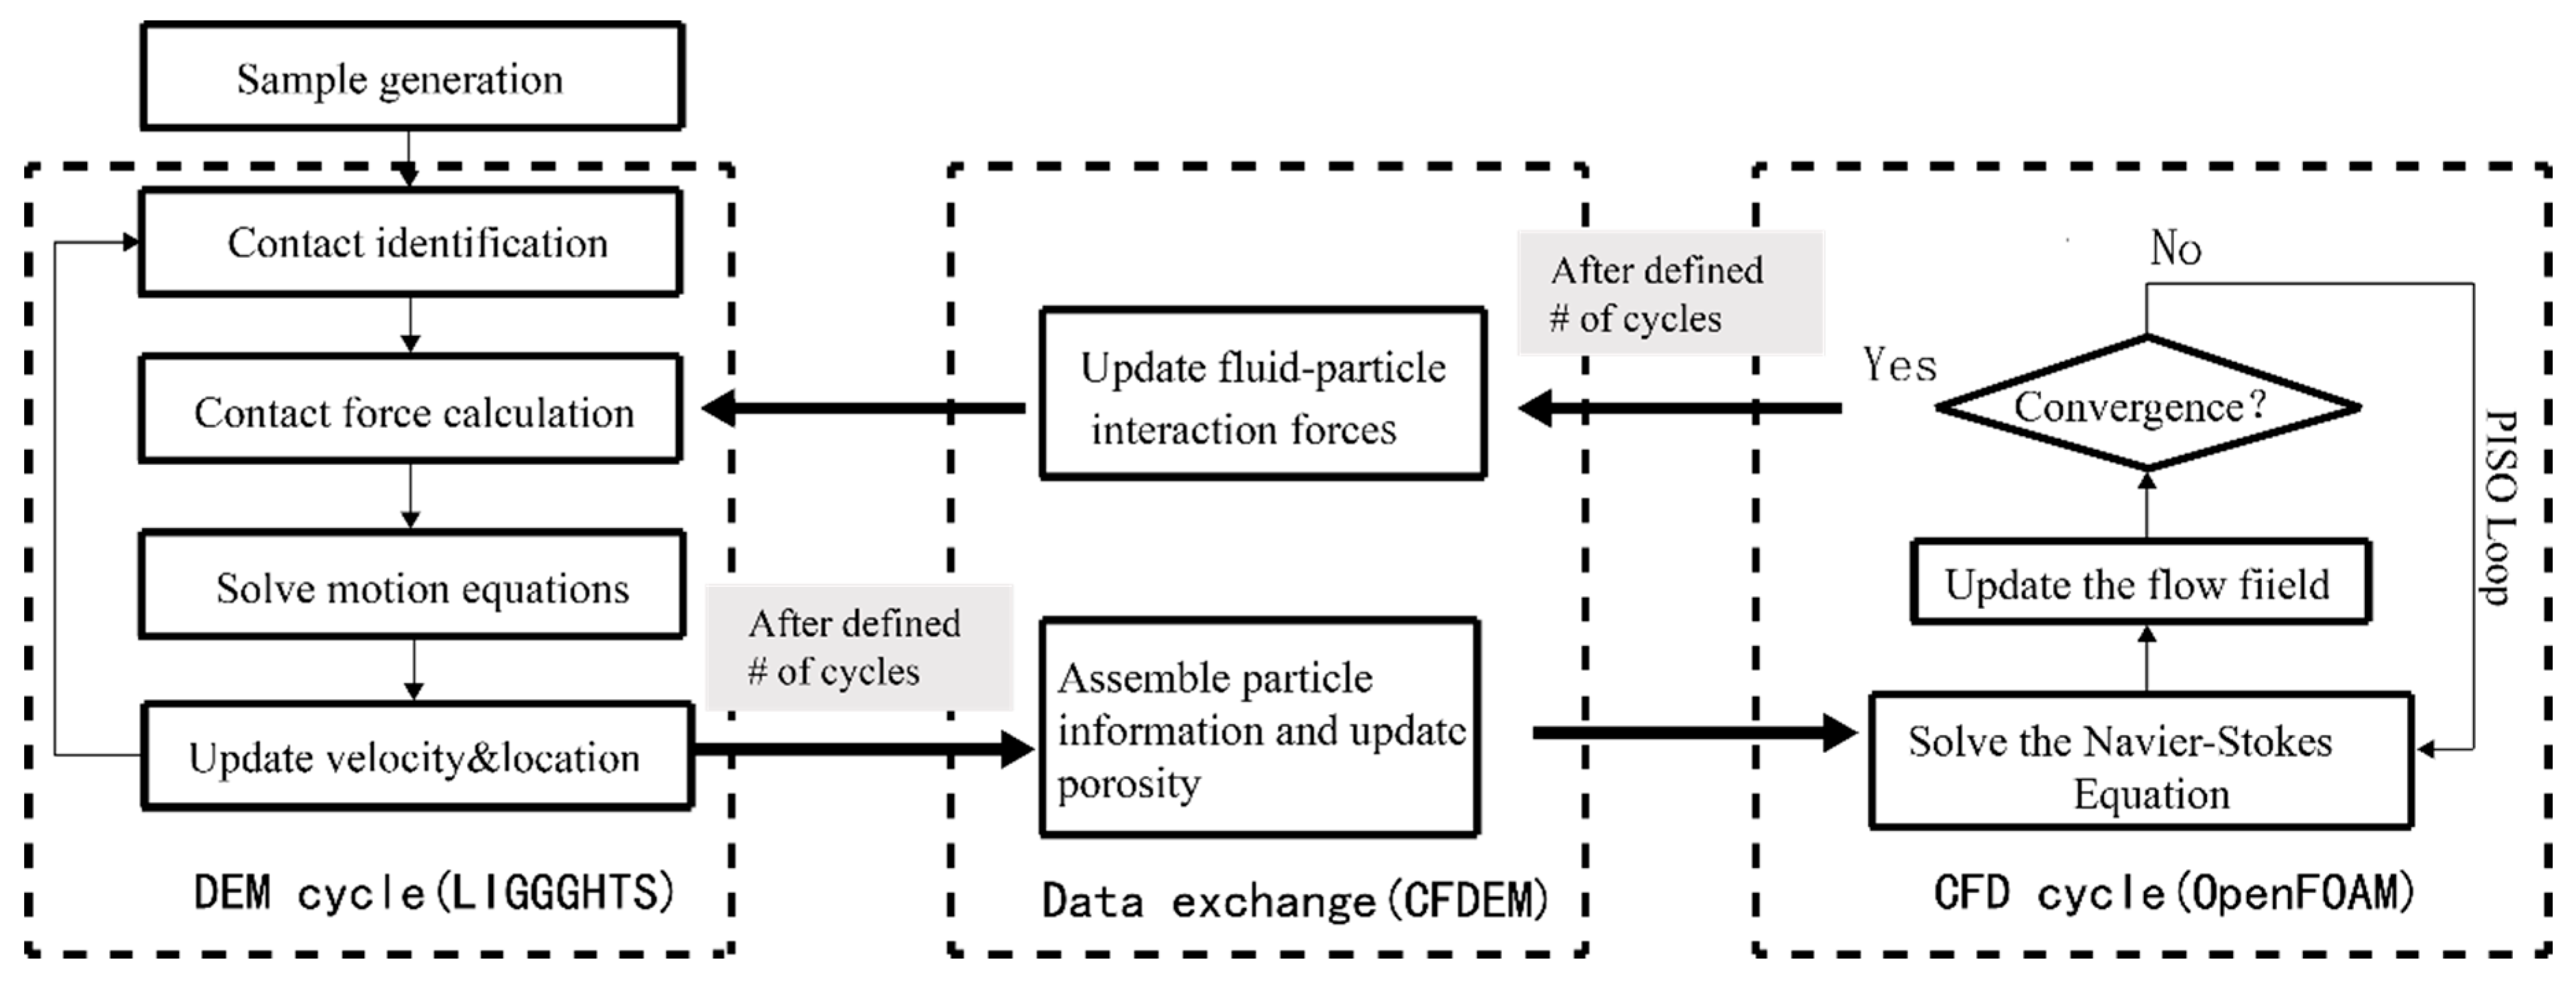
The fluid phase is described by the Navier–Stokes equations in Eulerian form, which are solved by OpenFOAM codes through the PISO (Pressure-Implicit with Splitting of Operators) loop, and the motion of particles is governed by Newton’s Laws of Motion in Lagrangian form that are calculated by the LIGGGHTS packages. The CFDEM codes exchange the particle–fluid interaction information at certain time step intervals and update the data accordingly (see Figure 3 [10]). The governing equations of each method are discussed in the following subsections.
2.1. Governing Equations of DEM
DEM, proposed by Cundall and Strack [11], is a well-validated and widely adopted method to investigate the behavior of granular material such as sand and rock. Compared to the conventional continuum method, it treats granular material as a composition of various individual particles, and particle interactions are governed by different contact models. As long as interparticle forces are determined, the particle motion could be calculated by Newton’s second law of motion:
where and are the mass and inertia moment of particle ; and represent the translational and angular velocities; , , and are the contact force, fluid–particle interaction force, and gravitational force; and is the torque acting on particle .
Note that among the forces acting on the particles, a proper determination of fluid–particle interaction force is crucial to a rigorous coupled CFD–DEM simulation, which will be further discussed in Section 2.2.
2.2. Governing Equations of CFD and Fluid–Particle Intercation
The fluid phase is solved in the CFD program by the locally averaged incompressible Navier–Stokes equations [12,13]:
where and are the volume fraction of solid and fluid in a fluid cell; is the fluid velocity and is the solid velocity, which is obtained by averaging the particle velocities inside a fluid cell; is the fluid density; denotes the pressure gradient and is the divergence of stress tensor; g is the gravity; and is the fluid–particle interaction force. The Eulerian fields , , and are all obtained by averaging the information of Lagrangian particles.
The particle–fluid interaction force consists of pressure gradient force, drag force, lift force, and virtual mass force. The pressure gradient force is induced by the pressure gradient around a particle, which includes the buoyancy force due to gravity and the acceleration pressure gradient force in fluid [14]. The drag force is caused by the viscous shearing effect of fluid on the particle; the virtual mass force is caused by relative acceleration between particle and fluid [15,16]. The lift force, including Saffman lift forces and Magnus lift forces, accounts for the lift or upward force due to particle rotation. In the process of particle sedimentation, particles may fall in the vertical direction with rather little acceleration, in which the effect of lift force and virtual mass force could be neglected [17]. Hence, in the present simulation, only the drag force and pressure gradient force are considered.
In this paper, the drag force is calculated using the empirical expression proposed by Di Felice [18]:
where is the particle diameter, and is the drag force coefficient given by
where and is the fluid viscosity.
in Equation (5) denotes the porosity correction function to consider the presence of other particles in the flow system, as proposed by Di Felice [17]:
The validity of the above drag force expression has been investigated by many researchers [19,20,21], who have indicated that this expression works well in flow systems with relatively low Reynolds numbers.
The pressure gradient force is considered as the buoyancy force only since the acceleration pressure gradient is neglected in present work. This scheme is also adopted in [22] as the acceleration of particles is rather small in sedimentation. The buoyancy is given by
3. Model Implementation
Model implementation includes three major procedures—(1) CFD meshing, (2) DEM initialization, and (3) CFD–DEM coupling settings—which will be illustrated in the following subsections after a brief discussion of validation.
3.1. Valiadation
Validation for particle sedimentation has already been conducted by several researchers. Most of them validate their simulations by a benchmarking case of a single particle settling in the water. The final settling velocity could be measured and compared with an available analytical solution. The results show good comparability between the CFD–DEM simulation and analytical solution [20,22]. Consequently, validation will not be further discussed in this paper.
3.2. CFD Meshing
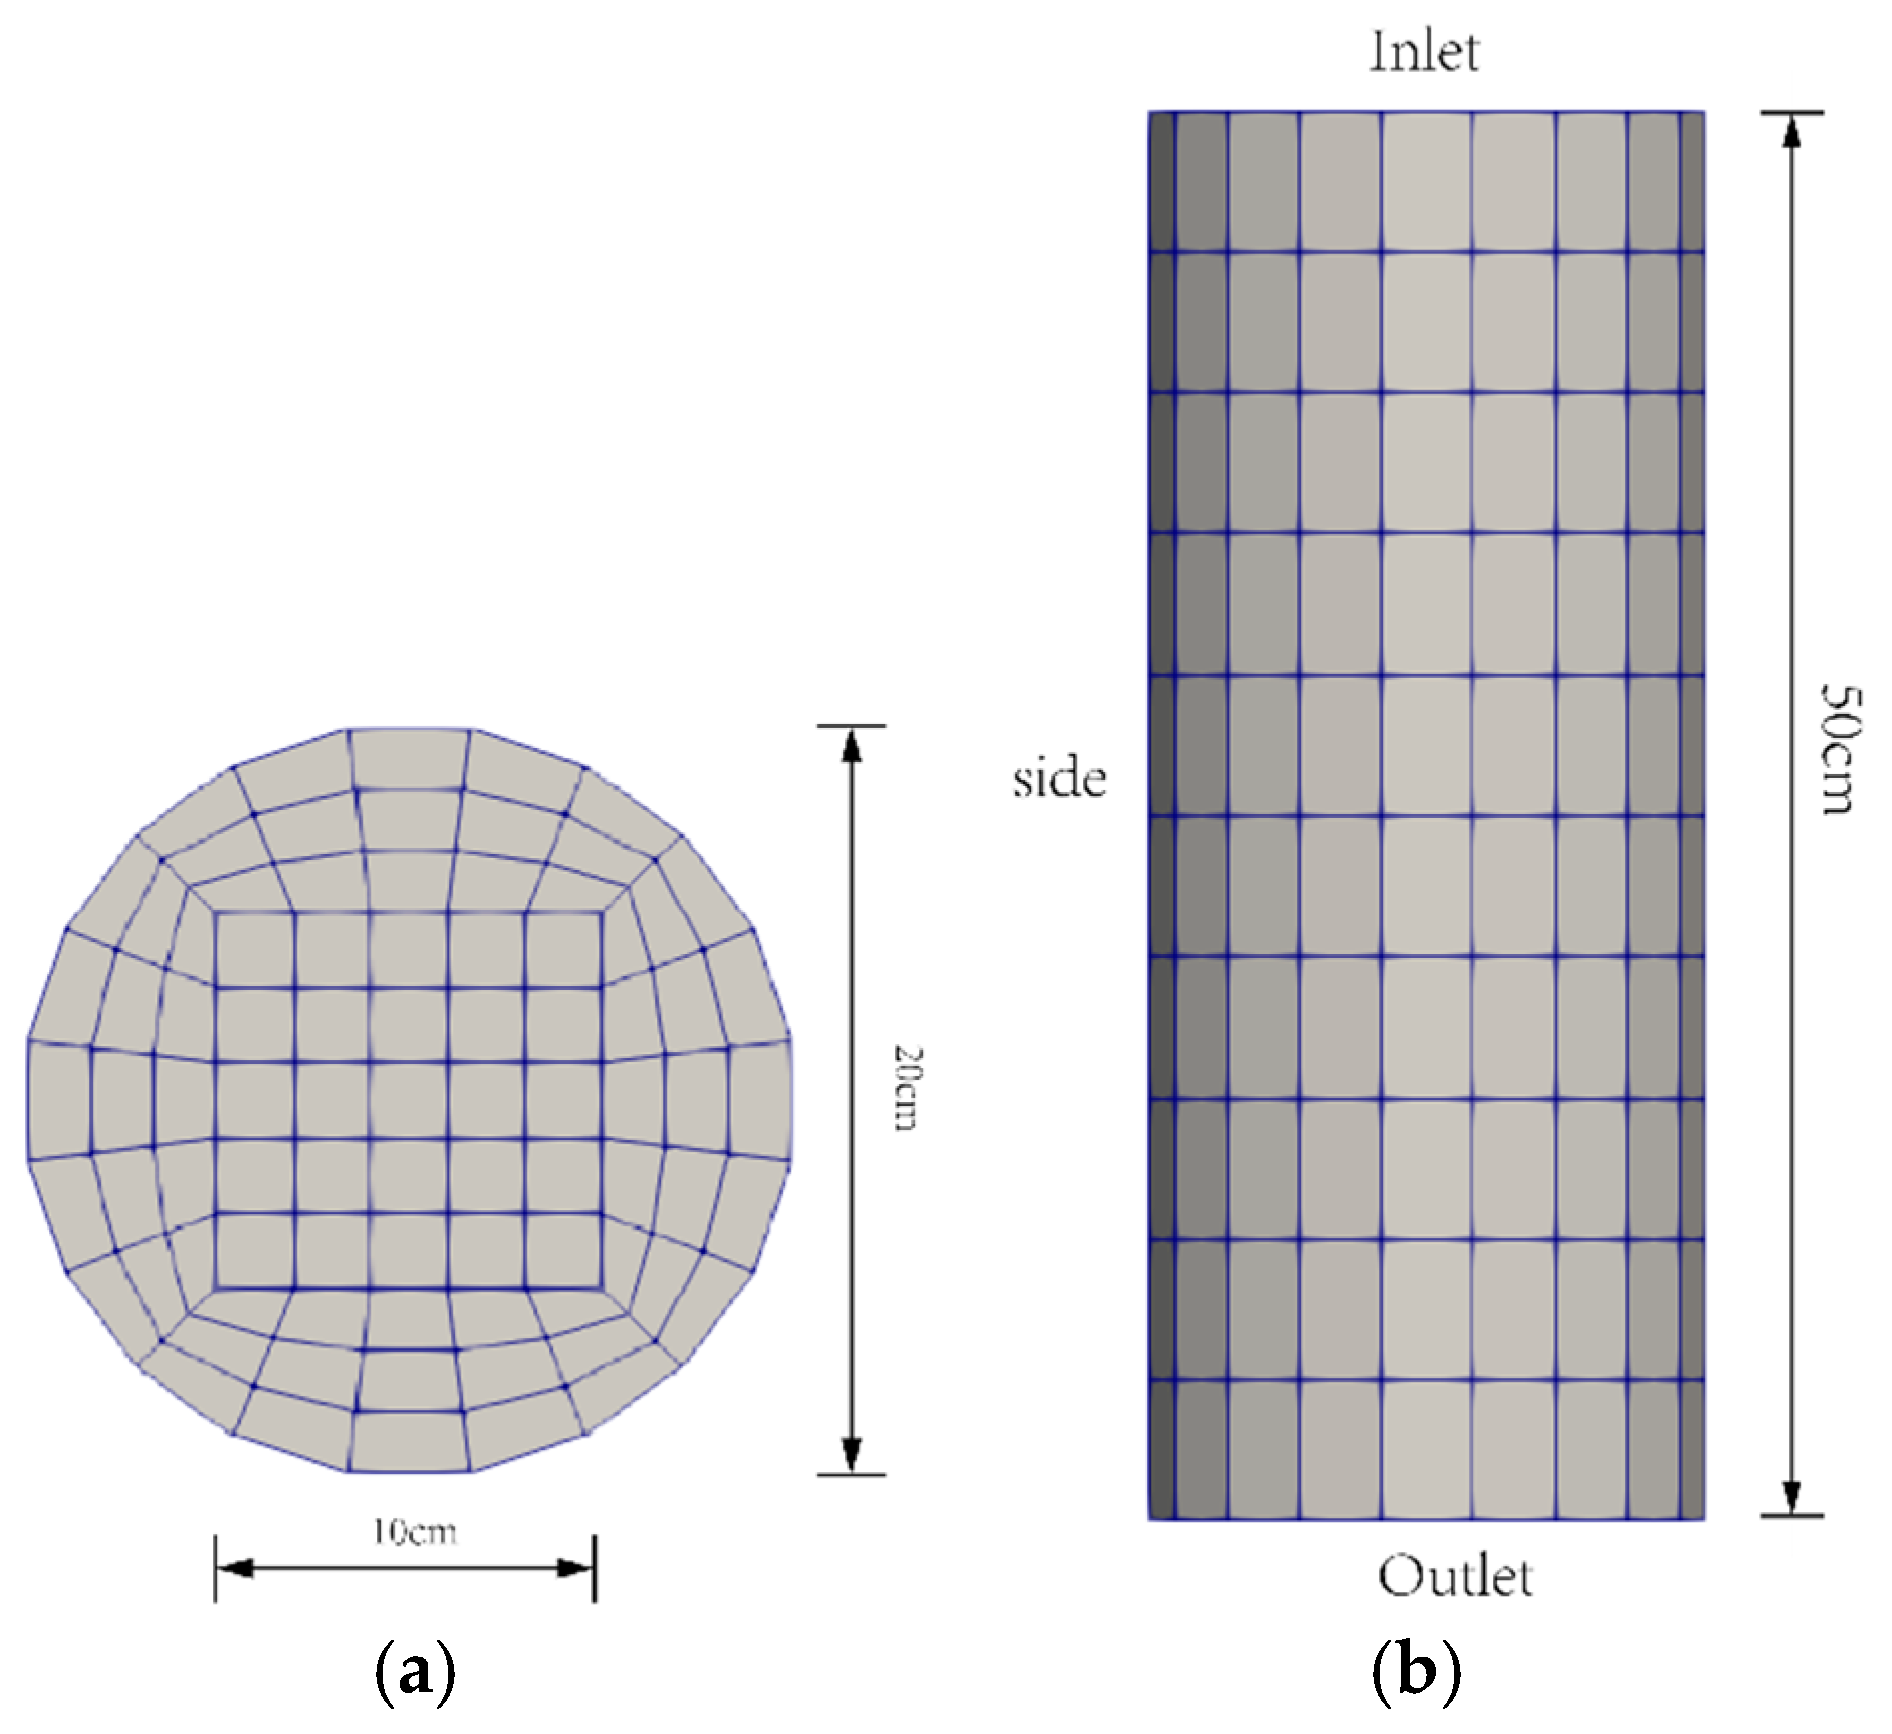
During the CFD–DEM coupling simulation, the CFD mesh works independently of the particle motions. However, the size of the CFD mesh is important to the selection of particle size. The cell size should be larger than two to four times the particle diameter [23] due to the nature of the algorithm of the calculations of porosity and drag force. Large particles would lead to inaccurate predictions of the porosity and drag force in terms of unresolved simulation. However, an overly coarse mesh would decrease the accuracy of the CFD calculations. Hence, a proper size of the CFD mesh is significant to the simulation. After some trial simulations, the mesh in Figure 4 was determined to meet the requirement above and balance the accuracy and efficiency.
3.3. DEM Initialization
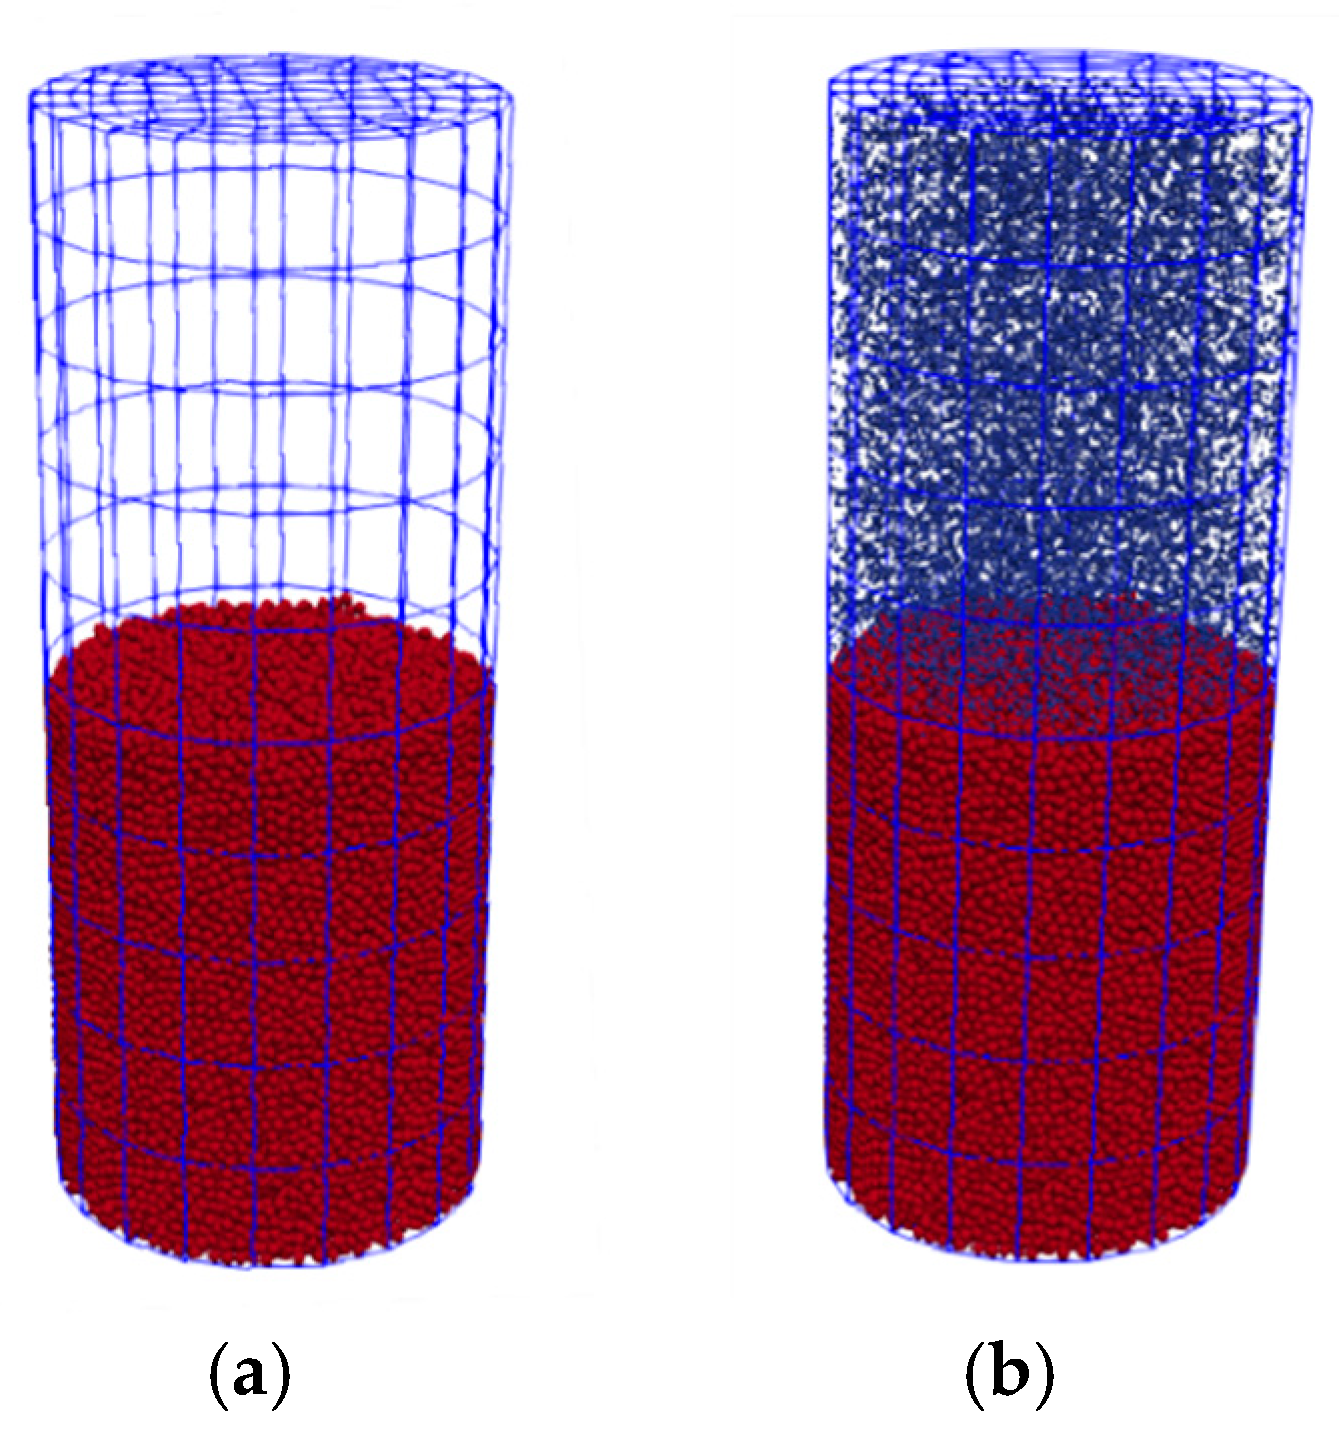
The major purpose of DEM initialization is to generate a sand column, which occupies half the volume of the infiltration column. The sand particles are set to settle purely under the gravity. Consequently, in this process, the interaction force is not included. As the length of the center square fluid cell of the CFD mesh is 2 cm, the particle diameter of the sand column could be selected as 0.6 cm. Forty thousand monodisperse sand particles are generated randomly inside the infiltration column and then settle at the bottom with an average porosity of 0.4 as shown in Figure 5a.
After generating the sand column, slurry particles are inserted above it. The slurry particle diameter is determined based on the experimental study by Min et al. [7]. According to their experiments, three types of filter cake are observed and termed as Type I (all grains of the slurry are clogged on the surface of soil, and a thick layer of filter cake is formed), Type II (some fine grains of the slurry are penetrated into the soil, and an infiltrated zone of fine grains can be identified), and Type III (all grains of the slurry are penetrated into the soil, and no filter cake is formed on the surface of the soil). The particle size ratio between sand and slurry, as the authors indicate, serves as the controlling parameter of the type of filter cake. When , a Type I filter cake is formed on the soil face. When , a Type II filter cake is formed, and when , no filter cake (Type III) is observed, where denotes the sand particle size larger than 15% of the total particles, and is the slurry particle size larger than 85% of the total particles.
In accordance with the above conclusions, three sets of slurry particle size are selected to form the aforementioned types of filter cake. In each case, , respectively. Figure 5b shows the generation of slurry particles.
3.4. CFD–DEM Coupling Settings
The CFD–DEM coupling settings could be rather complex. We carried out a serials of trial simulations to determine the crucial settings such as DEM time step, coupling interval, and fluid model. For brevity, the details will not be discussed in this paper. Some key settings are listed in Table 1.
As for boundary conditions and initial conditions, the initial pressure of the inlet and outlet are given a fixed value and the side is set as zero-gradient (see Figure 4b for definitions of the boundaries). The initial velocities of inlet and outlet are both given a zero-gradient condition and a nonslip boundary condition is set for the side boundary.
Note that if we set the pressure of the inlet to be the real pressure of Min at el.’s experiments, the velocity of the particles would be extremely large. Consequently, the DEM time step needs to be set to be at least 10 times smaller than the present setting to keep the simulation numerically stable. For computational efficiency, the pressure at the inlet boundary is set to zero, which means that the slurry particles settle merely under the gravity and particle–fluid interaction force. This is slightly different from the experiments, but we focus on the sedimentation behavior on the surface of the soil in this simulation, rather than the exact pressure values along the slurry infiltration column. Hence, this simplification is reasonable within the scope of the present study.
4. Discussion
4.1. Filter Cake Formation
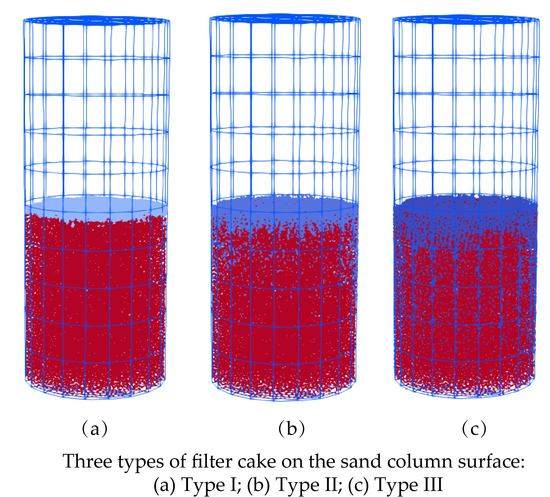
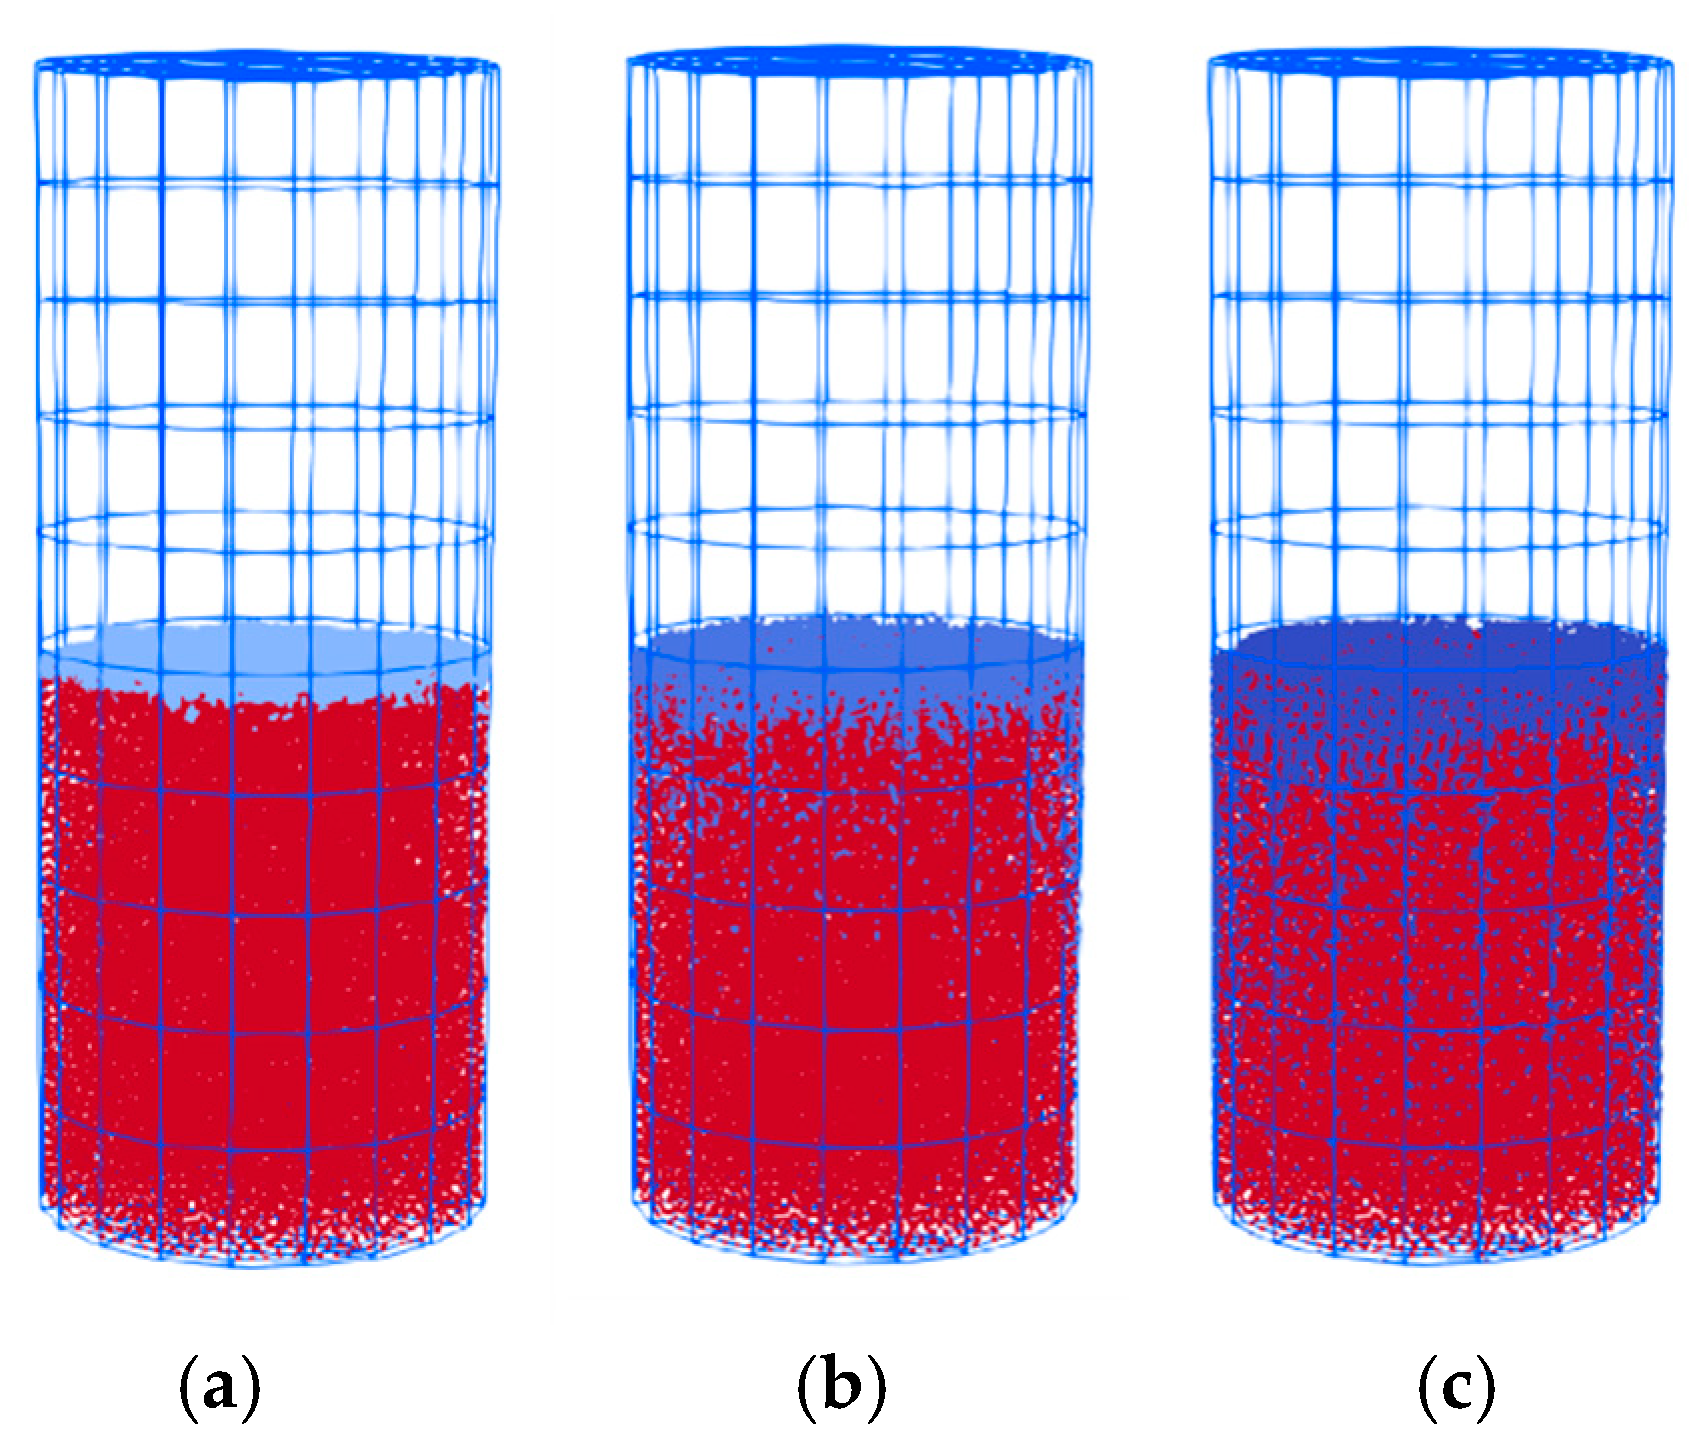
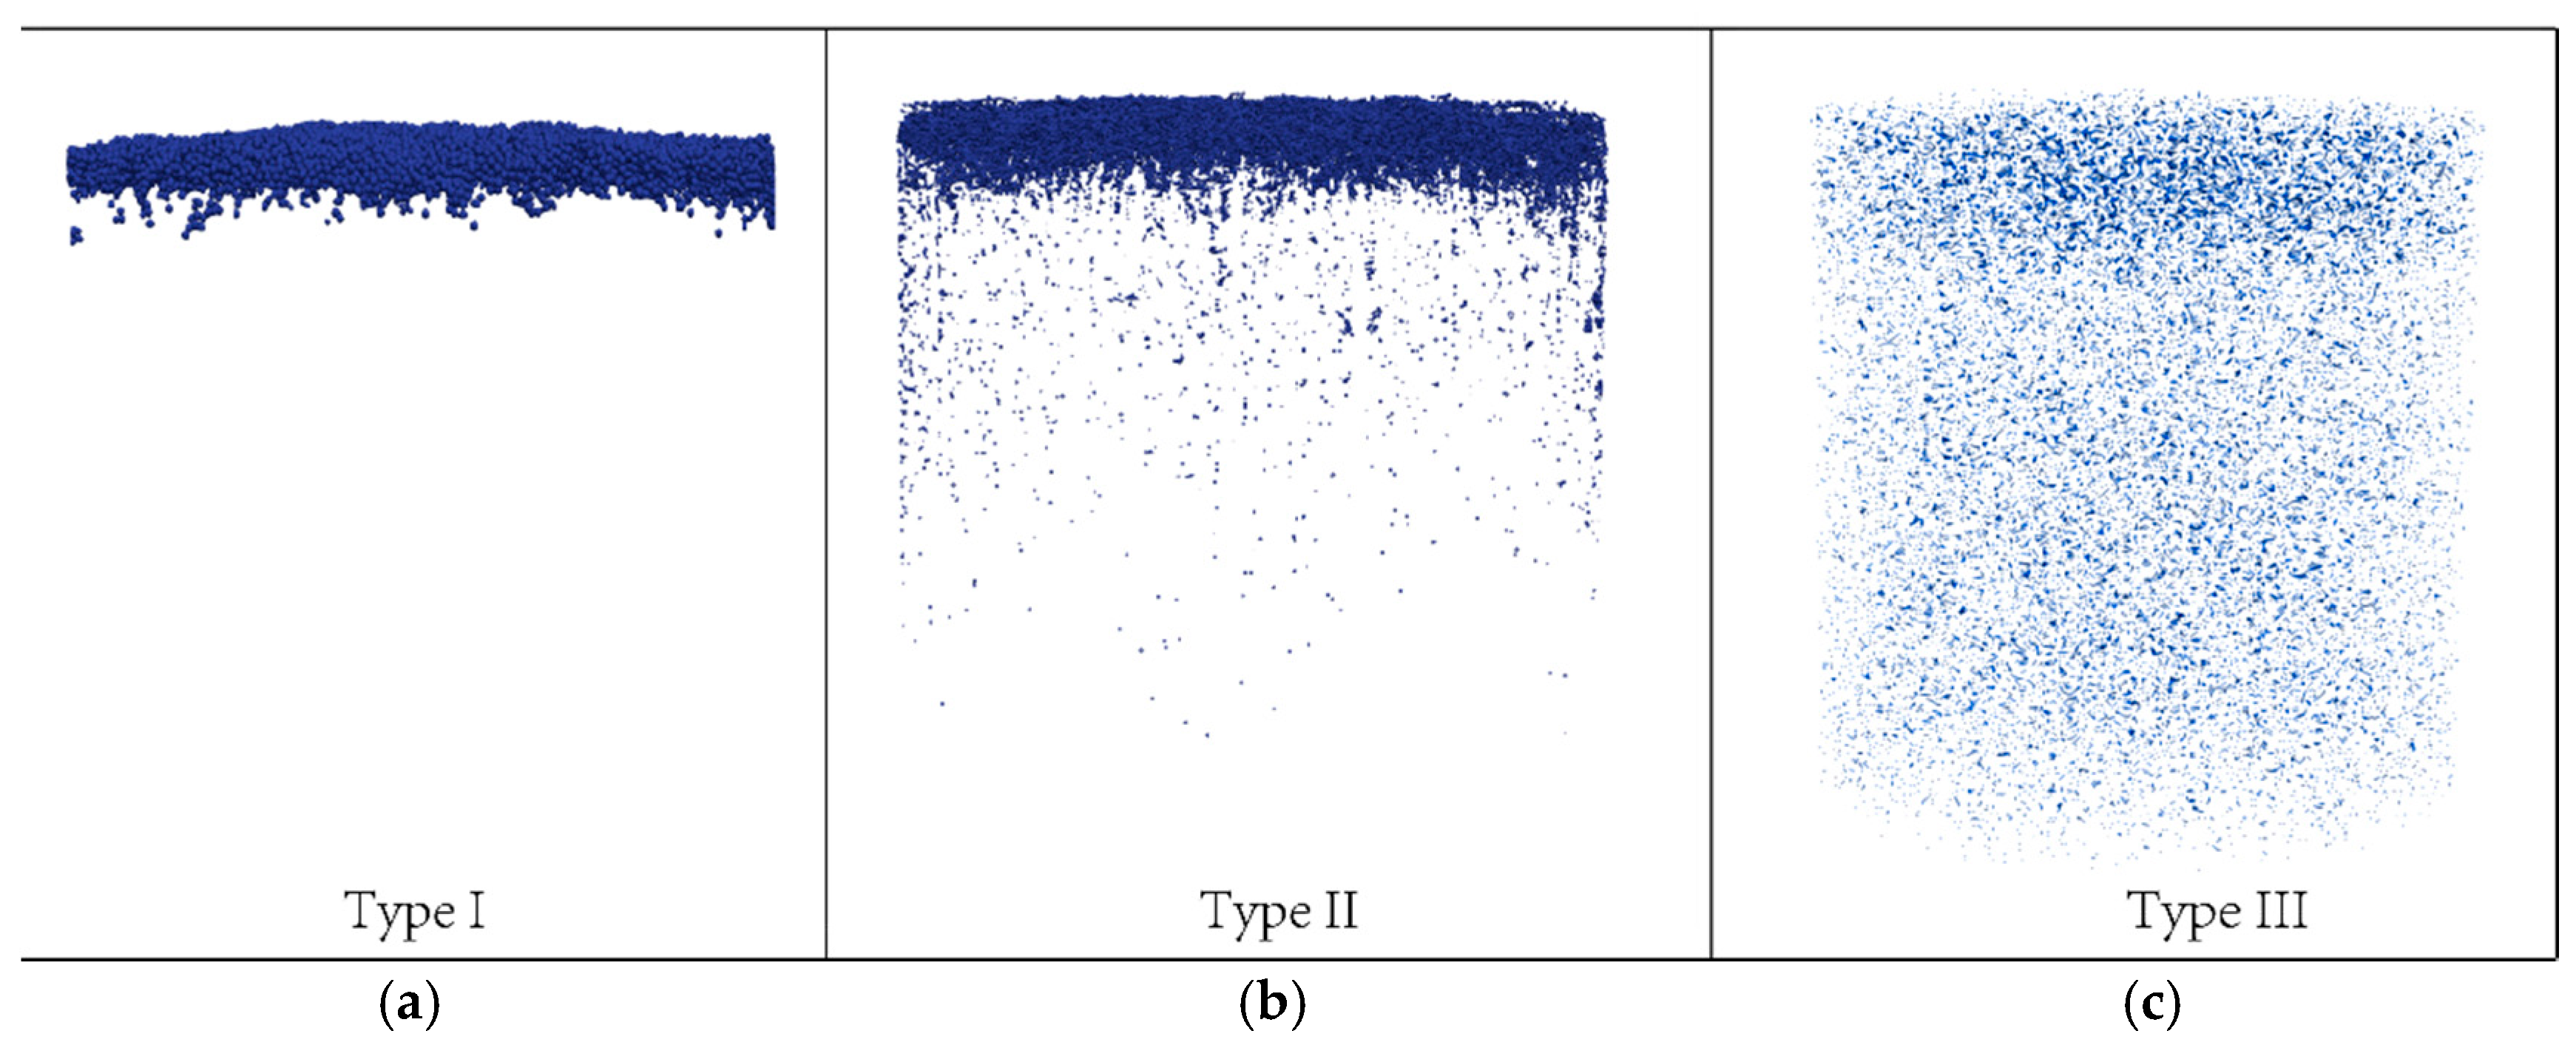
As shown in Figure 6, three types of filter cake are observed from numerical simulation results. In the case of (Figure 6a), nearly all of the slurry particles accumulate on the surface of the sand column and form a rather thick and dense filter cake, which corresponds to the Type I filter cake. In the case of (Figure 6b), most of the slurry particles remain on the sand column surface. However, a small fraction of the slurry particles infiltrate deeper into the sand column and create a so-called “infiltration zone”. This behavior is in accordance with the Type II filter cake. As for the case of (Figure 6c), nearly all of the slurry particles penetrate into the sand column and no obvious filter cake is observed on the surface of the sand column, which shows the Type III filter cake. For better illustration of the different types of filter cake, the slurry particles at the end of the simulations are extracted and visualized in Figure 7.
4.2. Porosity Distribution Inside the Filtration Column
The change of porosity distribution is another indication of the filter cake formation. The slurry particles might clog the pores inside the sand column and change the initial porosity distribution along the sand column.
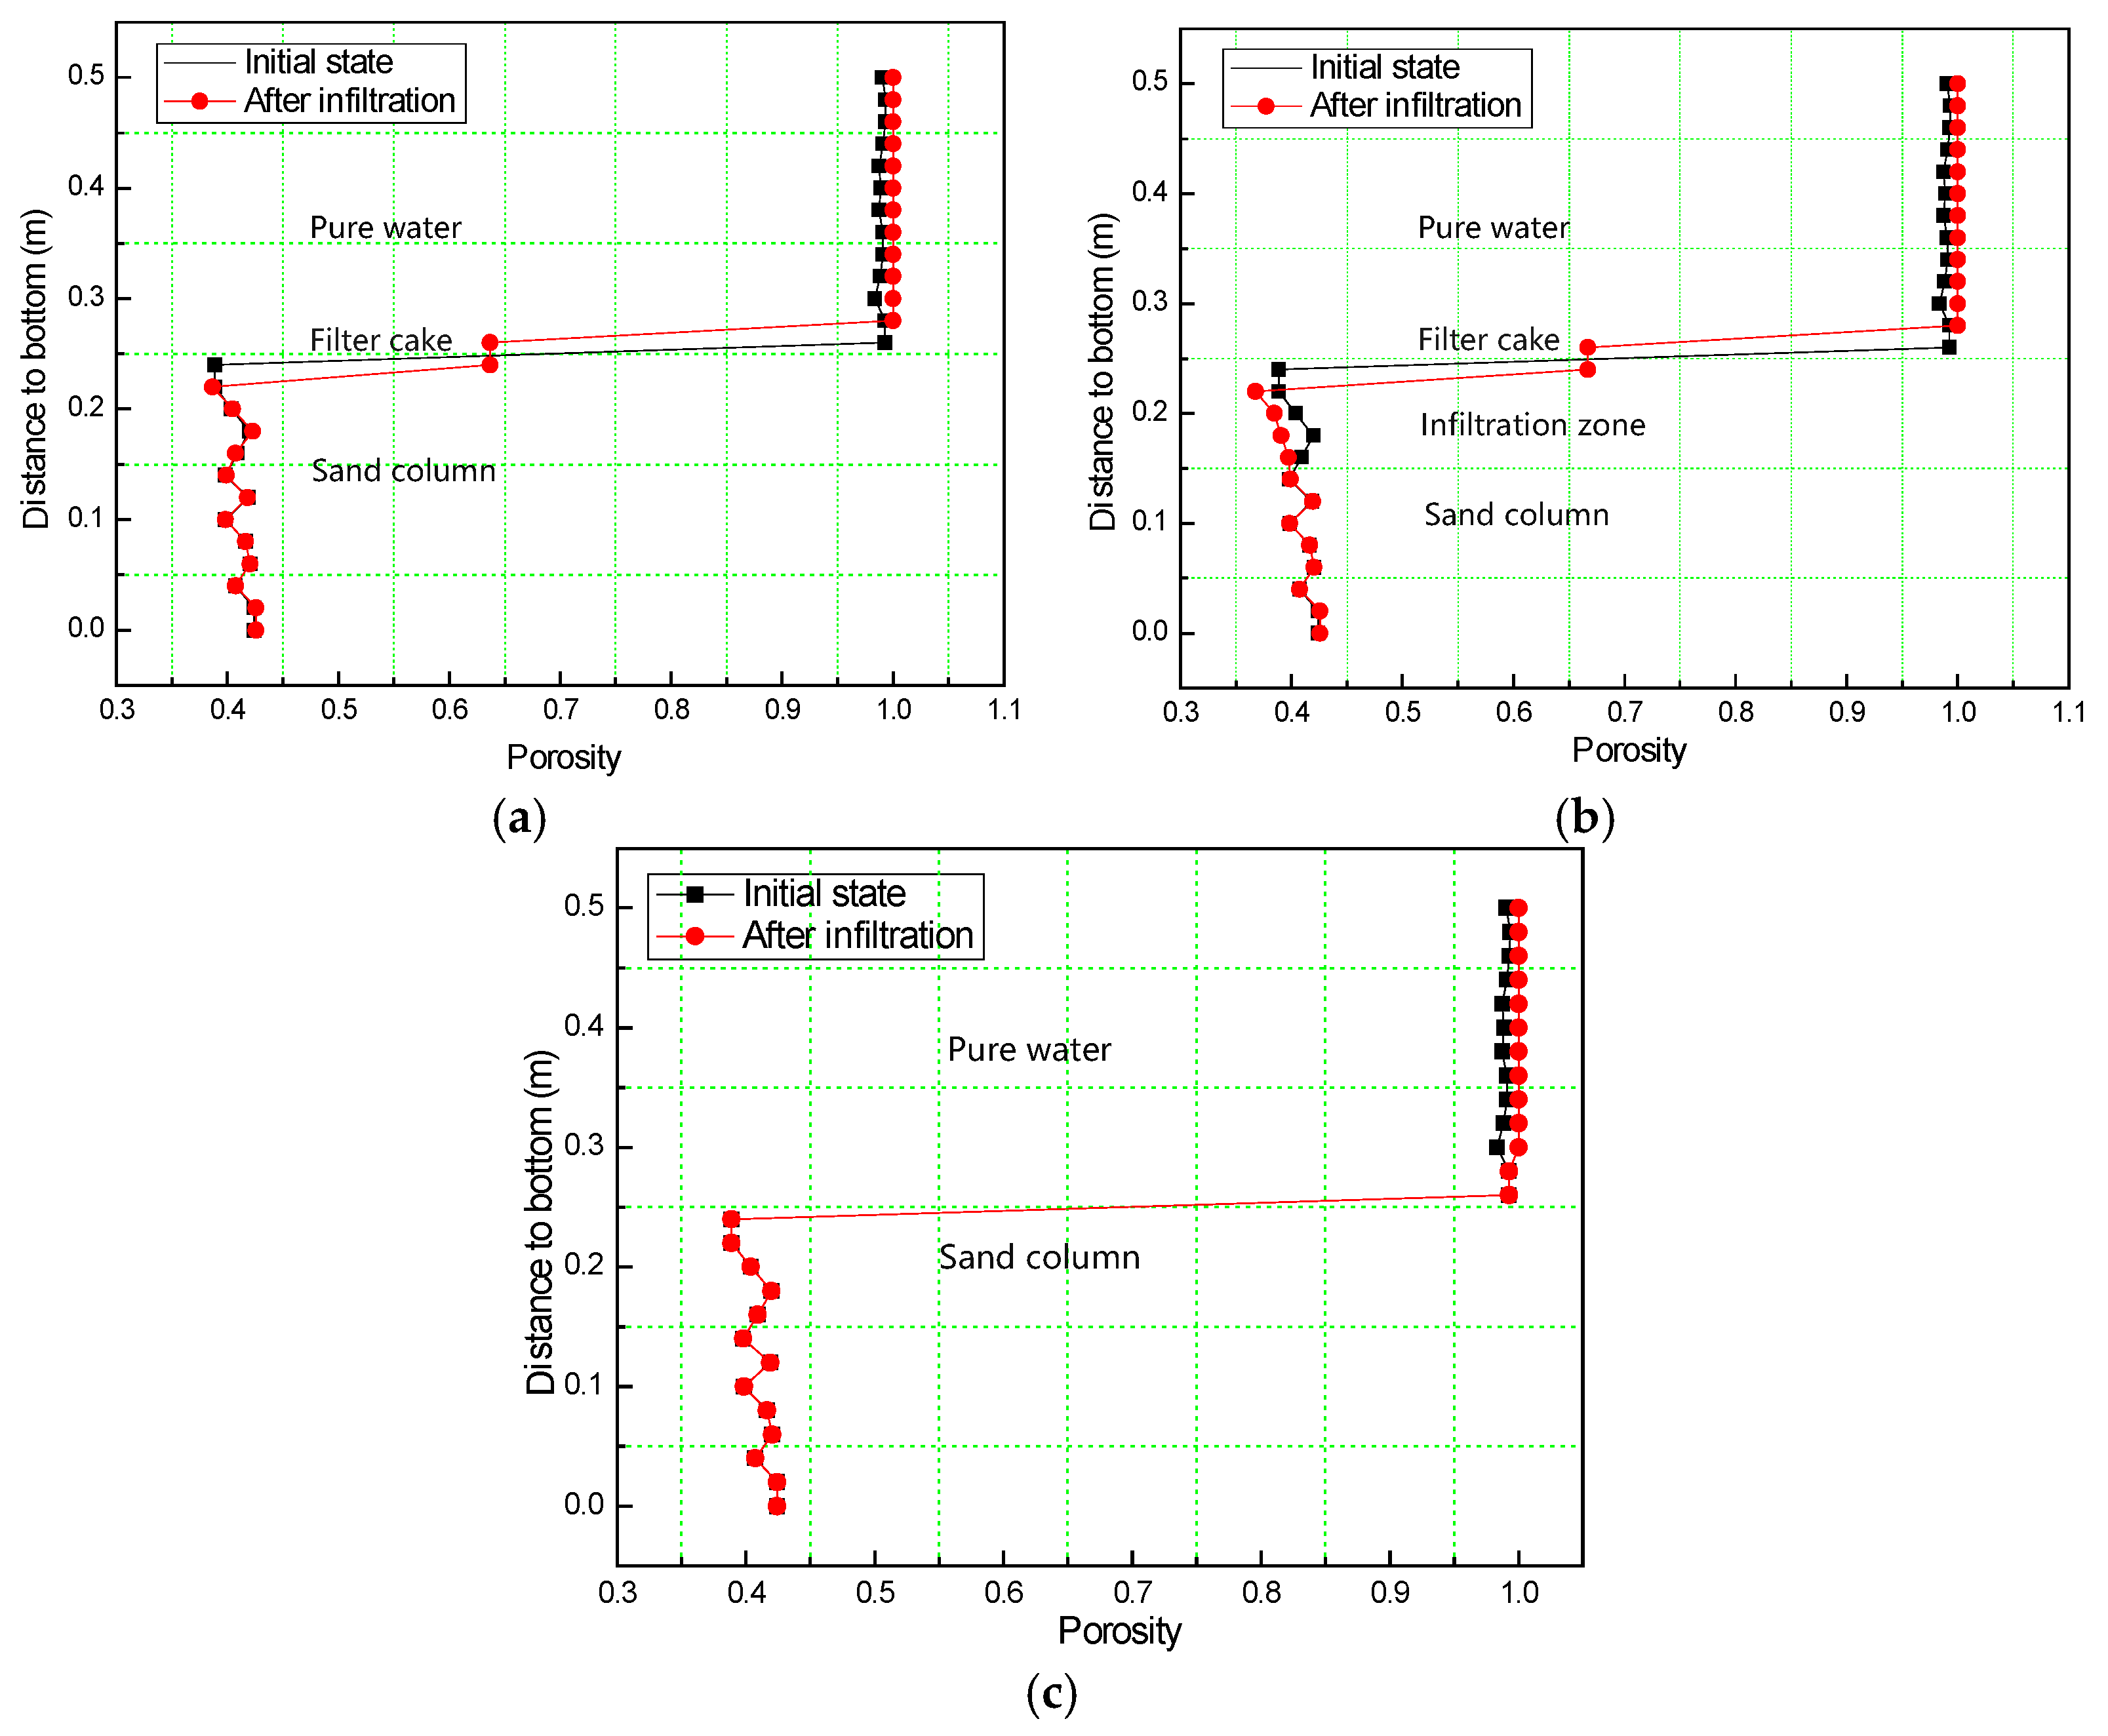
Figure 8 shows that three types of slurry filtration induce different changes in the porosity distribution from the initial state to the final state. The porosity of the initial state along the filtration column can be divided into two parts due to the existence of the sand column, slurry particles, and their interface. There is a sharp increase in porosity from around 0.4 to 0.98 at the interface. However, after slurry infiltration, a slight difference could be observed in terms of porosity distribution. For Type I filter cake as Figure 8a shows, the porosity distribution curve exhibits a plateau with a porosity around 0.63 at the interface, indicating the formation of the filter cake. Above the filter cake, as the sedimentation of slurry particles, the porosity tends to be 1. Since no more particles penetrate deeper into the sand column, the porosity below the filter cake nearly remains the same as the initial state. However, for a Type II filter cake, due to the formation of the “infiltration zone” (see Figure 7b), a slight decrease of porosity could be observed below the interface as Figure 8b shows. The porosity at the plateau (0.66) is larger than that of the Type I filter cake curve, which indicates a looser filter cake forming at the sand column surface. As for the Type III porosity distribution curve, except for the porosity distribution above the sand column, no obvious difference occurs between the initial state and final state since the slurry particles are too small to clog the pores inside the sand column.
5. Conclusions
In this paper, a coupled CFD–DEM simulation of slurry filtration and filter cake formation is presented to analyze the infiltration behavior between slurry particles and a sand column in a filtration column test. Three sets of sand and slurry particle sizes were selected according to Min et al.’s experiments to model the formations of three types of filter cake. Based on the simulation results, the following conclusions could be drawn:
- (1)
- The interaction between sand and slurry particles could be classified into three types by the sedimentation behavior of slurry particles on the sand particles: Type I, Type II, and Type III. For Type I, a dense and thick filter cake forms on the sand column surface. For Type II, a relatively loose filter cake and an “infiltration zone” are observed. For Type III, no obvious filter cake forms since the slurry particles are too small to clog the pores inside the sand column. These results are in accordance with Min et al.’s experimental results.
- (2)
- Three types of distribution of porosity along the column are obtained. Based on the porosity distribution, the ranges of zones of pure water, filter cake, infiltration, and sand column could be identified.
- (3)
- The coupled CFD–DEM method is capable of simulating slurry filtration and filter cake formation during a filtration column test. With the development of computing technology, this method has the potential to simulate more complex problems such as full-scale modelling of an in situ slurry shield project.
Author Contributions
Conceptualization, Z.Z. and T.Y.; Methodology, Z.Z and T.Y.; Software, T.Y; Formal Analysis, T.Y; Investigation, T.Y.; Data Curation, T.Y.; Writing-Original Draft Preparation, T.Y; Writing-Review & Editing, Z.Z and T.Y.; Visualization, T.Y.; Supervision, Z.Z.; Project Administration, Z.Z.; Funding Acquisition, Z.Z.
Funding
The research was financed by the Natural Science Foundation of China (No. 41372276 and No. 51509186).
Conflicts of Interest
The authors declare no conflict of interest.
References
- Eisensteib, Z.D. Large undersea tunnels and progress of tunneling technology. Tunn. Undergr. Sp. Tech. 1994, 9, 283–292. [Google Scholar] [CrossRef]
- Lee, D.J.; Wang, H.C. Theories of cake filtration and consolidation and implications to sludge dewatering. Wat. Res. 2000, 34, 1–20. [Google Scholar] [CrossRef]
- Tien, C.; Bai, R. An assessment of the conventional cake filtration theory. Chem. Eng. Sci. 2003, 58, 1323–1336. [Google Scholar] [CrossRef]
- Krause, T. Schildvortrieb Mit Flüssigkeits- und Erdgestützter Ortsbrust. Ph.D. Thesis, Technischen Universität Carolo-Wilhelmina, Braunschweig, Germany, 1987. [Google Scholar]
- Talmon, A.M.; Mastbergen, D.R.; Huisman, M. Invasion of pressurized clay suspensions into granular soil. J. Porous Media 2013, 16, 351–365. [Google Scholar] [CrossRef]
- Min, F.L.; Zhu, W.; Han, X.R.; Zhong, X.C. The effect of clay content on filter cake formation in highly permeable gravel. Geotech. Spec. Publ. 2010, 204, 210–215. [Google Scholar]
- Min, F.L.; Zhu, W.; Han, X.R. Filter cake formation for slurry shield tunneling in highly permeable sand. Tunn. Undergr. Sp. Tech. 2013, 38, 423–430. [Google Scholar] [CrossRef]
- Kloss, C.; Goniva, C. LIGGGHTS: A new open source discrete element software simulation. In Proceedings of the 5th International Conference on Discrete Element Methods, London, UK, 25–26 August 2010. [Google Scholar]
- Goniva, C.; Kloss, C.; Hager, A.; Pirker, S. A new open source CFD-DEM Perspective. In Proceedings of the 5th OpenFOAM Workshop, Gothenburg, Sweden, 21–24 June 2010. [Google Scholar]
- Tao, H.; Tao, J.L. Quantitative analysis of piping erosion micro-mechanisms with coupled CFD and DEM method. Acta Geotech. 2017, 12, 573–592. [Google Scholar] [CrossRef]
- Cundall, C.T.; Strack, O.D.L. A discrete numerical model for granular assemblies. Geotechnique 1979, 29, 47–65. [Google Scholar] [CrossRef]
- Anderson, T.; Jackson, R. A fluid mechanical description of fluidized beds: Equations of motion. Ind. Chem. Eng. Fundam. 1967, 6, 527–534. [Google Scholar] [CrossRef]
- Kaifui, K.; Thornton, C.; Adams, M. Discrete particle-continuum fluid modelling of gas-solid fluidised beds. Chem. Eng. Sci. 2002, 57, 2395–2410. [Google Scholar] [CrossRef]
- Zhu, H.P.; Zhou, Z.Y.; Yang, R.Y.; Yu, A.B. Discrete particle simulation of particulate system: Theoretical developments. Chem. Eng. Sci. 2007, 62, 3378–3396. [Google Scholar] [CrossRef]
- Drew, D.A.; Lahey, R.T. Some supplemental analysis concerning the virtual mass and lift force on a sphere in a rotating and straining flow. Int. J. Multiph. Flow 1990, 16, 1127–1130. [Google Scholar] [CrossRef]
- DEM Solutions. EDEM-CFD Coupling for FLUENT: User Guide; DEM Solutions: Edinburgh, UK, 2010. [Google Scholar]
- Xu, S.L.; Sun, R.; Cai, Y.Q.; Sun, H.L. Study of sedimentation of non-cohesive particles via CFD-DEM simulations. Granul. Matter 2018, 20, 4. [Google Scholar] [CrossRef]
- Di Felice, R. The voidage function for fluid-particle interaction systems. Int. J. Multiph. Flow 1994, 20, 153–159. [Google Scholar] [CrossRef]
- Duan, C.L.; Sheng, C.; Wu, L.L.; Wu, Y.M.; He, J.F. CFD-DEM simulation of fluid-solid flow of a tapered column separation bed. Int. J. Min. Sci. Technol. 2015, 25, 855–859. [Google Scholar] [CrossRef]
- Zhao, T.; Houlsby, G.T.; Utili, S. Investigation of granular batch sedimentation via DEM-CFD coupling. Granul. Matter 2014, 16, 921–932. [Google Scholar] [CrossRef]
- Chen, J.K.; Wang, Y.S.; Li, X.F.; He, R.Y.; Han, S.; Chen, Y.L. Erosion prediction of liquid-particle two-phase flow in pipeline elbows via CFD-DEM coupling method. Powder Technol. 2015, 275, 182–187. [Google Scholar] [CrossRef]
- Zhao, J.D.; Shan, T. Coupled CFD-DEM simulation of fluid-particle interaction in geomechanics. Powder Technol. 2013, 239, 248–258. [Google Scholar] [CrossRef]
- Peng, Z.B.; Doroodchi, E. Influence of Void Fraction Calculation on Fidelity of CFD-DEM Simulation of Gas-Solid Bubbling Fluidized Beds. Part. Technol. Fluid. 2014, 60, 2000–2018. [Google Scholar] [CrossRef]
Figure 1.
Schematic diagram of the conventional slurry infiltration process (adapted from [2]).
Figure 1.
Schematic diagram of the conventional slurry infiltration process (adapted from [2]).

Figure 2.
Schematic diagram of a slurry infiltration column test (adapted from [7]).
Figure 2.
Schematic diagram of a slurry infiltration column test (adapted from [7]).

Figure 3.
Coupling process of computational fluid dynamics (CFD)–discrete element method (DEM) (adapted from [10]).
Figure 3.
Coupling process of computational fluid dynamics (CFD)–discrete element method (DEM) (adapted from [10]).

Figure 4.
The CFD mesh: (a) top view, (b) side view.

Figure 5.
Generation of sand column and slurry particles: (a) sand column, (b) slurry particles.

Figure 6.
Three types of filter cake on the sand column surface: (a) Type I; (b) Type II; (c) Type III.
Figure 6.
Three types of filter cake on the sand column surface: (a) Type I; (b) Type II; (c) Type III.

Figure 7.
Extracted slurry particles inside the sand column: (a) Type I; (b) Type II; (c) Type III.

Figure 8.
Porosity distribution along the infiltration column of initial state and after infiltration: (a) Type I; (b) Type II; (c) Type III.
Figure 8.
Porosity distribution along the infiltration column of initial state and after infiltration: (a) Type I; (b) Type II; (c) Type III.


Table 1.
Some key CFD–DEM settings.
| Settings | Value |
|---|---|
| DEM time step | 1 × 10⁻⁶ |
| Coupling interval | 100 |
| Model Type | B |
| VoidFractionModel | divided |
| AverageingModel | dense |
| ForceModels | DeFeliceDrag Archimedes |
| Fluid Viscosity | 1 × 10⁻⁶ m2/s |
| Fluid Type | Newtonian |
© 2018 by the authors. Licensee MDPI, Basel, Switzerland. This article is an open access article distributed under the terms and conditions of the Creative Commons Attribution (CC BY) license (http://creativecommons.org/licenses/by/4.0/).
Share and Cite
MDPI and ACS Style
Zhang, Z.; Yin, T. A Coupled CFD–DEM Simulation of Slurry Infiltration and Filter Cake Formation during Slurry Shield Tunneling. Infrastructures 2018, 3, 15. https://doi.org/10.3390/infrastructures3020015
AMA Style
Zhang Z, Yin T. A Coupled CFD–DEM Simulation of Slurry Infiltration and Filter Cake Formation during Slurry Shield Tunneling. Infrastructures. 2018; 3(2):15. https://doi.org/10.3390/infrastructures3020015
Chicago/Turabian StyleZhang, Zixin, and Tong Yin. 2018. "A Coupled CFD–DEM Simulation of Slurry Infiltration and Filter Cake Formation during Slurry Shield Tunneling" Infrastructures 3, no. 2: 15. https://doi.org/10.3390/infrastructures3020015