1. Introduction
The term “soundscape” in its current meaning dates back to the early 1970s, when it was introduced by the Canadian composer R. M. Schafer at Simon Fraser University in Vancouver [
1]. Schafer and his research group defined “soundscape” as “[an] environment of sound (or sonic environment) with emphasis on the way it is perceived and understood by the individual, or by a society” [
2].
Hitherto, the concept has attracted interest from both applied and social sciences, as well as arts and humanities, due to its strong interdisciplinary appeal. Over the years, an increasing number of studies have been published, proposing theoretical models for soundscape characterization and practical approaches for its improvement. In 2014, the International Organization for Standardization (ISO) published a new International Standard, ISO 12913-Part 1, on soundscape, which defines the word as “[the] acoustic environment as perceived or experienced and/or understood by a person or people, in context” [
3].
Despite a vibrant debate in this research field about overall agenda and methods, there is a general agreement that the “soundscape” differs from the “acoustic environment” inasmuch as the former is a perceptual construct, whereas the latter is a physical phenomenon. Within this framework, it has to be assumed that soundscape only exists through human perception of the acoustic environment [
4,
5]. To some extent, this assumption is in line with the definition of “landscape” provided by the Landscape Convention, as “an area, as perceived by people, whose character is the result of the action and interaction of natural and/or human factors” [
6].
Overall, the soundscape approach emphasizes the “user’s experience” of the acoustic environment of a place. Thus, it seems fair to assume that “sound” should also contribute in shaping a dimension of the tourist aesthetic judgment and the tourism experience in general.
Tourism experience has been thoroughly investigated in tourism marketing and management literature (e.g., [
7,
8]). It has been proved that the environmental qualities of a destination can contribute to its aesthetic appreciation and impact the overall tourist experience [
9]. Thus, such aesthetic qualities, such as scenery and sound environment, should be regarded as key components of tourists’ satisfaction.
The auditory dimension is increasingly gaining attention in cultural heritage studies [
10,
11] thanks to the framework provided by the United Nations Educational, Scientific and Cultural Organization (UNESCO) Convention on the Intangible Cultural Heritage [
12], and the soundscape approach has also been considered in a number of studies connected to the tourism management of natural areas [
13,
14,
15,
16]. However, there are relatively few studies considering the soundscape within the urban realm, rather than in natural areas, from the tourists’ perspective. Liu et al. [
17] investigated the perception of the sound environment by both tourists and acoustic experts in historical areas of Beijing, finding significant differences between the two groups. Puyana Romero et al. [
18] observed significant differences in the soundscape individual appraisals between tourists and residents in their study on the soundscape of the waterfront of Naples, in the city centre.
On the assumption that the soundscape approach could also be a suitable tool in tourism management, due to its general purpose of enhancing the users’ experience of a place by taking into account the acoustic dimension of the environment, this paper presents the results of the soundscape characterization of a common tourist route in Sorrento (Italy). For this purpose, a group of acoustics experts, architects, and planners used the soundwalk method to collect perceptual data about the sound environment along a pre-defined tourist path.
2. Methods
Individual responses about the perception of the sound environment along a pre-defined typical tourist route and acoustics data were collected through a soundwalk in the city centre of Sorrento. The current section provides details on the participants, the experimental protocol, and the questionnaires submitted to the participants during the soundwalk.
The soundwalk is a conventional method in soundscape studies that enables a researcher to collect individual responses on the perception of the acoustic environment [
19,
20] and simultaneous audio recordings. Usually, soundwalks are participatory sound and listening walks performed in groups (soundwalk sessions) across an investigated environment. During these sessions, the investigator usually makes binaural sound recordings and collects the perceptual responses of the participants to the acoustical, visual, and aesthetic environment through questionnaires.
For the purposes of this study, 11 spots along a common tourist pedestrian route were selected in the Sorrento city centre. The rationale for selecting such spots was to provide a set of urban contexts having a specific tourist appeal (e.g., commercial street, quiet area, seaside), with varied and diverse acoustic environments. Sixteen participants, 26 to 47 years old (10 males, Mean age = 34.6, Standard Deviation = 6.8), attended the soundwalk. The participants’ group included soundscape experts, acousticians, architecture and planning professionals, and local authorities’ officers. All of them could be considered as tourists, since they were not residents and visited Sorrento for the first time.
In the literature there is still no evident consensus on the criteria to select participants for a soundwalk [
21,
22], i.e., whether laymen, residents, or experts should be invited to take part. However, some authors suggest that expert and/or trained listeners might provide more useful insights (e.g., [
20]). Due to its exploratory nature, for this study it was agreed to have participants not familiar with the study area to represent the tourist perception; however, at the same time they had to be familiar with the soundscape concept, to be able to reflect possible outputs of the investigation into a broader urban planning and design framework. Participants were sorted into four groups (A, B, C, and D) of four people each. The groups were led by investigators who walked across the study area and stopped at 11 selected locations. The spots were selected to be representative of potential tourist routes and to have varied acoustic environments (see
Table 1).
The questionnaire used for the soundwalk [
21] is reported in
Table 2. In order to control for possible effects of sudden acoustic events at the 11 selected spots, the four groups were asked to start the soundwalk with 10-min delays and alternately in opposite walking directions (clockwise and counter-clockwise) after spot 2, as reported in
Figure 1. At each spot, participants were required to listen to the acoustic environment for a two-minute period and then fill the structured questionnaire. At the same time, the investigator in the group took a binaural recording of the acoustic environment by means of a calibrated binaural headset (1/8″ in-ear mics, Danish Pro Audio), connected to a portable recorder (Edirol R44).
3. Results
The main results are described in the following sub-sections with the objective of illustrating the potential benefit that the soundscape approach and the soundwalk methodology can offer to the improvement of tourism management.
3.1. Soundscape Appraisal between Groups
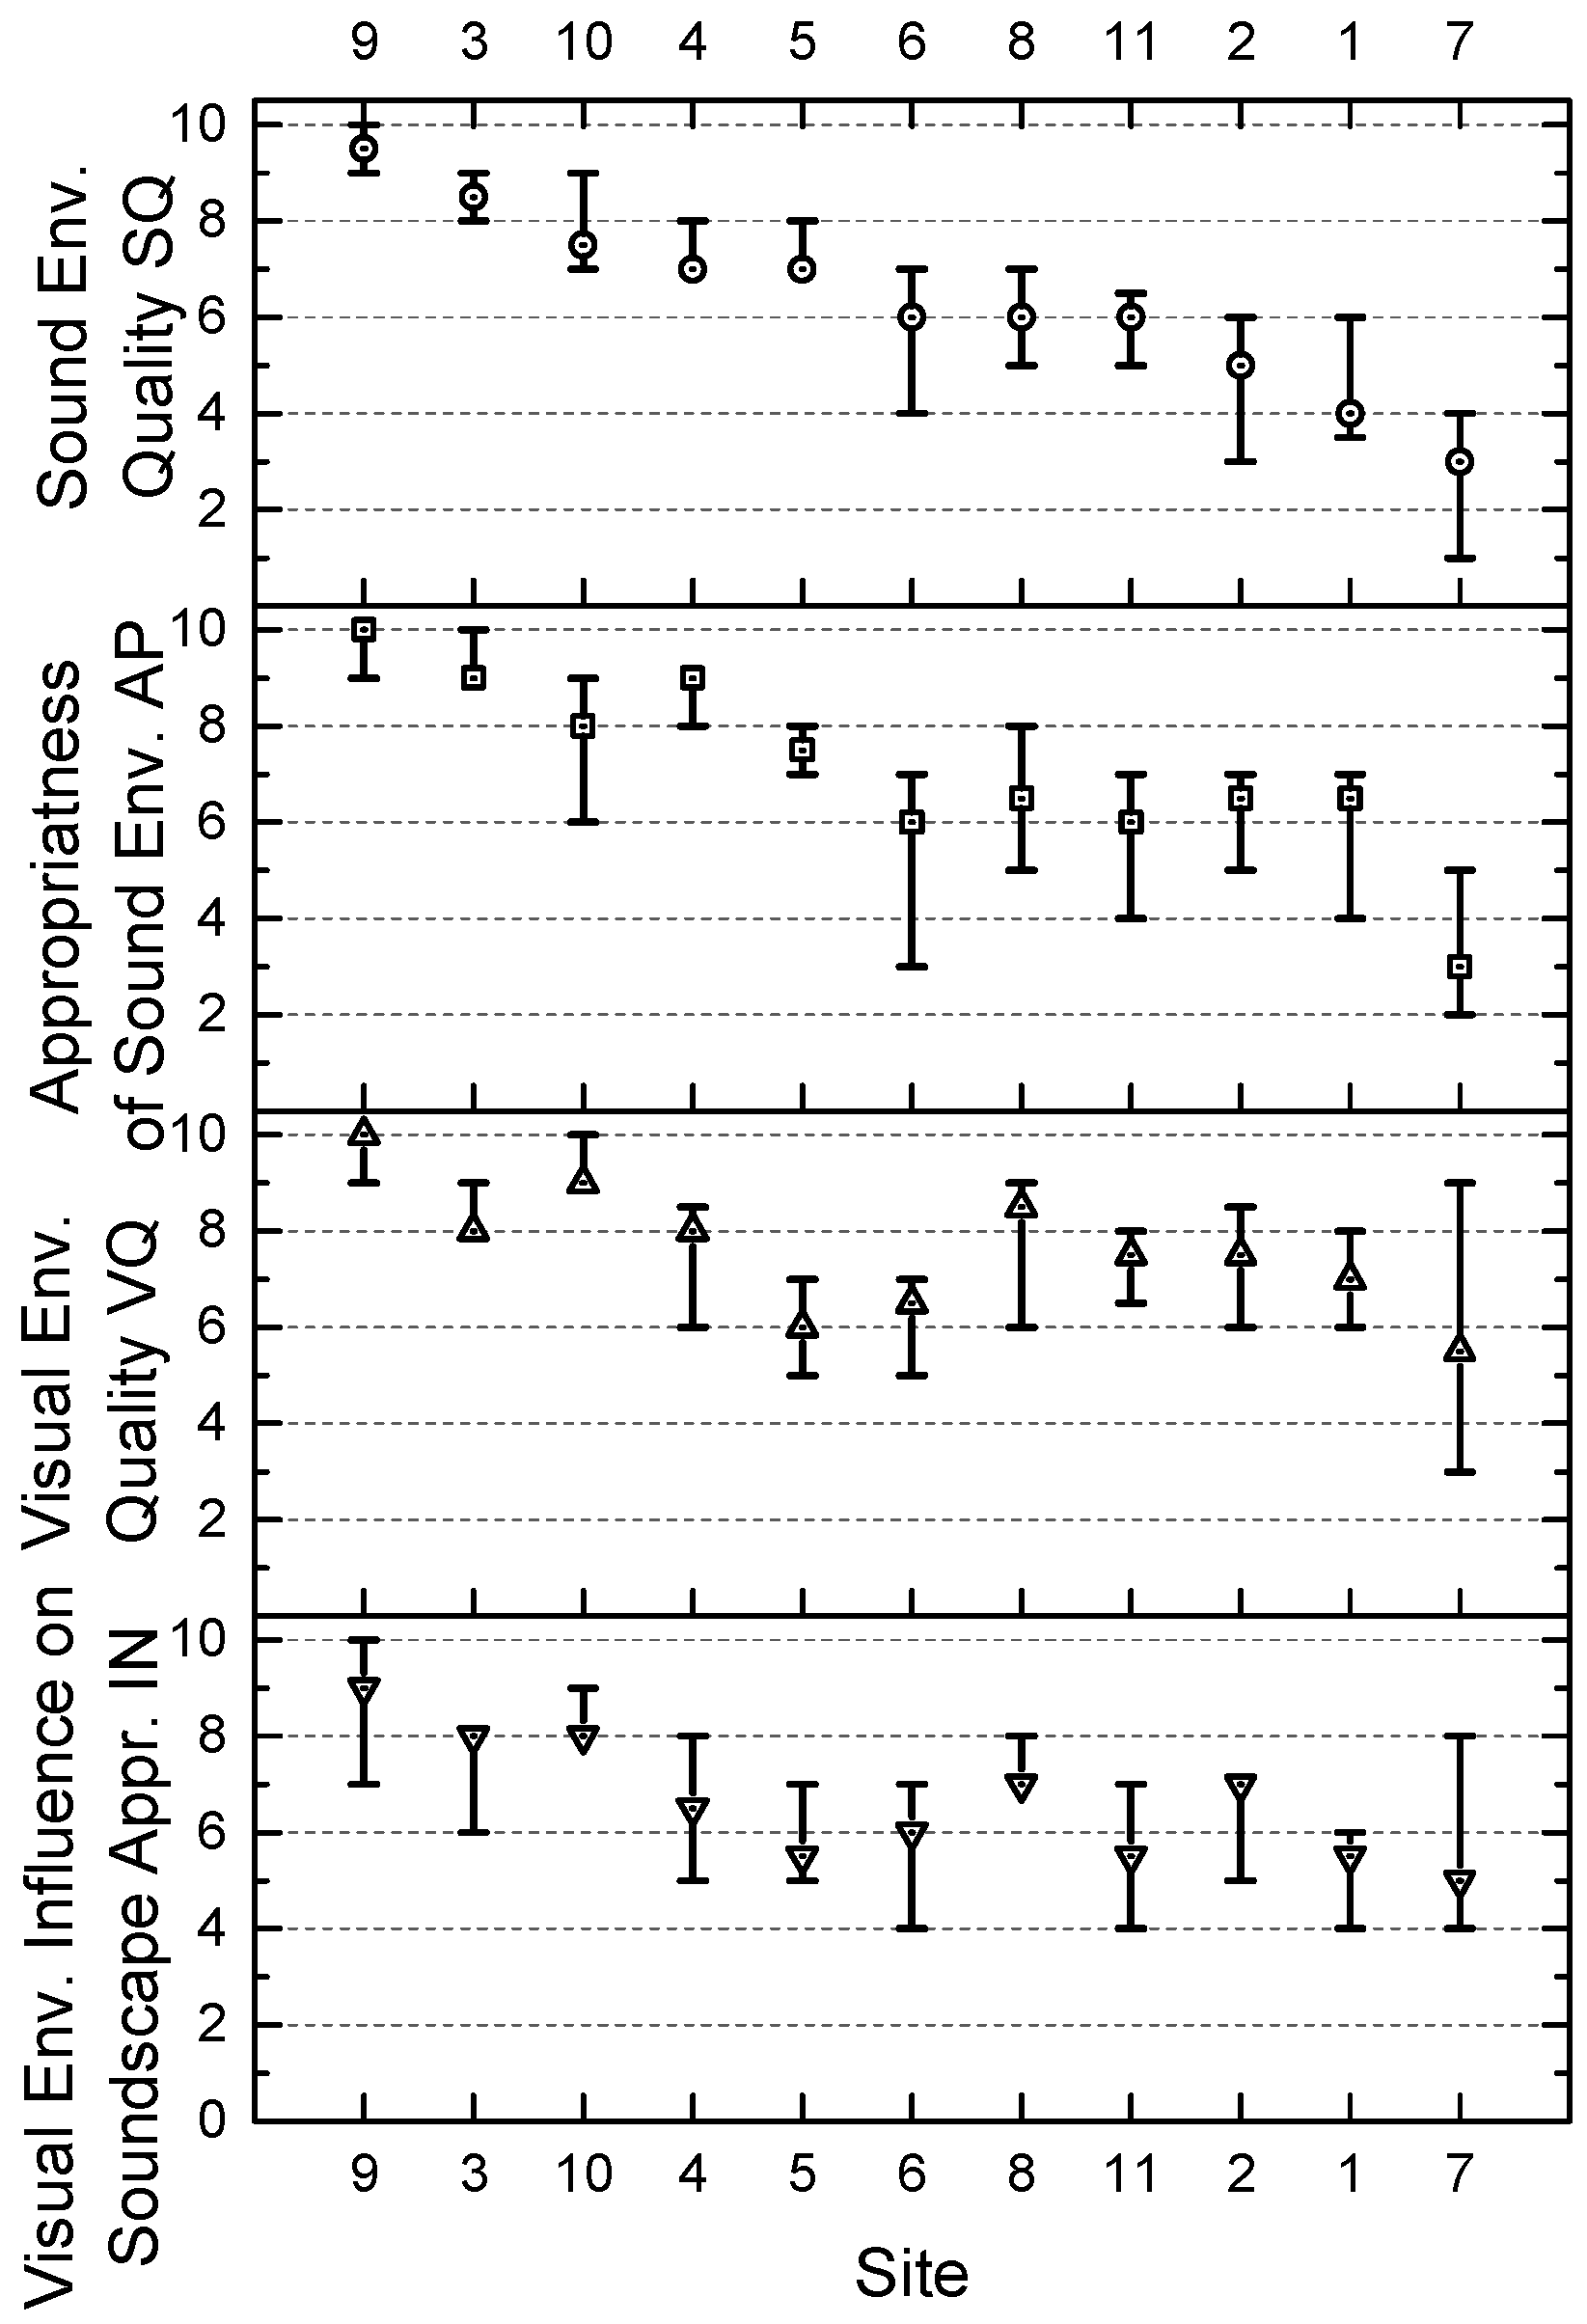
The rationale for sorting the participants into four groups was to control for the potential time of listening and spots’ order effects on soundscape appraisal, during the soundwalk session. Therefore, the first step of the analysis consisted of checking for statistical significant differences between the four groups. For this purpose, four general questions, namely SQ, AP, VQ, and IN (as reported in
Table 2), were selected within the questionnaire. These four questions were associated to four variables: Soundscape Quality, Appropriateness, Visual Quality, and Audio-visual influences, accordingly. A set of Kruskal-Wallis H tests was performed for each of the 11 spots, separately, to determine if there were statistically significant differences between the scores of the four groups for the four ordinal dependent variables.
Table 3 reports the Chi-squared (χ
2) values and asymptotic significance (
p) for the 44 tests performed (all tests had three degrees of freedom).
Results show that there was no statistical significant difference at 95% confidence level between the assessments of the four groups. Thus, the data for each variable given by the four groups have been pooled, as it is reasonable to assume that the time of listening and spots’ order effects on the soundscape appraisal can be disregarded.
Figure 2 shows the median values (averaged across the 16 participants) for the four investigated variables (SQ, AP, VQ, and IN) at the 11 spots of the soundwalk.
3.2. Psychoacoustic Metrics
In order to characterize the acoustic environments experienced by the participants during the soundwalk, the sound pressure level and some psychoacoustic parameters were determined from the binaural recordings performed at the 11 spots of the soundwalk using the ArtemiS software (v. 11, HEAD acoustics GmbH); their mean values are reported in
Table 4. Acoustic and psychoacoustic parameters cover several aspects of basic auditory sensations. The most common are loudness, roughness, sharpness, and fluctuation strength. Detailed information about definitions, meanings, and applications of such parameters can be retrieved in [
23]. The urban interaural level difference (uILD
2) was calculated by the difference in L
Aeq between the left and right channel of the binaural recording [
24].
3.3. Cluster Analysis Using Soundscape Data and Acoustic Metrics
Among the several statistical analyses of the collected data, this paper describes the results of the hierarchical cluster analysis performed to identify groups of soundwalk spots with similar psychoacoustic metrics and soundscape data mean values using all subjective (i.e.,
Table 3) and objective (i.e.,
Table 4) variables. The algorithm used in this analysis was the Ward’s method [
25], with Euclidean distance and standardization of the variables (0–1). Results suggest the agglomeration into three groups, as reported in
Table 5.
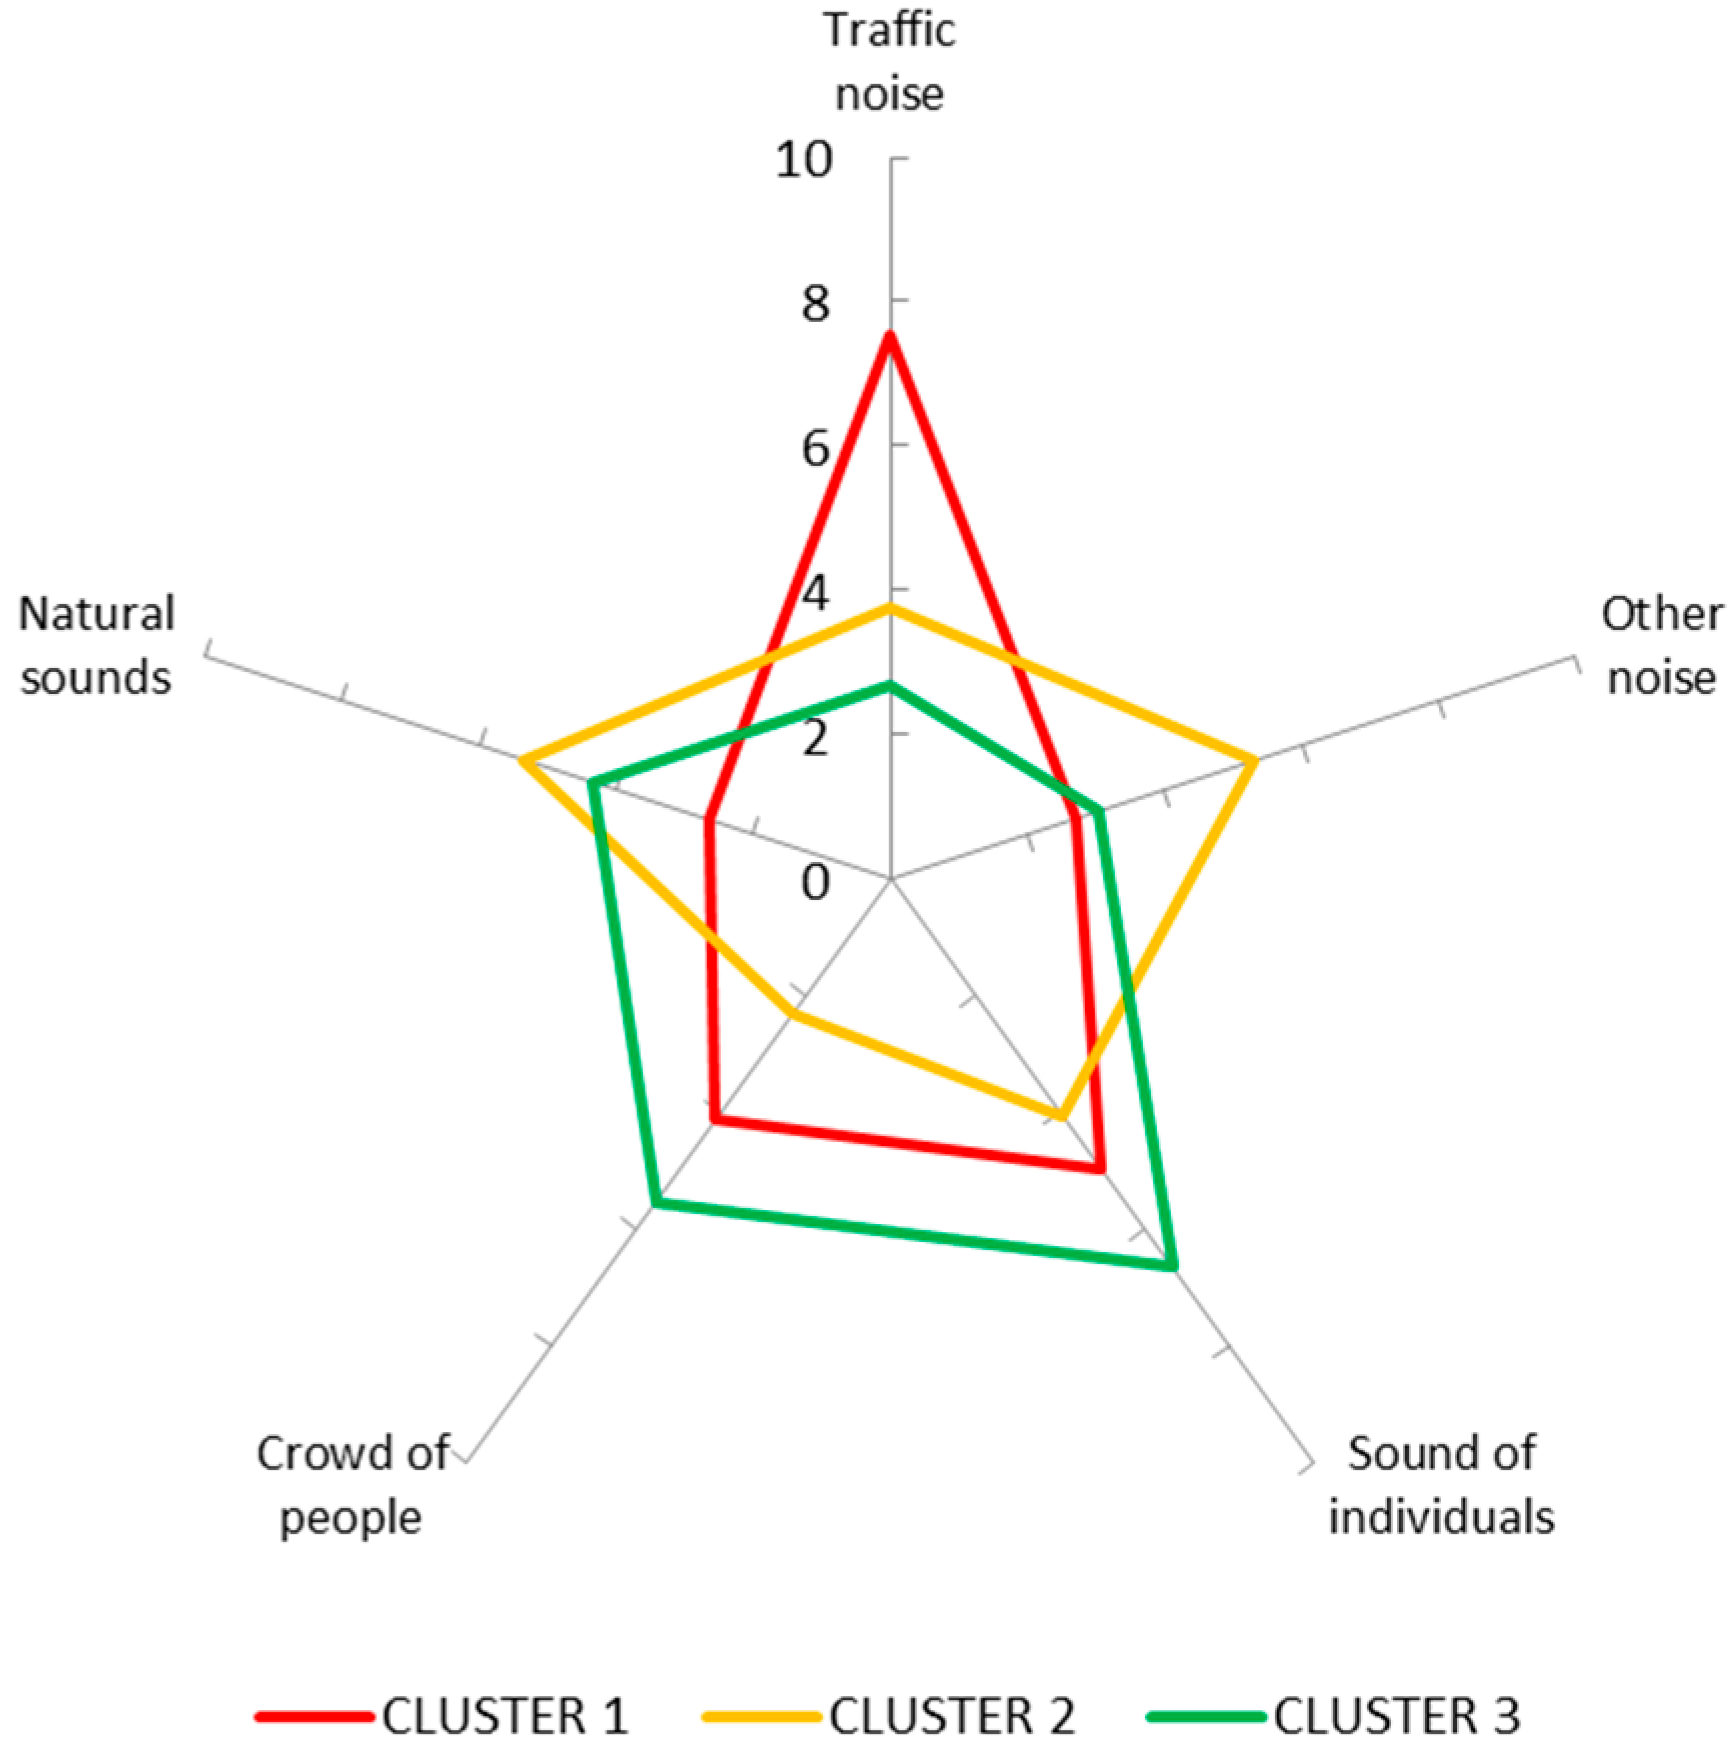
Figure 3 reports the sound source profiles, based on the sound source types used in the questionnaire (
Table 2, variable SP), and averaged according to the cluster membership. It can be observed that traffic noise was dominant in locations belonging to Cluster 1. In Cluster 2 locations, the crowd of people sounds were the least dominant, while natural sounds were the most dominant. Finally, in Cluster 3 locations, human sounds (i.e., crowd of people, sound of individuals) were the most dominant noticed sources.
Likewise, the individual response scores for the perceptual attributes used in the questionnaire (
Table 2, variable AT) were averaged according to the cluster membership and reported in
Figure 4. It can be observed that the locations in Cluster 3 reported overall higher scores in the pleasantness domain, whereas locations in Cluster 1 were the most annoying and chaotic.
In order to develop a model for predicting the cluster membership, multinomial logistic regression has been performed considering as independent variables the six acoustic parameters and the responses to the above mentioned four general questions, namely SQ, AP, VQ, and IN.
The “caret” package [
26] available in the “R” software [
27] was applied with
k-fold cross validation (
k = 10) and five repetitions. The available data were split into two sets, one used for training the model and the other used for testing it. The split (70% for training and 30% for testing, resulting in 44 cases for the latter) was performed randomly. The results are rather promising, as can be seen by the classification performance indices reported in
Table 6.
The relative importance of variables in the model were in descending order: roughness R (100%), loudness N (91.98%), fifth percentile of loudness N5 (75.27%), continuous equivalent sound pressure level LAeq (65.49%), visual quality VQ (52.65%), appropriateness of sound environment to the site AP (50.66), and so forth.
4. Discussion and Conclusions
In this study, the soundwalk method and binaural recordings were used to characterize the soundscape of a pedestrian tourist route in Sorrento (Italy), considering 11 spots along a pre-defined path. A cluster analysis relying on both individual and physical data was used to sort the 11 spots into three different groups. The results showed that the spots in Cluster 1 corresponded to the louder locations, and even if they had a moderate visual quality, their soundscape quality was low, possibly because their acoustic environment was dominated by traffic noise. Spots in Cluster 2 were quieter and, therefore, had a moderate soundscape quality, but they were not particularly visually attractive. Finally, spots in Cluster 3 had moderately low sound levels and even if they were not the quietest, they had high visual quality, and, therefore, resulted in the highest soundscape appreciation. In addition, the spots of Cluster 3 were those where the visual components mostly affected the individual judgement of the acoustic environment.
The relative importance of the variables for the clustering algorithm offers some insights into potentially viable strategies for designing better acoustic environments for tourist’s soundscape appreciation. The most important predictor was roughness; this parameter has often been considered to be representative of “the ‘impression’ of a sound’s temporal variation” [
24], and while “rougher” acoustic environments are generally associated with lower soundscape quality (e.g., [
28,
29]), this indicator might be useful to discriminate between calm and vibrant soundscapes, representing a first parameter to control for when designing the tourist experience. Likewise, the loudness indicators play a significant role, endorsing the fact that an important criterion for classifying urban environments is whether they are “quiet” or “loud”. Overall, these findings confirm that objective acoustic parameters are very important to categorize urban environments from a soundscape quality perspective.
Interestingly, the most important subjective parameter for the clustering algorithm was visual quality (VQ). A previous study [
18] showed that the assessment of this dimension is likely to differ significantly between tourists and residents, so urban planners and designers should aim at implementing different strategies for different group of users within a broader soundscape management framework.
Taken together, the results of this survey show that besides the acoustics aspects of spots, several other aspects (visual, social, urban, etc.) of the built environment are relevant for tourists’ perceptual construct of soundscape, particularly in sites with high landscape values, such as Sorrento. Overall, this suggests that soundscape could be a viable methodology to inform the management and design of destinations with high touristic potential.
Acknowledgments
This research received funding through the People Programme (Marie Curie Actions) of the European Union’s 7th Framework Programme FP7/2007–2013 under Research Executive Agency grant agreement No. 290110, SONORUS “Urban Sound Planner”. The authors are grateful to the organizers of the Soundscape summer school in Sorrento (April 2015), the participants of the soundwalks, and to Dr Virginia Puyana Romero for her support during data collection.
Author Contributions
Francesco Aletta, Giovanni Brambilla, Luigi Maffei, and Massimiliano Masullo conceived and designed the experiments and performed the experiments; Francesco Aletta and Giovanni Brambilla analyzed the data. All the authors wrote and revised the paper.
Conflicts of Interest
The authors declare no conflict of interest.
References
- Schafer, R.M. The Tuning of the World; Knopf: New York, NY, USA, 1977. [Google Scholar]
- Truax, B. Handbook for Acoustic Ecology; Cambridge Street Publishing: Cambridge, MA, USA, 1999. [Google Scholar]
- International Organization for Standardization. Acoustics—Soundscape—Part. 1: Definition and Conceptual Framework; ISO 12913-1:2014; ISO: Geneve, Switzerland, 2014. [Google Scholar]
- Brown, A.L.; Kang, J.; Gjestland, T. Towards standardization in soundscape preference assessment. Appl. Acoust. 2011, 72, 387–392. [Google Scholar] [CrossRef]
- Brown, L.A. A Review of Progress in Soundscapes and an Approach to Soundscape Planning. Int. J. Acoust. Vib. 2012, 17, 73–81. [Google Scholar] [CrossRef]
- Council of Europe. European Landscape Convention; European Treaty Series: Florence, Italy, 2000. [Google Scholar]
- Cohen, E. A Phenomenology of Tourist Experiences. Sociology 1979, 13, 179–201. [Google Scholar] [CrossRef]
- Cohen, E. Rethinking the sociology of tourism. Ann. Tour. Res. 1979, 6, 18–35. [Google Scholar] [CrossRef]
- Kirillova, K.; Fu, X.; Lehto, X.; Cai, L. What makes a destination beautiful? Dimensions of tourist aesthetic judgment. Tour. Manag. 2014, 42, 282–293. [Google Scholar] [CrossRef]
- Maffei, L.; Brambilla, G.; Di Gabriele, M. Soundscape as Part of the Cultural and Natural Heritage. In Soundscape and the Built Environment; CRC Press: Boca Raton, FL, USA, 2015; Chapter 9; pp. 215–242. [Google Scholar]
- Suárez, R.; Alonso, A.; Sendra, J.J. Intangible cultural heritage: The sound of the Romanesque cathedral of Santiago de Compostela. J. Cult. Herit. 2015, 15, 239–243. [Google Scholar] [CrossRef]
- United Nations Educational, Scientific and Cultural Organization (UNESCO). Convention for the Safeguarding of the Intangible Cultural Heritage; Secretariat of the United Nations: Paris, France, 2003. [Google Scholar]
- Yamada, Y. Soundscape-based forest planning for recreational and therapeutic activities. Urban For. Urban Green. 2006, 5, 131–139. [Google Scholar] [CrossRef]
- Dumyahn, S.L.; Pijanowski, B.C. Beyond noise mitigation: Managing soundscapes as common-pool resources. Landsc. Ecol. 2011, 26, 1311–1326. [Google Scholar] [CrossRef]
- Schwarz, O. What should nature sound like? Techniques of engagement with nature sites and sonic preferences of Israeli visitors. Ann. Tour. Res. 2013, 42, 382–401. [Google Scholar] [CrossRef]
- Votsi, N.P.; Mazaris, A.D.; Kallimanis, A.S.; Pantis, J.D. Natural quiet: An additional feature reflecting green tourism development in conservation areas of Greece. Tour. Manag. Perspect. 2014, 11, 10–17. [Google Scholar] [CrossRef]
- Liu, A.; Liu, F.; Deng, Z.; Chen, W. Relationship between soundscape and historical-cultural elements of Historical Areas in Beijing: A case study of Qianmen Avenue. In Proceedings of the Internoise 2014 Conference, Melbourne, Australia, 16–19 November 2014.
- Puyana Romero, V.; Brambilla, G.; Di Gabriele, M.; Gallo, V.; Maffei, L. The influence of the soundscape on the tourists’ environmental quality perception. In Proceedings of the Euronoise 2015 Conference, Maastricht, The Netherlands, 31 May–3 June 2015.
- Semidor, C. Listening to a city with the soundwalk method. Acta Acust. United Acust. 2006, 92, 959–964. [Google Scholar]
- Jeon, J.Y.; Hong, J.Y.; Lee, P.J. Soundwalk approach to identify urban soundscapes individually. J. Acoust. Soc. Am. 2013, 134, 803–812. [Google Scholar] [CrossRef] [PubMed]
- Aletta, F.; Kang, J. Soundscape approach integrating noise mapping techniques: A case study in Brighton, UK. Noise Mapp. 2015, 2, 1–12. [Google Scholar] [CrossRef]
- Brambilla, G.; Masullo, M.; Sorrentino, F.; Pascale, A. La passeggiata sonora ad Alghero—The soundwalk at Alghero. Rivista Italiana di Acustica 2016, 40, 52–62. (In Italian) [Google Scholar]
- Fastl, H.; Zwicker, E. Psychoacoustics—Facts and Models; Springer: Berlin, Germany, 1990. [Google Scholar]
- Rychtáriková, M.; Vermeir, G. Soundscape categorization on the basis of objective acoustical parameters. Appl. Acoust. 2013, 74, 240–247. [Google Scholar] [CrossRef]
- Ward, J.H. Hierarchical grouping to optimize an objective function. J. Am. Stat. Assoc. 1963, 58, 236–244. [Google Scholar] [CrossRef]
- Kuhn, M. Building predictive models in R using the caret package. J. Stat. Softw. 2008, 28, 1–26. [Google Scholar] [CrossRef]
- R Development Core Team. R: A Language and Environment for Statistical Computing; R Foundation for Statistical Computing: Vienna, Austria, 2008. [Google Scholar]
- Aletta, F.; Kang, J.; Fuda, S.; Astolfi, A. The effect of walking sounds from different walked-on materials on the soundscape of urban parks. J. Environ. Eng. Landsc. 2016, 24, 165–175. [Google Scholar] [CrossRef]
- Aletta, F.; Kang, J.; Astolfi, A.; Fuda, S. Differences in soundscape appreciation of walking sounds from different footpath materials in urban parks. Sustain. Cities Soc. 2016, 27, 367–376. [Google Scholar] [CrossRef]
© 2016 by the authors; licensee MDPI, Basel, Switzerland. This article is an open access article distributed under the terms and conditions of the Creative Commons Attribution (CC-BY) license (http://creativecommons.org/licenses/by/4.0/).


