
Extensive Exposure Mapping in Urban Areas through Deep Analysis of Street-Level Pictures for Floor Count Determination


1
R&D section, Ticinum Aerospace s.r.l., I-27100 Pavia, Italy
2
Dipartimento di Ingegneria Industriale e dell’Informazione, Università degli Studi di Pavia, I-27100 Pavia, Italy
*
Authors to whom correspondence should be addressed.
Urban Sci. 2017, 1(2), 16; https://doi.org/10.3390/urbansci1020016
Submission received: 6 March 2017
/
Revised: 27 April 2017
/
Accepted: 5 May 2017
/
Published: 10 May 2017
Abstract
:In order for a risk assessment to deliver sensible results, exposure in the concerned area must be known or at least estimated in a reliable manner. Exposure estimation, though, may be tricky, especially in urban areas, where large-scale surveying is generally expensive and impractical; yet, it is in urban areas that most assets are at stake when a disaster strikes. Authoritative sources such as cadastral data and business records may not be readily accessible to private stakeholders such as insurance companies; airborne and especially satellite-based Earth-Observation data obviously cannot retrieve all relevant pieces of information. Recently, a growing interest is recorded in the exploitation of street-level pictures, procured either through crowdsourcing or through specialized services like Google Street View. Pictures of building facades convey a great amount of information, but their interpretation is complex. Recently, however, smarter image analysis methods based on deep learning started appearing in literature, made possible by the increasing availability of computational power. In this paper, we leverage such methods to design a system for large-scale, systematic scanning of street-level pictures intended to map floor numbers in urban buildings. Although quite simple, this piece of information is a relevant exposure proxy in risk assessment. In the proposed system, a series of georeferenced images are automatically retrieved from the repository where they sit. A tailored deep learning net is first trained on sample images tagged through visual interpretation, and then systematically applied to the entire retrieved dataset. A specific algorithm allows attaching “number of floors” tags to the correct building in a dedicated GIS (Geographic Information System) layer, which is finally output by the system as an “exposure proxy” layer.
1. Introduction: Context and Rationale
Risk modeling companies are constantly working on the development of more accurate models, and on investigating potentially better sources of inputs to the models. This is naturally done in order to reduce the uncertainty level on the estimated risk, which has an important impact on e.g., determining insurance rates or the needed asset reserves to pay compensations in case an event takes place. Uncertainty reduction is especially desirable in urban areas, where the highest rates of human presence and value at stake per square km are usually found.
Higher accuracies in risk estimation can be achieved by improving the size and the quality of the information pool input to the risk model. Unfortunately, the amount of available information retrieved through conventional means, for example cadastral data, is limited. Cadastral data are designed for other purposes than providing inputs to risk models; although some pieces of information may still be relevant (e.g., building footprint polygons), other highly relevant pieces such as average income of inhabitants are surely not found there. Moreover, privacy issues and other regulations on the use of data can pose further limitations to the use of such data. In general, expanding the input data pool is expensive and time-consuming. Statistical analysis may help stretching the boundaries of the input dataset, but it will generally introduce potential inaccuracies. Even public actors, such as Civil Protection Agencies, which may forcibly collect relevant data to accomplish their mandated risk analysis and mitigation tasks, still find themselves struggling with different standards, data generated for other purposes and thus unsuitable for risk estimation, or even plain non-existence of crucial pieces of information in a usable manner.
In this context, it is clear why for several years now a lot of research effort has been spent on large-scale, satellite-based data collection on urban areas under a risk assessment umbrella, especially using optical data. Yet, optical satellite data can only “see” a limited set of data, typically linked to the physical appearance of the buildings as “seen from above” (e.g., roof extent, and thus building footprint), or to the building pattern (e.g., map of urban areas, or density of urban fabric). Off-nadir images do not help much in identifying building height or façade features, due to severe occlusion, especially in dense urban centers, and usually suffer a general corruption of data quality consequent to the higher optical thickness of the atmosphere in slanted views. Radar data would solve both issues in principle, but its interpretation in urban areas is particularly tricky.
More recently, technological developments have opened possible alternative paths for information collection.
On the one side, street-level pictures are increasingly made publicly available by services such as Google Street View. Such pictures contain a good deal of risk-relevant information, e.g., clues on residential vs. commercial occupancy.
On the other side, technical advances are now making viable many processing approaches that have been theorized but used to be too computationally intensive to be considered for practical implementation.
Given the above-described situation, with this paper we focus our attention on extracting specific, additional information at the building level, tapping into abundant sources of data which have been exploited to a very limited extent so far due to technical constraints. Our research results may in principle apply to any type of natural hazard, and in this sense this paper takes a risk-anodyne approach, in that the usefulness of better exposure to information is shared across practically all types of peril. In a sense, the envisaged scenario is inherently multi-risk, although different uses will be made of the information where different perils are considered.
Risk exposure of a building can be characterized by different features and data, such as number of floors, occupancy type, age, number of windows, shape regularity, materials, etc. For each of those features, a vast amount of research activities can be found aimed at deriving it from different types of sources, which confirms the importance of characterizing buildings. One of the building features of primary interest is the number of floors, and we focus on exposing this information in the present paper. In the next section, after illustrating existing approaches, the developed framework is presented and the method described. In Section 3, a test case is analyzed; results and accuracy assessment are reported, with a discussion. Finally, Section 4 summarizes the pros and cons of the proposed method, draws some conclusions and introduces future perspectives.
2. Existing Approaches and Our Proposed Method
2.1. Existing Approaches to Floor Number Determination
As mentioned above, remote sensing data are often used to assess building heights over large areas. A common technique is to analyze a single optical image and estimate building heights based on the shape/length of the shadows [1,2,3,4]; this approach typically becomes less reliable where buildings are close to each other and shadows cannot fully deploy on a regular surface. Different techniques take advantage of specific acquisition techniques such as Light Detection and Ranging (LiDAR), or optical stereo images, to build a Digital Terrain Model (DTM) and a Digital Surface Model (DSM), and to then derive the heights of buildings [5,6]. Another possible set of techniques make use of multiple optical views and template matching algorithms [7,8]. Oblique airborne imagery has also been considered in other efforts [9]. Other complex methods take advantage of Synthetic Aperture Radar (SAR) sources and their typical side-view geometry in order to retrieve heights [10,11,12]. Even better results can be obtained by combining remotely sensed data with a sample of street-level pictures in a stratified sampling approach within a probabilistic framework [13]. The previously mentioned methods may in principle achieve high accuracies, but they suffer from two major problems: expensive input data, and complexity of analysis in less-than-trivial cases. A radically different approach to 3D mapping of buildings consists of leveraging Volunteered Geographic Information (VGI), e.g., 3D modelling under a crowdsourcing-based data collection [14]. Unfortunately, since they are based on a voluntary basis, their coverage is sometimes patchy, and data is not updated regularly. The additional option that is emerging on the scene is the use of ground-level images, as opposed to space-borne images. In recent years, these data have become increasingly accessible thanks to sharing sites and open online repositories, and their geographical coverage has continued to enlarge. Such data have already been used in different applications such as analyzing road signals [15,16], virtual auditing of neighborhoods [17], urban greenery assessment [18], curb ramp detection [19], pedestrian activities [20], vegetation assessment [21], etc. For what concerns the topic of this paper, these data have also been exploited in retrieving building heights. In [22], the authors identify height values of depicted buildings by combining 2D footprint edges with their different 3D street-view representations obtained by multiple camera projections. This technique, as stated by the authors, relies on extremely precise pinpointing of camera location and registration of 2D/3D information, and on the correct reconstruction of building profiles.
All of the above-listed methods allow for the identification of building heights. Then, some assumptions must be made by modelers to define the exact number of stories. The choice is mainly made using statistical approaches, e.g., defining one floor as being 2.5 m high and computing the number of floors as the height of the building divided by 2.5 m. This approach, however, has some drawbacks in e.g., restituting ambiguous fractional floor numbers (does 3.45 floors mean a 3- or a 4-storey building?), and in basically failing to offer room for improvement, as the starting data does not contain any real information on the actual number of floors. The distinction between height and number of floors is relevant for several risk-related applications; the first floor(s) may be different from the others in terms of occupancy, and surely the ground floor needs to be treated differently in terms of structural phenomena activated by seismic input.
In this paper, we propose a framework capable of directly identifying the number of floors without considering building height as an intermediate product. The method is mostly automatic and it is based on cheap in-situ data inherently containing information on the real situation of the buildings, as opposed to guesswork based on the building height. Moreover, unlike the above-cited methods from scientific literature, the method sets up a general framework that can be adapted for different applications with slight changes: for example, it can be adapted to determine occupancy type, or to infer the wealth of the neighborhood. The method is also radically different from the one proposed in [22], in that it uses a Convolutional Neural Network (CNN)-based interpretation of images rather than geometrical relationships enforced on quantitative data obtained from Global Navigation Satellite System (GNSS) devices and direct measurements on images.
2.2. The Proposed Framework
As mentioned in Section 1, we experimented with applying deep learning to street-level pictures in order to retrieve exposure proxies for buildings.
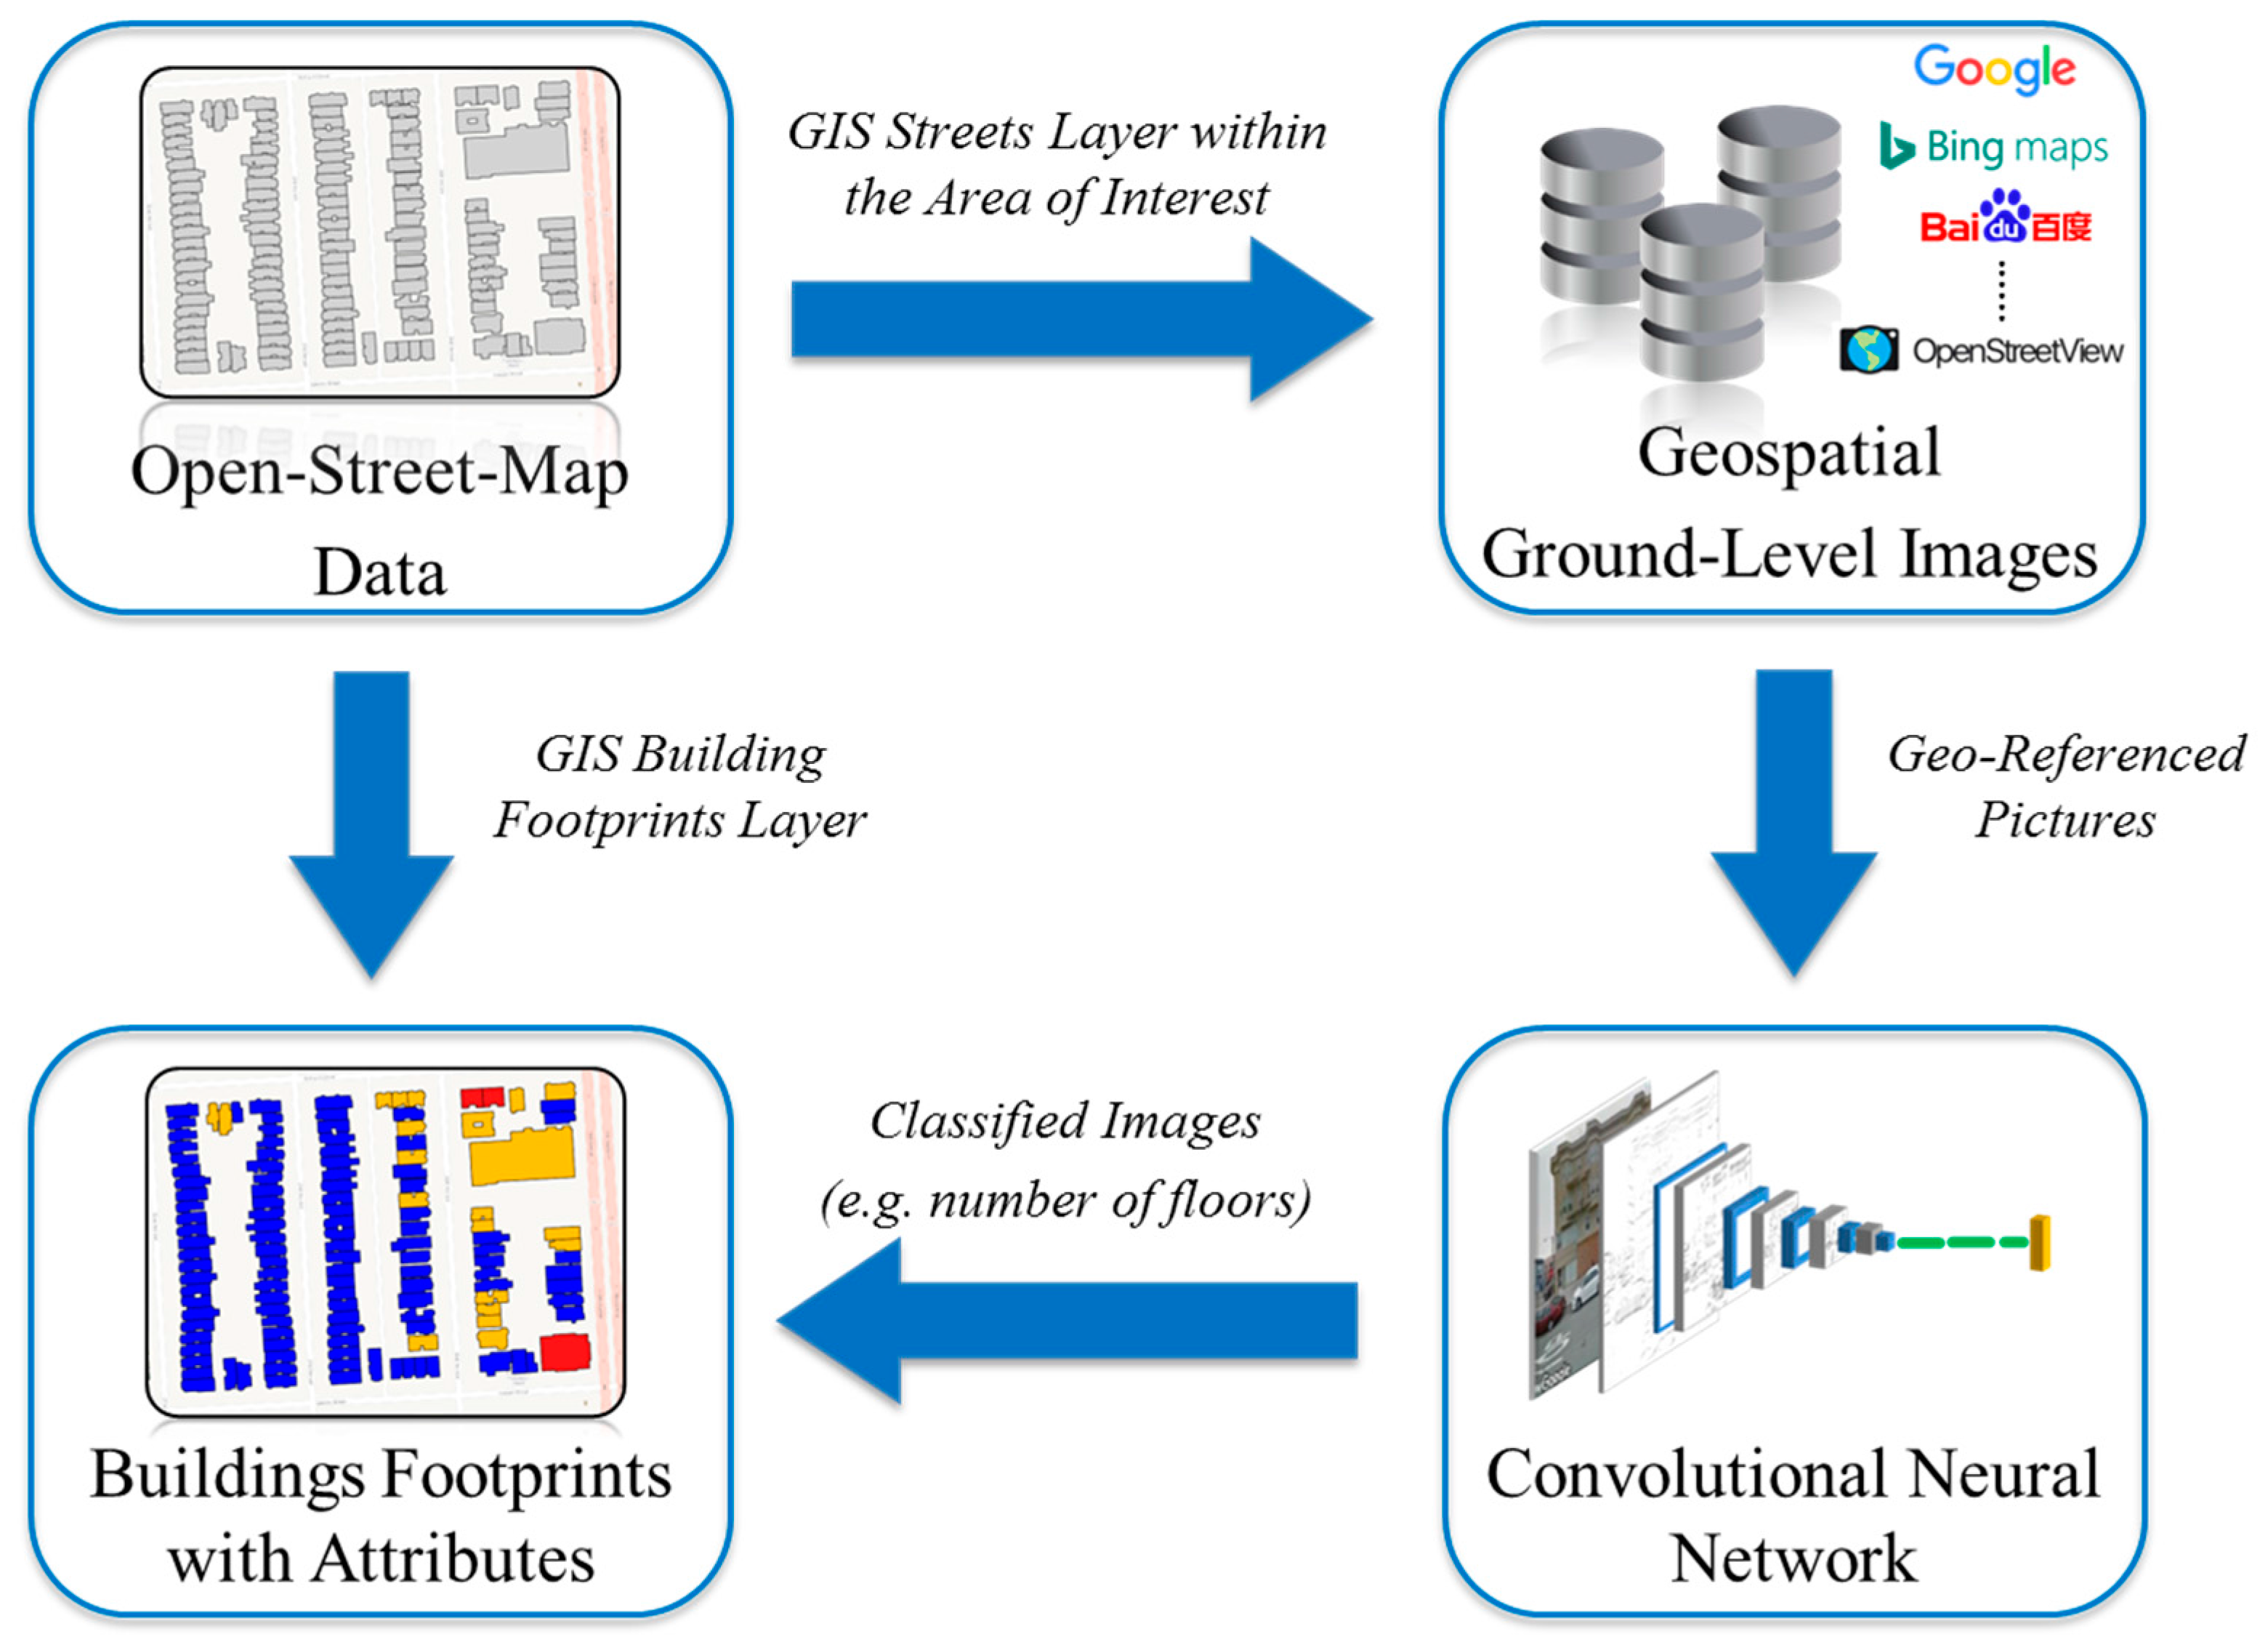
The proposed framework, illustrated in Figure 1, is thus composed of three main blocks:
- a block for the automatized retrieval of in situ georeferenced photos in the area of interest,
- a block operating trained, suitably shaped convolutional neural networks, and
- a block with a geospatial platform handling the Geographic Information System (GIS) layer of the urban area and an algorithm assigning the produced exposure label to the relevant building footprint.
The role and purpose of each single functional block are discussed in the following subsections. Non-functional blocks appearing in the scheme represent data sources or outputs, and include:
- OSM block: OpenStreetMap (OSM) data, offering open access to VGI and used in our work to determine street and building locations.
- Image source: one or more repositories offering access to geotagged ground pictures of buildings.
- GIS output: the produced GIS layer offering building footprints enriched by a “number of floors” attribute as a result of the procedure.
2.3. Data Retrieval
This subsection refers to the two top boxes in Figure 1, and discusses inputs to the system. Nowadays, several sources of georeferenced in situ images are available and accessible to the public, although under diverse types of licensing. One well-known example of such a repository is the huge dataset of street-level pictures collected by Google Street View [23], through image-acquiring devices mounted onboard its dedicated cars, bikes, and other transportation means. Its coverage is extensive, and in many cases each location has been captured multiple times over the years. Google is not the only agent collecting this kind of data; several other repositories are already in place, collecting and distributing more in situ data. Among these, some of the most famous are Open Street Cam [24], Baidu [25], Mapillary [26], Here [27], Bing Streetside [28], and Apple [29]. It is pretty clear that the amount of available in situ data is set to progressively increase, further enriching an already large dataset. For our work, we decided to rely on Google Street View because of its unbeatable coverage. Automatic retrieval of such data can be achieved using the Google Street View Image Application Program Interface (API) [30]. A specific code was written, which, given an Area of Interest (AoI):
- scans OpenStreetMap data for streets within the AoI, and downloads the corresponding vector data;
- prepares a sequential path covering all downloaded streets;
- “walks” the path while sampling it at regular intervals; for every sample, location and side directions (to the left and to the right of the path) are computed and stored;
- sequentially retrieves the stored location and directions and, based on these, prepares and forwards requests to fetch all relevant images from online repositories such as Google Street View.
The sampling parameter value implies a trade-off between the total number of retrieved images and the full coverage of building footprints. A smaller value allows for the retrieval of all available pictures and thus classifies all possible building footprints, but results in downloading large amounts of data and possibly choking weaker connections or servers. A larger value, instead, curbs processing times and the cost of custom-acquired (and paid for) pictures but, obviously, on the other hand, it may leave gaps in coverage. A possible approach could be a region-based sampling value, where low-density areas such as commercial areas will use longer sampling steps, whereas high-density areas such as city centers in historical towns will be sampled with a shorter step.
As a result of the above procedure, a large set of images is downloaded and stored locally, depicting building facades in the visited area of interest. Where applicable, the “camera pitch” (i.e., elevation angle) parameter is set to zero, resulting in front views of the facades. This is done for the sake of homogeneity across sources and to avoid introducing possible additional geometric distortions due to parallax issues.
2.4. Data Classification
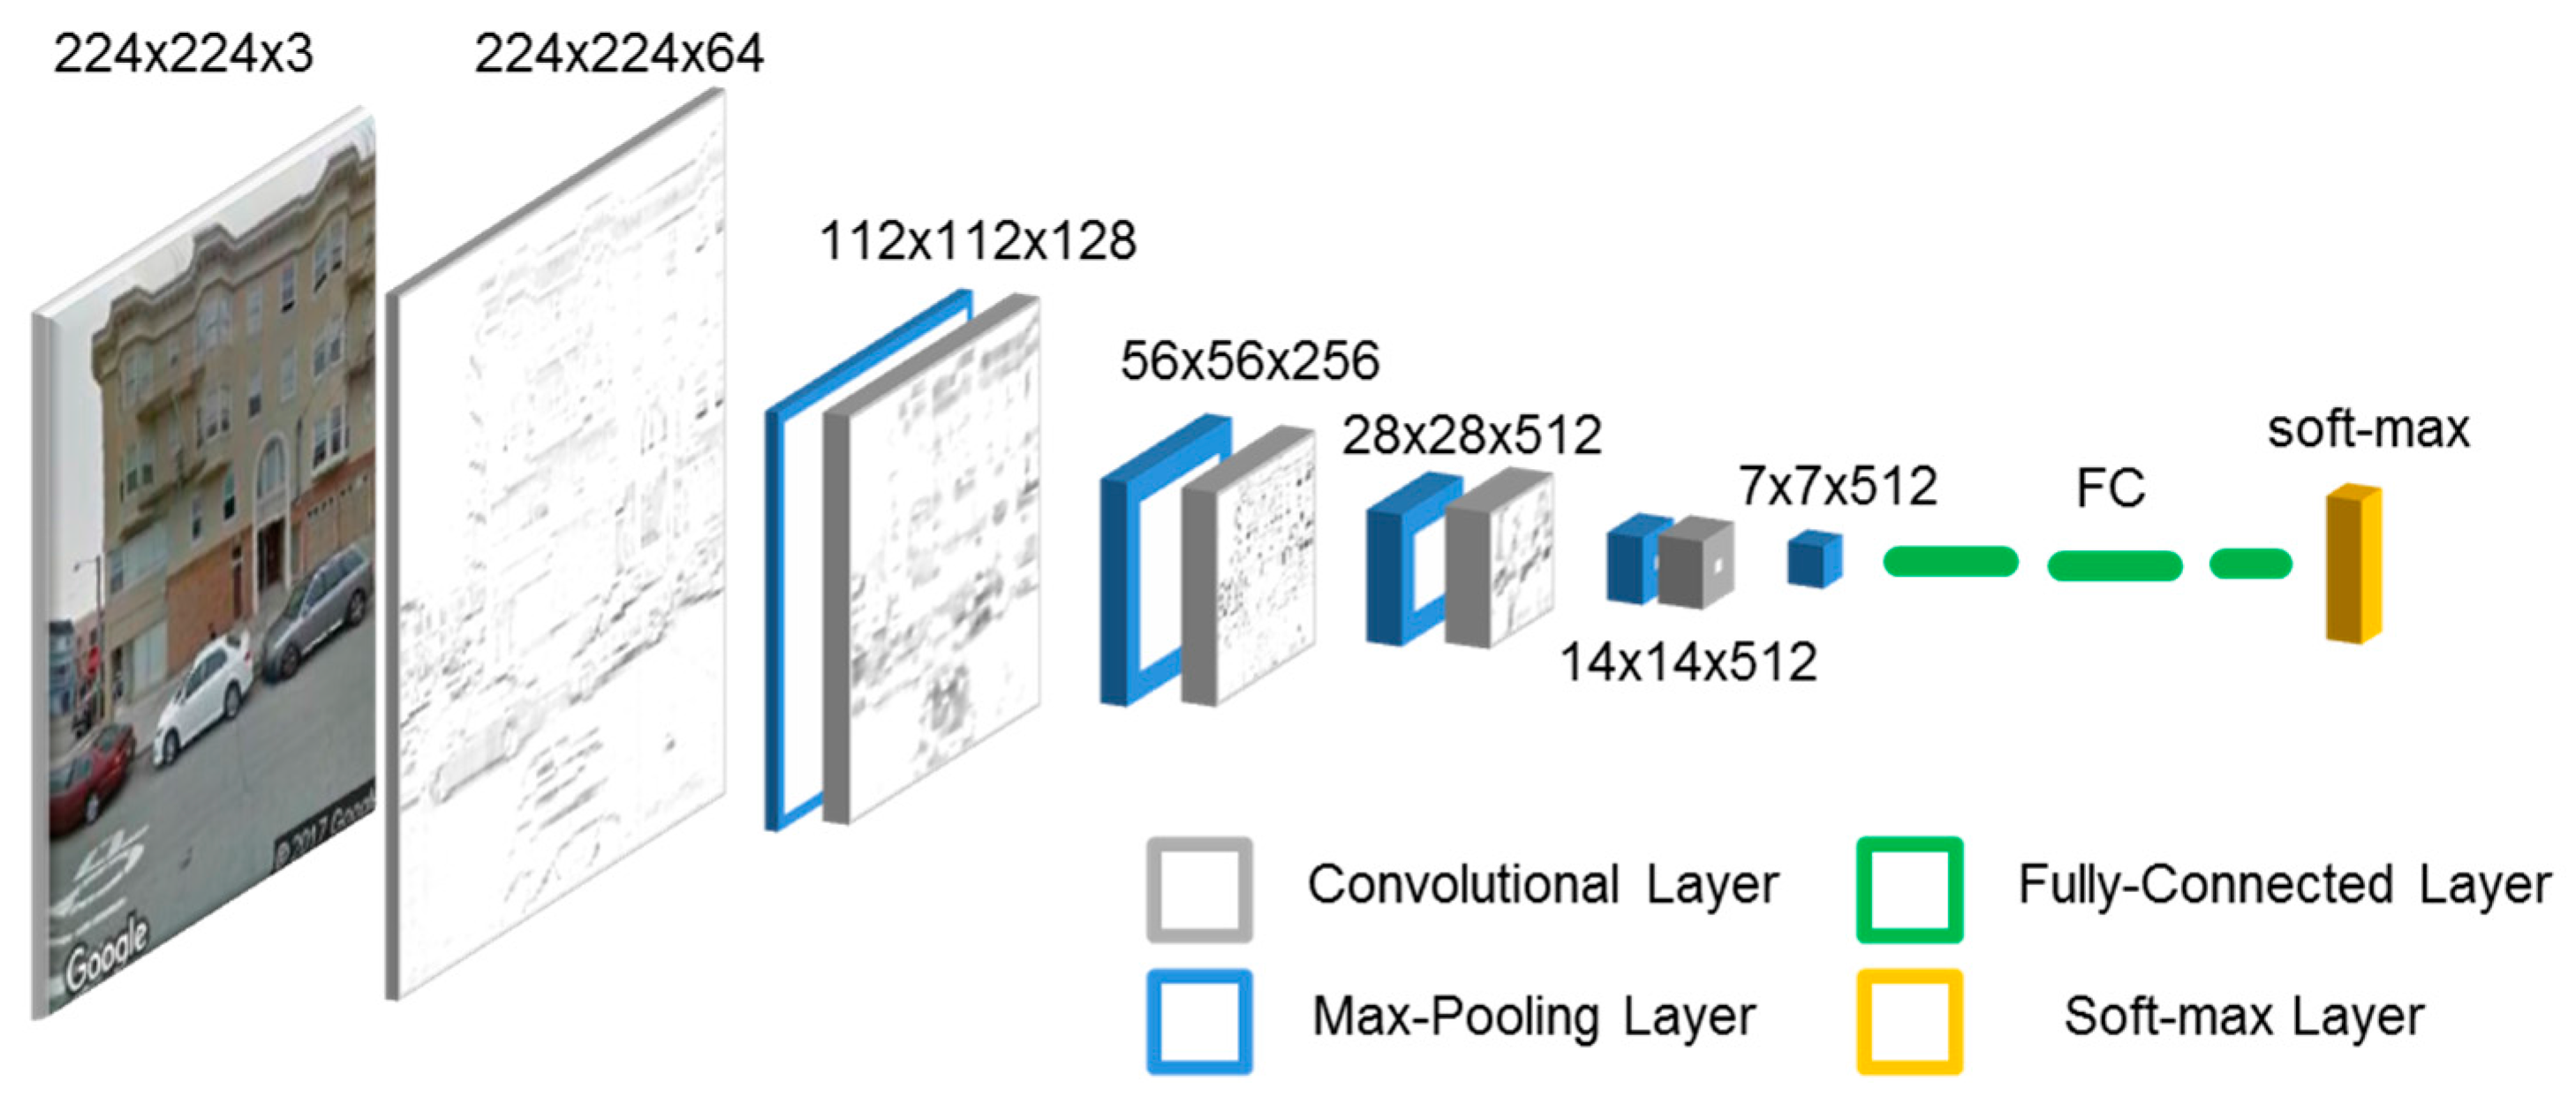
This subsection refers to the bottom right box of Figure 1, where the in situ data is processed to evaluate the number of floors. There are several possible approaches to classifying the content of pictures, but interpreting facade images to determine the number of floors is a particularly complex problem; there are indeed many different ways in which floors, or separation between floors, can be characterized, especially in non-homogeneous urban areas. The complexity and variability of the problem definitely calls for human-like, example-based approaches. These latter requirements match pretty well with the characteristics of methods based on Convolutional Neural Networks (CNN), which is a Deep Learning (DL) technique. CNN gained remarkable popularity in 2012 when a CNN named “AlexNet” won the ImageNet Large-Scale Visual Recognition Challenge (ILSVRC) [31]. CNNs are constructed by repetitively combining/connecting two main blocks, i.e., a convolutional layer and a pooling layer. Convolutional layers extract features from the images in a hierarchal way [32], and their outputs are called feature maps. Pooling layers subsample feature maps, and every pooling layer will reduce the spatial resolution for the next convolutional layer. Ultimately, the alternation of these two layer types results in modelling the spatial context information at multiple scales. Generally, after several pairs of convolutional and pooling layers, a fully connected layer is appended followed by a classifier (e.g., softmax, support vector machines, etc.). An example of CNN architecture is visible in Figure 2. As already stated above, in recent years CNNs has become very popular and a significant amount of papers were published regarding CNNs and their possible structures for various applications. The most notable include VGG nets and their simple architectures [33], the Zeiler-Fergus (ZF) net and its deconvolutional layer presented in [32], which helps understand the CNN, GoogLeNet and its inception module [34], and the Microsoft ResNet with its notable depth [35]. Unfortunately, one of the main requirements, and a drawback at the same time, of CNNs is the huge number of images required to correctly train the machine. Generally, this requirement is not sufficiently fulfilled in real applications, and especially is not fulfilled in the one we are tackling. A possible solution is to use the transfer learning technique [36]. It consists of taking a network trained for a specific application, and then reusing it as a general feature extraction algorithm for a different problem, which shares a part of the interesting features with the original application. We decided to apply this solution and we selected the VGG-16 network, which has been trained on the ILSVRC 2012 dataset (i.e., 1.3 million images and 1000 classes) [37], for incorporation in our system. The CNN has indeed been adapted to our application, as well as partly re-trained on a problem-specific dataset. The latter was created by manual classification using ad hoc developed software to aid the human expert in labeling the training set, thus reducing the amount of labor required. For the application proposed in this paper, the images are classified based on their number of stories.
Five classes have been defined:
- 0: no buildings in the considered image;
- 1, 2, 3: buildings with one, two, or three floors, respectively;
- 4+: building with four or more floors.
Buildings with 4 stories or more were merged into a single class because their exact number of floors is generally not visible in street pictures due to inherent limitations in the vertical field of view. This can naturally be remediated in some cases like Google Street View, which allows one to set the elevation angle (i.e., pitch); one could in principle issue more than one image request at different elevation angles to then vertically merge images into a taller image covering as high as the roof of the tallest building. This was, however, deemed uninteresting for the purpose of this paper, whose main point is illustrating the method rather than covering all possible cases. In the end, before the training step, the classified images were pre-processed and augmented to increase the performance of the CNN, and to reduce the problem of overfitting.
2.5. Production of the “Floor Count” GIS Layer
The last important block serves the purpose of correctly attaching the floor count to each building footprint, as illustrated in the bottom left box of Figure 1. Building footprints are taken from OpenStreetMap (OSM) [38], possibly the largest available open database of detailed geographic information. In OSM, countless volunteers have manually digitized buildings footprints in a large, and notably successful, crowdsourcing effort. OSM coverage is extensive, but sometimes data may turn out to be outdated or to present some inconsistencies. Where OSM data is unsatisfactory, a possible alternate approach is to automatically extract building footprints from optical satellite data at a very high spatial resolution. While as recently as ten years ago there were virtually no private actors producing satellite data, since then many companies have entered the geospatial market, collecting and/or promising new space-borne multispectral images. Among these are counted Planet, Airbus, NorthStar, BlackSky, OmniEarth, Satellogic, etc. All of these will increase the amount of available data and, at the same time, contribute to decreasing their cost; in perspective, there will be an increasing availability of footprint information. In this paper, however, we selected the test sites to have ensured OSM coverage in order to focus on the floor number interpretation.
We then created the training set as described in the next section, and trained the CNN on it. Then, the entire dataset of georeferenced pictures was classified automatically, and results were associated to the relevant buildings in the GIS layer based on image location and compass direction. Since the images were acquired in a direction perpendicular to building facades, incorrect assignment of labels is quite unlikely. At the end of the process, buildings that remain unclassified due to lack of in situ data were labelled with a “best guess” approach; this could mean, for example, taking the statistical mode in a sample containing the height of buildings located within a fixed range.
In the next section, the application of the developed framework to a specific test case is described and discussed, and quantitative details are provided.
3. Experimental Results and Discussion
A fraction of the city of San Francisco (CA, USA) was analyzed as the test case. Specifically, a subset of almost 10 square kilometers was selected as the Area of Interest (AoI), based on being sufficiently representative of the entire urban area; this latter was extensively “virtually visited” before defining the AoI. The first phase involved downloading OSM data and Google Street View photos. A street layer was retrieved from OSM for the AoI and used to generate a “visit path”. The road path was then sampled at a 5-meter step, which resulted in roughly 21,000 sample points; this translated into almost 42,000 georeferenced pictures being automatically retrieved. In doing so, minor geolocation errors as well as “no pictures” photo messages were automatically fixed and/or removed. This process took approximately 2 hours and was completely automatic. An example of a retrieved photo from our test area is visible in Figure 3.
About 600 pictures among those downloaded were manually classified with the aid of an ad hoc software. As already mentioned, five classes were defined, ranging from 0 (i.e., no building—e.g., water, urban parks, meadows) to 4+. This latter class includes buildings with four or more stories. We strove to select samples in a way to keep as homogeneous a distribution across classes as possible. We had no precise information about the actual average occurrence of classes in the area of interest, and manual classification of all buildings would have been impractical. Homogeneous distribution of samples across classes was deemed to be the next best choice, but may be unachievable in practice.
To compensate for the limited size of the training set, a pre-trained network was employed as mentioned in Section 2.2. A suitable choice of pre-trained network can indeed reduce the training needed for a given application, typically because the first layers of the network are already capable of detecting and locating basic, relevant features (see Figure 4).
Training can thus focus on high-level layers, where basic features are interpreted in a manner significant to the specific application. In our case, we used the pre-trained VGG-16 network because it had already been used for image recognition [33], it is flexible and it has a simple architecture allowing for easy tuning. The first layers of the CNN were “frozen” and the last layers were re-trained directly on an NVIDIA CUDA-based video card. The processing time was highly dependent on many factors, but in our case it did not exceed one hour for the abovementioned 600-image training set. In terms of computational efficiency of the overall process, it should be noted that the training step is only applied once in the entire process; still, it may need to re-applied on a new, local training set if the network is to be reused in a significantly different urban context.
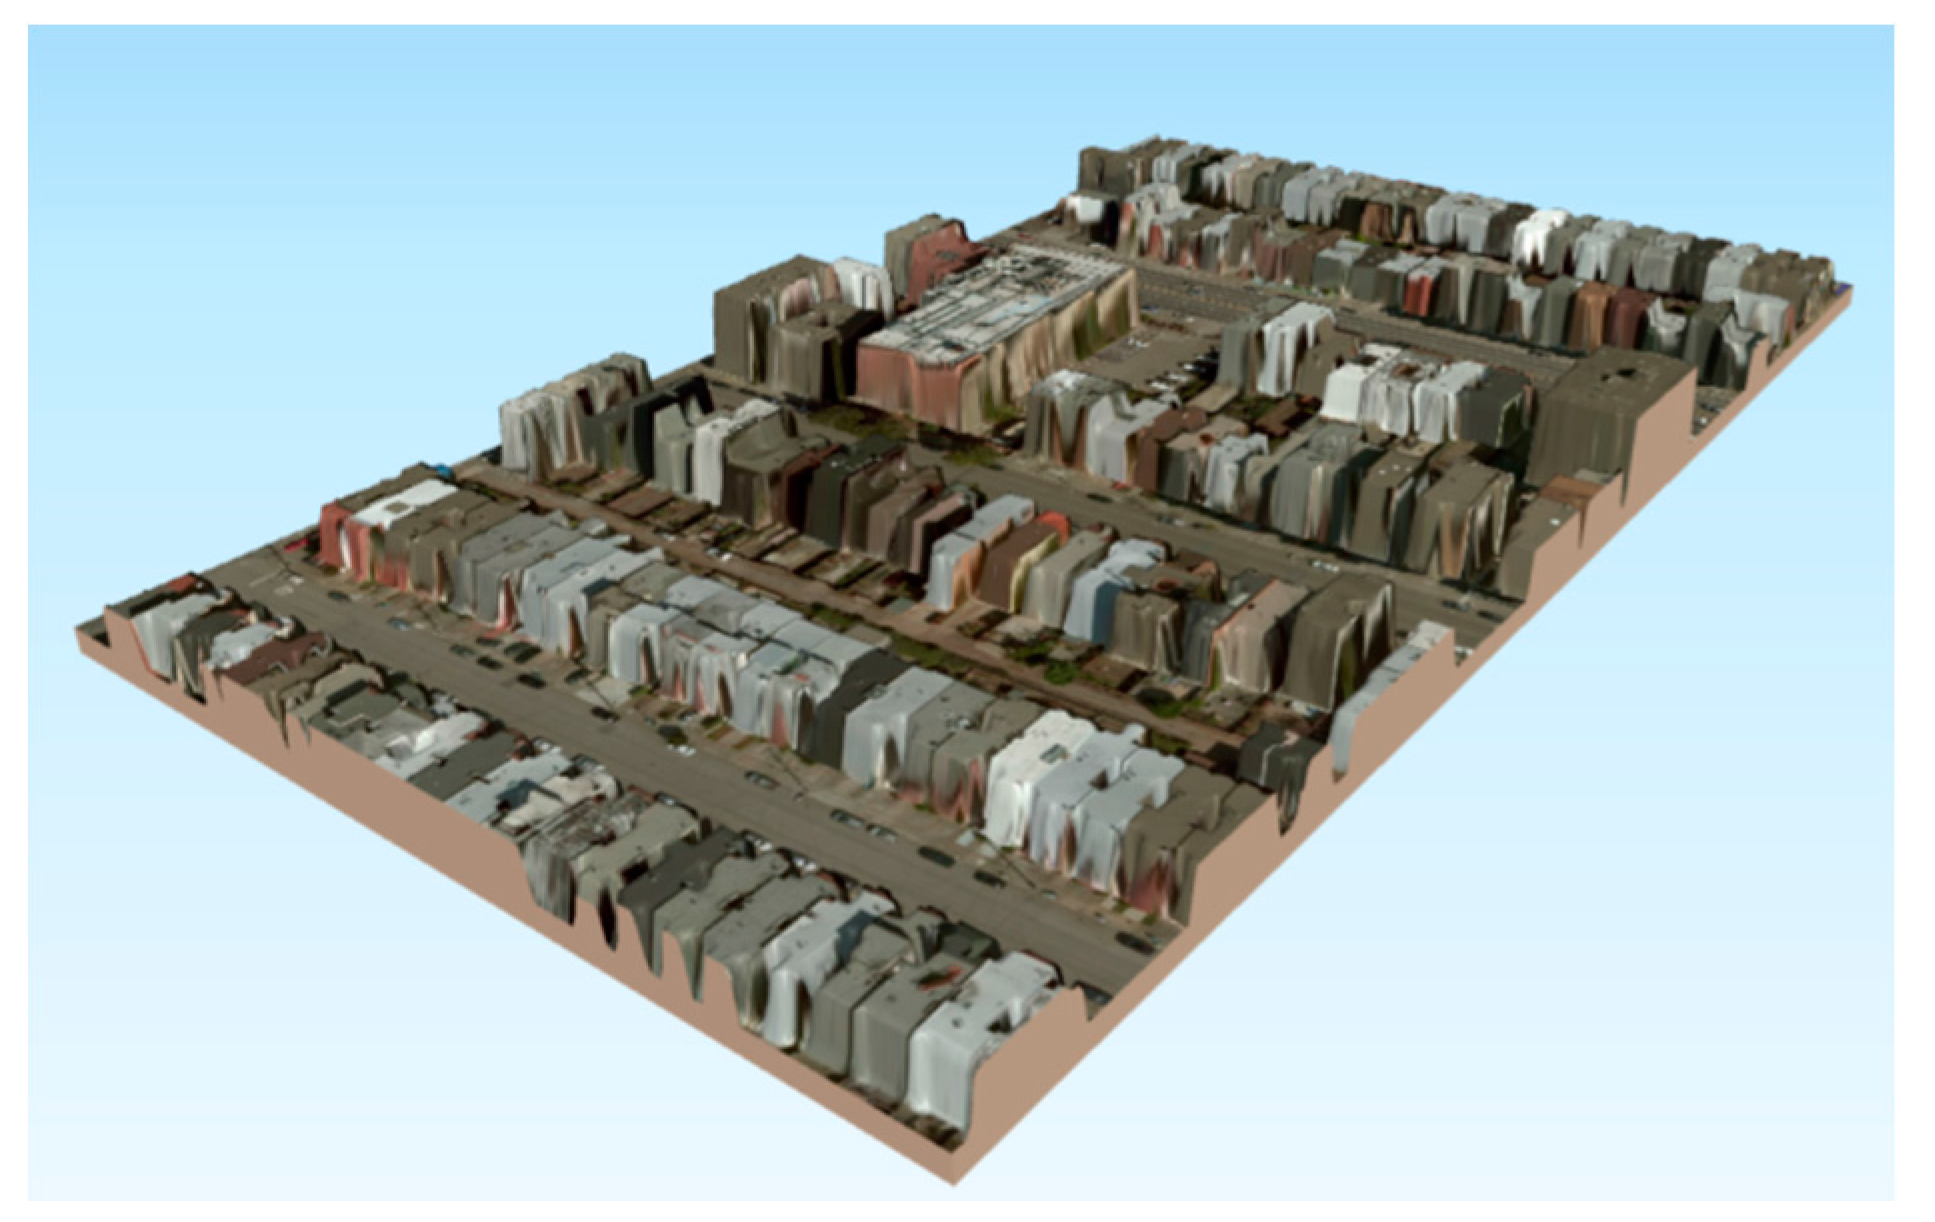
The classification step followed. The entire set of almost 42,000 images retrieved in the AoI were classified and assigned to their respective geolocated building footprints available in the GIS layer. The classification phase took about three hours on a NVIDIA GeForce GTX 650 graphics card (1GB memory). An optional interpolation step may follow to label the buildings that remained unclassified because of missing street pictures or occluded facades. Such an interpolation step tries to infer the missing floor value from the classified neighbors of the concerned building under the assumption that generally a building is not “too different” from neighboring ones. In this test case, unclassified buildings were labeled with the value appearing more often in other buildings located within a 15-meter range of the unlabeled one. In the case of no classified neighbors appearing within range, the concerned polygon was simply left unclassified. The final result of the entire process on the cited AoI is visible in Figure 5. In Figure 6, a simple 3D-rendered model is shown, based on the classification results; each single floor was translated into a 3-m height increment above the corresponding building footprint to form a DSM over which Google Maps satellite images were draped.
Accuracy assessment was carried out on a subset of 430 classified buildings, none of which was contained in the training set. Reference data was produced manually on the 430 selected buildings through visual interpretation, using the same method as that used for the construction of the training set. A comparison of classification data with reference data resulted in the confusion matrix reported in Table 1, which reports an overall accuracy of almost 85% and a Cohen’s kappa coefficient of 0.7.
It is to be noticed that errors tend to gather next to the diagonal, i.e., smaller errors are far more frequent than large ones. In just 1 case out of 430 the number of floors was underestimated by more than one floor; no overestimation of more than one floor class was reported. Underestimation generally prevailed with respect to overestimation; this may be due to parked cars partly occluding the ground floor and thus hiding features relevant to identifying it. No bigger estimation errors were reported, either.
4. Conclusions
The number of floors in a building is a relevant piece of information when assessing exposure of urban areas to natural threats [39], but large-scale mapping of such a parameter on every individual building requires a large effort. Satellite images, a typical choice for large-scale mapping, may not offer the desired information content due to e.g., a nadiral view suppressing height information. The increasing availability of ground-based images is starting to usher in a viable alternative. In this paper, we presented a CNN-based framework to extract the number of floors of monitored buildings starting from ground-level pictures, with a great potential for large-scale application. A pre-trained CNN was selected based on the relevance of low-level features it could recognize as a result of previous training; higher levels were erased and re-trained for the specific application, i.e., the counting of building floors from facade images. An experiment was conducted on an Area of Interest (AoI) in San Francisco, USA, with 600 images used to train a CNN and 42,000 images from Google Street View used to retrieve the number of floors on about 39,000 buildings. An accuracy assessment was carried out on a test set of 430 buildings not overlapping with the training set. The assessment revealed an overall accuracy of 85%, with practically all errors (except one) limited to +/−1 floor. A different issue than plain accuracy may be information age: images may happen to be quite old, especially in the US where image acquisition first started and in some areas was never updated. This is not a methodological but rather a data source issue and currently there is no obvious countermeasure; the situation is probably set to improve anyway with the ever-increasing availability of public, georeferenced pictures. We are already at work on image harvesting on the internet at large; for the time being, we can still consider that the information such as number of floors or occupancy type will not change frequently. As a consequence, the additional error connected to outdated images is expected to be negligible.
The results produced by the system were attached to the respective footprint polygons extracted from OSM and a “building floor count” layer was generated and saved as a GIS-readable file. Among the other information, the image acquisition month and year can be included as an additional attribute if requested. This is useful to make the final user aware of potential information age issues.
As already stated, building floor count is very useful for risk modelling in urban areas, as it contributes to the establishment of reliable, pointwise exposure information. The floor count, indeed, helps in estimating the number of people living in a building, the value of the building itself and the assets it may contain, etc. In other words, building floor count presents a variety of information pieces which can be used to estimate the population and values threatened by a given peril in a given location.
In comparison, other methodologies for retrieving floor count use either complex acquisition systems (e.g., flight campaigns to shoot 45-degree oblique aerial photos), specific sensors (e.g., LIDAR), or costly analysis using commercial satellite data; in many cases, the proposed methods lead to retrieving the height of buildings but not their number of stories, which may remain ambiguous especially for taller buildings. Furthermore, in situ data is becoming increasingly available from different sources, with ever-extending coverage across the globe.
The main strongpoints of the proposed method are related to its feasibility and lower cost with respect to other approaches (e.g., surveying or high-resolution satellite data analysis), to its complete analysis of the area of interest (as opposed to mapping schemes relying on sample subsets), and to its flexibility (the same framework can be exploited to extract other relevant features). Its main weak point is lack of coverage in some areas (set to improve with increasing availability of open street pictures) and, where age matters, the unavailability of recent street pictures in some areas. A minor weak point is connected with the limited number of floor classes available with a single image (from 4 floors up a single class is foreseen); if a deeper floor number discrimination is needed for high-rise buildings, then additional images have to be downloaded and merged to zero-pitch ones, thus slowing down the process.
The results obtained are already quite good, but further analysis and research in progress to testing new avenues for the improvement of performance and for the extension of extracted building feature sets. New types and topologies of CNNs are being tested with promising results and, at the time of writing, an operational service is being set up based on the latest results. In the end, different applications have already been developed to extract other risk-relevant features and info from in situ data, such as occupancy type, average revenue level, etc. Large-scale fusion with satellite remote sensing data will also be a key factor in our future approach to the problem.
Acknowledgments
We would like to thank Paolo Gamba at the University of Pavia, Italy, for his support, especially in understanding potentials and limits of Convolutional Neural Networks, and in providing his valuable insights about the discussed application. We would also like to thank Niccolò Ricardi and Gianni Lisini for their support in some phases of our data processing.
Author Contributions
Gianni Cristian Iannelli designed and developed the deep learning methodology. Fabio Dell’Acqua suggested training strategies and defined methods for building the GIS layers. Both authors were equally involved in defining the experimental results and the strategy in processing the data.
Conflicts of Interest
The authors declare no conflict of interest.
References
- Lee, T.; Kim, T. Automatic building height extraction by volumetric shadow analysis of monoscopic imagery. Int. J. Remote Sens. 2013, 34, 5834–5850. [Google Scholar] [CrossRef]
- Shao, Y.; Taff, G.N.; Walsh, S.J. Shadow detection and building-height estimation using IKONOS data. Int. J. Remote Sens. 2011, 32, 6929–6944. [Google Scholar] [CrossRef]
- Comber, A.; Umezaki, M.; Zhou, R.; Ding, Y.; Li, Y.; Fu, H.; Jiang, H.; Tewkesbury, A. Using shadows in high-resolution imagery to determine building height. Remote Sens. Lett. 2012, 3, 551–556. [Google Scholar] [CrossRef]
- Qi, F.; Zhai, J.Z.; Dang, G. Building height estimation using Google Earth. Energy Build. 2016, 118, 123–132. [Google Scholar] [CrossRef]
- Gonzalez-Aguilera, D.; Crespo-Matellan, E.; Hernandez-Lopez, D.; Rodriguez-Gonzalvez, P. Automated urban analysis based on LiDAR-derived building models. IEEE Trans. Geosci. Remote Sens. 2013, 51, 1844–1851. [Google Scholar] [CrossRef]
- Sirmacek, B.; Taubenbock, H.; Reinartz, P.; Ehlers, M. Performance evaluation for 3-D city model generation of six different DSMs from air-and spaceborne sensors. IEEE J. Sel. Top. Appl. Earth Obs. Remote Sens. 2012, 5, 59–70. [Google Scholar] [CrossRef]
- Turlapaty, A.; Gokaraju, B.; Du, Q.; Younan, N.H.; Aanstoos, J.V. A hybrid approach for building extraction from spaceborne multi-angular optical imagery. IEEE J. Sel. Top. Appl. Earth Obs. Remote Sens. 2012, 5, 89–100. [Google Scholar] [CrossRef]
- Licciardi, G.A.; Villa, A.; Dalla Mura, M.; Bruzzone, L.; Chanussot, J.; Benediktsson, J.A. Retrieval of the height of buildings from WorldView-2 multi-angular imagery using attribute filters and geometric invariant moments. IEEE J. Sel. Top. Appl. Earth Obs. Remote Sens. 2012, 5, 71–79. [Google Scholar] [CrossRef]
- Xiao, J.; Gerke, M.; Vosselman, G. Building extraction from oblique airborne imagery based on robust façade detection. ISPRS J. Photogramm. Remote Sens. 2012, 68, 56–68. [Google Scholar] [CrossRef]
- Guida, R.; Iodice, A.; Riccio, D. Height retrieval of isolated buildings from single high-resolution SAR images. IEEE Trans. Geosci. Remote Sens. 2010, 48, 2967–2979. [Google Scholar] [CrossRef]
- Colin-Koeniguer, E.; Trouve, N. Performance of building height estimation using high-resolution PolInSAR images. IEEE Trans. Geosci. Remote Sens. 2014, 52, 5870–5879. [Google Scholar] [CrossRef]
- Liu, W.; Suzuki, K.; Yamazaki, F. Height estimation for high-rise buildings based on InSAR analysis. Urban Remote Sens. Event 2015. [Google Scholar] [CrossRef]
- Wieland, M.; Pittore, M.; Parolai, S.; Zschau, J.; Moldobekov, B.; Begaliev, U. Estimating building inventory for rapid seismic vulnerability assessment: Towards an integrated approach based on multi-source imaging. Soil Dyn. Earthq. Eng. 2012, 36, 70–83. [Google Scholar] [CrossRef]
- Uden, M.; Zipf, A. Open building models: Towards a platform for crowdsourcing virtual 3D cities. In Progress and New Trends in 3D Geoinformation Sciences; Pouliot, J., Daniel, S., Hubert, F., Zamyadi, A., Eds.; Springer: Berlin/Heidelberg, Germany, 2013; pp. 299–314. [Google Scholar]
- Wilson, N.; Thomson, G.; Edwards, R. The potential of Google Street View for studying smokefree signage. Aust. N. Z. J. Public Health 2015, 39, 295–296. [Google Scholar] [CrossRef] [PubMed]
- Balali, V.; Rad, A.A.; Golparvar-Fard, M. Detection, classification, and mapping of US traffic signs using Google Street View images for roadway inventory management. Vis. Eng. 2015, 3, 15. [Google Scholar] [CrossRef]
- Bader, M.D.; Mooney, S.J.; Bennett, B.; Rundle, A.G. The promise, practicalities, and perils of virtually auditing neighborhoods using Google Street View. ANNALS Am. Acad. Political Soc. Sci. 2017, 669, 18–40. [Google Scholar] [CrossRef]
- Li, X.; Zhang, C.; Li, W.; Ricard, R.; Meng, Q.; Zhang, W. Assessing street-level urban greenery using Google Street View and a modified green view index. Urban For. Urban Green. 2015, 14, 675–685. [Google Scholar] [CrossRef]
- Hara, K.; Sun, J.; Moore, R.; Jacobs, D.; Froehlich, J. Tohme: Detecting curb ramps in Google Street View using crowdsourcing, computer vision, and machine learning. In Proceedings of the 27th Annual ACM Symposium on User Interface Software and Technology, Honolulu, HI, USA, 5–8 October 2014; pp. 189–204. [Google Scholar]
- Yin, L.; Cheng, Q.; Shao, Z.; Wang, Z.; Wu, L. ‘Big Data’: Pedestrian Volume Using Google Street View Images. In Seeing Cities through Big Data; Thakuriah, P., Tilahun, N., Zellner, M., Eds.; Springer International Publishing: Cham, Switzerland, 2017; pp. 461–469. [Google Scholar]
- Deus, E.; Silva, J.S.; Catry, F.X.; Rocha, M.; Moreira, F. Google Street View as an alternative method to car surveys in large-scale vegetation assessments. Environ. Monit. Assess. 2015, 188, 560. [Google Scholar] [CrossRef] [PubMed]
- Yuan, J.; Cheriyadat, A.M. Combining maps and street level images for building height and facade estimation. In Proceedings of the 2nd ACM SIGSPATIAL Workshop on Smart Cities and Urban Analytics 2016, Burlingame, CA, USA, 31 October 2016; p. 8. [Google Scholar]
- Majdik, A.L.; Albers-Schoenberg, Y.; Scaramuzza, D. MAV urban localization from Google Street View data. In Proceedings of the P2013 IEEE/RSJ International Conference on Intelligent Robots and Systems, Tokyo, Japan, 3–7 November 2013; pp. 3979–3986. [Google Scholar]
- OpenStreetCam. Available online: http://www.openstreetcam.org/map/ (accessed on 2 February 2017).
- Baidu. Available online: http://map.baidu.com/ (accessed on 2 February 2017).
- Mapillary. Available online: https://www.mapillary.com/ (accessed on 2 February 2017).
- HERE Maps. Available online: https://developer.here.com/ (accessed on 2 February 2017).
- Bing Maps Streetside. Available online: https://www.microsoft.com/maps/streetside.aspx (accessed on 2 February 2017).
- Apple Maps vehicles. Available online: https://maps.apple.com/vehicles/ (accessed on 2 February 2017).
- Google Street View API. Available online: https://developers.google.com/maps/documentation/streetview/ (accessed on 2 February 2017).
- Krizhevsky, A.; Sutskever, I.; Hinton, G.E. Imagenet classification with deep convolutional neural networks. Advances in Neural Information Processing Systems. 2012, pp. 1097–1105. Available online: http://papers.nips.cc/paper/4824-imagenet-classification-with-deep-convolutional-neural-networks.pdf (accessed on 10 May 2017).
- Zeiler, M.D.; Fergus, R. Visualizing and understanding convolutional networks. In Proceedings of the European Conference on Computer Vision, Zurich, Switzerland, 6–12 September 2014; pp. 818–833. [Google Scholar]
- Simonyan, K.; Zisserman, A. Very deep convolutional networks for large-scale image recognition. ArXiv Prepr. 2014. [Google Scholar]
- Szegedy, C.; Liu, W.; Jia, Y.; Sermanet, P.; Reed, S.; Anguelov, D.; Erhan, D.; Vanhoucke, V.; Rabinovich, A. Going deeper with convolutions. In Proceedings of the IEEE Conference on Computer Vision and Pattern Recognition (2015), Boston, MA, USA, 7–12 June 2015; pp. 1–9. [Google Scholar]
- He, K.; Zhang, X.; Ren, S.; Sun, J. Deep residual learning for image recognition. ArXiv Prepr. 2015. [Google Scholar]
- Pan, S.J.; Yang, Q. A survey on transfer learning. Knowledge and Data Engineering. IEEE Trans. Knowl. Data Eng. 2010, 22, 1345–1359. [Google Scholar] [CrossRef]
- Deng, J.; Dong, W.; Socher, R.; Li, L.J.; Li, K.; Li, F.F. Imagenet: A large-scale hierarchical image database. In Proceedings of the Computer Vision and Pattern Recognition, Miami, FL, USA, 20–25 June 2009; pp. 248–255. [Google Scholar]
- Haklay, M.; Weber, P. Openstreetmap: User-generated street maps. IEEE Pervasive Comput. 2008, 7, 12–18. [Google Scholar] [CrossRef]
- Kleist, L.; Thieken, A.H.; Köhler, P.; Müller, M.; Seifert, I.; Borst, D.; Werner, U. Estimation of the regional stock of residential buildings as a basis for a comparative risk assessment in Germany. Nat. Hazards Earth Syst. Sci. 2006, 6, 541–552. [Google Scholar] [CrossRef]
Figure 1.
The general framework proposed in this paper for automatic production of an “exposure proxy” layer. Logos appearing in the figure are copyright of respective sources.
Figure 1.
The general framework proposed in this paper for automatic production of an “exposure proxy” layer. Logos appearing in the figure are copyright of respective sources.

Figure 2.
Convolutional Neural Network named “VGG-16”, partly applied in detecting the number of floors.
Figure 2.
Convolutional Neural Network named “VGG-16”, partly applied in detecting the number of floors.

Figure 3.
Example of images retrieved through the Google Street View API. This image is copyright of Google.
Figure 3.
Example of images retrieved through the Google Street View API. This image is copyright of Google.
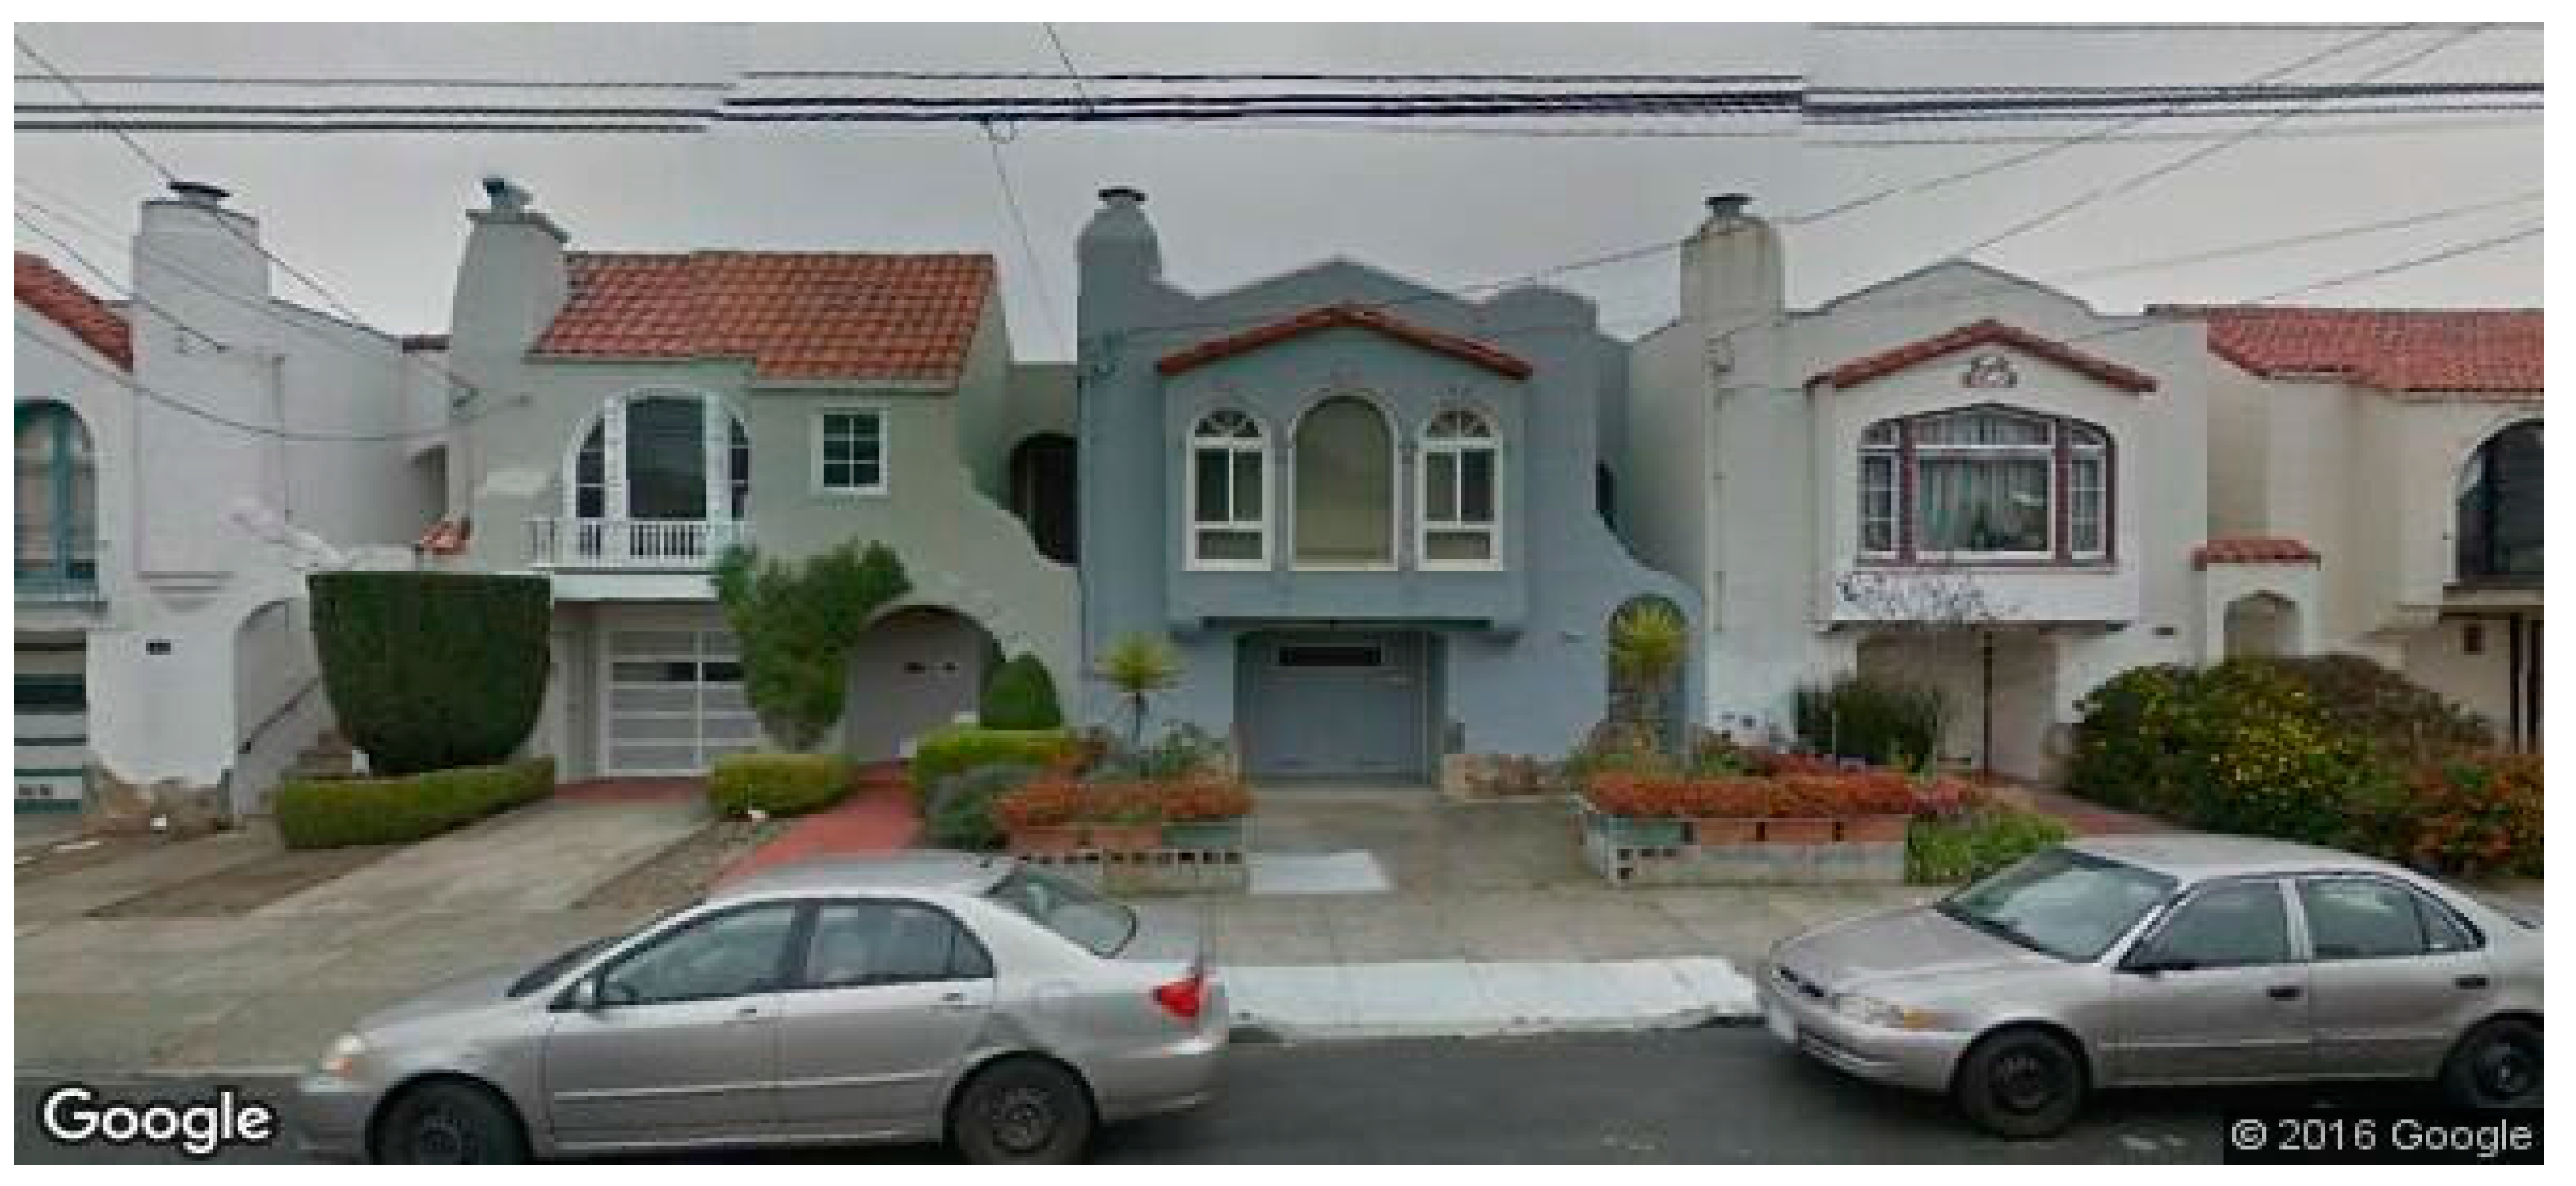
Figure 4.
Example of intermediate output of the CNN. The input image (a) has the dimensions of 224 × 224 × 3 pixels. The first convolutional layer produces a dataset of 64 filtered images (b), each highlighting a specific low-level feature (e.g., lines) from the original image.
Figure 4.
Example of intermediate output of the CNN. The input image (a) has the dimensions of 224 × 224 × 3 pixels. The first convolutional layer produces a dataset of 64 filtered images (b), each highlighting a specific low-level feature (e.g., lines) from the original image.

Figure 5.
Example of the final product obtained using the developed framework. Floor counts are color-coded for each building footprint.
Figure 5.
Example of the final product obtained using the developed framework. Floor counts are color-coded for each building footprint.

Figure 6.
3D model based only on OSM footprints and retrieved number of floors. Basemap: Google Maps.
Figure 6.
3D model based only on OSM footprints and retrieved number of floors. Basemap: Google Maps.


Table 1.
Accuracy assessment of the test case, selecting a sample of 430 classified buildings.
| Classification Result | |||||
|---|---|---|---|---|---|
| 1 | 2 | 3 | 4+ | ||
| Ground Truth | 1 | 60 | 41 | 1 | 0 |
| 2 | 0 | 246 | 16 | 0 | |
| 3 | 0 | 4 | 36 | 0 | |
| 4+ | 0 | 0 | 9 | 17 | |
© 2017 by the authors. Licensee MDPI, Basel, Switzerland. This article is an open access article distributed under the terms and conditions of the Creative Commons Attribution (CC BY) license (http://creativecommons.org/licenses/by/4.0/).
Share and Cite
MDPI and ACS Style
Iannelli, G.C.; Dell’Acqua, F. Extensive Exposure Mapping in Urban Areas through Deep Analysis of Street-Level Pictures for Floor Count Determination. Urban Sci. 2017, 1, 16. https://doi.org/10.3390/urbansci1020016
AMA Style
Iannelli GC, Dell’Acqua F. Extensive Exposure Mapping in Urban Areas through Deep Analysis of Street-Level Pictures for Floor Count Determination. Urban Science. 2017; 1(2):16. https://doi.org/10.3390/urbansci1020016
Chicago/Turabian StyleIannelli, Gianni Cristian, and Fabio Dell’Acqua. 2017. "Extensive Exposure Mapping in Urban Areas through Deep Analysis of Street-Level Pictures for Floor Count Determination" Urban Science 1, no. 2: 16. https://doi.org/10.3390/urbansci1020016